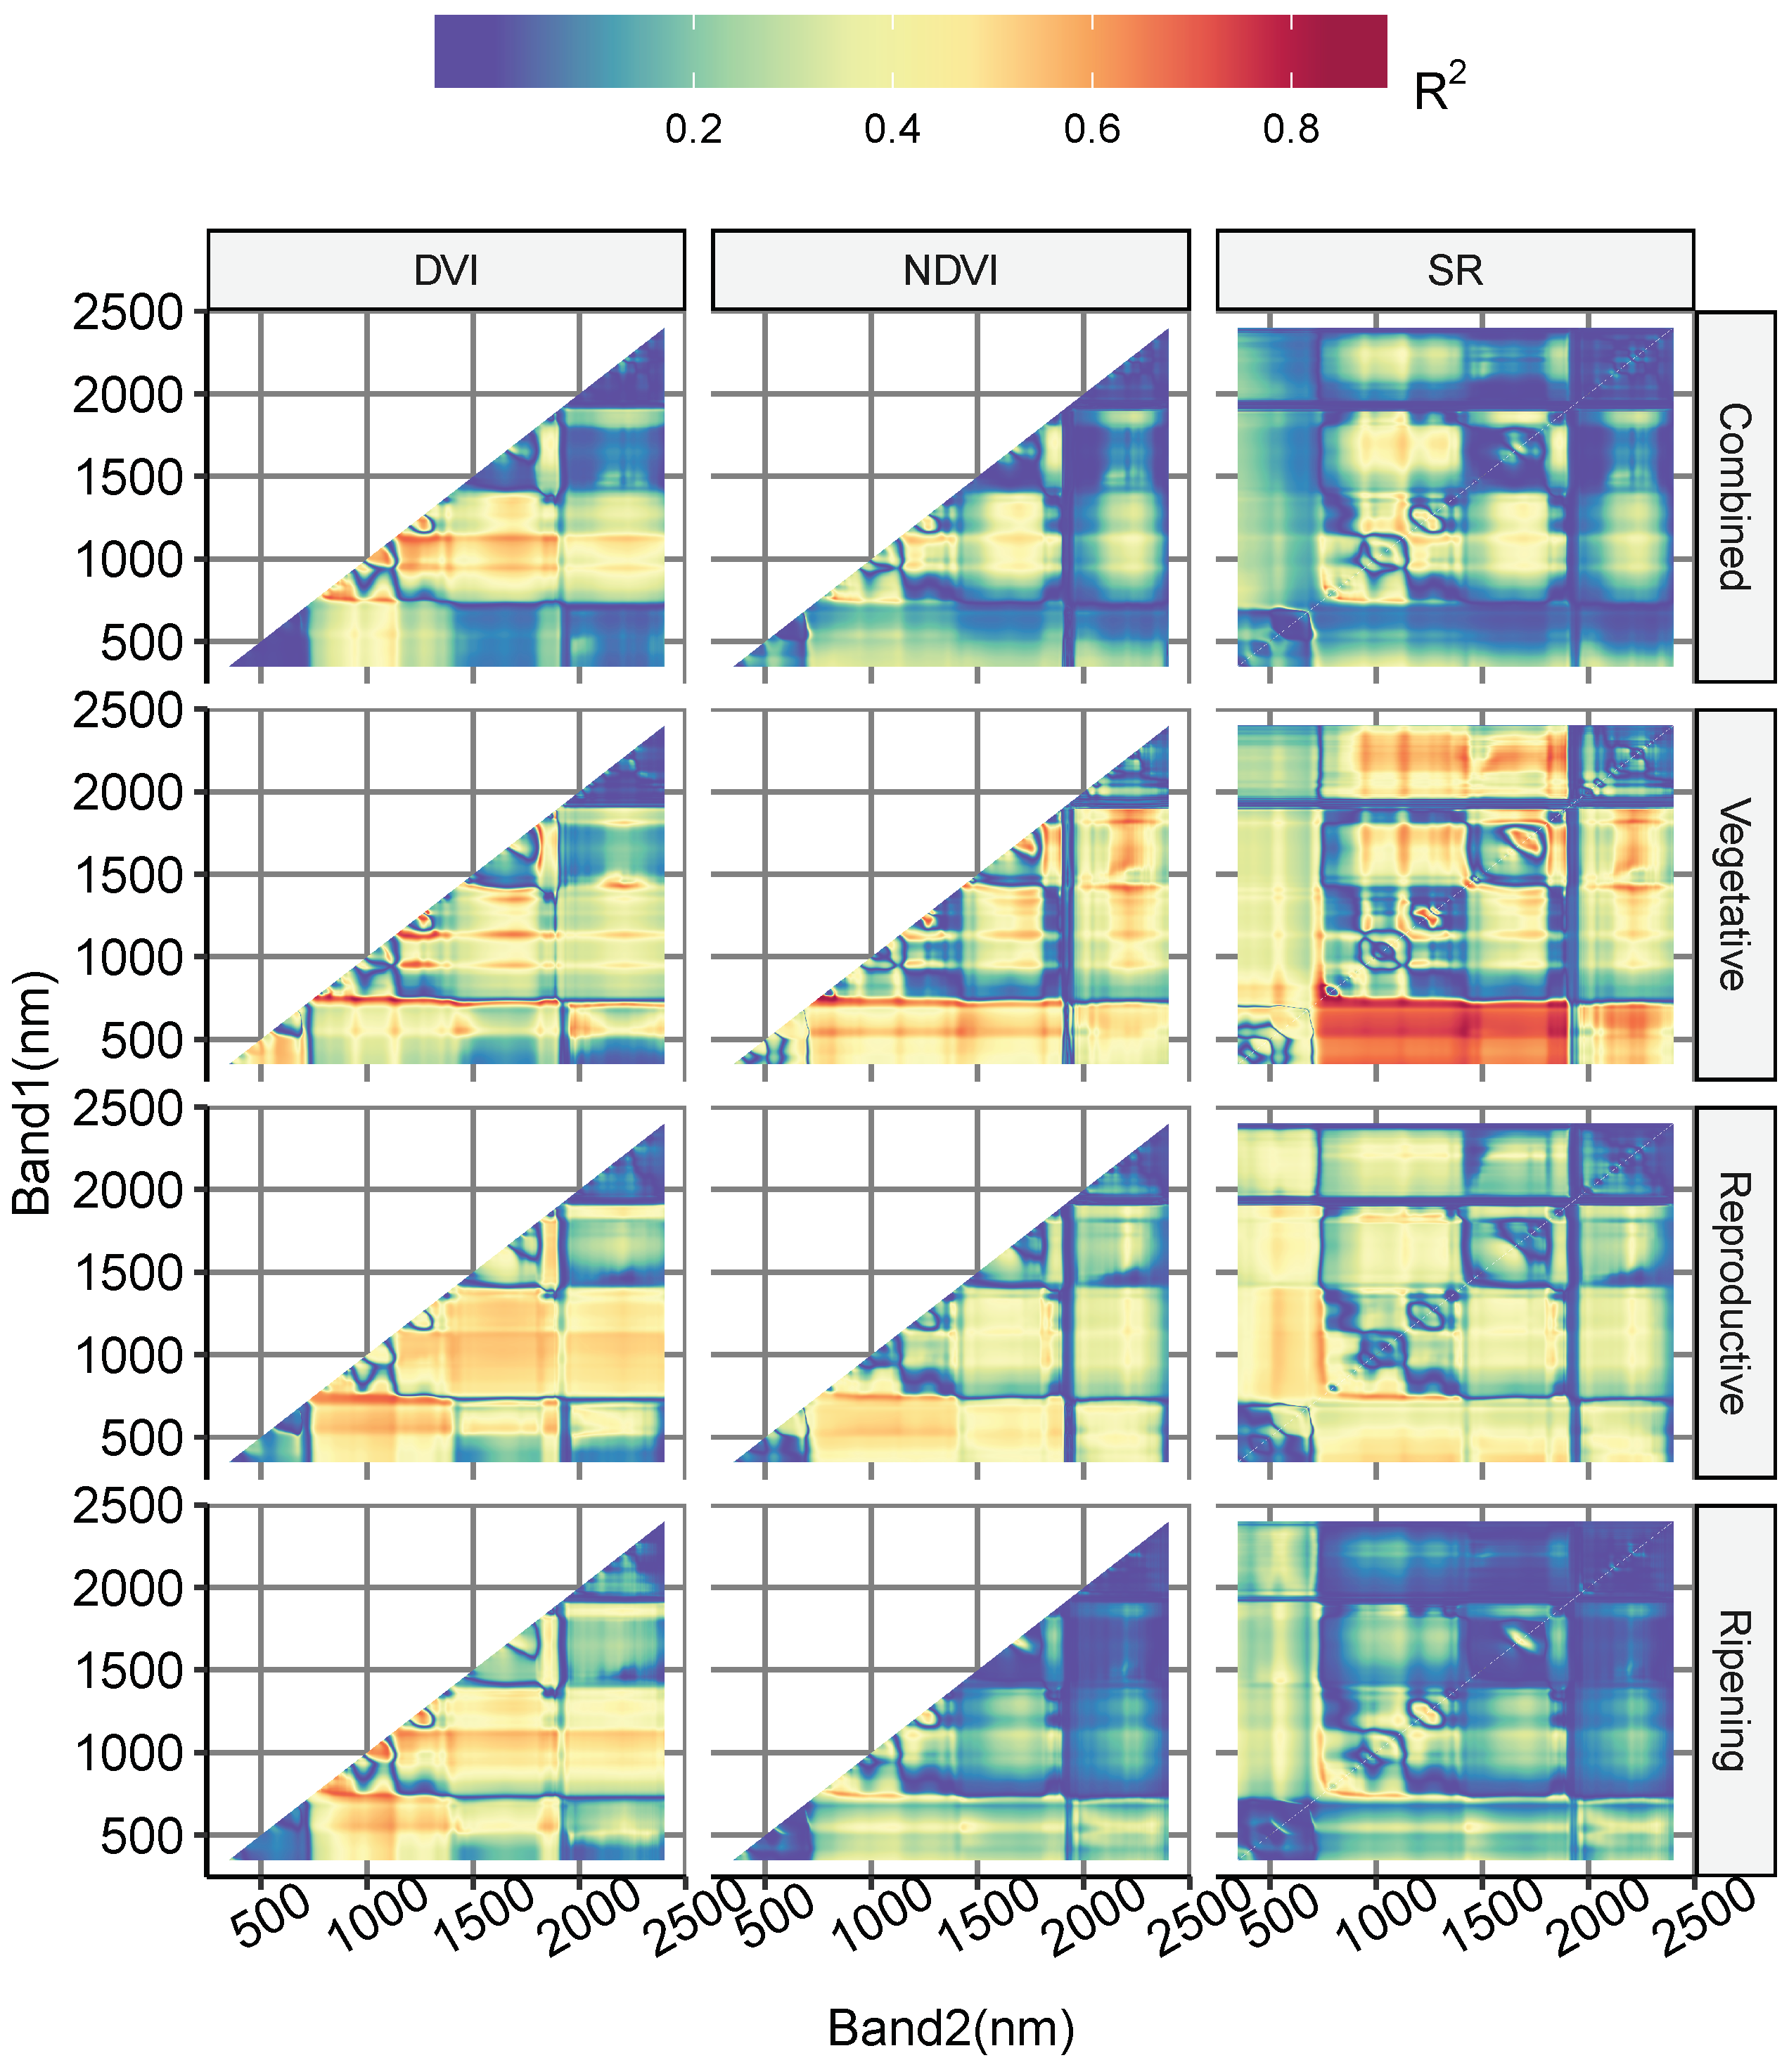
3.2. Vegetation Indices
Figure 3 shows the distribution of the calibration
between LAI and DVI, NDVI as well as SR taking all possible two-band pairs. The band pairs that yielded a higher
were generally with one band in the red-edge region around 750 nm and the other band in the near-infrared (NIR) region, which was around 830 nm for the whole growing season and the vegetative growth stage, around 1130 nm for the reproductive growth stage and around 860 nm for the ripening growth stage. The optimal band pairs for different indices within each specific growth stage and the whole growing season were generally consistent, with slight differences. The band pairs that yielded the highest
are summarized in
Table 4.
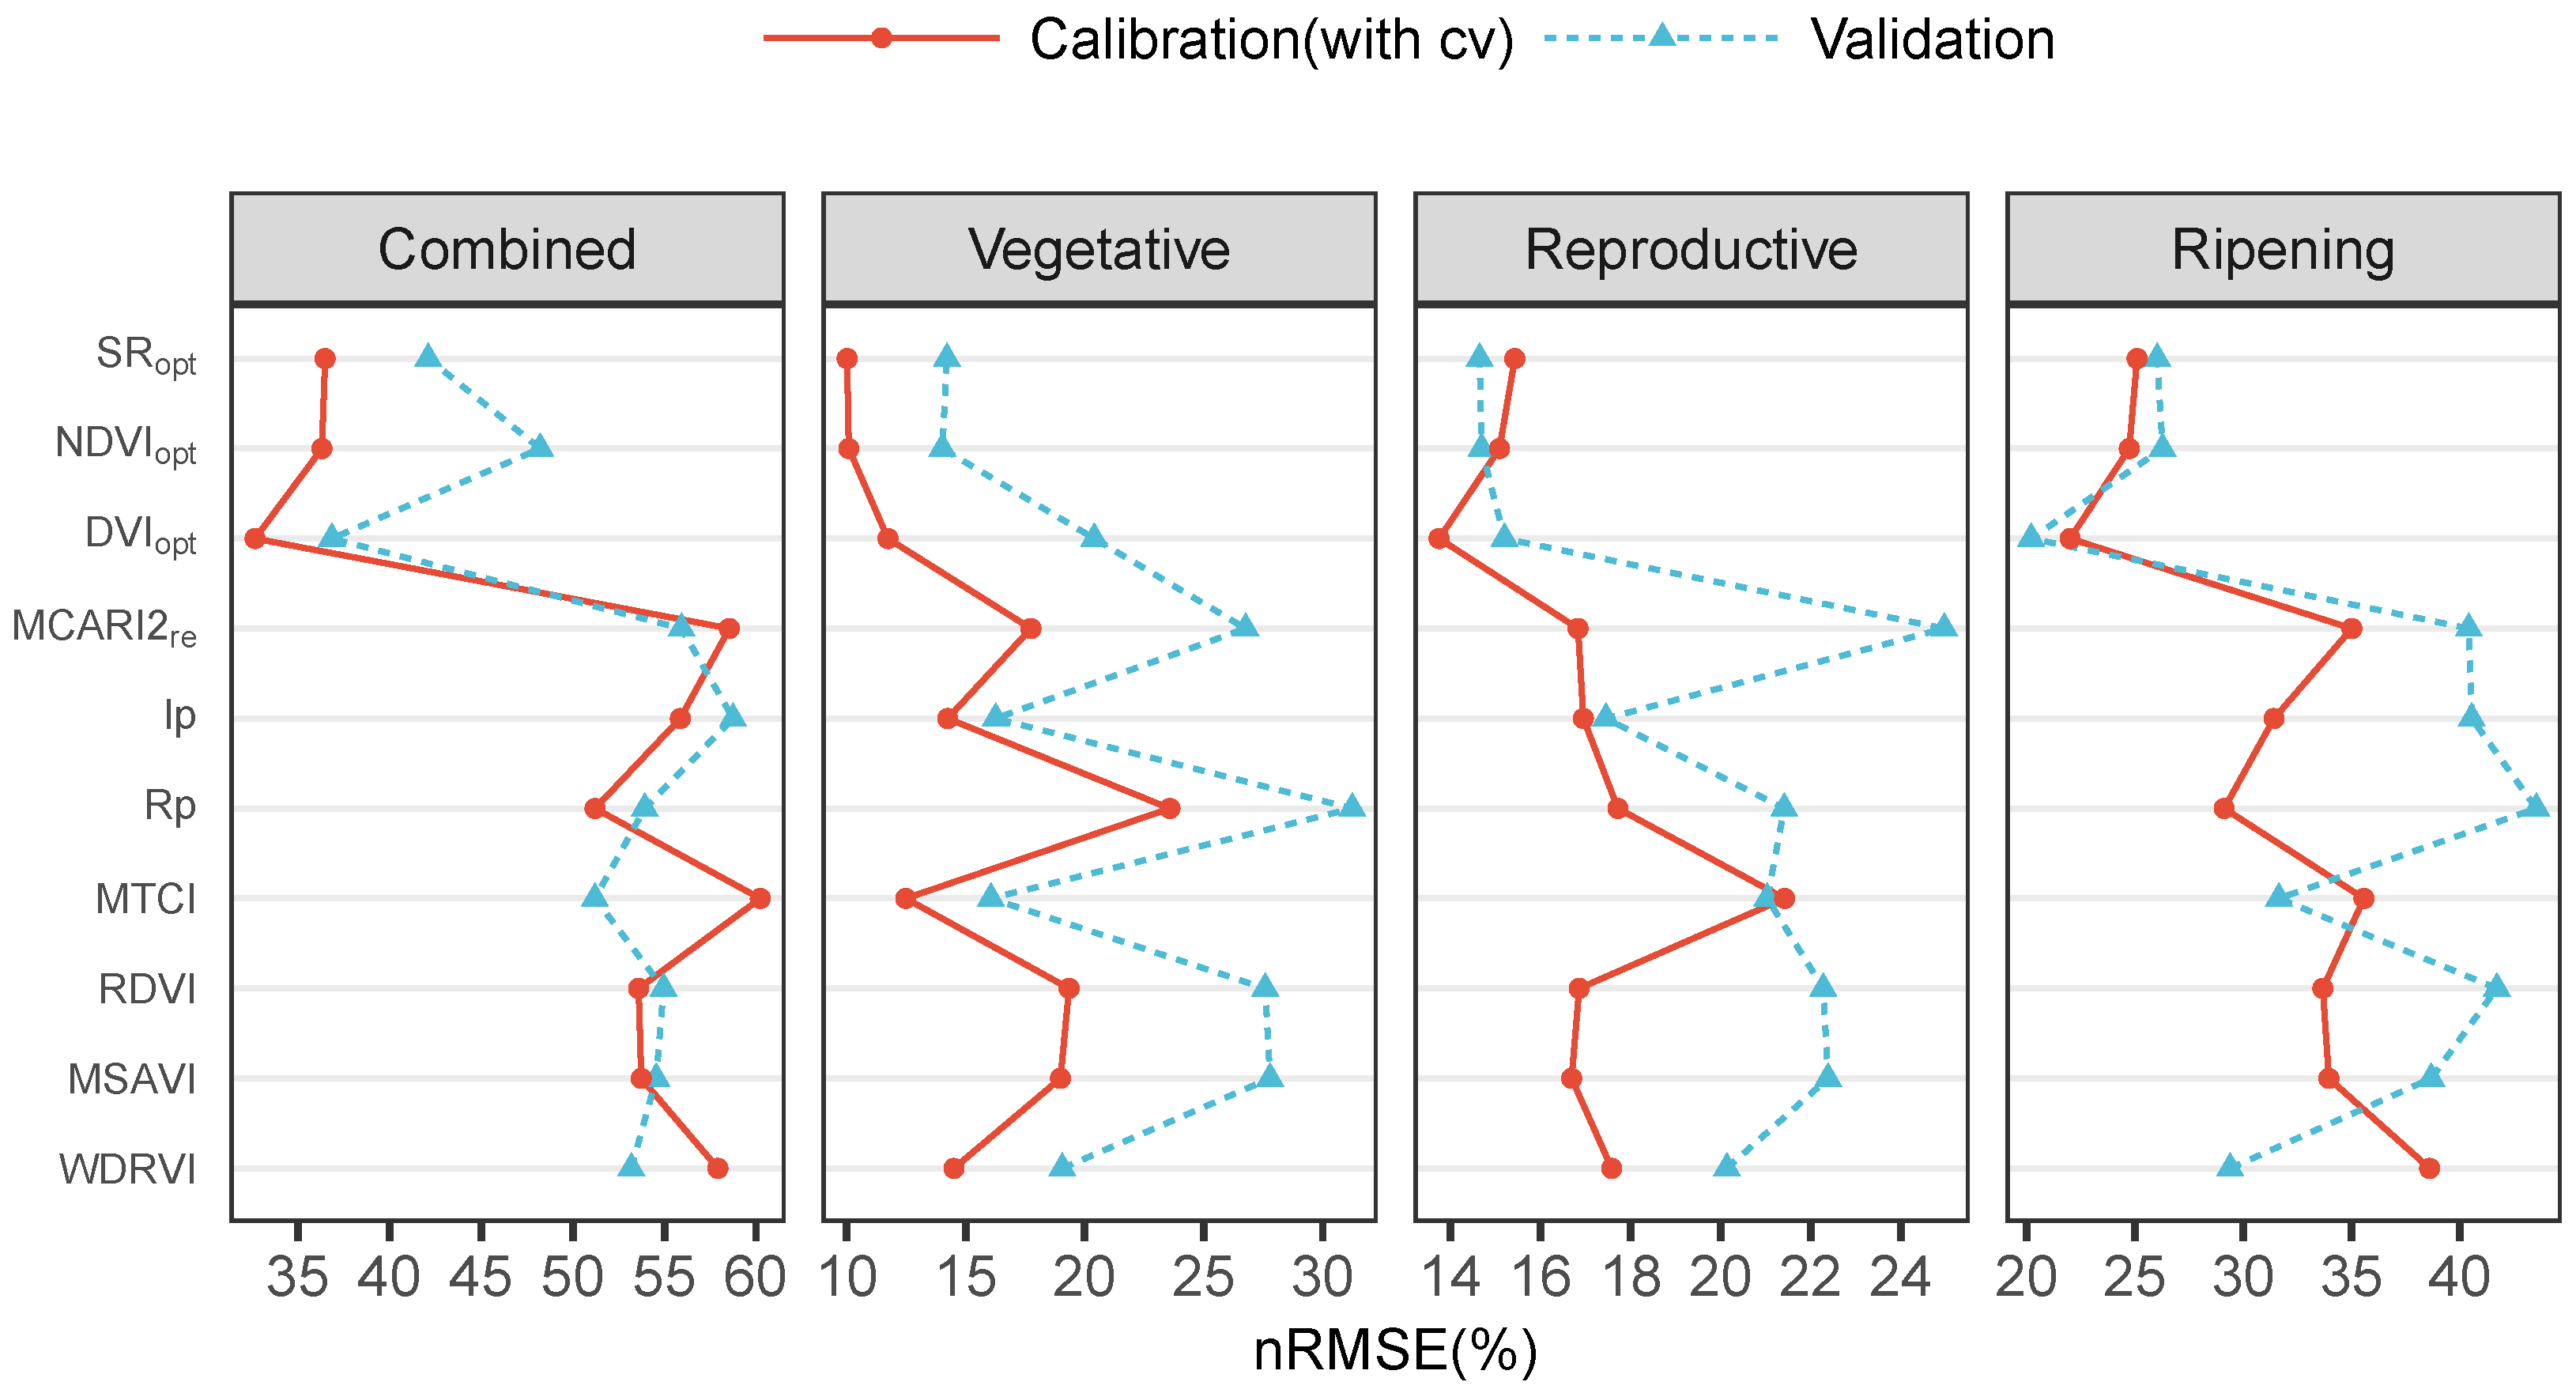
After the optimal band combinations were determined, the corresponding
,
and
and the remaining seven VIs in
Table 2 were used to build LAI estimation models for the whole growing season and for each individual growth stage separately. The calibration (with CV) and validation
of the ten VIs are shown in
Figure 4. The
,
and
all yielded lower
both in model calibration and validation than the remaining seven indices. However, there is one exception that, the
for vegetative growth stage yielded slightly higher validation
. For the whole growing season, the remaining seven VIs yielded
more than 50% in both model calibration and validation, which suggested that these VIs are not suitable to predict paddy rice LAI across growth stages. For the single growth stage, the
and
yielded reasonable accuracy (with
less than 20% both for model calibration and validation) at the vegetative and reproductive growth stages but not at the ripening growth stage. The
yielded reasonable accuracy at the vegetative growth stage but not at reproductive or ripening growth stages. The remaining four VIs (
,
,
, and
) were always exhibited relatively lower accuracy.
The
,
,
and
have the top performance (with lowest or second lowest
both in model calibration and validation) for the whole growing season, vegetative, reproductive, and ripening growth stages, respectively.
Table 5 shows the validation
and
of these four indices. Among them, the
model (for the whole growing season) was validated by each separate growth stage data of the 2017 growing season, and the
,
and
(for vegetative, reproductive and ripening growth stage respectively) models were validated by the corresponding growth stage data of the 2017 growing season.
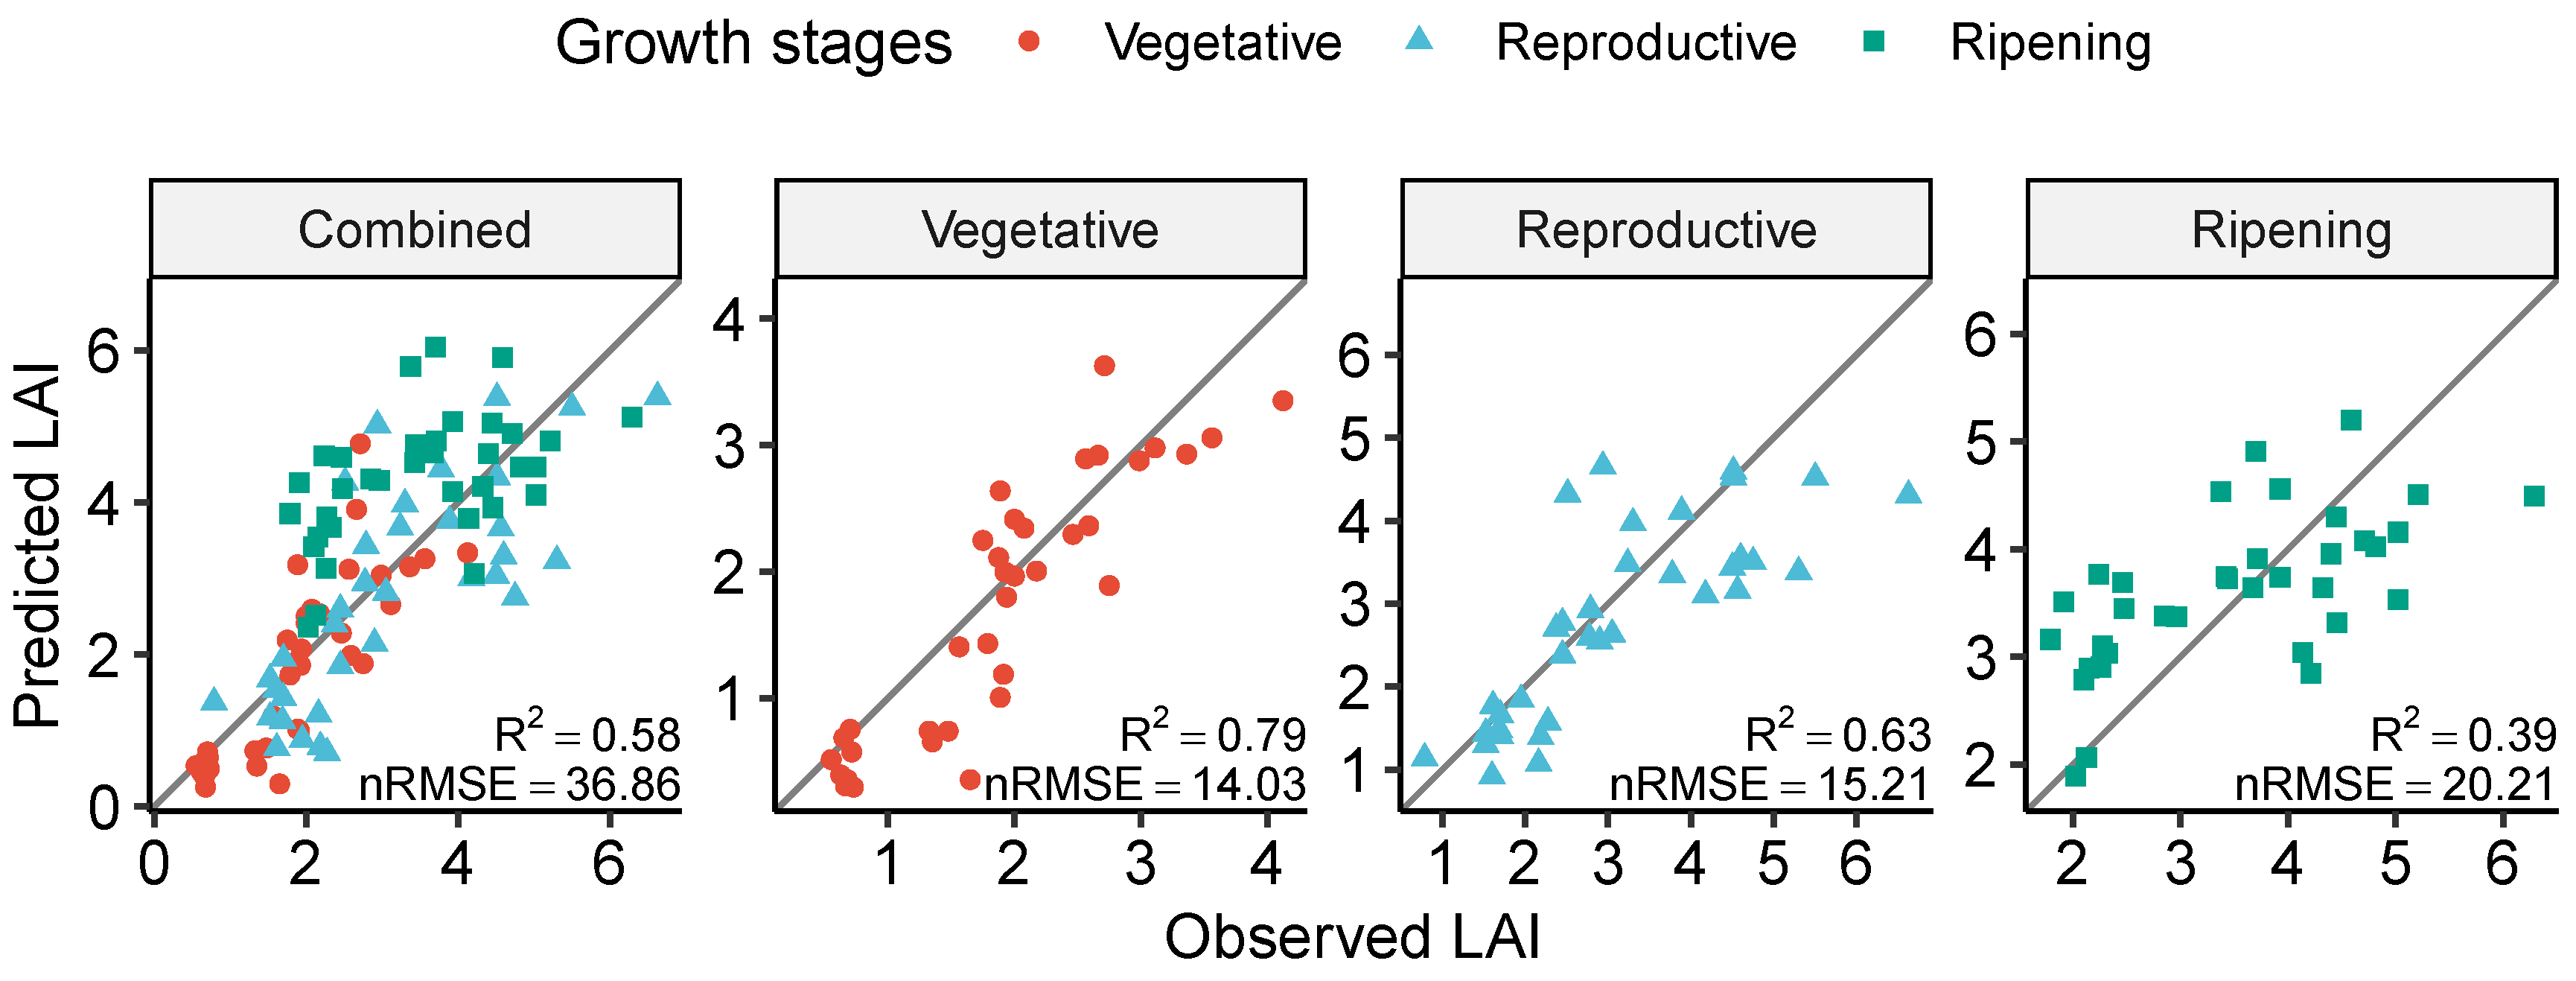
Figure 5 shows the relationships between the observed and predicted LAI along the 1:1 line on the standalone validation dataset of these four top-performing VI models. The single growth stage models yielded
values of 14.00%, 15.20% and 20.20%, as well as
of 0.79, 0.63 and 0.39, for the vegetative, reproductive and ripening growth stages, respectively. The validation
was comparable with the corresponding cross-validated calibration value (
Figure 4). When the whole growing season model was validated on each single growth stage dataset of the growing season, it yielded
values of 18.90%, 17.10% and 29.20%, as well as
of 0.67, 0.59 and 0.24, for the vegetative, reproductive and ripening growth stages, respectively. Comparing the validation
of the single growth stage models and the validation
of the whole growing season model over the corresponding single growth stage data, the decrease ratios were 25.60%, 10.80% and 30.70% for the vegetative, reproductive and ripening growth stages, respectively. For the validation
, these ratios were 16.71%, 6.73% and 61.54%, respectively. This result suggested that, for the VI method, building LAI estimation models on separate growth stages could improve the model performance when compared to building the models on the whole growing season.
3.3. Partial Least Squares Regression and Machine Learning Methods
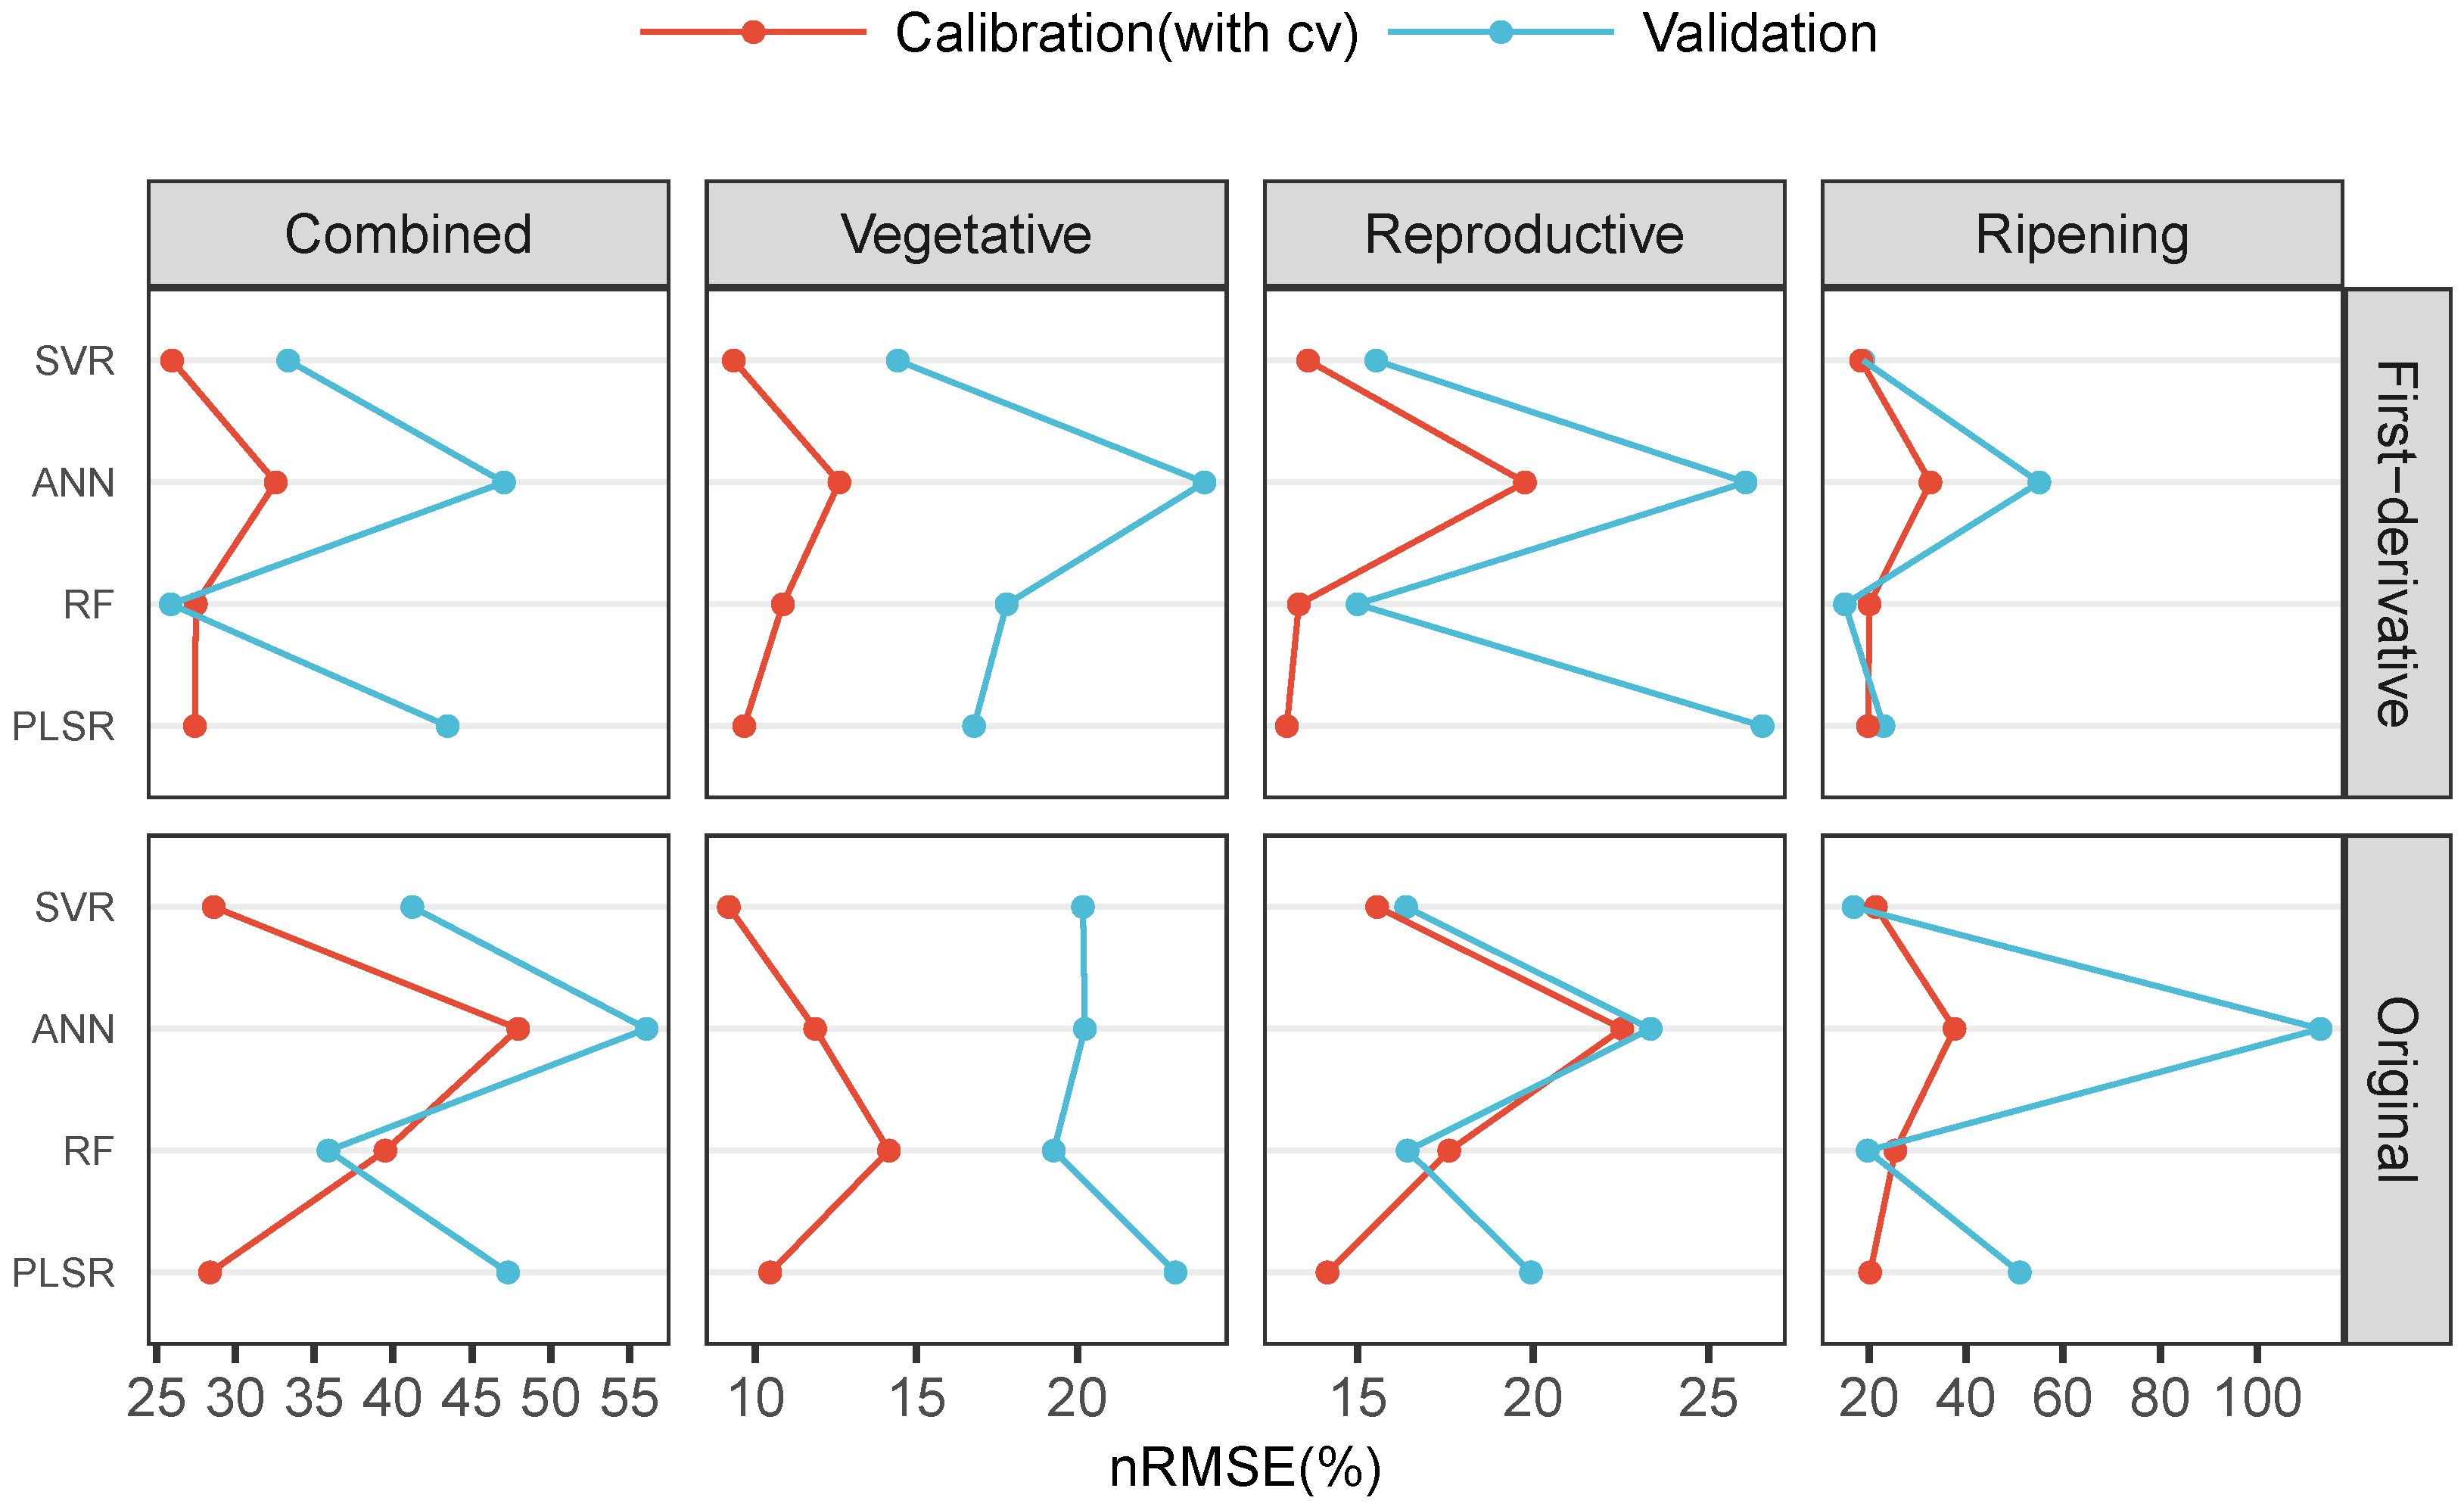
The calibration (with CV) and validation
of PLSR and three machine learning methods—RF, ANN and SVR—on the original spectra and first-derivative spectra for the whole growing season and each single growth stage are shown in
Figure 6. On both original spectra and first-derivative spectra, the SVR and RF methods clearly showed better performance over the PLSR and ANN methods with lower calibration and validation
in most situations. The ANN models had the highest calibration and validation
in most situations, which suggested that the ANN methods are suboptimal for building LAI estimation models. The PLSR models showed almost identical calibration
with the corresponding SVR models, but they yielded relatively lower validation
compared with the corresponding SVR models. This result suggested that the PLSR models were also not robust enough. Thus, the ANN and PLSR methods were not considered for further analysis.
When built on the first-derivative spectra rather than original spectra, the SVR and RF models all showed a decrease in validation for the whole growing season and for each single growth stage. However, there was one exception of the SVR model at the ripening growth stage. The decrease ratios were 27.86%, 7.60%, 8.67% and 23.93% for the RF method of the whole growing season, vegetative, reproductive and ripening growth stages, respectively. For the SVR method, the corresponding decrease ratios were 19.11%, 28.51%, 5.19% and −11.99%, respectively. This result suggested that the first-derivative spectra have an advantage over the original spectra for building LAI estimation models.
Therefore, the RF and SVR methods on first-derivative spectra are more suitable for building LAI estimation models.
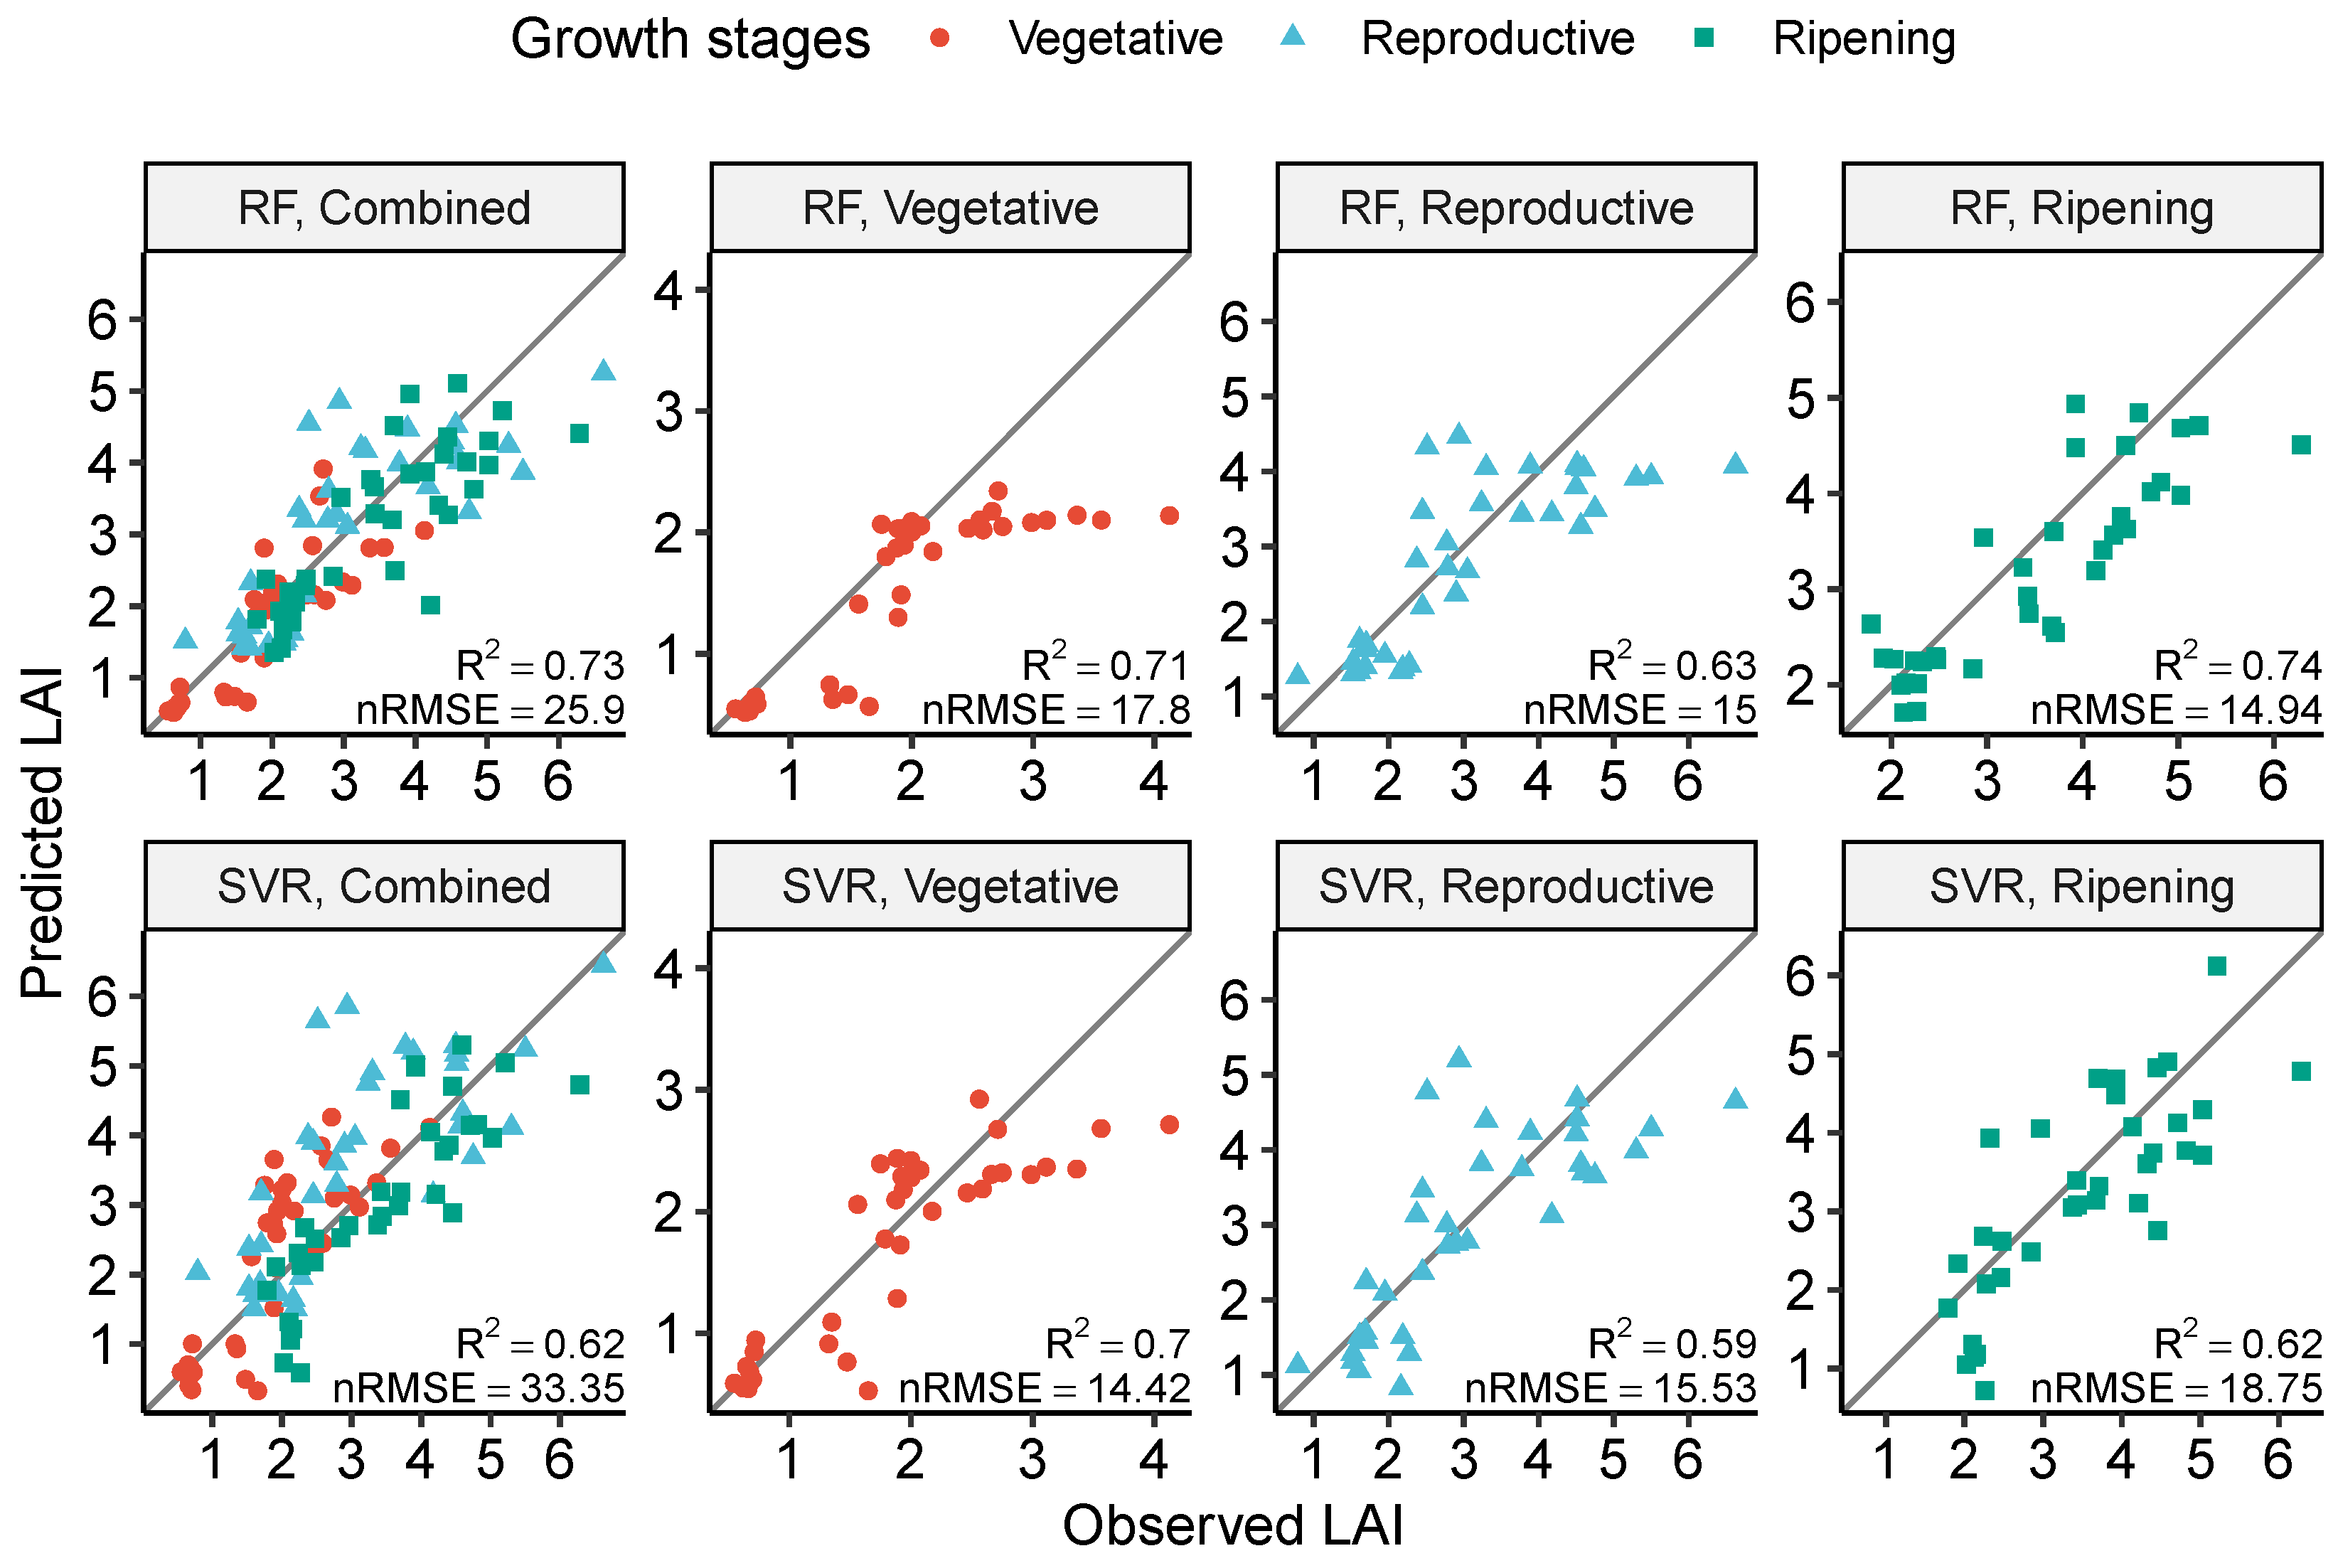
Table 6 shows the validation results of the RF and SVR models on first-derivative spectra (RF-D1, SVR-D1). Among them, the RF-D1 and SVR-D1 models of the whole growing season (RF-D1-EN, SVR-D1-EN) were validated on each separate growth stage data of the 2017 growing season, while the RF-D1 and SVR-D1 models of each single growth stage were validated on the corresponding growth stage data of the 2017 growing season.
Figure 7 shows the relationships between the observed and predicted LAI along the 1:1 line on the standalone validation dataset of these models.
The RF-D1-VE (single growth stage RF-D1 model of vegetative growth stage) yielded validation and of 17.80% and 0.71. The RF-D1-RP and RF-D1-RI (single growth stage RF-D1 models of reproductive and ripening growth stages, respectively) models yielded validation of 15.00% and 14.90%, as well as validation of 0.63 and 0.74, respectively. When validated on each separate single growth data of the year 2017, the RF-D1-EN model yielded and of 14.90% and 0.71 for the vegetative growth stage, 14.10% and 0.64 for the reproductive growth stage, as well as 17.20% and 0.67 for the ripening growth stage, respectively. When compared to the single growth stage specific validation of the RF-D1-EN model, the of the single growth stage models (RF-D1-VE, RF-D1-RP and RF-D1-RI ) showed decrease ratios of −19.52%, −6.43% and 13.29% for the vegetative, reproductive and ripening growth stages, respectively. The increase ratios of the validation were −1.13%, −2.88% and 10.78% for the vegetative, reproductive and ripening growth stages, respectively. This result indicates that building RF-method-based LAI estimation models over a single growth stage rather than the whole growing season would increase the estimation accuracy for the ripening growth stage but decrease the estimation accuracy for the vegetative and red-edge growth stages.
The SVR-D1-VE, SVR-D1-RP and SVR-D1-RI models yielded validation of 14.40%, 15.50% and 18.80%, respectively, as well as validation of 0.70, 0.59 and 0.62, respectively. When validated on each separate single growth data of 2017 growing season, the SVR-D1-EN model yielded and of 22.10% and 0.70 for the vegetative growth stage, 19.70% and 0.55 for the reproductive growth stage, as well as 17.80% and 0.71 for the ripening growth stage, respectively. When compared to the single growth stage specific validation of the SVR-RF-EN model, the of the single growth stage models (SVR-D1-VE, SVR-D1-RP and SVR-D1-RI) showed decrease ratios of 34.66%, 21.18% and −5.58% for the vegetative, reproductive and ripening growth stages, respectively. The increase ratios of the validation were 1.03%, 8.09% and −12.47% for the vegetative, reproductive and ripening growth stages, respectively. This result indicates that building an SVR based LAI estimation model over a single growth stage rather than over the whole growing season would increase the estimation accuracy for the vegetative and reproductive growth stages but decrease the estimation accuracy for the ripening growth stage.
Considering the validation accuracy of the top performance VI models, RF and SVR models (
Table 5 and
Table 6) together, the
provided the best paddy rice LAI estimation accuracy for the vegetative growth stage, and the RF-D1-RI model provided the best paddy rice LAI estimation accuracy for the ripening growth stage. No whole growing season models or other single growth stage models could provide better accuracy for these two growth stages. For the reproductive growth stage, the single growth VI model of
, the RF-D1-RP model and the RF-D1-EN model all provided comparable accuracy. Thus, single growth stage models are recommended to build LAI estimation models. The VI model of
and RF-D1-RI model are best options for vegetative and ripening growth stages, respectively. Considering the low computational cost of the VI method, the VI model of
is the best option for reproductive growth stage.


