1. Introduction
Land-use/land cover (LULC) change has become a central component in the literature comprising the topics of global/regional change and sustainable development issues [
1]. There is vast literature covering the issues of spatio-temporal dynamics and driving the forces of land-use change worldwide [
2,
3,
4,
5,
6,
7]. Anthropogenic factors comprising demographic, socio-economic and political processes (
Figure 1) are the main forces leading to land-use change at the global scale [
8,
9,
10]. However, regional inequalities exist, and have become ever larger, due to increasing socio-economic growth and urbanization process [
5]. Regional comparative studies covering land-use change and pattern, driving forces, and consequences of land-use change would contribute to international literature on spatio-temporal evolution of land uses [
5].
Land-use/cover change literature demonstrates that the dynamics of land use as a consequence of urban expansion shows variability over time and across space [
11,
12,
13]. Some regions experience urban growth, while others are characterized with the biggest losses of population [
14,
15]. Urban growth and decline can be observed in various regions having different socio-economic and physical conditions, as well as different hierarchical levels [
16]. Regions with a strong urban core are likely to experience different urban development processes in comparison to peri-urban regions, which may also show diverse characteristics compared to predominantly rural areas, as the latter are weakly connected to central cities and urban regions [
17]. In fact, it is difficult to examine urban and rural geographies separately, considering that the boundaries of urban and rural land are intertwined, but instead these can be considered as interrelated geographies, composed of mixed areas ranging from more densely developed, to disperse zones and isolated towns [
18,
19]. In most countries, urban cores have lost their significance, and there is no longer a clear cut in the administrative structure between the urban core and the countryside. The rural geographies are urbanized through the transformations of production and commodity relations, and rural areas are increasingly based on mass consumption, regardless of the locational differences [
19,
20]. The peri-urban areas, on the other hand, are dynamic transition zones between the densely populated urban core and the rural hinterland. Peri-urban areas can be characterized by different spatial structure and the density of different urban and rural land-use functions [
19]. Because of the differences in spatial development observed in different urban-rural hierarchical levels, in this study, we focus on the analysis of urban and non-urban land-use development trends regarding the urban, peri-urban and rural regions of Turkey.
In order to sustain development for both urban and rural areas and their ecosystems, there is a growing need for sustainable management of resources and the infrastructure needs of urban, peri-urban and rural regions. Therefore, regional and local studies focusing on land-use change [
21,
22,
23], spatial configuration and pattern [
24,
25], driving forces and consequences of land-use change [
26,
27,
28,
29], are increasingly needed in the LULC literature. Most studies related to LULC change patterns have focused on the analysis of urban and/or non-urban land-use changes for the local areas, regions or different countries [
16,
30,
31].
More specifically, the literature on LULC change typologies includes the studies of agricultural land [
28,
32], urbanization [
33,
34] and forestland uses [
35,
36]. Among the few studies that consider the urban-rural interface, there are examples of studies on patterns of land use and land-use change in peri-urban regions [
13,
37], and studies researching the typologies of LULC change concerning both urban-rural and peri-urban areas at local and regional scales [
38,
39].
Over the past several decades, Turkey has experienced considerable population growth, as well as rapid economic development, and along with its continuous urbanization and population increase, Turkey has been undergoing an increasingly significant LULC change. Considering the sustainability impacts of rapid urban development upon the environment and society, examination of LULC change dynamics is vital for Turkey. In the literature, the vast majority of studies focusing on LULC change dynamics have been undertaken for Far East countries, particularly China [
30,
40], for the European countries [
17,
24], African countries [
12,
13,
41] and the US [
42,
43]. Unfortunately, much less is known of countries such as Turkey, which is considered to be one of the fastest growing economies in Europe, and internationally. There is wealth of literature focusing on urban expansion dynamics in Turkey, but this literature is either focusing on various cities or regions at the local level, including Adana, Samsun, Kemer and Istanbul [
44,
45,
46,
47], or examining the urban expansion process from the perspective of legislative and policy frameworks [
48,
49].
In this study, we quantified and compared the spatio-temporal changes of urban and non-urban land uses in Turkey, disaggregating these changes into a number of specified regions and different hierarchical levels (urban, peri-urban and rural areas), over the past decades covering four periods (i.e., 1990, 2000, 2006, 2012), using spatially high resolution data of Corine Land Cover (CLC) that we had obtained from the European Environment Agency. We note that European Environment Agency (EEA) [
50] has recently released the CLC data of 2018, covering all European countries. However, CLC 2018 data for Turkey has not been developed and included in the EEA [
50] database yet; and for this reason, we did not conduct analysis for 2018, due to these data availability issues. The objectives of this study were to (i) dynamically map extents of urban land, and analyze current and past trends of land-use change, (ii) quantify spatio-temporal patterns of land-use change at the regional and specified urban-rural hierarchy-related levels comprising 81 regions of Turkey, (iii) then analyze the impact of socio-economic and regional characteristics on urban and non-urban land development across different regions and different hierarchical levels.
4. Results
4.1. Quantitative and Structural Changes
The land-use changes during the study period are presented in
Figure 6, and the statistics are summarized in
Table 1.
From
Table 1, the largest changes are associated with the industrial/commercial land that is followed by recreation and discontinuous urban fabric. The most prominent land use changes are observed for the 1990–2000 period regarding all specified land use classes. During this period, Turkey had experienced a major economic crisis in 1994, and has had to cope with socio-economic and physical influences caused by the devastative Marmara Earthquake in 1999. It is evident from
Table 1 that the economic crisis and the earthquake have had minor impacts on the urban land markets, given the high growth rates of urban land use, particularly observed for industrial and commercial developments. By contrast, the 2001 economic crisis had more sound impacts on the land markets, given the lower rates of growth of both residential and industrial/commercial land uses. Following the 2001 economic decline, the annual growth rate reduced from 5.5% in 2002–2007 to 1.9% in the post-2007 period [
68].
Table 2 presents general trends for land use, population, employment and Gross Domestic Product (GDP) distribution according to different hierarchical levels in the study period. During the 1990–2012 period, Turkey’s population grew by 33.8%, while urban fabric increased by 18.3%. In the same period, population growth rates are higher than the urban fabric growth concerning both urban and peri-urban areas, whereas the urban fabric growth rate is higher than that of population regarding the rural areas. This points to densification of residential land in the former case, and expansion and low-density development in the latter. Increasing densities encourage savings in public service provision costs, such as electricity distribution, school transportation and water/waste water utilities [
16,
90]. Decreasing densities, on the other hand, result in higher public service provision costs, longer commuting distances, increase in private vehicle use, less access to public transportation, increasing air/water pollution, traffic accidents and overexploitation of natural resources [
16,
91].
Following Angel et al. [
82], a picture of density changes for different regions in Turkey to do with the two periods i.e., 1990–2006 and 2007–2017, is provided in
Figure 7. Using Angel et al.’s [
82] approach, we plot the population density of built-up areas for one period against the density in another period.
Figure 7 displays the changes of population densities, where on the diagonal line the density in two periods is equal. From
Figure 7a, there are declining densities in the northern, north-western and eastern regions between 1990 and 2006, as urban land area expands faster than the population growth. In the 2007–2017 period, this trend is reversed, as population growth leads to concentration and densification in almost all regions (
Figure 7b). In both periods, the highest densities are observed in southern and north-western regions, where Istanbul, Kocaeli and Izmir are the first ranking three cities accounting for the highest densities in the Country. Analysis of land use/cover data shows that the built-up area increased in the period between 1990 and 2012 by 63.6% and 65.8%, pointing to Istanbul and Izmir, respectively. During this period of urban growth, planning and decision making authorities had to cope with physical and social infrastructure problems and also had to deal with the issue of illegal and irregular development, that is a significant problem for both of the cities. Other problems may include price increases for housing, rising infrastructure costs, pollution, environmental degradation and related health problems.
An in-depth analysis of the economic output for the year 2012 indicates that the highest regional GDP, population (density), industrial employment and the share of industrial employment in total employment, is observed in the north-west region, followed by the south and west regions, both with a GDP of around one forth, and an industrial employment of one third, of the north-west region, followed by the north and finally the east region, with the lowest values (see
Table S1). A reverse trend is observed regarding the share of agricultural GDP in total. These findings are in line with the literature pointing to significant differences in terms of socio-economic development levels particularly between eastern and western regions in Turkey [
66,
67,
92]. It is asserted in the literature that the less-developed eastern region is mostly specialized in agricultural production, while west and north-western regions are based on industrial production and services supply [
93]. The southern and western regions mostly benefit from service-based tourism activities, as well as other activities in services and finance sectors [
68]. In Turkey, 80 percent of high-tech firms are being concentrated in metropolitan regions, in major cities, and additionally in a few important centers, and manufacturing is concentrated mainly in the three largest cities, particularly in Istanbul, which accounts for 40% of total employment [
93]. High-tech firms prefer locating in large metropolitan regions in the north-west and west regions where there is an existing concentration of industrial activities. The spatial distribution of industrial activities has enhanced development disparities in the east-west direction. Recent literature on the spatial distribution of manufacturing industries showed that there is persisting spatial heterogeneity in the distribution of industrial enterprises, leaving east regions well behind their western counterparts in the last decades [
68,
69,
94].
4.2. Regional Differences in Urban, Peri-Urban and Rural Ddevelopment
The regional analysis of the land use changes in the 1990–2012 period shows differences among regions and different urban hierarchical levels (see
Figure A2).
Table 3,
Table 4 and
Table 5 show population and land use dynamics across five regions covering the specified seven land use/cover classes. The largest increase in population is observed in the north-west region during the study period. The northern region is the only area that lost population in the 1990–2000 and 2006–2012 periods. During these periods, there is an increase in discontinuous urban fabric, though at moderate levels, most probably pointing to development of low-density sprawl-like settlements under conditions of shrinkage in the northern region. The growth of discontinuous urban fabric ranges between 7.26% and 26.9% in the 1990–2000 period, the north-western region indicating the highest percentage change, while the northern region showed the lowest percentage change (see
Figure A3 in
Appendix A). In the post-2000 period, a similar trend is observed across all regions. Regarding industrial/commercial land development, the north-west region accounts for the largest increases in the 1990–2000 period. Other regions show much lower rates of industrial/commercial development, in decreasing order the west, south, east and north (
Figure A3).
In the post-2006 period, there are similar changes of industrial/commercial development across all regions. There is loss in agricultural land that is common to all regions, the north-western region indicating the highest percentage of loss that is followed by the west, south and north regions. Conversely, forestland is increasing in the 1990–2000 period, while it is decreasing in south, west and north regions in the post-2000s. Natural vegetation is generally decreasing with the highest percentage change observed in the north-west, while the smallest changes are reported in the south and west regions.
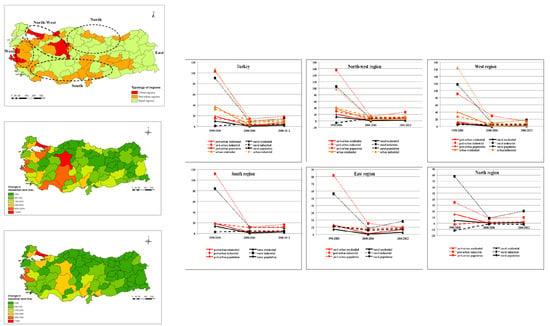
Figure 8 shows residential and industrial development dynamics, together with the population growth rates for the whole country and for the regions. The residential land growth for the period 1990–2000 ranges between 13% and 20% for the peri-urban areas, and between 5% and 13% for the rural areas. In relation to west and north-west regions, in the urban areas, the growth of residential land is more than 37%. In the post-2000s, the growth rate of residential land declines to a minimum of 0.013%, and to a maximum of 7% in the peri-urban areas, where the former is located in west region and the latter in east region. At the national level, urban areas develop faster than peri-urban and rural areas. The disaggregation of the data into regions indicates that this national trend results from the dominance of trends observed in north-west and west regions. The spatial distribution of residential development in north-west and west regions is different from other areas, considering that the three biggest cities of Turkey i.e., Istanbul, Ankara and Izmir, are located in these two regions. These cities are characterized by much stronger urbanization and irregular urban development processes starting from early 1950s. The urban and peri-urban areas in the other regions have experienced much lower rates of urban development, in decreasing order, the south, north and the east region.
The industrial developments are sound in the 1990–2000 period in peri-urban regions, with the highest growth observed in the north-west region of 157%, and the lowest growth is 35% in the north region. In the west and north regions, the industrial growth rates are higher in the rural regions compared to peri-urban areas. The former has a growth rate of 117%, while the latter 78%.
In the 2000–2006 period, the industrial growth rates declined to a minimum of 8% in both north-west and west regions. The reason for declining industrial and residential development in the post-2000 period is the financial outburst of the early 2000s. During the recovery period of 2006–2012, industrial growth rates increased, ranging between 9% in the north and 27% in the north-west.
The population grew in all regions during the study period. In the north, east, and south regions, the peri-urban population grew faster than the rural population. The north-west and west regions had experienced higher growth rates of urban population compared to those observed for peri-urban and rural areas. In these two regions, the peri-urban population has higher growth rates than the rural population. Overall, the urban population growth rate is the highest in the north-west region compared to all other regions. The north region is the only region where its rural population is declining continuously, and the region lost peri-urban population during the period 1990–2000.
4.3. Possible Drivers of Regional Land Development
The details of the socio-economic and land use data that were used in the regression analysis are provided in
Table 6. All the variables in
Table 6 were used in the regressions except those indicating high correlations with the other variables used in the models. The results in
Table 7 present the estimated coefficients of the logarithmic models where the coefficients express elasticities: They indicate the percentage change in land cover of a given percentage change in the independent variable. The R-square values indicate that industrial/commercial land cover dynamics can be relatively explained well by the independent variables.
The positive coefficient of population in Model 1 (
Table 7) indicates that more people living in urban areas can be expected to have large amounts of residential land development. The negative and insignificant coefficient of household size in Model 1 implies that residential land expansion is associated with smaller household sizes.
The coefficient of Log(gdp) is positive and significant, indicating that regions with higher income can be expected to have more residential land cover, compared to regions with lower income. The areas of airport and recreational uses show the expected positive correlations with residential land development. The airport variable is positive in all models except Model 5. According to this finding, the growth of forest land in Model 5 is negatively associated with the size of airport. The port variable, on the other hand, is positively related with recreational and forest land development, while it has an unexpected negative relationship with industrial and agricultural land developments. This finding indicates that industrial land developments take place in inland areas or in the coastal cities which do not have a port. The cities having an airport are positively related to recreational and forest land developments, as can be observed in
Table 7.
In contrast to expectations, the area of protected sites is positively related to dependent variables in all models except Model 3. The larger the areas of protected sites in a region, the more likely it is to have an urban/rural expansion. The areas of protected sites are also positively associated with agricultural and forest land expansion. This finding may imply that there is plenty of available land in these regions and the protected sites do not pose a restriction upon urban development. An alternative explanation is the existence of a possible correlation between the areas of protected sites and other explanatory variables included in the regressions. This may be the reason for the insignificant coefficients and unexpected positive signs estimated for the variable Log (protect_sites). The coefficient of Log (avail_land) is positive and significant: Regions with higher amounts of available land are expected to have more residential land development compared to regions with a lower amount of available land. The coefficient of Log (avail_land) in the first three models varies between 0.20 and 1.16. An increase of 10% in available land is associated with a 2% increase in residential land in the former case, and an 11.6% increase in recreational land in the latter. The positive sign of development index related to residential, industrial and recreational development indicates that the higher the development level of a region, the higher the growth of urban land use.
In comparison to urban regions, the cities located in peri-urban and rural regions show negative relationship with residential and industrial land developments. By contrast, these regions show positive relationships regarding recreational, agricultural and forest land developments. The cities in the north-west region are positively related to the growth of residential and industrial land. The south and west regions show positive relationship with the recreational and forest land expansions. The north region is the only region that is positively associated with agricultural land expansion. Except for the south region, there is forest land expansion in all regions, where the west and north regions have the highest elasticities of change regarding their forestland.
In Model 2, the number of industrial and services employment is positively correlated with industrial land development. By contrast, the share of agricultural employment, though insignificant, is negatively correlated with industrial development. The ratio of agricultural to industrial GDP is another explanatory variable in Models 2, 4 and 5, indicating a negative correlation with industrial land development, and a positive correlation with agricultural and forest land developments. This implies that higher returns to agriculture and forest uses may prevent the conversion of agricultural land to industrial uses, and further promote agricultural and forest land expansions. Regarding Models 3, 4 and 5, it can be suggested that population and population density are negatively related to recreational, agricultural and forest land expansions. In other words, the higher the population, the lower the recreational, forest, and agricultural land to be allocated to non-residential and non-industrial uses. This points to consumption of recreational and agricultural land to accommodate increasing population in the growing regions.
In order to assess the correlation of socio-economic parameters and supply restrictions with land use development, region specific regression models were estimated for the residential, industrial and agricultural land uses separately (
Table 8,
Table 9 and
Table 10). Only the socio-economic factors that do not show collinearity with the other factors and supply constraints were considered as explanatory variables in the regression analysis.
The estimations were also carried out regarding recreational and forest land; however the estimated coefficients were either found insignificant, or had inconsistent signs; therefore results from these regressions are not provided in the current paper. In the regressions explaining residential land development, population, total employment, available land, airport and port variables are correlated with the other explanatory variables (
Table A2 in the
Appendix A); and therefore these were excluded from the analysis, as these characteristics are captured by household size, population density, GDP and the areas of protected sites. Likewise, correlated variables were excluded from the regressions explaining industrial and agricultural land developments through examining the significant correlations in the correlation coefficient matrices.
From
Table 8 and
Table 9, GDP contributes significantly to the development of residential and industrial land uses across all different regions specified in the study. The contribution of GDP to residential land growth is the highest in peri-urban regions while the lowest contribution is observed in the west region. Peri-urban regions are characterized by high population growth rates that are associated with the growth of residential land. The north region showed considerably high elasticity of change regarding the GDP variable compared to other regions. Considering that the Region has lost population between 2006 and 2012, the high elasticity of GDP to residential land use change confirms that the Region is experiencing low-density developments.
Considering industrial land, west, north-west and east regions have the highest explanatory power, thus each region can explain more than 90% of variation in the industrial land use. The elasticity of GDP to industrial land is the highest in north-west region, and that is followed by the east, south and north regions. This is a promising finding, verifying that economic growth and industrial development in the east region follows the trend of industrial land development of the highly developed north-west region. The former region is characterized by high employment growth, while the latter is characterized by high productivity growth during the last decades. The peripheral regions have created jobs for low-skilled workers outside the agricultural sector [
93]. The medium-size enterprises in these regions have increased their employment on average by 5% annually between 2002 and 2010. The regions experiencing particularly strong employment growth in the 2000s are Kocaeli, Kayseri, Van and the surrounding regions (see
Figure A1) [
93].
From
Table 8, household size is negatively related with residential land development both in north-west and peri-urban regions. In other regions, it is positively related to residential development. This points to a correlation of residential development with declining household size in north-west and peri-urban regions, and with increasing household size in other regions. Except west region and rural areas, residential land expansion is negatively related to population density: This implies that the lower the density, the higher the land expansion. Land restrictions may be influential in peri-urban regions, and also in the north, north-west and west regions regarding industrial development. Except the east region, which is characterized by depending on agricultural economy, in all other regions, the share of agricultural employment is negatively correlated with industrial development (
Table 9). This finding is also supported by the negative coefficient on the ratio of agricultural GDP to industrial GDP.
In the case of agricultural land development (
Table 10), east and north-west regions have the highest explanatory power. The negative coefficient of Log(pop) variable indicates that increasing population in these regions is associated with agricultural land consumption. In east and north-west regions, increasing share of agricultural employment does not result in agricultural land expansion.
This trend is also observed in peri-urban regions which have experienced high growth of industrial employment starting from the 2000s. Increasing share of agricultural employment leads to agricultural land expansion in south, west and north regions, as well as in rural areas where the west region shows the highest elasticity. Higher agricultural GDP contributes to agricultural land expansion in all regions except the west region, showing the lowest elasticity. The results imply that there is possible correlation between share of agricultural employment and agricultural GDP concerning the west and east regions.
5. Discussion and Conclusions
In Turkey, population and urban land use/cover have grown steadily during the last decades, with population growing less than residential land during the 1990–2000 period, and the reverse occurred in the post-2000s, indicating dispersal of residential land uses in the former case, and densification of residential uses in the latter. The overall level of urban expansion in Turkey is characterized by a relatively modest growth in residential and recreational land, and a double growth rate in industrial and commercial land, demonstrating the industrial-oriented development path of the regions. In the 1990–2000 period, urban growth was achieved through conversion of agricultural land and natural vegetation to urban uses. In the following periods, the loss of agricultural land continued with the losses of forests and natural vegetation, though there were small increases of forest and natural vegetation in some specified regions. This result coincides with the findings of the studies of Xiao et al. [
21], Dewan and Yamaguchi [
22], Araya and Cabral [
23], Bieling et al. [
24], Broitman and Koomen [
17], Rawat and Kumar [
41] and Liu et al. [
5] which conducted the case studies on China, India, Portugal, Germany, Netherlands and Bangladesh indicated that the changes of agriculture, natural vegetation and forest land is primarily governed by urban expansion. Unlike the findings of Xiao et al. [
21] which pointed to a decline in residential land uses in the selected Chinese cities, our results indicated only positive changes with the residential land (as in [
5,
22,
24]) and low-density developments, particularly in the cities of the north region of Turkey, as well as other cities in north-west and south regions. During the study period, there is an increase in residential land and a declining population, pointing to development of low-density dispersed settlements in the northern region as the Region is characterized by having geographical limitations for the development of higher density settlements.
The process of urban dispersal in shrinking cities/regions in the north region of Turkey is also common to the European and US cities of more developed economies, indicating similar development processes with the Turkish case [
14,
15,
95]. For instance, Turok and Mykhnenko [
96] showed that many of the Eastern European cities had been facing population decline since the 1990s, and most of these cities had experienced urban sprawl under conditions of urban shrinkage process. Urban sprawl causes direct LULC change at the urban-rural fringe, and impacts indirectly on the rural landscape through fragmentation of agricultural areas and woodlands. This has increased the need for planning tools specifically designed to cope with urban sprawl, and to promote environmentally sustainable urban forms and land saving developments. The impact of declining local economies and job losses, demographic change, sub-urbanization and consequential population loss has resulted in urban shrinkage observed in many urban regions in the World, as well as cities/regions in the north region of Turkey. These cities have been hit by job-related out-migration to the more developed western, north-western and southern regions of the country. As urban shrinkage is influenced by particular governance arrangements operating at different spatial levels and the struggle between public and private interests, it is policy relevant for government and local authorities, infrastructure providers, investors and public associations and other stakeholders representing diverging interests, to develop common strategies of action and cooperation [
97].
The results from Liu et al. [
5] demonstrated a negative change in industrial land in their study area of Central China, pointing to decline in industrial development considering that industrial land is converted to other land uses. By contrast, in our study, we found that there is considerable industrial expansion during the study period in all regions of Turkey, particularly in the north region that has experienced population decline during the study period.
In the current study, we cannot specify the types of industrial/commercial land that have expanded, or those that have undergone a shrinkage process. Since the industrial/commercial land use class is aggregated in the CLC dataset, it is impossible to disaggregate industrial, commercial and finance sectors that underwent an expansion or decline. With the availability of alternative land use/cover maps disaggregating the industrial/commercial land use classes, it would be possible to identify and quantify the types of economic sectors of expanded and declined land uses. Therefore, we recommend the search of alternative spatial data sources for Turkey as a future research topic to investigate the spatial dynamics of industrial/commercial developments at the regional level. This is important, since persisting pressures of urban growth in Turkey are resulting in conversion of non-urban uses to irreversible urban uses e.g., industrial or commercial development, housing and infrastructure. Nonetheless, urban growth has resulted in major challenges in the growing regions concerning planning and policy making and environmental protection.
The disaggregation of urban and non-urban land uses into regions and different hierarchical levels have shown that population and urban and non-urban land use change rates were diverse and uneven. This coincides with the findings of Broitman and Koomen [
17], which focused on the regional diversity in residential development of urban and peri-urban areas in the Netherlands; and Wang et al. [
31] investigating spatio-temporal patterns of urban-rural development transformations in China. This points to spatial disparities regarding socio-economic development levels of the regions that are common to both developed and transition economies in Europe and internationally. Our results indicate that the spatial development of regions are deeply influenced by the regional economic level. A deeper comparative analysis reveals that while the north-western region had experienced rapid increase in residential and industrial land in the 1990–2000 period, the less-developed regions, the east and north, witnessed similar changes of residential and industrial land as with the north-west and other regions in the following periods. These land use changes can be attributed to re-location and de-concentration of industrial and commercial activities to peri-urban regions in the north-west, and less developed regions in Anatolia. Though there are similar changes of land use across the regions in the post-2000, the literature has shown that the regional development disparity in Turkey continues in the post-2000 period [
66,
67,
92], as there are considerable differences in the composition of industries and income levels of regions concerning the north-west, the east, and other regions [
69,
94]. This is also evident from our study, which shows the regional disparities in economic output, population density, and industrial/agricultural employment for the post-2000 period. Since the 1970s, the Government has attempted to promote balanced development of regions in Turkey, and some of the most important measures that were introduced include: The creation of ‘Priority Development Areas’ and related policy framework, South-East and East Anatolia Development Projects, Regional Development Plan for the Eastern Black Sea Region, the Project on Zonguldak, Bartın and Karabük and others. Since 2006, the recently established Development Agencies have developed new regional plans for their corresponding regions to promote more balanced and sustainable development of the regions. National/Regional Spatial Strategy Plans focusing on national/regional development strategies in a more systematic way have been put into practice more recently. These changes in the planning and institutional system (
Figure 3) indicate that regional planning in Turkey is getting more significant and powerful. However, the structure of the planning institutions and regional/national plans needs to be enhanced further to better address regional and sectorial needs, the regional/national growth strategies and sustainable urban development. A critical evaluation of the planning system and its future requirements had already been covered in the literature [
48,
98].
From our analysis, we note that the cities in north-west and north regions had experienced low-density development patterns in the 1990–2006 period (
Figure 7a), while in the post-2006 era, the regions are optimizing their land use structures through higher density and more compact developments (
Figure 7b). We found that the northern region lost population between 1990 and 2012. Regarding other regions, population growth rate is relatively higher than residential land growth rate, pointing to higher density developments. An in-depth analysis of land use changes across different regions and hierarchical levels has shown that industrial land use change is concentrated in peri-urban regions, which have experienced considerable economic growth in the last decades.
The residential and recreational land development has spread to rural regions and then to peri-urban regions, where there is abundance of land for development. In north-west, south and east regions, peri-urban and then rural regions recorded the highest changes of industrial land development. In west region, urban and peri-urban regions, and in the north, rural regions are associated with the highest changes of industrial land.
Underlying drivers of LULC change can be evaluated by the standard land use change drivers that were used in other studies. Our regression analysis indicated a combination of underlying drivers i.e., socio-economic, regional and location-based factors and development constraints, influencing urban and non-urban development patterns in the Country and across regions. Regression results of the current study undertaken for Turkey have confirmed the findings of the studies of Dewan and Yamaguchi [
22], Wu and Zhang [
99], Liu et al. [
5], Wang et al. [
100] given that combinations of different underlying drivers are responsible for urban expansion and non-urban land use changes in different study areas. Our results have shown that the estimated coefficients are of varying sign and magnitude across different land use developments. This implies that land use change dynamics and drivers of land use change in Turkey are highly diverse, depending on many factors comprising differences in urbanization process, socio-economic differences, differences in locational characteristics, and regional development disparities. In the regressions estimated for all the regions (
Table 7), population, industrial employment and economic output are the key factors contributing to the development of residential and industrial/commercial land uses. Urban-related hierarchical levels and the socio-economic development levels of the regions are also prominent in explaining urban land use developments. The presence of land development restrictions was found to be insignificant in the regressions estimated for all the regions, implying that the existence of protected land has not limited the growth of urban and non-urban areas across different regions. However, this is not supported by the region-specific regressions, considering that the areas of protected land show significant coefficients in the regressions estimated for residential, industrial/commercial and agricultural land. From these findings, we conclude that protected sites mostly do not pose a restriction regarding the residential land developments; however protected sites limit industrial, and in some regions agricultural, developments.
Considering the persisting urban growth pressure, the suggested urban development trends may continue in the future. Therefore, land use planning and policy-making authorities will have to deal with increasing development inequalities among regions, urban cores and peri-urban areas. The increasing industrial demand in Turkey seems to be allocated to peri-urban regions, while the residential demand will need to be allocated to rural regions. Therefore, land use plans and policies at both national and regional level pointing to the new areas of development, are increasingly needed. To address this issue, future projections of the selected urban land uses should be performed as a future research focus. The analysis of the future urban land estimations are policy relevant, as it is important for planning and policy-making authorities to formulate well-planned and forward-looking strategies to distribute and allocate scarce land uses efficiently.
The current study provides an empirical evidence for the identification and quantification of urban and non-urban land use change, and the significant drivers of land development at the regional level in Turkey. The study connects with the literature through provision of statistical characteristics, and the key determinants of the land use changes in the 1990–2012 period at the regional level in Turkey [
101]. Our findings, combined with national statistics, can contribute to national environmental accounting, as well as provide a base for the studies focusing on drivers of land use change and their policy implications in Turkey. The findings from this study can also be used as a benchmark for the comparison of similar studies undertaken for different countries in Europe and internationally. Based on the availability of future data at the regional level, there is further need for more case studies that assess a broad range of factors (e.g., geological, soil and climatic characteristics, industrial composition, social capital, credit and capital markets), rather than the selected ones used in this study that influence regional land use changes in Turkey.
As a future work, it is also suggested that the current analysis be re-conducted, including the 2018 CLC data for Turkey, that will be provided by the European Environment Agency in the future. In addition, the future change of land use and its links to physical, socio-economic and locational characteristics should be considered for future research.


