Multi-Source Data Fusion Based on Ensemble Learning for Rapid Building Damage Mapping during the 2018 Sulawesi Earthquake and Tsunami in Palu, Indonesia


Abstract
:1. Introduction
- The appropriate selection of remote sensing data, as well as the derived features that are to be fed into a machine-learning classifier. Optical and SAR imagery have their own advantages with respect to damage recognition tasks. However, the question of which data contribute better to the classification is still unknown. For instance, in the case of tsunami-induced damage where the incoming waves may affect only the building’s side-walls, SAR features are suitable for recognizing such damage patterns.
- Most of the previous methodologies are based on supervised or semi-unsupervised learning algorithms that require a large number of high-quality training samples. This aspect limits their applicability for responding to future disasters, considering that such labeled data are not available soon after the disaster and are generally only collected several days after the event.
- Setting parameters of machine learning classifiers. Several algorithms have proven to be robust for categorizing several degrees of damage in the case of different disasters [14,15,16,17]. Nonetheless, previous works set optimizing parameters that work properly for their specific problem settings. These conditions narrow the potential for their implementation in cases of future disasters. Thus, with respect to applicability for rapid damage mapping, there are no adequate guidelines on which algorithm performs better.
2. Materials
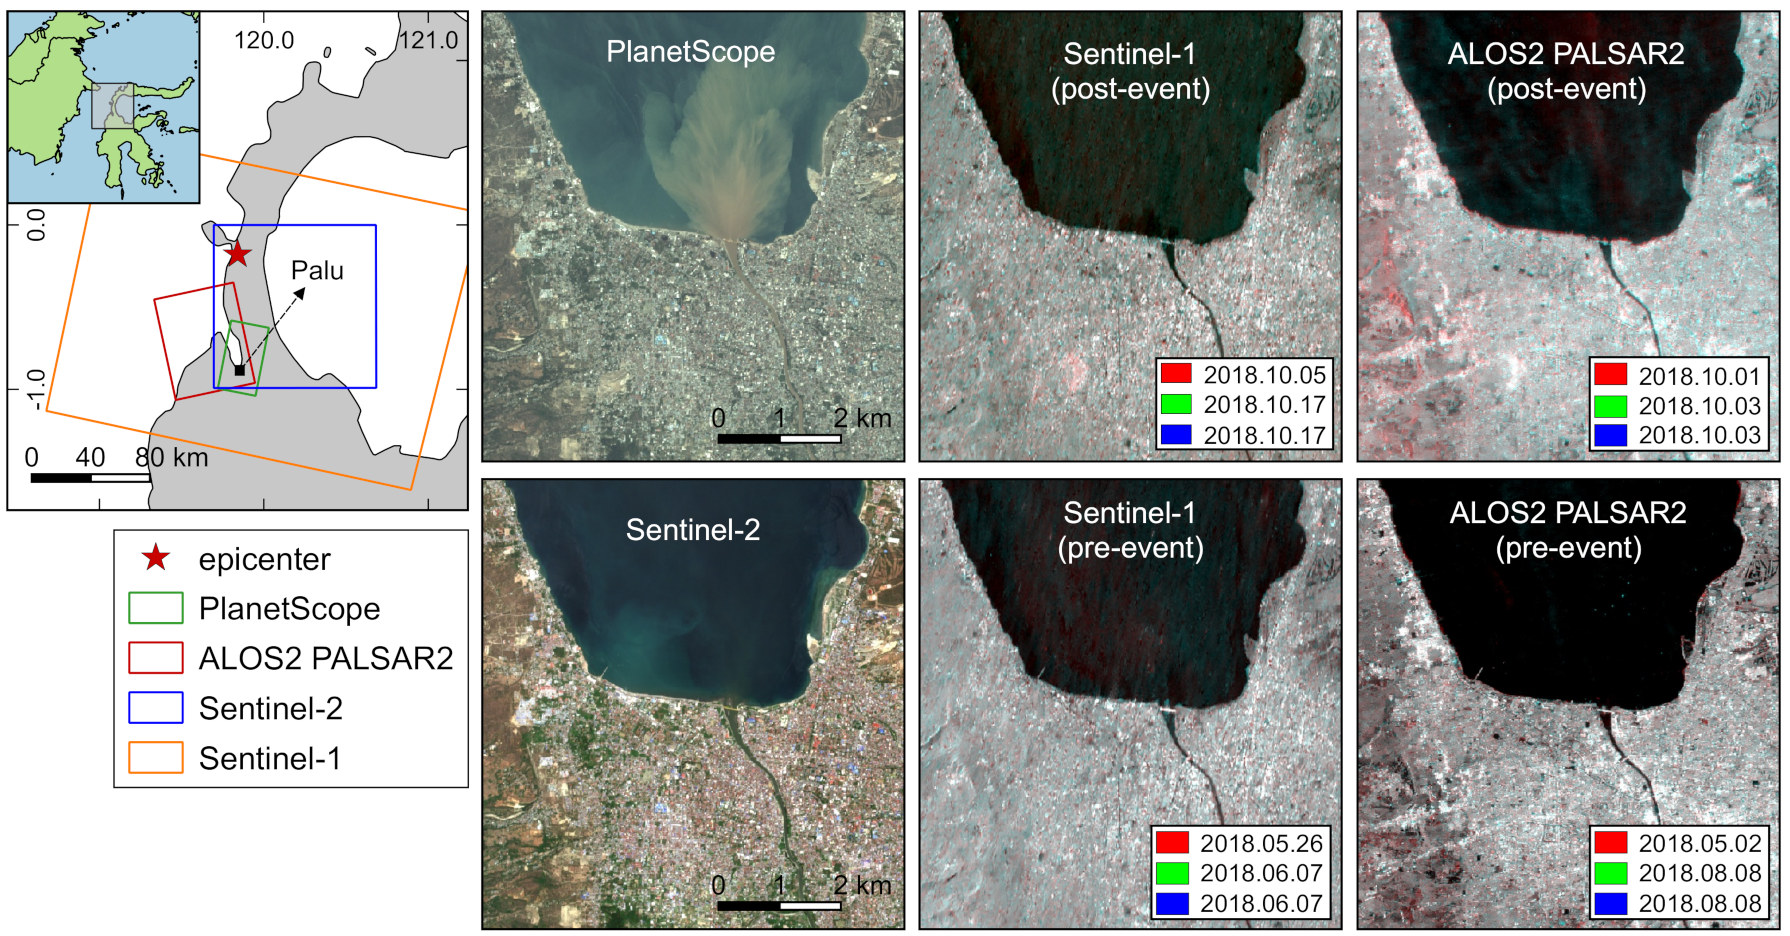
2.1. ALOS-2 PALSAR-2
2.2. Sentinel-1
2.3. Sentinel-2
2.4. PlanetScope
2.5. The Shuttle Radar Topography Mission (SRTM)
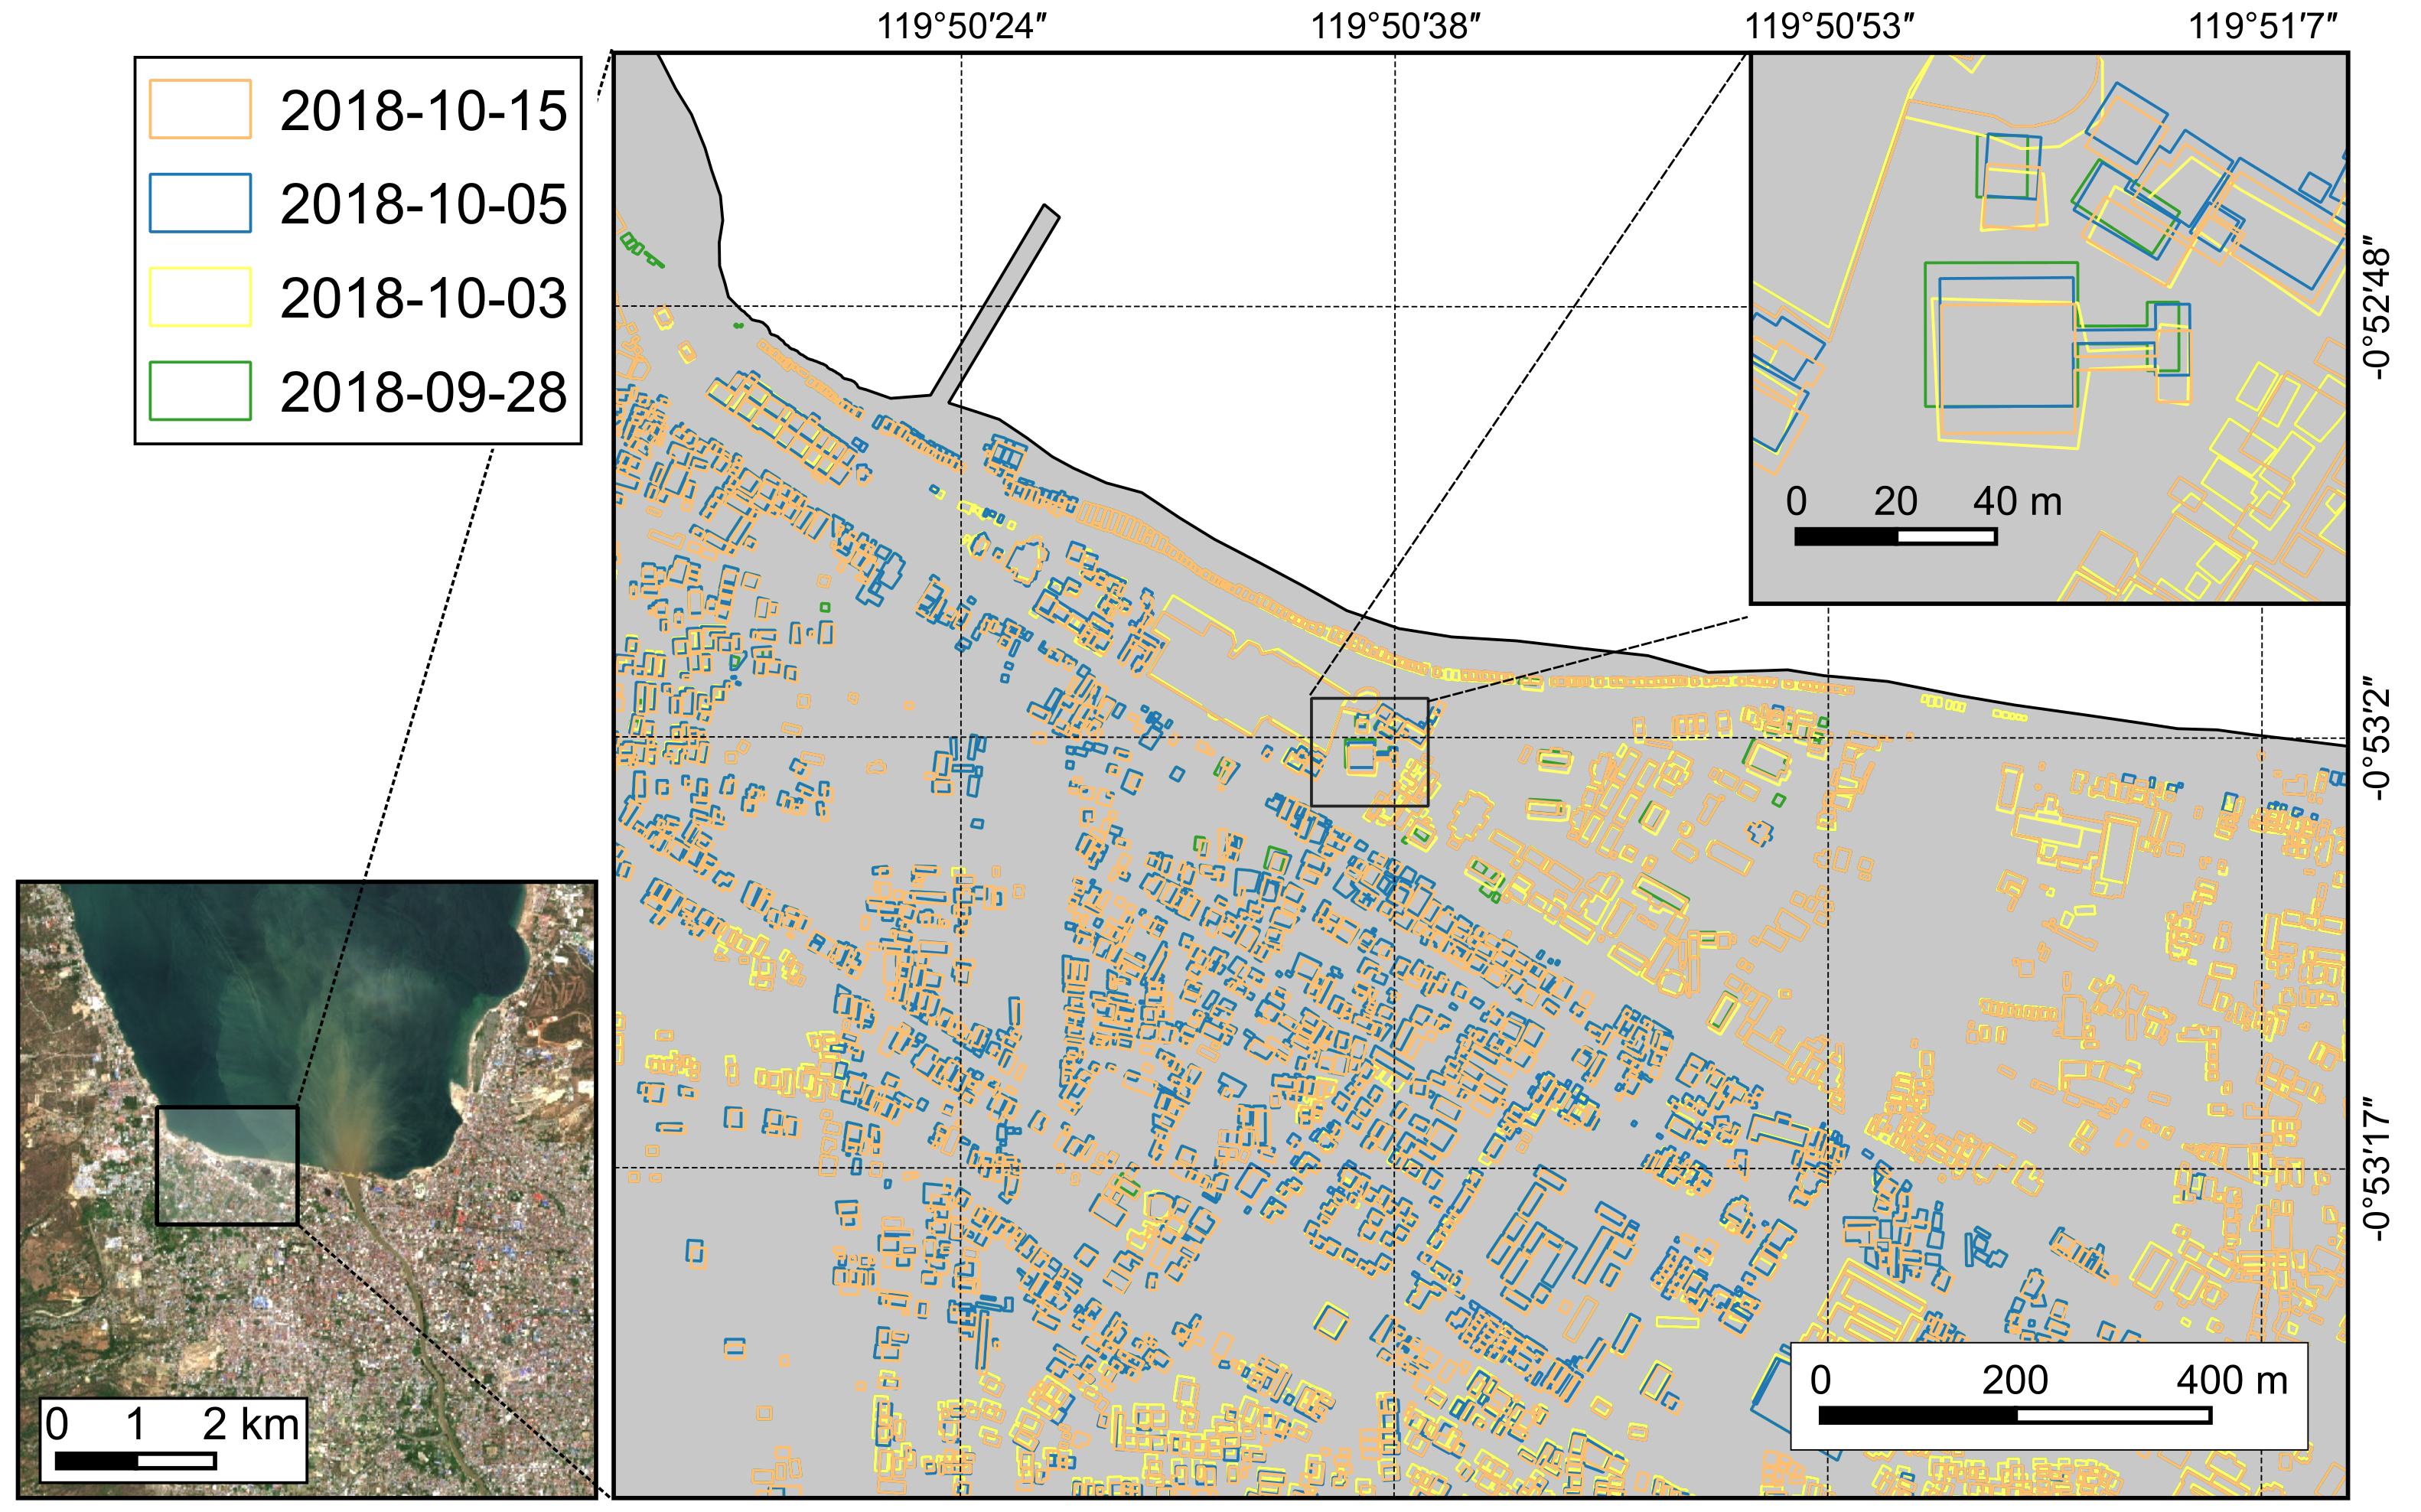
2.6. OpenStreetMap
2.7. Copernicus Emergency Management Services
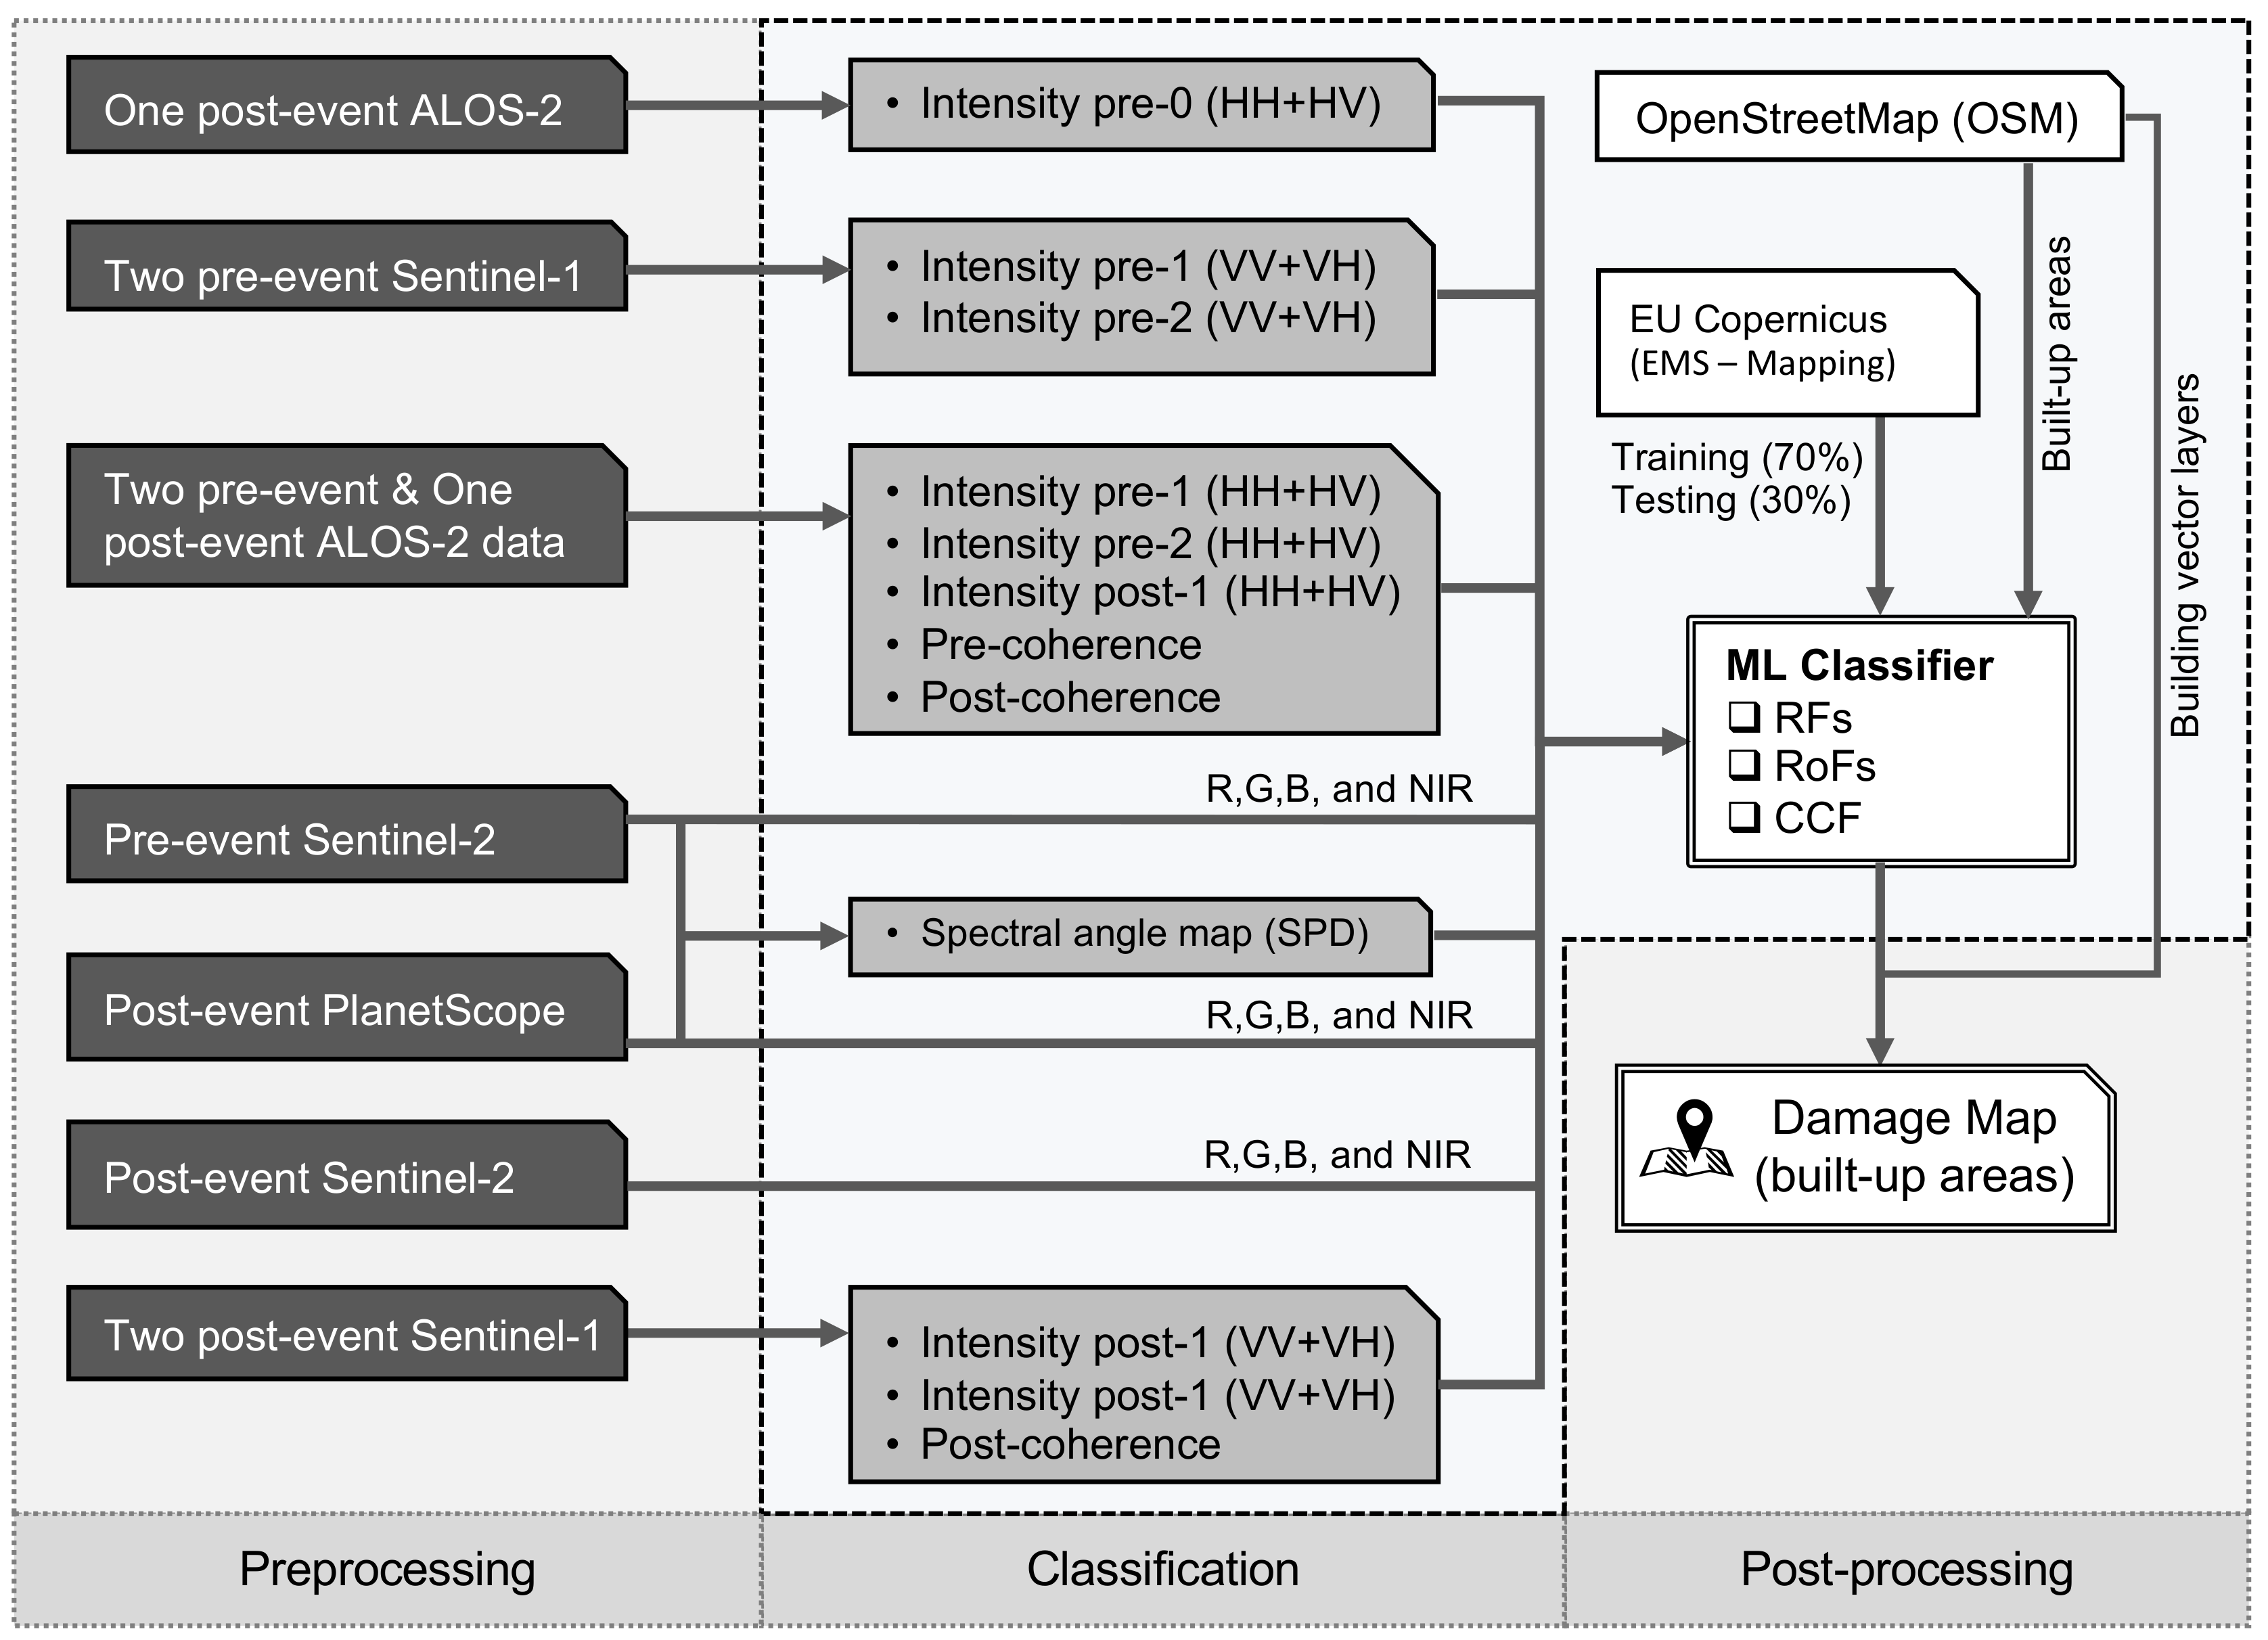
3. Methods
3.1. Preprocessing and Feature Extraction
3.1.1. SAR Datasets
3.1.2. Optical Datasets
3.2. Classification
- lower computational complexity;
- tuning parameters;
- classification capability.
3.3. Postprocessing
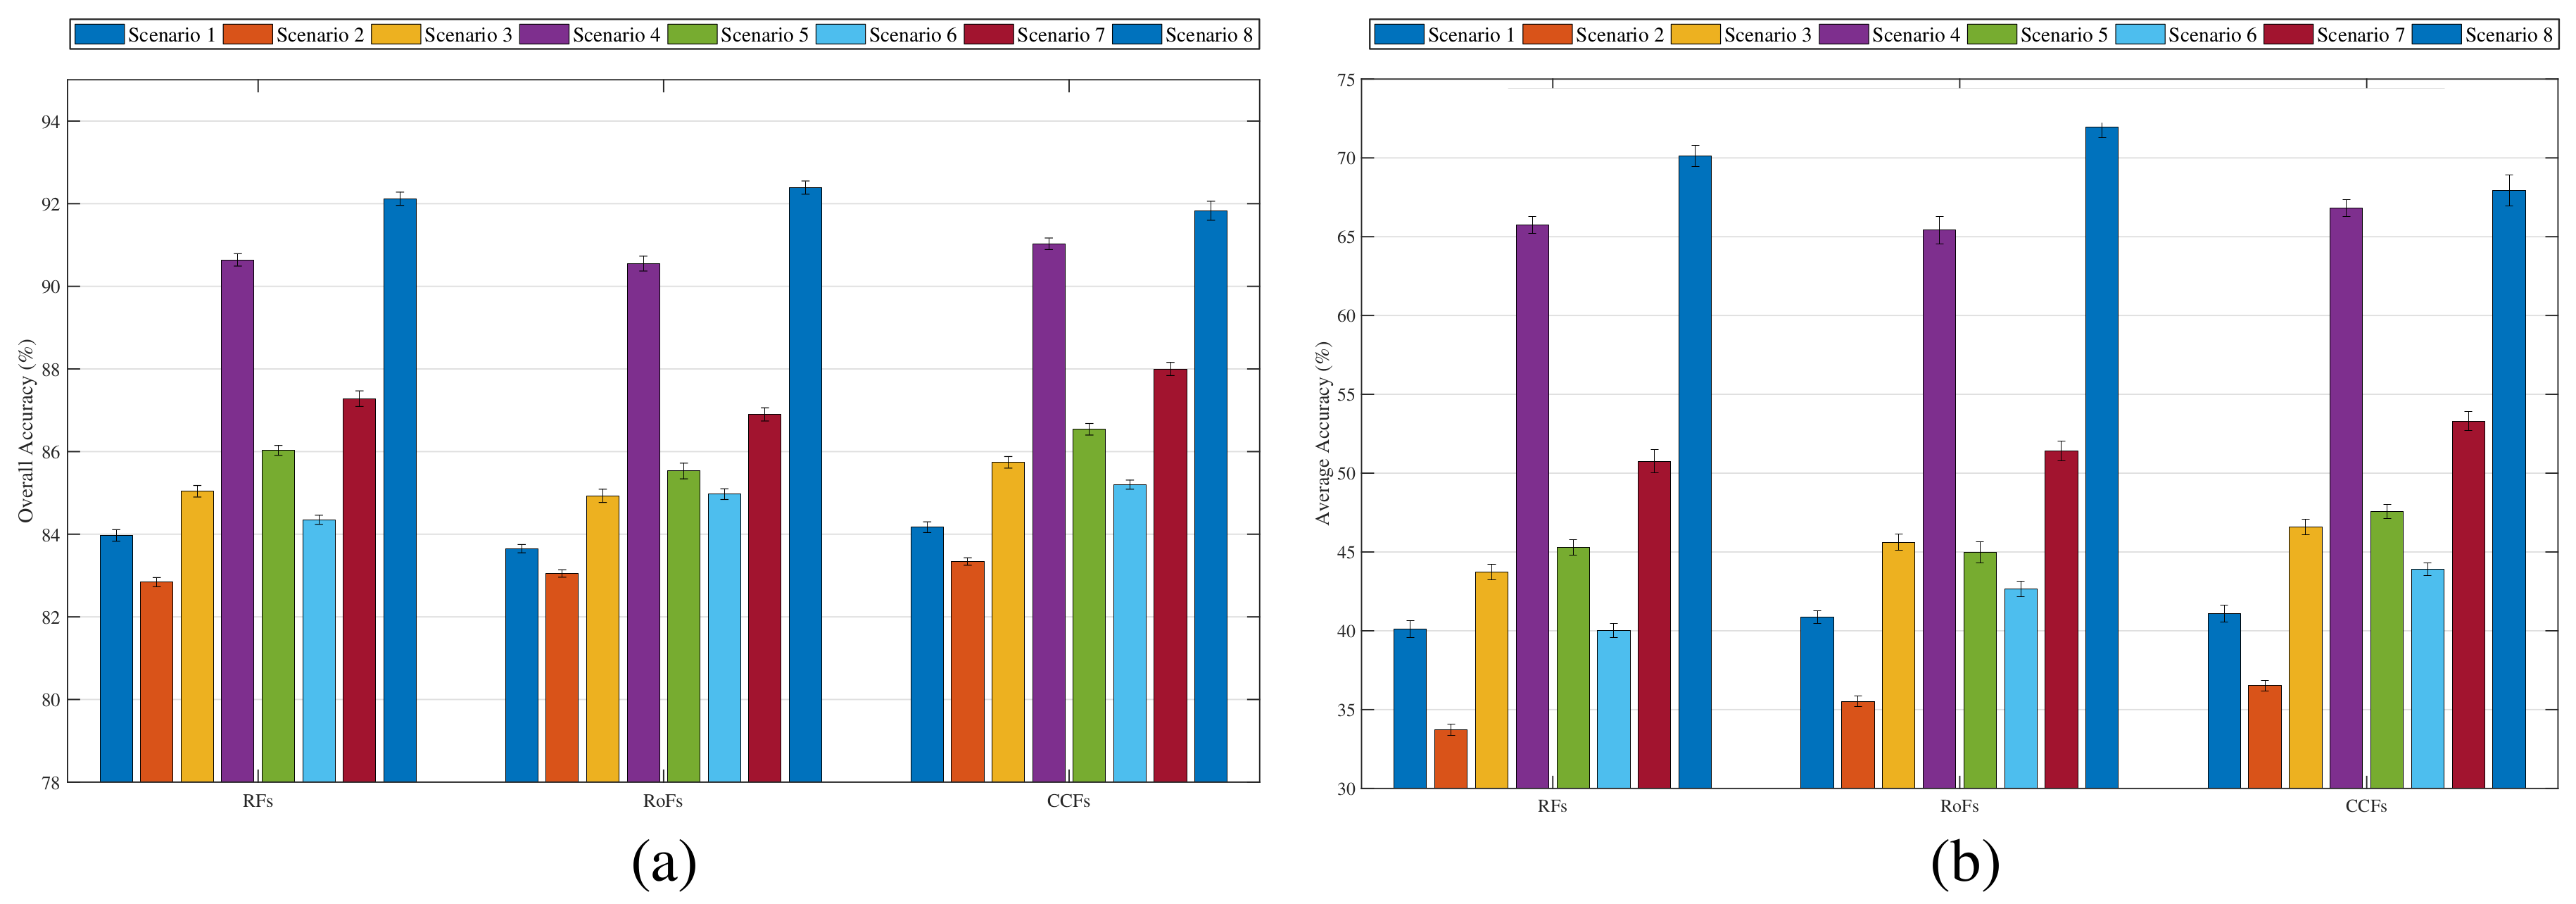
4. Experimental Results
4.1. Classification Using the Post-Event Dataset
4.2. Classification Using Post- and Pre-Event Datasets
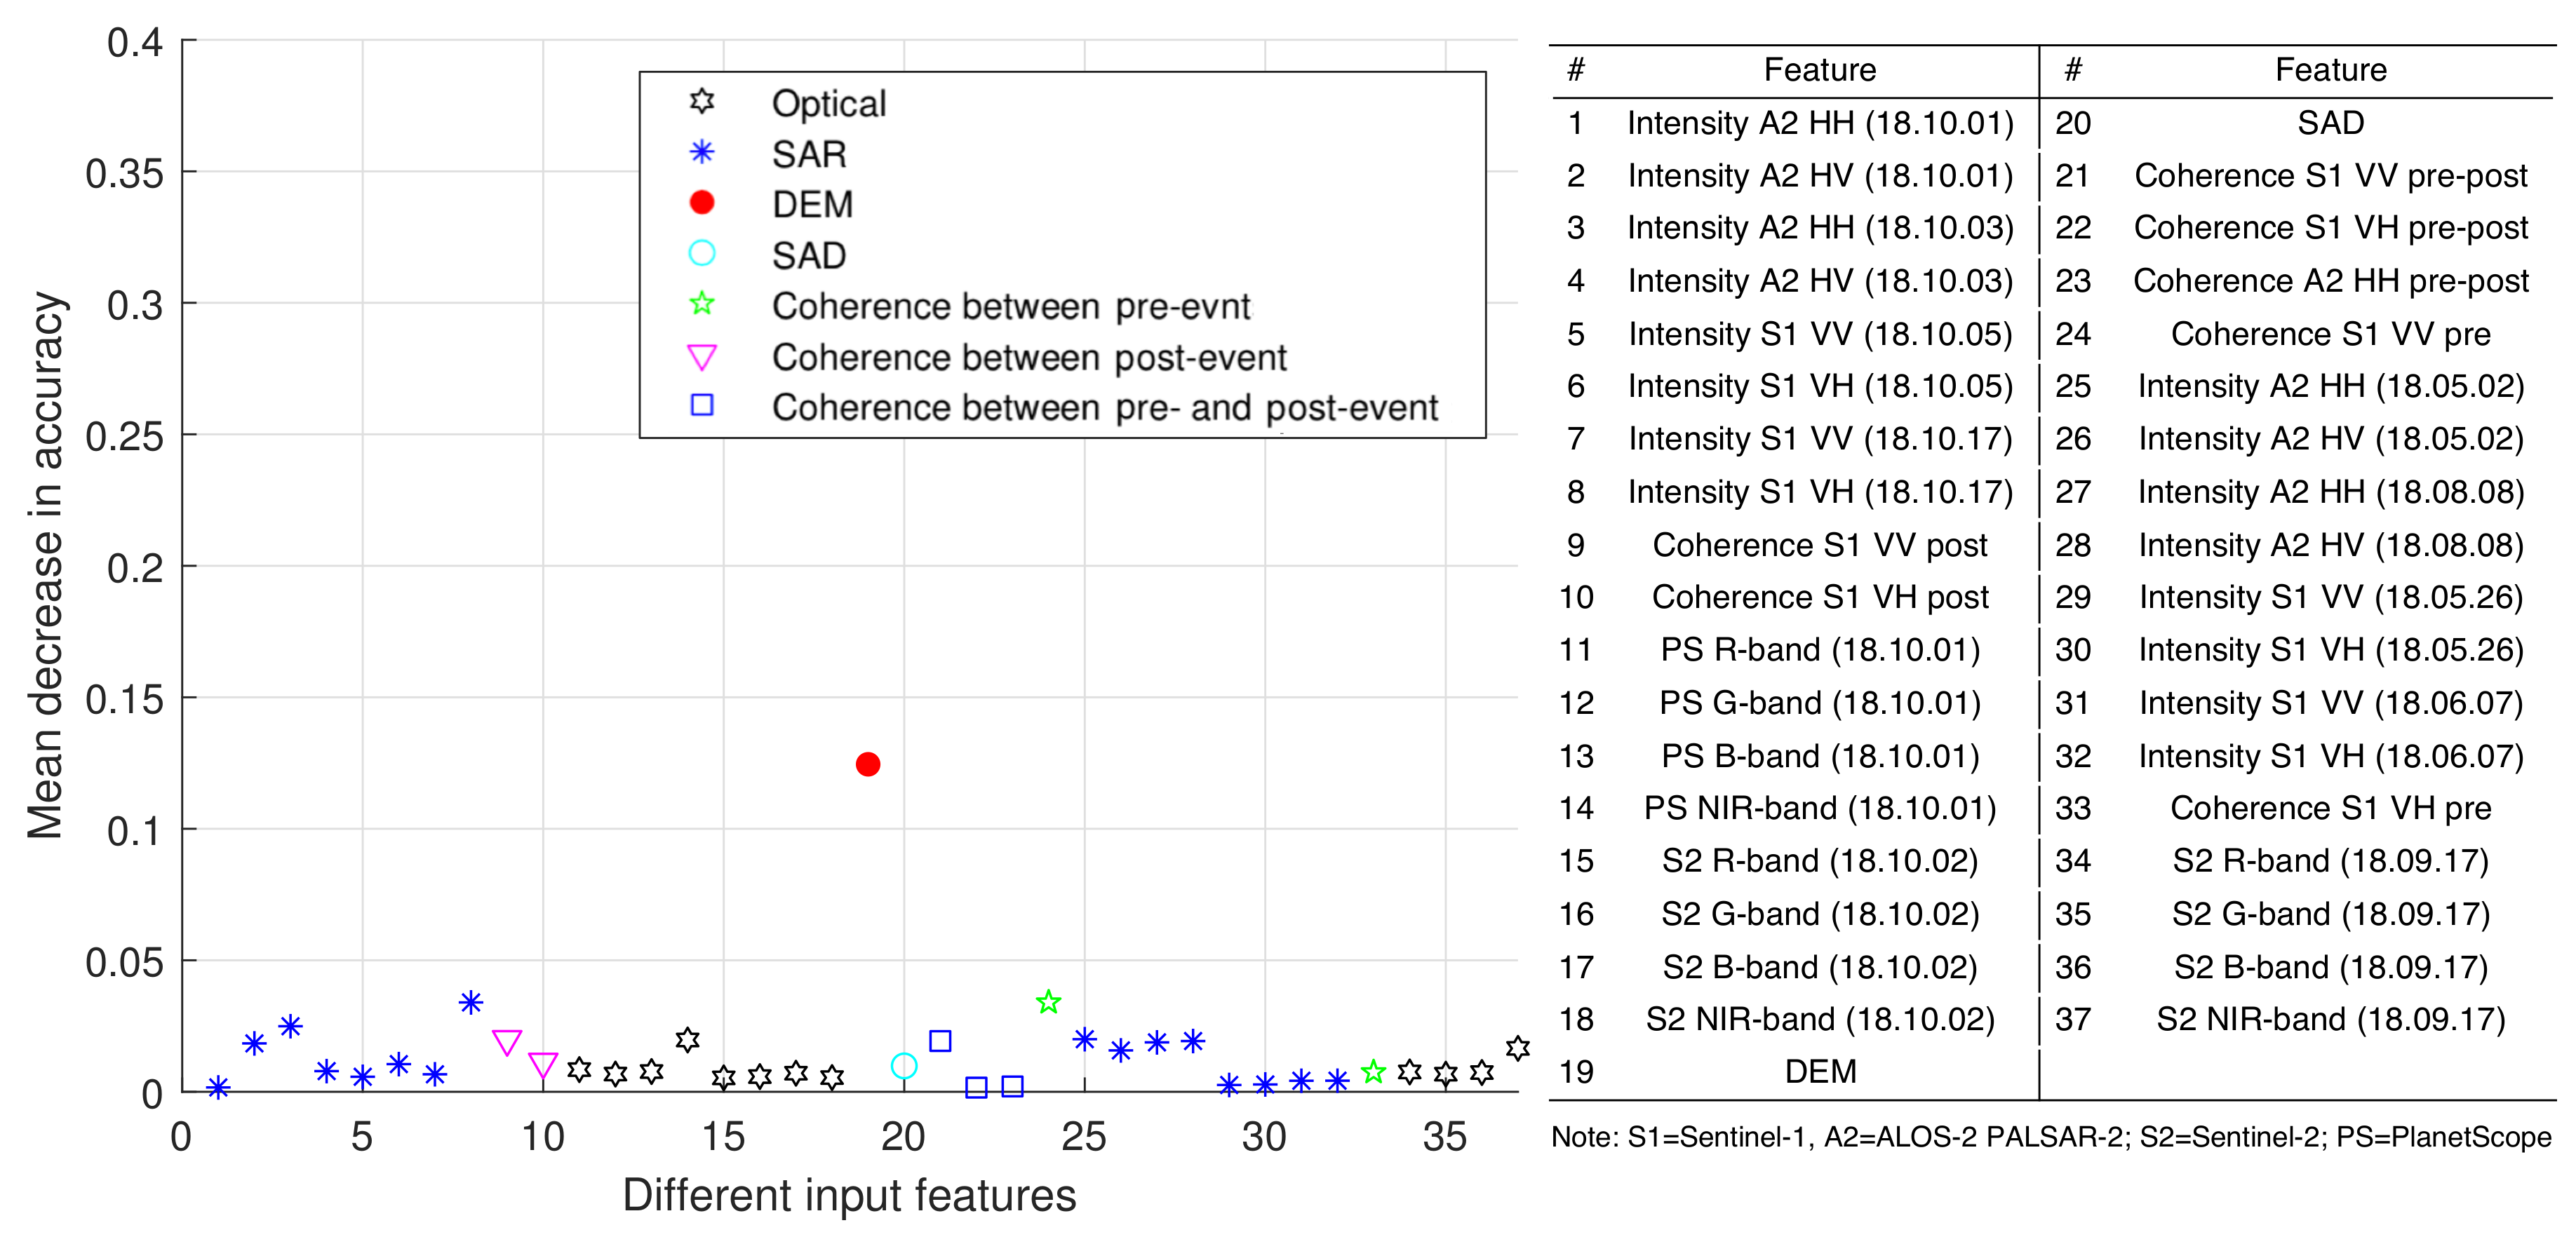
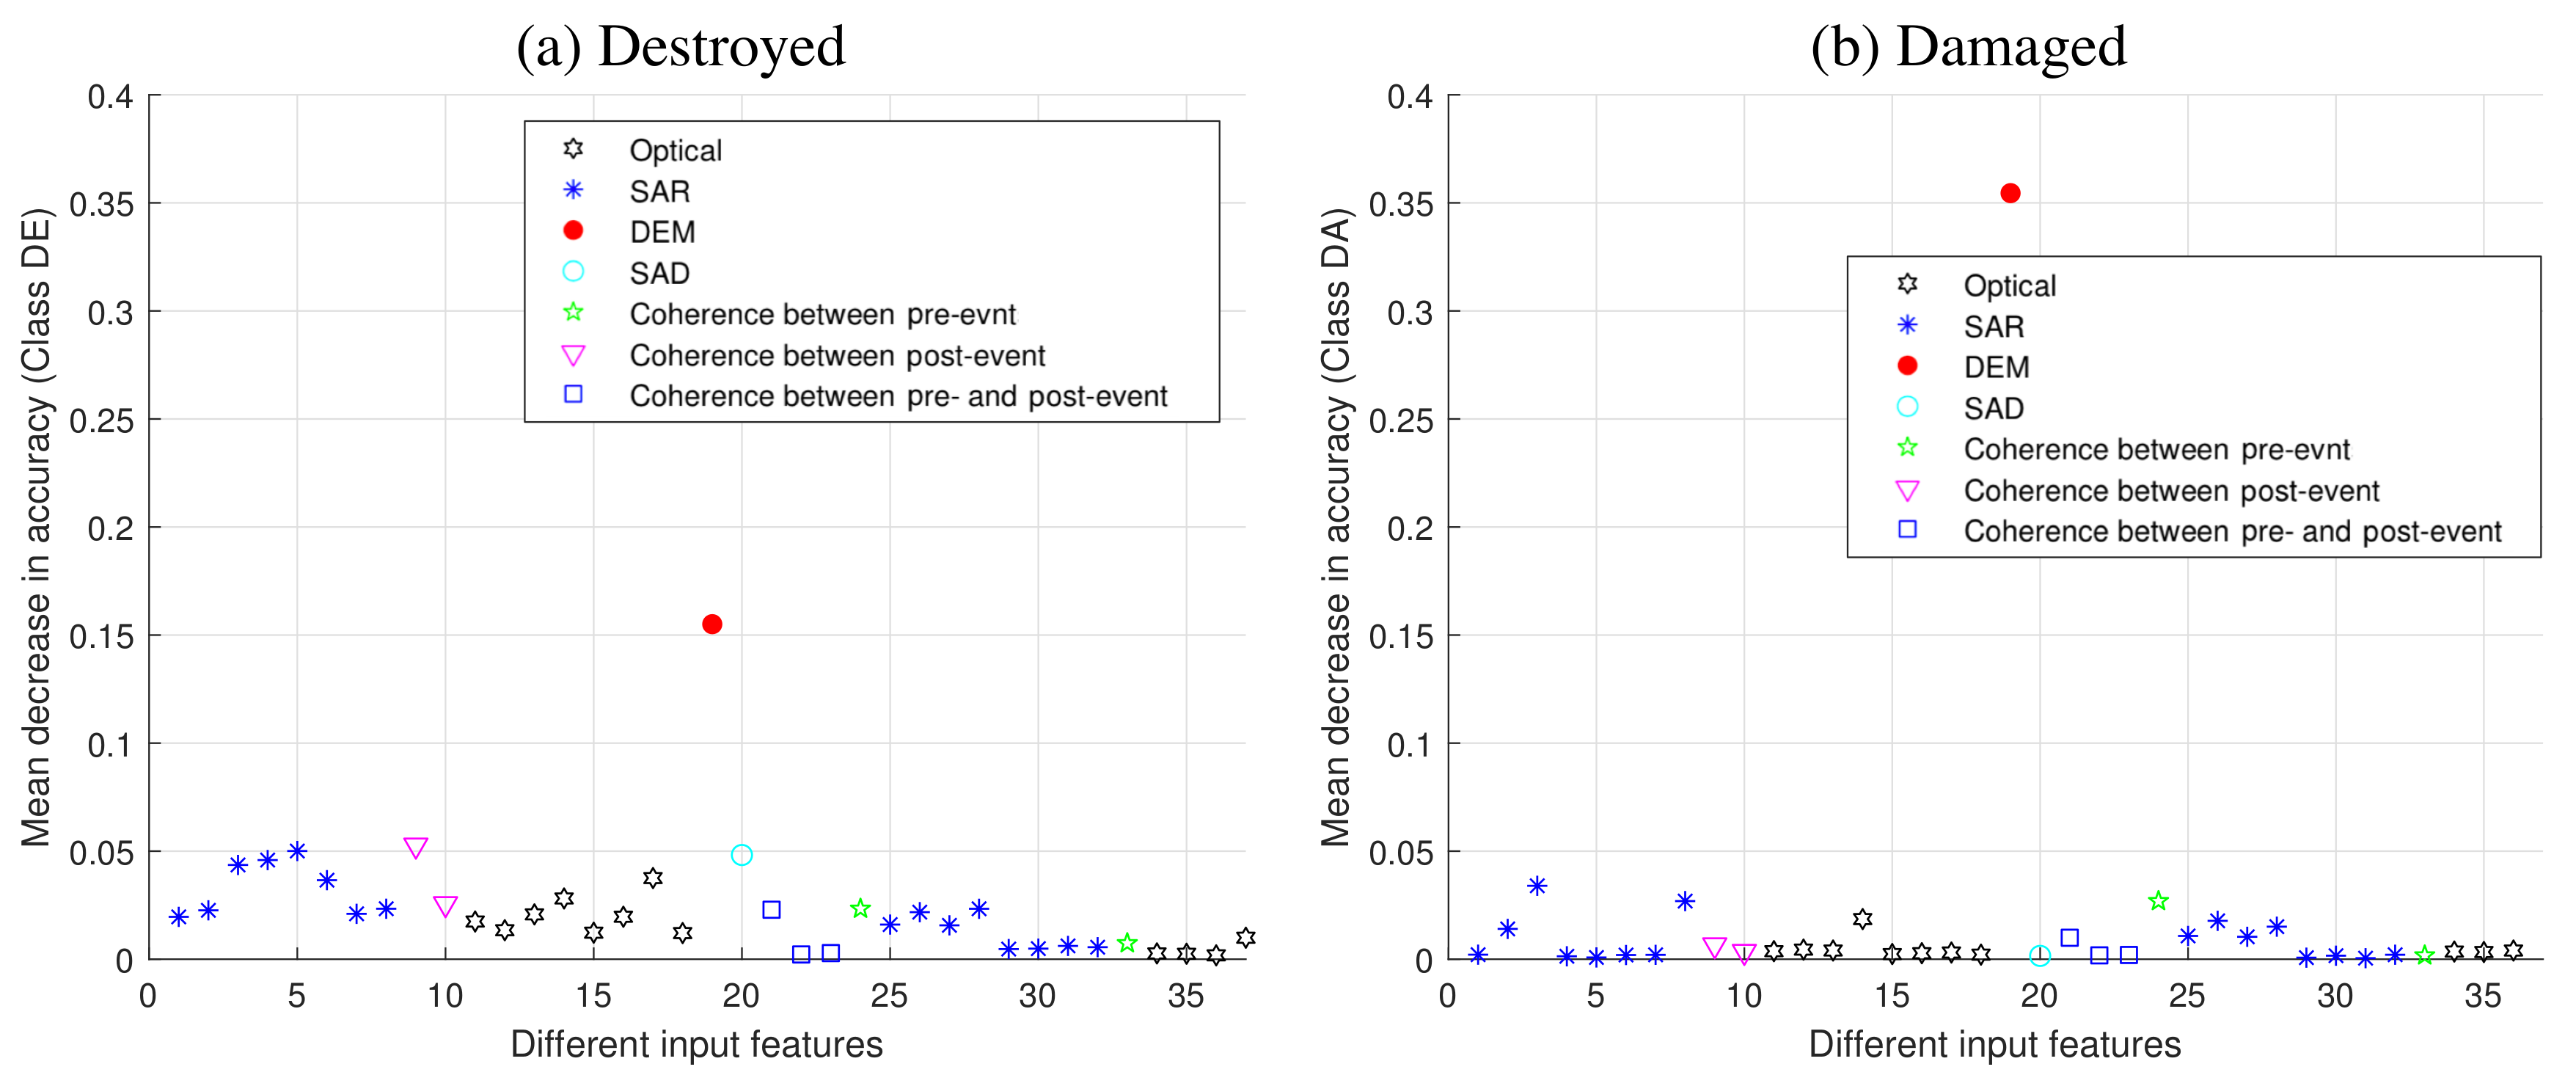
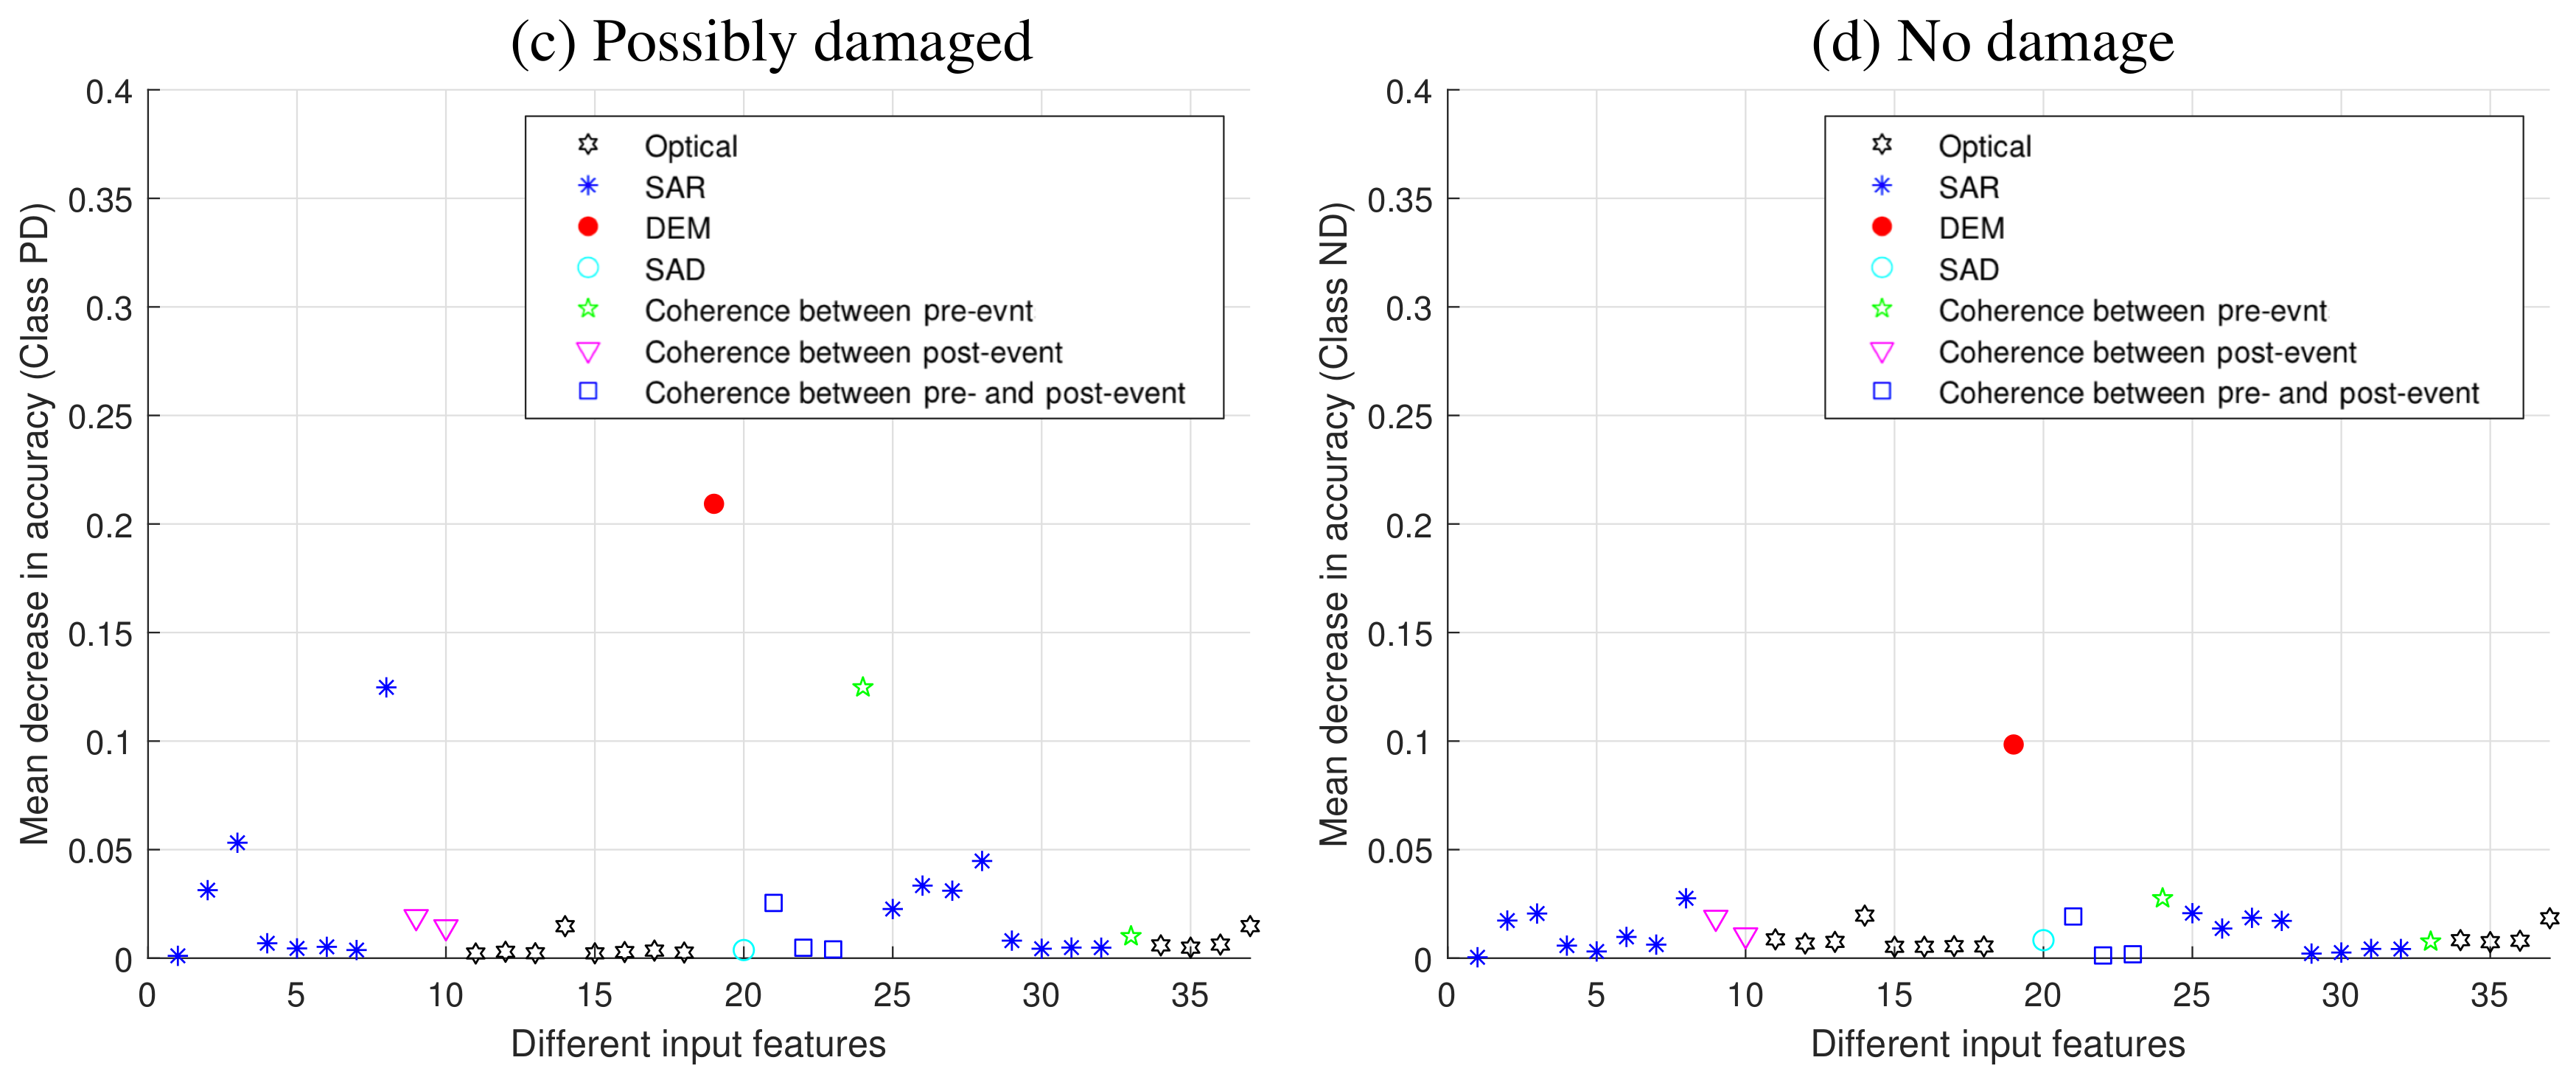
4.3. Feature Importance Analysis
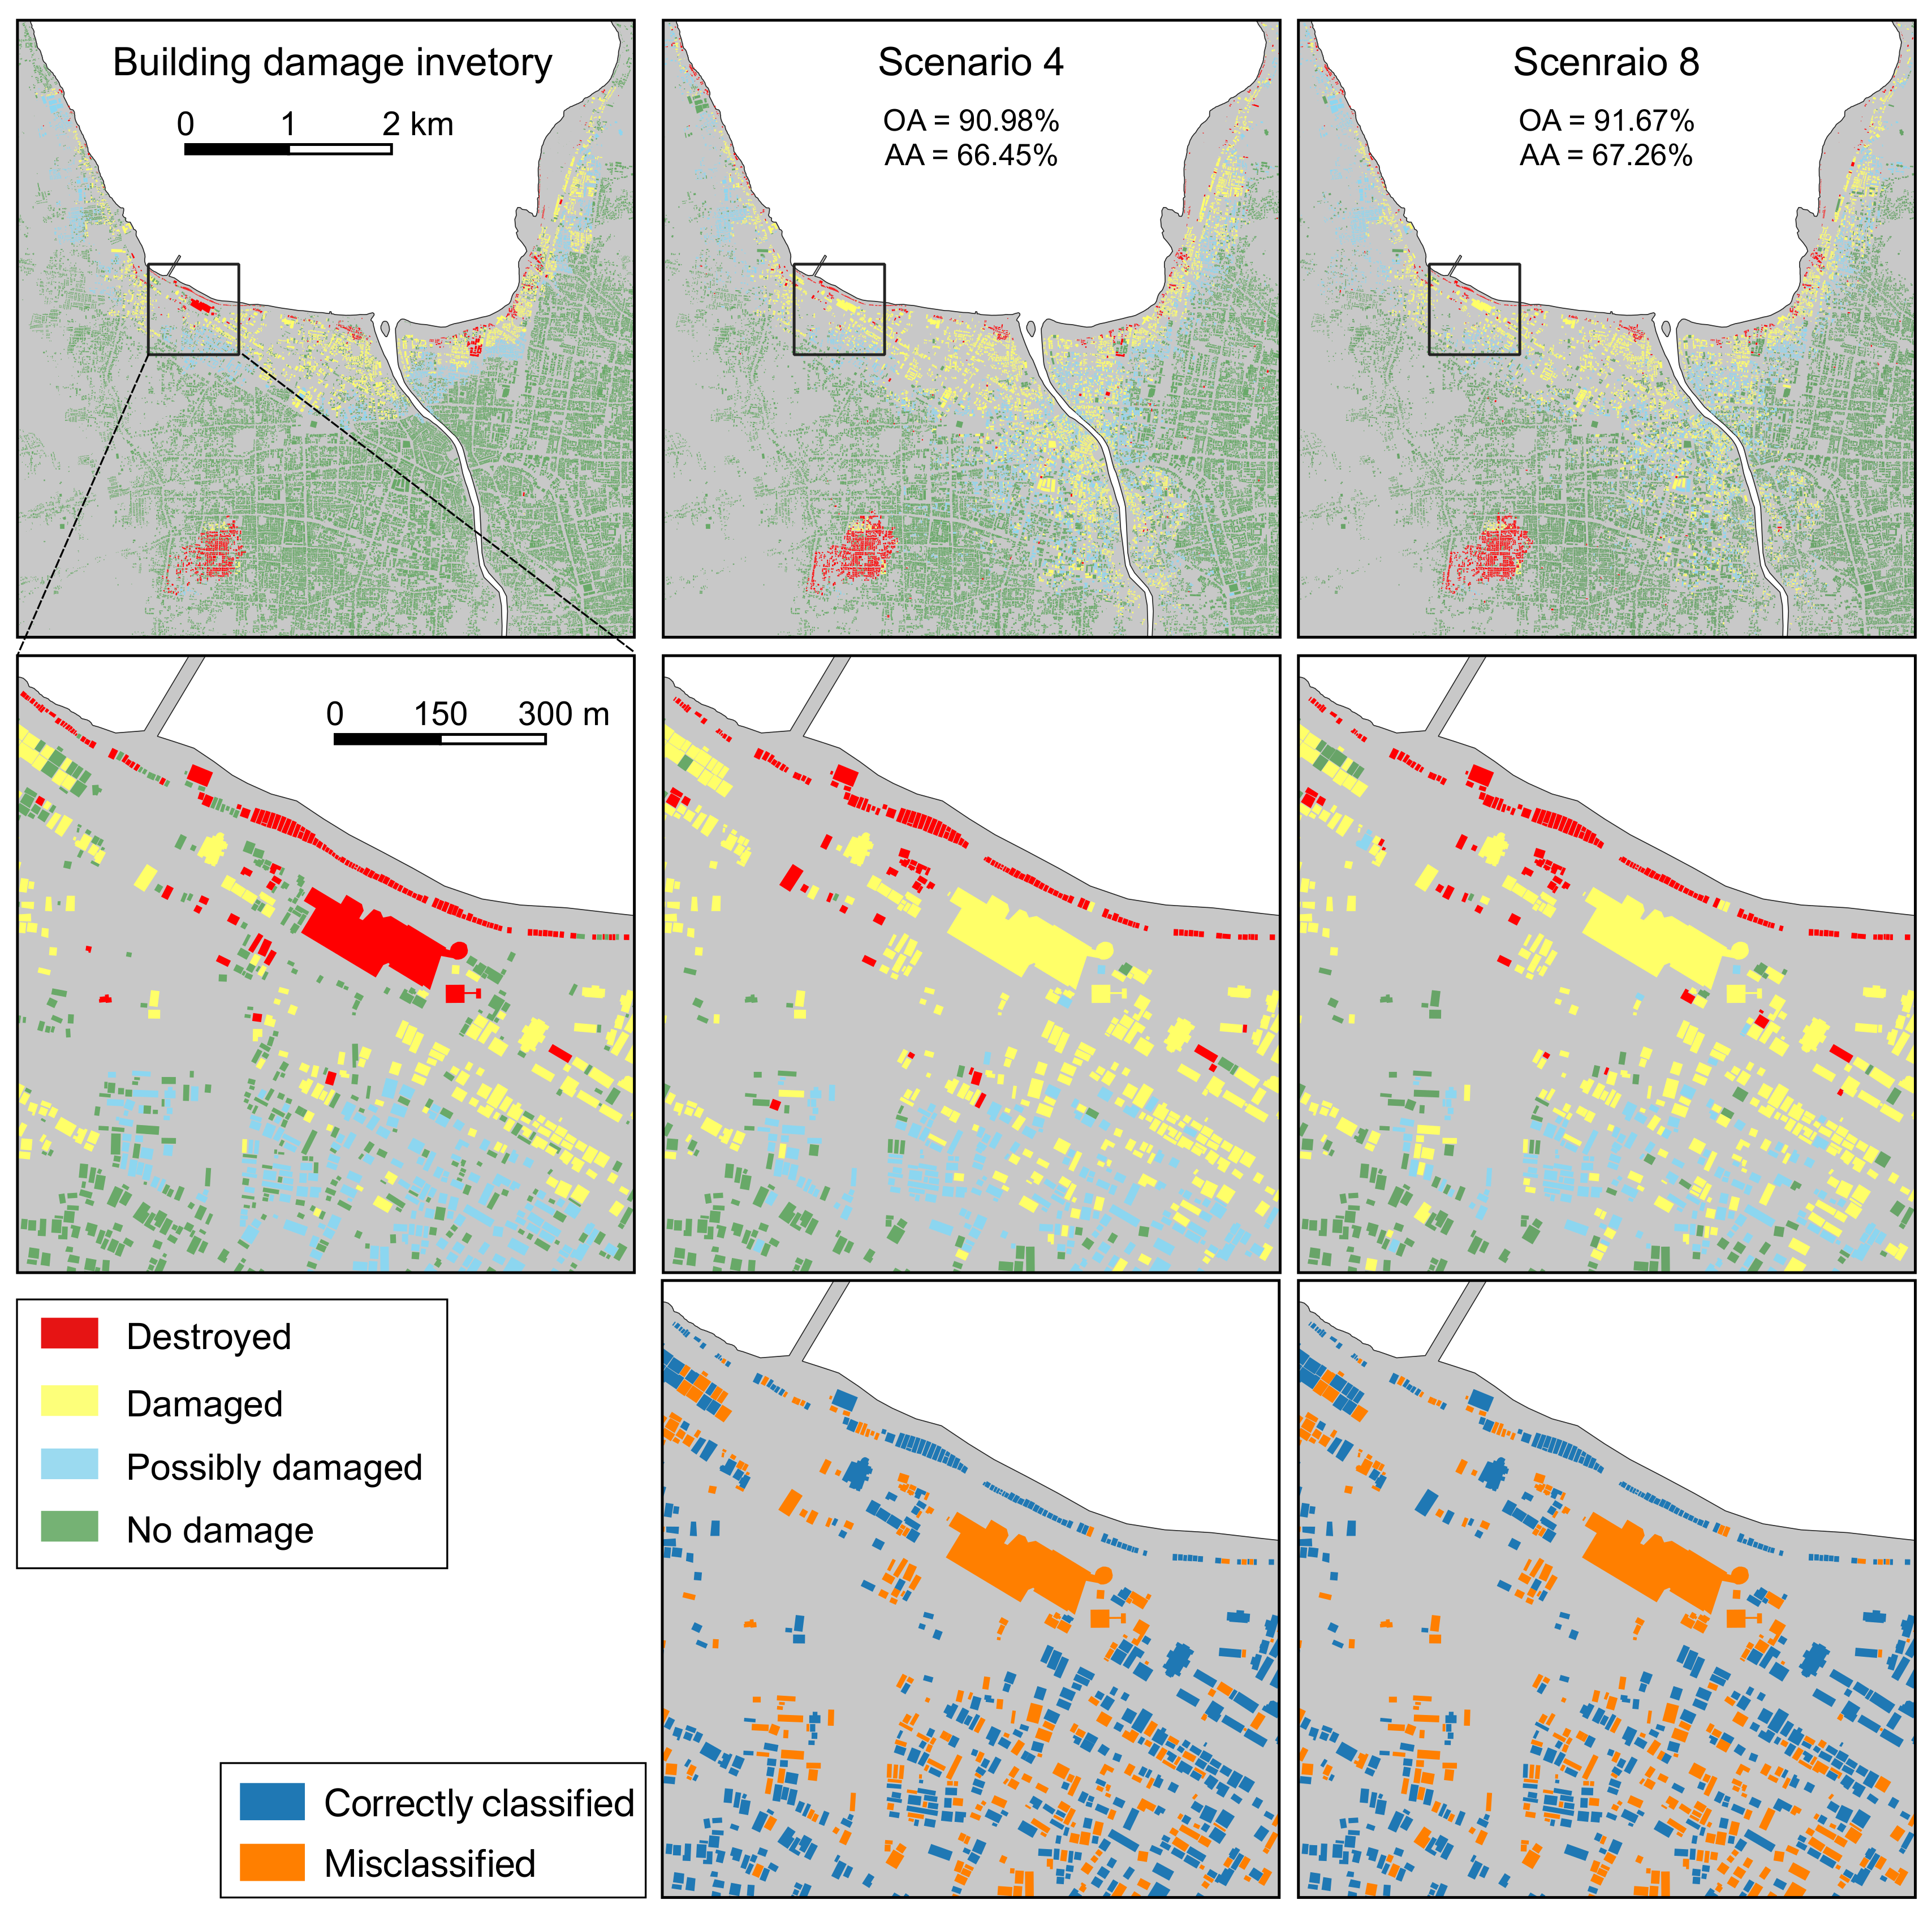
4.4. Building Damage Mapping
5. Conclusions
Author Contributions
Funding
Acknowledgments
Conflicts of Interest
References
- Muhari, A.; Imamura, F.; Arikawa, T.; Hakim, A.R.; Afriyanto, B. Solving the Puzzle of the September 2018 Palu, Indonesia, Tsunami Mystery: Clues from the Tsunami Waveform and the Initial Field Survey Data. J. Disaster Res. 2018, 13, 1–3. [Google Scholar] [CrossRef]
- ASEAN Coordinating Centre for Humanitarian Assistance on Disaster Management. Situation Update No.15-Final 7.4 Earthquake and Tsunami. 2018. Available online: https://ahacentre.org/situation-update/situation-update-no-15-sulawesi-earthquake-26-october-2018/ (accessed on 30 January 2019).
- Copernicus Emergency Management Service. (© European Union), EMSR317. 2018. Available online: https://emergency.copernicus.eu/mapping/list-of-components/EMSR317 (accessed on 10 December 2018).
- Geoinformatics Unit, RIKEN AIP. Preliminary Damage Mapping Following the M7.5 Earthquake in Indonesia on 28 September. 2018. Available online: https://www.geoinformatics2018.com/post/16/ (accessed on 5 October 2018).
- Sun, W.; Shi, L.; Yang, J.; Li, P. Building Collapse Assessment in Urban Areas Using Texture Information From Postevent SAR Data. IEEE J. Sel. Top. Appl. Earth Obs. Remote Sens. 2016, 9, 3792–3808. [Google Scholar] [CrossRef]
- Masi, A.; Chiauzzi, L.; Santarsiero, G.; Liuzzi, M.; Tramutoli, V. Seismic damage recognition based on field survey and remote sensing: general remarks and examples from the 2016 Central Italy earthquake. Nat. Hazards 2017, 86, 193–195. [Google Scholar] [CrossRef]
- Ji, Y.; Sumantyo, J.T.S.; Chua, M.Y.; Waqar, M.M. Earthquake/Tsunami Damage Level Mapping of Urban Areas Using Full Polarimetric SAR Data. IEEE J. Sel. Top. Appl. Earth Obs. Remote Sens. 2018, 11, 2296–2309. [Google Scholar] [CrossRef]
- Liu, W.; Yamazaki, F.; Gokon, H.; Koshimura, S. Extraction of Tsunami-Flooded Areas and Damaged Buildings in the 2011 Tohoku-Oki Earthquake from TerraSAR-X Intensity Images. Earthq. Spectra 2013, 29, S183–S200. [Google Scholar] [CrossRef]
- Gokon, H.; Post, J.; Stein, E.; Martinis, S.; Twele, A.; Muck, M.; Geiss, C.; Koshimura, S.; Matsuoka, M. A Method for Detecting Buildings Destroyed by the 2011 Tohoku Earthquake and Tsunami Using Multitemporal TerraSAR-X Data. IEEE Geosci. Remote Sens. Lett. 2015, 12, 1277–1281. [Google Scholar] [CrossRef]
- Karimzadeh, S.; Matsuoka, M. Building Damage Characterization for the 2016 Amatrice Earthquake Using Ascending–Descending COSMO-SkyMed Data and Topographic Position Index. IEEE J. Sel. Top. Appl. Earth Obs. Remote Sens. 2018, 11, 2668–2682. [Google Scholar] [CrossRef]
- Shi, L.; Sun, W.; Yang, J.; Li, P.; Lu, L. Building Collapse Assessment by the Use of Postearthquake Chinese VHR Airborne SAR. IEEE Geosci. Remote Sens. Lett. 2015, 12, 2021–2025. [Google Scholar] [CrossRef]
- Bai, Y.; Adriano, B.; Mas, E.; Gokon, H.; Koshimura, S. Object-Based Building Damage Assessment Methodology Using Only Post Event ALOS-2/PALSAR-2 Dual Polarimetric SAR Intensity Images. J. Disaster Res. 2017, 12, 259–271. [Google Scholar] [CrossRef]
- Gong, L.; Wang, C.; Wu, F.; Zhang, J.; Zhang, H.; Li, Q. Earthquake-induced building damage detection with post-event sub-meter VHR terrasar-X staring spotlight imagery. Remote Sens. 2016, 8, 887. [Google Scholar] [CrossRef]
- Janalipour, M.; Mohammadzadeh, A. Building Damage Detection Using Object-Based Image Analysis and ANFIS from High-Resolution Image (Case Study: BAM Earthquake, Iran). IEEE J. Sel. Top. Appl. Earth Obs. Remote Sens. 2016, 9, 1937–1945. [Google Scholar] [CrossRef]
- Janalipour, M.; Mohammadzadeh, A. A Fuzzy-GA Based Decision Making System for Detecting Damaged Buildings from High-Spatial Resolution Optical Images. Remote Sens. 2017, 9, 349. [Google Scholar] [CrossRef]
- Janalipour, M.; Mohammadzadeh, A. Evaluation of effectiveness of three fuzzy systems and three texture extraction methods for building damage detection from post-event LiDAR data. Int. J. Digit. Earth 2018, 11, 1241–1268. [Google Scholar] [CrossRef]
- Cooner, A.; Shao, Y.; Campbell, J. Detection of Urban Damage Using Remote Sensing and Machine Learning Algorithms: Revisiting the 2010 Haiti Earthquake. Remote Sens. 2016, 8, 868. [Google Scholar] [CrossRef]
- Gokon, H.; Koshimura, S. Mapping of Building Damage of the 2011 Tohoku Earthquake Tsunami in Miyagi Prefecture. Coast. Eng. J. 2012, 54, 1250006. [Google Scholar] [CrossRef]
- Mas, E.; Bricker, J.; Kure, S.; Adriano, B.; Yi, C.; Suppasri, A.; Koshimura, S. Survey and satellite damage interpretation of the 2013 Super Typhoon Haiyan in the Philippines. Nat. Hazards Earth Syst. Sci. 2015, 15, 805–816. [Google Scholar] [CrossRef]
- Miura, H.; Midorikawa, S.; Matsuoka, M. Building Damage Assessment Using High-Resolution Satellite SAR Images of the 2010 Haiti Earthquake. Earthq. Spectra 2016, 32, 591–610. [Google Scholar] [CrossRef]
- Freire, S.; Santos, T.; Navarro, A.; Soares, F.; Silva, J.; Afonso, N.; Fonseca, A.; Tenedório, J. Introducing mapping standards in the quality assessment of buildings extracted from very high resolution satellite imagery. ISPRS J. Photogramm. Remote Sens. 2014, 90, 1–9. [Google Scholar] [CrossRef]
- Plank, S. Rapid Damage Assessment by Means of Multi-Temporal SAR—A Comprehensive Review and Outlook to Sentinel-1. Remote Sens. 2014, 6, 4870–4906. [Google Scholar] [CrossRef]
- Matsuoka, M.; Nojima, N. Building Damage Estimation by Integration of Seismic Intensity Information and Satellite L-band SAR Imagery. Remote Sens. 2010, 2, 2111–2126. [Google Scholar] [CrossRef]
- Yamaguchi, Y. Disaster monitoring by fully polarimetric SAR data acquired with ALOS-PALSAR. Proc. IEEE 2012, 100, 2851–2860. [Google Scholar] [CrossRef]
- Bai, Y.; Adriano, B.; Mas, E.; Koshimura, S. Building Damage Assessment in the 2015 Gorkha, Nepal, Earthquake Using Only Post-Event Dual Polarization Synthetic Aperture Radar Imagery. Earthq. Spectra 2017, 33, S185–S195. [Google Scholar] [CrossRef]
- Brunner, D.; Lemoine, G.; Bruzzone, L. Earthquake Damage Assessment of Buildings Using VHR Optical and SAR Imagery. IEEE Trans. Geosci. Remote Sens. 2010, 48, 2403–2420. [Google Scholar] [CrossRef]
- Huang, X.; Zhang, L.; Zhu, T. Building Change Detection From Multitemporal High-Resolution Remotely Sensed Images Based on a Morphological Building Index. IEEE J. Sel. Top. Appl. Earth Obs. Remote Sens. 2014, 7, 105–115. [Google Scholar] [CrossRef]
- Bai, Y.; Adriano, B.; Mas, E.; Koshimura, S. Machine learning based building damage mapping from the ALOS-2/PALSAR-2 SAR imagery: Case study of 2016 Kumamoto earthquake. J. Disaster Res. 2017, 12. [Google Scholar] [CrossRef]
- Wieland, M.; Liu, W.; Yamazaki, F. Learning Change from Synthetic Aperture Radar Images: Performance Evaluation of a Support Vector Machine to Detect Earthquake and Tsunami-Induced Changes. Remote Sens. 2016, 8, 792. [Google Scholar] [CrossRef]
- Endo, Y.; Adriano, B.; Mas, E.; Koshimura, S. New Insights into Multiclass Damage Classification of Tsunami-Induced Building Damage from SAR Images. Remote Sens. 2018, 10, 2059. [Google Scholar] [CrossRef]
- Moya, L.; Marval Perez, L.; Mas, E.; Adriano, B.; Koshimura, S.; Yamazaki, F. Novel Unsupervised Classification of Collapsed Buildings Using Satellite Imagery, Hazard Scenarios and Fragility Functions. Remote Sens. 2018, 10, 296. [Google Scholar] [CrossRef]
- Ji, M.; Liu, L.; Buchroithner, M. Identifying Collapsed Buildings Using Post-Earthquake Satellite Imagery and Convolutional Neural Networks: A Case Study of the 2010 Haiti Earthquake. Remote Sens. 2018, 10, 1689. [Google Scholar] [CrossRef]
- Bamler, R. The SRTM Mission—A World-Wide 30 m Resolution DEM from SAR Interferometry in 11 Days. In Photogrammetric Week, Proceedings of the 47 Photogrammetrische Woche, Universitaet Stuttgart, Stuttgart, Germany, 20–24 September 1999; LIDO-Berichtsjahr=1999. Wichmann Verlag: Heidelberg, Germany, 1999; pp. 145–154. [Google Scholar]
- Rabus, B.; Eineder, M.; Roth, A.; Bamler, R. The shuttle radar topography mission—A new class of digital elevation models acquired by spaceborne radar. ISPRS J. Photogramm. Remote Sens. 2003, 57, 241–262. [Google Scholar] [CrossRef]
- OpenStreetMap Contributors. 2017. Available online: https://www.openstreetmap.org (accessed on 10 December 2018).
- Esch, T.; Thiel, M.; Schenk, A.; Roth, A.; Muller, A.; Dech, S. Delineation of Urban Footprints from TerraSAR-X Data by Analyzing Speckle Characteristics and Intensity Information. IEEE Trans. Geosci. Remote Sens. 2010, 48, 905–916. [Google Scholar] [CrossRef]
- Esch, T.; Schenk, A.; Ullmann, T.; Thiel, M.; Roth, A.; Dech, S. Characterization of Land Cover Types in TerraSAR-X Images by Combined Analysis of Speckle Statistics and Intensity Information. IEEE Trans. Geosci. Remote Sens. 2011, 49, 1911–1925. [Google Scholar] [CrossRef]
- Agency, E.S. SNAP-ESA Sentinel Application Platform. 2018. Available online: http://step.esa.int/ (accessed on 10 December 2018).
- Deledalle, C.; Denis, L.; Tupin, F.; Reigber, A.; Jäger, M. NL-SAR: A Unified Nonlocal Framework for Resolution-Preserving (Pol)(In)SAR Denoising. IEEE Trans. Geosci. Remote Sens. 2015, 53, 2021–2038. [Google Scholar] [CrossRef]
- Schmitt, M.; Baier, G.; Zhu, X.X. Potential of Nonlocally filtered Pursuit Monostatic TanDEM-X Data for Coastline Detection. ISPRS J. Photogramm. Remote Sens. 2019, 148, 130–141. [Google Scholar] [CrossRef]
- Yokoya, N.; Zhu, X.X.; Plaza, A. Multisensor coupled spectral unmixing for time-series analysis. IEEE Trans. Geosci. Remote Sens. 2017, 55, 2842–2857. [Google Scholar] [CrossRef]
- Breiman, L. Random forest. Mach. Learn. 2001, 45, 5–32. [Google Scholar] [CrossRef]
- Rodriguez, J.J.; Kuncheva, L.I.; Alonso, C.J. Rotation forest: A new classifier ensemble method. IEEE Trans. Pattern Anal. Mach. Intell. 2006, 28, 1619–1630. [Google Scholar] [CrossRef]
- Rainforth, T.; Wood, F. Canonical Correlation Forests. arXiv, 2015; arXiv:1507.05444. [Google Scholar]
- Clark, M.L.; Buck-Diaz, J.; Evens, J. Mapping of forest alliances with simulated multi-seasonal hyperspectral satellite imagery. Remote Sens. Environ. 2018, 210, 490–507. [Google Scholar] [CrossRef]
- De Castro, A.I.; Torres-Sanchez, J.; Pena, J.M.; Jimenez-Brenes, F.M.; Csillik, O.; Lopez-Granados, F. An Automatic Random Forest-OBIA Algorithm for Early Weed Mapping between and within Crop Rows Using UAV Imagery. Remote Sens. 2018, 10, 285. [Google Scholar] [CrossRef]
- Fedrigo, M.; Newnham, G.J.; Coops, N.C.; Culvenor, D.S.; Bolton, D.K.; Nitschke, C.R. Predicting temperate forest stand types using only structural profiles from discrete return airborne lidar. ISPRS J. Photogramm. Remote Sens. 2018, 136, 106–119. [Google Scholar] [CrossRef]
- Yokoya, N.; Ghamisi, P.; Xia, J.; Sukhanov, S.; Heremans, R.; Tankoyeu, I.; Bechtel, B.; Saux, B.L.; Moser, G.; Tuia, D. Open Data for Global Multimodal Land Use Classification: Outcome of the 2017 IEEE GRSS Data Fusion Contest. IEEE J. Sel. Top. Appl. Earth Obs. Remote Sens. 2018, 11, 1363–1377. [Google Scholar] [CrossRef]
- Xia, J.; Yokoya, N.; Iwasaki, A. Hyperspectral Image Classification With Canonical Correlation Forests. IEEE Trans. Geosci. Remote Sens. 2017, 55, 421–431. [Google Scholar] [CrossRef]
- Adriano, B.; Hayashi, S.; Gokon, H.; Mas, E.; Koshimura, S. Understanding the Extreme Tsunami Inundation in Onagawa Town by the 2011 Tohoku Earthquake, Its Effects in Urban Structures and Coastal Facilities. Coast. Eng. J. 2016, 58, 1640013. [Google Scholar] [CrossRef]


| Dataset | Acquisition Date | Sensor | Images Bands |
|---|---|---|---|
| Pre-event | 2018-05-02 | ALOS-2 PALSAR-2 | HH and HV |
| 2018-05-26 | Sentinel-1 | VV and VH | |
| 2018-06-07 | Sentinel-1 | VV and VH | |
| 2018-08-08 | ALOS-2 PALSAR-2 | HH and HV | |
| 2018-09-17 | Sentinel-2 | R, G, B, and NIR | |
| Post-event | 2018-10-01 | PlanetScope | R, G, B, and NIR |
| 2018-10-01 | ALOS-2 PALSAR-2 | HH and HV | |
| 2018-10-02 | Sentinel-2 | R, G, B, and NIR | |
| 2018-10-03 | ALOS-2 PALSAR-2 | HH and HV | |
| 2018-10-05 | Sentinel-1 | VV and VH | |
| 2018-10-17 | Sentinel-1 | VV and VH |
| Class | Train | Test |
|---|---|---|
| Destroyed | 2996 | 1284 |
| Damaged | 3147 | 1348 |
| Possibly damaged | 3625 | 1553 |
| No damage | 43,056 | 18,453 |
| Pre-Event | Post-Event | Others | ||||||
|---|---|---|---|---|---|---|---|---|
| S1 | S2 | ALOS-2 | S1 | S2 | ALOS-2 | Planet | DEM | |
| Scenario 1 | √ | √ | ||||||
| Scenario 2 | √ | √ | ||||||
| Scenario 3 | √ | √ | √ | √ | ||||
| Scenario 4 | √ | √ | √ | √ | √ | |||
| Scenario 5 | √ | √ | √ | √ | ||||
| Scenario 6 | √ | √ | √ | |||||
| Scenario 7 | √ | √ | √ | √ | √ | √ | √ | |
| Scenario 8 | √ | √ | √ | √ | √ | √ | √ | √ |
| Class | RFs | RoFs | CCFs | ||||
|---|---|---|---|---|---|---|---|
| PA% | UA% | PA% | UA% | PA% | UA% | ||
| Scenario 1 | DE | 35.77 | 70.82 | 35.70 | 68.02 | 40.18 | 71.44 |
| DA | 4.71 | 37.65 | 7.08 | 31.24 | 5.55 | 41.18 | |
| PD | 21.61 | 47.25 | 22.97 | 45.25 | 20.25 | 48.01 | |
| ND | 98.36 | 85.98 | 97.68 | 86.37 | 98.35 | 86.10 | |
| OA: 83.97 ± 0.14 | OA: 83.65 ± 0.10 | OA: 84.17 ± 0.13 | |||||
| AA: 40.11 ± 0.52 | AA: 40.86 ± 0.41 | AA: 41.08 ± 0.53 | |||||
| Scenario 2 | DE | 30.80 | 77.98 | 35.95 | 77.70 | 40.93 | 78.00 |
| DA | 4.09 | 32.19 | 6.28 | 32.02 | 4.94 | 34.94 | |
| PD | 0.89 | 19.85 | 1.04 | 22.37 | 1.29 | 24.15 | |
| ND | 99.11 | 83.55 | 98.84 | 84.02 | 98.92 | 84.16 | |
| OA: 82.84 ± 0.11 | OA: 83.05 ± 0.09 | OA: 83.34 ± 0.09 | |||||
| AA: 33.72 ± 0.37 | AA: 35.52 ± 0.34 | AA: 36.52 ± 0.33 | |||||
| Scenario 3 | DE | 45.20 | 83.62 | 44.85 | 81.89 | 59.00 | 85.91 |
| DA | 8.86 | 46.99 | 14.37 | 41.00 | 8.98 | 49.07 | |
| PD | 22.24 | 50.57 | 25.39 | 47.46 | 19.58 | 51.53 | |
| ND | 98.66 | 86.67 | 97.89 | 87.55 | 98.78 | 87.13 | |
| OA: 85.04 ± 0.14 | OA: 84.93 ± 0.16 | OA: 85.74 ± 0.14 | |||||
| AA: 43.74 ± 0.49 | AA: 45.62 ± 0.53 | AA: 46.58 ± 0.49 | |||||
| Scenario 4 | DE | 55.78 | 84.69 | 55.25 | 85.66 | 66.02 | 86.74 |
| DA | 65.08 | 60.54 | 64.44 | 60.33 | 60.88 | 62.82 | |
| PD | 43.21 | 62.04 | 43.07 | 61.43 | 41.15 | 62.12 | |
| ND | 98.92 | 94.77 | 98.91 | 94.66 | 99.17 | 94.70 | |
| OA: 90.64 ± 0.15 | OA: 90.55 ± 0.18 | OA: 91.03 ± 0.14 | |||||
| AA: 65.75 ± 0.55 | AA: 65.42 ± 0.88 | AA: 66.81 ± 0.55 | |||||
| Class | RFs | RoFs | CCFs | ||||
|---|---|---|---|---|---|---|---|
| PA% | UA% | PA% | UA% | PA% | UA% | ||
| Scenario 5 | DE | 39.51 | 82.70 | 40.08 | 78.69 | 47.62 | 83.43 |
| DA | 5.41 | 53.23 | 9.01 | 46.17 | 6.66 | 57.23 | |
| PD | 37.02 | 60.72 | 32.06 | 58.00 | 36.70 | 62.82 | |
| ND | 99.28 | 87.49 | 98.78 | 87.37 | 99.28 | 87.91 | |
| OA: 86.03 ± 0.12 | OA: 85.53 ± 0.19 | OA: 86.54 ± 0.14 | |||||
| AA: 45.30 ± 0.50 | AA: 44.98 ± 0.67 | AA: 47.57 ± 0.46 | |||||
| Scenario 6 | DE | 50.28 | 83.11 | 56.45 | 85.36 | 62.34 | 85.25 |
| DA | 8.40 | 43.02 | 12.40 | 43.62 | 10.88 | 47.20 | |
| PD | 2.29 | 33.01 | 2.78 | 32.96 | 3.26 | 38.54 | |
| ND | 99.17 | 85.16 | 98.95 | 85.83 | 99.11 | 86.04 | |
| OA: 84.35 ± 0.11 | OA: 84.79 ± 0.13 | OA: 85.20 ± 0.11 | |||||
| AA: 40.03 ± 0.44 | AA: 42.64 ± 0.49 | AA: 43.90 ± 0.41 | |||||
| Scenario 7 | DE | 53.64 | 86.53 | 54.80 | 86.64 | 64.40 | 89.21 |
| DA | 11.54 | 62.90 | 19.88 | 53.47 | 12.53 | 66.29 | |
| PD | 38.62 | 62.37 | 32.35 | 56.94 | 36.80 | 64.60 | |
| ND | 99.25 | 88.77 | 98.61 | 89.02 | 99.46 | 89.22 | |
| OA: 87.28 ± 0.19 | OA: 86.90 ± 0.16 | OA: 88.00 ± 0.16 | |||||
| AA: 50.76 ± 0.74 | AA: 51.41 ± 0.61 | AA: 53.30 ± 0.59 | |||||
| Scenario 8 | DE | 60.74 | 87.18 | 63.47 | 86.03 | 67.97 | 89.25 |
| DA | 66.29 | 63.11 | 68.86 | 62.49 | 53.06 | 66.32 | |
| PD | 54.06 | 70.66 | 56.42 | 71.09 | 50.89 | 69.61 | |
| ND | 99.40 | 95.84 | 99.14 | 96.43 | 99.77 | 94.68 | |
| OA: 92.12 ± 0.16 | OA: 92.39 ± 0.16 | OA: 91.83 ± 0.23 | |||||
| AA: 70.12 ± 0.68 | AA: 71.97 ± 0.68 | AA: 67.92 ± 0.99 | |||||
© 2019 by the authors. Licensee MDPI, Basel, Switzerland. This article is an open access article distributed under the terms and conditions of the Creative Commons Attribution (CC BY) license (http://creativecommons.org/licenses/by/4.0/).
Share and Cite
Adriano, B.; Xia, J.; Baier, G.; Yokoya, N.; Koshimura, S. Multi-Source Data Fusion Based on Ensemble Learning for Rapid Building Damage Mapping during the 2018 Sulawesi Earthquake and Tsunami in Palu, Indonesia. Remote Sens. 2019, 11, 886. https://doi.org/10.3390/rs11070886
Adriano B, Xia J, Baier G, Yokoya N, Koshimura S. Multi-Source Data Fusion Based on Ensemble Learning for Rapid Building Damage Mapping during the 2018 Sulawesi Earthquake and Tsunami in Palu, Indonesia. Remote Sensing. 2019; 11(7):886. https://doi.org/10.3390/rs11070886
Chicago/Turabian StyleAdriano, Bruno, Junshi Xia, Gerald Baier, Naoto Yokoya, and Shunichi Koshimura. 2019. "Multi-Source Data Fusion Based on Ensemble Learning for Rapid Building Damage Mapping during the 2018 Sulawesi Earthquake and Tsunami in Palu, Indonesia" Remote Sensing 11, no. 7: 886. https://doi.org/10.3390/rs11070886
APA StyleAdriano, B., Xia, J., Baier, G., Yokoya, N., & Koshimura, S. (2019). Multi-Source Data Fusion Based on Ensemble Learning for Rapid Building Damage Mapping during the 2018 Sulawesi Earthquake and Tsunami in Palu, Indonesia. Remote Sensing, 11(7), 886. https://doi.org/10.3390/rs11070886