Article

Landsat-8 Operational Land Imager Design, Characterization and Performance

Ball Aerospace & Technology Corp., 1600 Commerce Street, Boulder, CO 80301, USA
*
Author to whom correspondence should be addressed.
Remote Sens. 2014, 6(11), 10286-10305; https://doi.org/10.3390/rs61110286
Submission received: 18 July 2014 / Revised: 24 September 2014 / Accepted: 27 September 2014 / Published: 24 October 2014
(This article belongs to the Special Issue Landsat-8 Sensor Characterization and Calibration)

Abstract

:
The Operational Land Imager (OLI) on Landsat-8 represents a generational change from heritage Landsat instruments in its design, while it maintains data continuity with the 40+ year Landsat data archive. It preserves the 30-m ground sample distance, 185-km swath width and VIS/NIR/SWIR spectral bands. Furthermore, data continuity resulted from extensive pre-launch and on-orbit calibration and characterization campaigns. This paper presents an overview of the OLI design, the pre-launch characterization results and the on-orbit performance.

Graphical Abstract

1. Introduction

1.1. Landsat Mission Overview

Landsat-8 represents the most recent satellite in a series of Earth remote sensing missions dating back to 1972. These satellites have collected and archived moderate resolution data of the entire Earth’s land surface long enough to be useful for monitoring trends and evaluating how land use has changed. Applications of Landsat data include agriculture, land mapping and change detection to uses in fresh and coastal waters and snow and ice [1].
The Operational Land Imager (OLI) measures in nine spectral bands in the visible and short-wave infrared spectral regions. It is complemented by the Thermal Infrared Sensor (TIRS), which measures two long-wave infrared channels, which is described elsewhere in this issue. The two instruments fly on a dedicated spacecraft that has the agility to look off-nadir, turn to look at the Sun through a diffuser port and image the Moon. Over four hundred WRS-2 scenes (185 km by 180 km) are collected each day (>550 daily on average), processed at the United State Geological Survey’s (USGS) Earth Resources Observation and Science (EROS) Center and made available for free to the public.

1.2. Landsat-8 History

As Landsat-7 was in its final development, it became clear that advances in focal plane technology might allow a new class of instruments to meet the Landsat community needs. NASA launched the Advanced Land Imager (ALI) [2] on the EO-1 spacecraft as a demonstration of this pushbroom architecture in November 2000. ALI successfully demonstrated the concept, and its focal plane modules served as the starting point for developing the OLI modules. ALI also provided insights into risks and issues in calibration, stability and contamination control.
In parallel, NASA began work on procuring Landsat-8. These initial efforts focused on a data buy model that was later abandoned. The U.S. Government also looked at putting Landsat on the National Polar-orbiting Operational Environmental Satellite System (NPOESS) before ultimately deciding on a dedicated mission [3].
During these gyrations, concerns arose about the value of the thermal band(s). They were removed and then added back to the mission, but during the interregnum, the architectural split between OLI and TIRS was set. OLI moved out ahead of TIRS and began development in 2007 by Ball Aerospace & Technologies Corp. under contract with NASA’s Goddard Space Flight Center.

1.3. Operational Land Imager Key Requirements

Maintaining continuity with the data archive placed significant constraining requirements on OLI. Spectrally and spatially, the spectral bands and ground sample distance (GSD) needed to match the existing data sets. OLI also had to be accurately radiometrically calibrated in a method traceable to National Institute of Standards and Technology (NIST), so it could be on the same scale as other remote sensing data sets and previous Landsat missions. Finally, its images needed to be geolocated well enough to allow direct comparison at the pixel level between data taken with OLI and data taken years ago. Key spatial, radiometric and geometric requirements are summarized in Table 1 and Figure 1.
Table 1. Key instrument parameters (a); selected top level requirements (b). The individual bands and their spectral (center wavelength (CW) and bandwidth), spatial (ground sample distance (GSD)) and signal-to-noise (SNR) requirements.
(a)
(a)
Key Instrument ParameterRequirement
Cross-track field of view>185 km
Absolute geodetic accuracy (no ground control points)<65 m
Relative geodetic accuracy (no ground control points)<25 m
Geometric accuracy (with ground control points)<12 m
Absolute radiometric uncertainty (1-sigma)<5%
Absolute reflectance uncertainty (top-of-atmosphere 1-sigma)<3%
Radiometric stability over 16 days, Bands 1–8 (2-sigma)<1%
Radiometric stability over 16 days Band 9 (2-sigma)<2%
Polarization sensitivity (defined by linear Polarization Factor)<0.05
Pixel-to-pixel uniformity, full field<0.5%
Streaking (adjacent pixel uniformity)<0.005
(b)
(b)
Band NameCenter Wavelength (nm)Bandwidth (nm)GSD(m)SNR
Coastal/Aerosol4432030130
Blue4826530130
Green5627530100
Red655503090
NIR865403090
SWIR1 *161010030100
SWIR2 *220020030100
Pan5901801580
Cirrus *1375303050
Notes: * SWIR Bands. All other bands are Visible/NIR.
Figure 1. OLI spectral bands and reference spectra. The coastal/aerosol and cirrus bands are new for OLI. The NIR and PAN bands are narrower than Landsat-7 and shifted to improve contrast. All other bandpasses are similar to the heritage Landsat-4, -5 and -7 instruments.
Remotesensing 06 10286 g001

2. OLI Design Overview

2.1. Top Level Architecture

The OLI is a pushbroom instrument that relies on fourteen individual overlapping focal plane modules to cover the swath width. Each module includes rows of detectors for each spectral band with interference filters mounted to the module to provide the spectral separation. This architecture eliminates the need for a high reliability scanner subsystem that could fail, like the scan line corrector failed on Landsat-7 [4].
Another key element of the architecture is an optical design with the aperture stop at the front of the optics [5]. This keeps the on-board diffusers at a reasonable size. Scaling the telecentric ALI optical design would have resulted in solar diffusers on the order of a 1-m diameter, which would have been prohibitive for mass, volume, manufacturing and pre-launch calibration with a heliostat. Additionally, since the diffusers are located close to the entrance pupil, the viewed portions of the diffusers are nearly identical for all detectors, which helps with calibration uniformity, by reducing the impact of diffuser spatial non-uniformity. These combined elements allow OLI to meet the needed lifetime calibration requirements with the reasonable anticipation that the instrument will provide high quality data well beyond its design life.
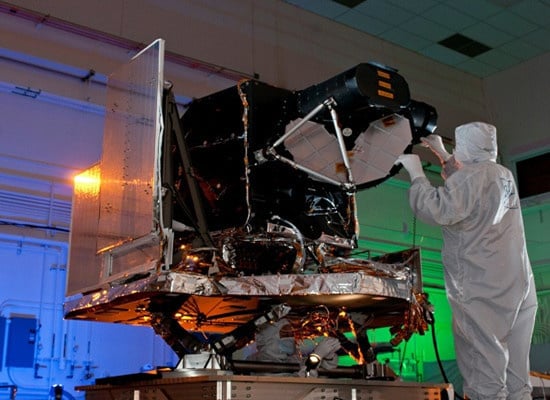
Figure 2 shows two views of the completed instrument. The photo on the left shows the OLI without its final thermal blankets. The technician is standing in front of the main aperture (which is covered in both photos), and the backs of the solar diffuser panels (bright aluminum) are clearly visible. The radiator panels are to the left, and the cabling on the baseplate is clearly visible. The photo on the right shows the OLI fully buttoned up under its thermal blankets and with the ‘remove before flight’ aperture covers installed.
Figure 2. OLI without the thermal blankets (left); OLI buttoned up for shipping (right).
Remotesensing 06 10286 g002
Figure 3 presents the OLI block diagram. Light enters the front aperture in the calibration subsystem from one of several different sources. The instrument can look at the Earth, the Moon, internal stimulation lamps or the Sun off of one of two reflective diffusers. The light reflects off four mirrors in the telescope, which focus it onto the focal plane array. The telescope subsystem is supported by a baseplate that reduces the mechanical interface with the spacecraft to a simple three-point mount. Once the light hits the focal plane array, it is converted into electrons, the signal is digitized in the focal plane electronics and transmitted to the spacecraft.
The focal plane array consists of fourteen individual focal plane modules aligned in a staggered line, so that they overlap each other. Each module consists of nine rows of detectors with individual spectral filters over them for spectral band separation and a tenth masked row for looking at the offset behavior of the HgCdTe bands. The focal plane array is cooled to <210 K using a heat pipe connected to a radiator. The plane array (FPA) is also mounted to focus mechanisms that allow OLI’s focus to be adjusted on-orbit if necessary.
The instrument is controlled by the instrument support electronics (ISE). These electronics receive power and commands from the spacecraft, control the mechanisms and heaters and manage the focal plane electronics.
Figure 3. OLI block diagram. Light enters the aperture from either the Earth or one of many calibration sources, passes through the telescope to the focal plane array, where it is digitized and the signal transmitted to the spacecraft.
Remotesensing 06 10286 g003

2.2. Calibration Subsystem

Given the need for highly accurate calibration and lifetime stability, OLI emphasizes calibration with full aperture, full optical path calibration sources. This ensures that changes in any part of the instrument are monitored and can be corrected in the calibration data processing. By having multiple sources, the calibration team can separate changes in the instrument from changes in the calibration targets. Each source also allows for different calibration parameter measurements.

2.2.1. Solar Diffuser Assembly

The solar diffuser assembly consists of a wheel that can be rotated to one of three positions. It is mounted between two baffles and in front of the shutter assembly. See Figure 4.
Most of the time, the solar diffuser assembly remains in the open position, and the instrument looks at the Earth. However, once every eight days, the working diffuser is moved into place, and the spacecraft turns, so that the Sun comes down the solar port, reflects off the SpectralonTM diffuser and enters the instrument. The incident and viewing angles on the diffuser are constant, and so, a bidirectional reflectance distribution function (BRDF) angular measurement is only required at one illumination angle. The reflectance at these angles was measured pre-launch on the diffuser, and then, the radiance off the diffuser was measured during the pre-launch heliostat test (Section 3.2).
Figure 4. Expanded calibration assembly. The solar diffuser assembly mounts between the two lightshades and consists of a wheel with three possible positions.
Remotesensing 06 10286 g004
In addition to the working diffuser, a second pristine diffuser can be rotated into place. This diffuser is used once every six months and spends the rest of the time protected inside the diffuser assembly wheel. As a result, it does not significantly degrade with contamination and UV exposure. Comparing the signals from the two diffusers gives a good measure of how much the working diffuser has degraded.
The solar diffuser calibration measures the instrument gain, uniformity and stability. Gain is calculated from a two-point calibration from the instrument’s response to a bright radiance level (solar illuminated) and to a dark radiance level. Since the diffuser is in the near field, the viewed areas of individual detectors overlap significantly, and uniformity can be easily measured. Stability is measured by comparing diffuser measurements over time, while using the pristine diffuser to correct for working diffuser degradation.

2.2.2. Shutter Assembly

The shutter assembly, also shown in Figure 4, can close off the aperture, so that light and contaminants do not enter the instrument. The stray light test (Section 3.3) confirmed that light could not be detected in the closed position.
The shutter measures the instrument offset, uniformity and dark current drift. The offset is the OLI signal in the absence of light and, thus, is directly measured for every detector with the shutter closed. The uniformity of the offset is measured, because the shutter is both a near-field target and highly uniform. Finally, taking an extended data collection allows drifts in the dark current of the SWIR bands to be observed as offset changes.

2.2.3. Stim Lamp Assemblies

Two stim lamp assemblies are mounted to the aperture stop baffle. They consist of six individual lamps per assembly: three tied to Side A of the instrument electronics and three tied to Side B. In combination with the diffuser observations, the lamp observations allow multiple signal levels in all spectral bands and guarantee a minimum signal (>40 counts) in all spectral bands. The stim lamps are current controlled, and both the voltage and current are included in the telemetry, so that the ground can monitor the change in filament resistance (and thus, aging) over the lifetime.
Light from the stim lamp bulbs goes through a transmissive diffuser, which spreads the light out, so that it illuminates the entire focal plane array. Monitoring diodes (primary and redundant) look at the light reflected from the diffuser to provide another measure of how much the output has changed over time. A photo of the completed assemblies and a schematic are shown in Figure 5.
Figure 5. The two stim lamp assemblies mounted to the aperture baffle (left); a schematic of the stim lamp assemblies showing the six bulbs and the monitoring diode (which looks at the stim lamp diffuser) (right).
Remotesensing 06 10286 g005
The combination of multiple lamps, the monitoring diode and the current and voltage telemetry provides multiple checks on whether a change in signal represents a change in the stim lamp assemblies or a change in the main OLI instrument. Additionally, it can be compared to the solar diffuser measurements.
While bulbs are traditionally not as stable as a diffuser and have a known change in output with gravity, the stim lamp assemblies provide advantages in pre-launch monitoring (where they can be used multiple times during the instrument and observatory integration and test campaigns) and intra-orbit monitoring. For OLI, the stim lamps are used once per day to give an assessment of stability independent of the diffusers.

2.2.4. Other Calibration Sources

While not part of the instrument hardware, OLI does use other sources for calibration. Chief among these are vicarious calibration of the Earth and Moon. OLI also used stars during the initial instrument checkout period to confirm its pointing models. For the stars and Moon, the observatory rotated to allow OLI to scan the celestial targets slowly. The star locations were compared to those predicted by the pointing model. In the checkout period, the Moon was used to check stray light, as described in Section 4.3. Vicarious calibration is discussed extensively elsewhere in this volume.

2.3. Telescope Subsystem

The telescope is a front-aperture four mirror anastigmat design with an effective focal length of 886 mm at the center of the field of view (FOV). The Zerodur mirrors are held by a graphite composite bench (Figure 6). This provides excellent thermal stability, but moisture expansion had to be accounted for in pre-launch testing. This was done by using the focus mechanisms that supported the FPA. These three mechanisms provided piston, tip and tilt as needed. Ultimately, pre-launch testing established that only the piston was needed to account for moisture changes.
Figure 6. The telescope bench, prior to the installation of optics (left); the telescope mirrors, with the engineers and technicians that built them (right).
Remotesensing 06 10286 g006

2.4. Focal Plane Subsystem (FPS)

The focal plane subsystem consists of the focal plane array (FPA) and the focal plane electronics (FPE). The focal plane array consists of fourteen focal plane modules (FPMs) mounted in a housing that keeps the detectors <210 K while mounted to a 293-K optical bench. Figure 7 shows the FPA. The right photo gives a close-up of the spectral filters over the individual modules. Figure 8 shows an individual module and an individual filter assembly.
Figure 7. The full focal plane array (left); a close up of the focal plane modules, highlighting the spectral filters (right).
Remotesensing 06 10286 g007
Figure 8. An individual focal plane module (left); an individual spectral filter assembly (right).
Remotesensing 06 10286 g008
The individual FPMs consist of a silicon photodiode (PIN) array and an HgCdTe array mounted to a single readout chip. Each multispectral band has 494 detectors per module, with the PAN band having twice as many. Each detector is also redundant. One of two detectors can be selected for readout for the silicon bands (1–5, 8), and one of three detectors can be selected for the HgCdTe bands (6–7, 9). This redundancy increases manufacturing yield and improves on-orbit reliability, but does introduce an offset that must be accounted for by using the pixel select map (which identifies which detector elements are actively read out) in the geolocation process.
The focal plane integration time is commandable from 90 microseconds to 3600 microseconds (the normal integration time for the MS bands). This enables a linearity check when viewing a constant radiometric target.
Additionally, the focal plane electronics digitize the signal to 14 bits. Due to data rate limitations, only 12 bits are sent to the ground. However, OLI can be commanded to use the 12 highest bits or the 12 lowest bits. Normally, imaging uses the 12 highest bits to preserve the full dynamic range. Calibration when looking at dark targets uses the 12 lowest bits to better see the noise and to obtain a better dark average value. Looks at the stim lamps alternate between the upper and lower 12 bits every other day.

2.5. Instrument Support Electronics

The instrument support electronics provides the “brains” of OLI. It receives commands from the spacecraft and delivers telemetry back. It commands the mechanisms, stim lamps and heaters. It provides the parameters to configure the focal plane electronics for data collection. It also conditions power from the spacecraft. The ISE is fully Side A/Side B redundant to improve reliability over the five-year mission life. Figure 9 shows the integrated electronics box.
Figure 9. The instrument support electronics without cabling.
Remotesensing 06 10286 g009

2.6. Thermal Control

The entire instrument is thermally controlled to maintain performance stability throughout the orbit and its mission life. The telescope is controlled by heaters and is under thermal blankets for isolation from the cold space environment. The focal plane array and focal plane electronics are both connected to heat pipes, which convey the heat from them to the cold side radiators. Figure 10 shows these heat pipes and radiators prior to installation with the instrument.
Figure 10. The OLI radiators and heat pipes prior to installation. The white blankets provide insulation to the back of the radiators.
Remotesensing 06 10286 g010

3. OLI Pre-Launch Characterization and Calibration

Prior to launch, OLI underwent an extensive (multiple month) characterization and calibration campaign. This effort was dedicated to not only showing that OLI met its requirements, but to gathering data used in the calibration and geolocation algorithms and to understanding any behaviors or features that could appear in the on-orbit data. These data sets also allowed the instrument behavior to be trended over time.

3.1. Radiometric Characterization

The radiometric performance of the instrument was characterized by looking at a large integrating sphere that filled the OLI aperture (Figure 11). The sphere had sufficient brightness to measure OLI’s full dynamic range in all bands. This allowed us to characterize the dynamic range and linearity. Additionally, linearity was cross-checked by setting the sphere to a single stable output radiance and varying the integration times of the detectors (an “integration time sweep”). We measured the signal-to-noise ratio at multiple sphere radiance levels at the same time. These two independent methods provided inputs to a small non-linearity correction in the calibration algorithm.
In addition, the sphere allowed us to characterize uniformity. The uniformity of the sphere’s central portion was mapped to better than 0.25% 1σ. The test also scanned the OLI, so that every detector observed the central portion of the sphere.
Figure 11. The large integrating sphere used to characterize the instrument’s radiometric response.
Remotesensing 06 10286 g011
The sphere was also used to characterize stability and repeatability. OLI collected data while looking at the sphere at hot, cold and nominal operating temperatures over the course of several weeks. These results were compared to confirm that as long as the focal plane remained under temperature control, the instrument performance remained stable.

3.2. Radiometric Calibration

For radiometric calibration, the Landsat program established traceability to NIST through both the sphere radiance and the BRDF of the diffuser panels. Transfer radiometers and spheres were characterized at NIST and then used to characterize the large integrating sphere. Additionally, NASA hosted a calibration round robin that included multiple radiometers and spheres from NIST, the University of Arizona, Ball Aerospace and the Goddard Space Flight Center (Figure 12) [6].
Figure 12. The radiometers and spheres used in the radiometric round robin calibration test.
Remotesensing 06 10286 g012
The directional reflectance (at the expected illumination and view angles) of the diffuser panels was also measured by the University of Arizona. These measurements took place in their goniometric characterization facility and were referenced to a Spectralon panel, whose BRDF had been characterized at NIST. This established a reflectance traceability in addition to the radiometric traceability.
Once good NIST traceability had been established, the dominant uncertainty in radiometric and reflectance calibration is the transfer between ground measurements and on-orbit measurements. To reduce this uncertainty, OLI used a heliostat to illuminate both diffusers with sunlight prior to launch. Using the Sun as a ground target reduces error terms due to differences between ground and on-orbit targets in spectral response, stray light and angular extent. The uncertainties introduced due to atmospheric transmission effects can be bounded by simultaneously measuring the atmospheric transmission with solar radiometers. This technique was pioneered by SeaWiFS [7,8].
Figure 13 illustrates the heliostat facility. It consists of two roof-top mirrors to track the Sun and steer the solar beam through a skylight down off a fold mirror and then through a window into the chamber. The transmission of the entire system is characterized pre-test by putting a radiometer inside the chamber in place of the instrument. Then, during the actual measurements, solar radiometers on the roof measure the atmospheric transmission. These effects can be subtracted out, with a residual uncertainty estimated to be about 2%. Additional details are included in Markham et al. [9] in this issue.
Figure 13. A cartoon of the heliostat facility, showing how sunlight is steered from the building roof into the thermal vacuum chamber (a); the rooftop set up of the heliostat during alignment and checkout (b); the OLI solar diffuser in its baffle while illuminated by the Sun from the heliostat (c).
Remotesensing 06 10286 g013

3.3. Spatial Characterization

The OLI underwent extensive pre-launch spatial characterization. At the telescope level of assembly, stray light was measured in Ball Aerospace’s Stray Light Test facility (Figure 14). This facility provides a monochromatic collimated light source and extensive baffling to eliminate all scatter sources other than the instrument under test. For OLI, this test was performed using a dummy focal plane (same physical shape with more sensitive detectors) instead of the flight focal plane, for greater sensitivity. The result was that we were able to measure stray light signals nine orders of magnitude below the source signal and, therefore, accurately map out the stray light response well beyond the instrument’s baffles. The stray light model was correspondingly correlated with the measurements and used to confirm that on-orbit stray light would be insignificant (Figure 15).
Figure 14. Stray light facility schematic. The instrument (left) sits inside extensive baffling around it and between it and the light source (right) to ensure that all stray light is from the instrument and not the facility.
Remotesensing 06 10286 g014
Figure 15. Stray light results. The scans (at three wavelengths, labeled by color in the plot) match the model (dashed lines) quite well for several orders of magnitude of the stray light response (point spread relative response, or PSRR).
Remotesensing 06 10286 g015
At the instrument level of assembly, the OLI underwent extensive spatial characterization. Both the instrument and the entire test set were inside Ball Aerospace’s large Brutus thermal vacuum chamber in order to eliminate atmosphere and temperature effects that could have resulted in less precise measurements. The spatial tests consisted of illuminating the OLI aperture with a variety of targets on a spatial mask (Figure 16) that could be scanned in two dimensions. The different shapes allow for characterization of the edge response in the x and y directions, characterization of the ghosting/stray light from an extended target, checks on coregistration, characterization of the response to bright point sources (bright target recovery) and a mapping of the pointing of individual pixels on all fourteen FPMs. The instrument could also be rotated to allow spatial characterization across the entire field of view. Sample results of the edge response are in Figure 17.
Figure 16. Spatial testing. The figure on the left shows how light from a collimated source (left) is expanded and projected to the instrument (right). The figure on the right shows the spatial mask with the various spatial targets that were used to characterize the OLI spatial response.
Remotesensing 06 10286 g016
Figure 17. Spatial testing results. The edge response meets all slope, extended edge distance and sharpness requirements.
Remotesensing 06 10286 g017

3.4. Spectral Characterization

The dominant determinant of the spectral response of OLI is due to the interference filters mounted on the focal planes. While the spectral response of the mirrors and detectors do contribute, these responses vary slowly across the bandpasses of interest. The filters, representative mirror samples and sample detectors were measured to reduce risk and provide a check of higher level measurements.
The out-of-band response of OLI was measured at the focal plane module level. This was due to the difficulty in measuring such small signals (the out of band response was typically 4–6 orders of magnitude below the peak signal response) with the flight electronics.
The in-band response was measured at the instrument level with a spectrometer. OLI was in a thermal vacuum with the spectrometer outside the chamber looking through a window (Figure 18). The window spectral response was characterized so that its effects could be subtracted from the data. The resulting spectral responses matched component measurements quite well. See Barsi et al. [10] in this issue for more details.
Figure 18. The spectral measurement assembly in front of the sphere. The gold box attached to the chamber is a light shade.
Remotesensing 06 10286 g018

3.5. Polarization Characterization

The OLI polarization sensitivity was characterized at the full instrument level with the instrument in a thermal vacuum environment. The test set-up was nearly identical to the radiometric sphere calibration, except a large sheet polarizer (Figure 19) was mounted in a rotation stage in front of the thermal vacuum chamber window. This polarizer was rotated through 360 degrees, with measurements made every 15 degrees. The resulting change in the OLI signal determined the OLI polarization sensitivity (Figure 20). This test was repeated at multiple field angles, and the resulting polarization sensitivity was less than 0.02 for all bands and field angles.
Figure 19. The sheet polarizer used to characterize the OLI polarization sensitivity.
Remotesensing 06 10286 g019
Figure 20. Pre-launch polarization results. These show that OLI’s polarization sensitivity is well below the required 5%. The “predict” and “worst case” numbers come from optical modeling. The measured values are from the instrument level test.
Remotesensing 06 10286 g020

4. OLI On-Orbit Performance

Once on-orbit, the OLI underwent a three-month activation and checkout period. At the end of this phase, the Landsat observatory was turned over to USGS for on-going operations. Its on-going performance is discussed extensively in other papers in this volume. This section discusses some of the results from the activation and checkout phase.

4.1. Functional Performance

OLI achieved full operations and first light thirty-five days after launch. During the remainder of the activation period, the instrument operated smoothly. We determined that it was in focus and did not need to have the focus mechanisms moved. Only minor adjustments to thermal set points were required. In its first year of operation, OLI has only had two operational anomalies.
The first anomaly that we discovered was that it was possible to interrupt the process that determined which detectors were selected for use and load a corrupted selection map. This resulted in redundant detectors being used when the primary detectors should have been used, and vice versa. We quickly established a method to eliminate this interruption possibility. The ground operators also now routinely confirm that the selection map is correct.
The second anomaly was that it was possible for radiation hits in certain memory locations to trigger OLI’s automatic safety procedure. This was ultimately an algorithm problem in one of the FPGAs and has been fixed by a software patch.

4.2. Radiometric Performance

On-orbit radiometric performance matched pre-launch predictions and met all requirements. Figure 21 shows the measured SNR at the defined typical radiance levels for both the 12-bit data and the full 14-bit data (which highlights the noise more). These requirements exceed 1.5 × the required SNR.
Figure 21. The signal-to-noise ratio exceeded the requirements even when uncertainties were included (figure courtesy of Brian Markham/Goddard Space Flight Center (GSFC)).
Remotesensing 06 10286 g021
During the checkout period, OLI conducted calibration activities nearly every day. These established the uncertainty baseline, as well as the instrument’s initial stability. Traditionally, instruments show the most change immediately post-launch [11], but OLI’s change has been quite small—well less than 1%, as shown in Figure 22.
Figure 22. Trending using the working stim lamp over the checkout period shows very small changes. Results with other calibration sources are similar (figure courtesy of Brian Markham/GSFC).
Remotesensing 06 10286 g022

4.3. Spatial Performance

In addition to examining radiometry during the checkout period, the OLI calibration/validation team examined its spatial performance. This was done by looking at stars, looking at the edge of the Moon (Figure 23) and looking at a variety of ground targets. The resulting assessment (described in another paper in this volume) showed that coregistration (Figure 24) and pointing are better than a single pixel.
Figure 23. Lunar image with stretched edge response showing that the stray light falls off quickly (image and analysis courtesy of Raviv Levy/GSFC). The signal drops quickly with distance from the Moon edge.
Remotesensing 06 10286 g023
Figure 24. Coregistration for both imagery lines and individual samples was well below a quarter pixel (plot courtesy of Jim Storey, USGS/EROS).
Remotesensing 06 10286 g024

5. Summary

The Operational Land Imager has successfully moved Landsat into the pushbroom sensor era. The design has proven to be robust. An extensive pre-launch characterization and calibration effort provided data necessary to understand the instrument well and demonstrated stray light well below the requirements, SNRs of several hundred, sharp edge response and high quality calibration. On-orbit performance has been excellent, as demonstrated by stability trending and lunar views. OLI is thus a worthy continuation of the Landsat heritage.

Acknowledgments

This paper summarizes the work of literally hundreds of people at Ball Aerospace & Technologies Corp., Celestial Reasonings, the University of Arizona, NASA’s Goddard Space Flight Center and USGS’s EROS Center. Ball Aerospace’s work was performed under NASA Contract NNG07HW18C and continues under USGS Contract G13PC00010.

Author Contributions

Edward Knight provided the majority of the writing of this paper. Geir Kvaran provided write ups in the calibration sections.

Conflicts of Interest

The authors declare no conflict of interest.

References

  1. Roy, D.P.; Wulder, M.A.; Loveland, T.R.; Woodcock, C.E.; Allen, R.G.; Anderson, M.C.; Helder, D.; Irons, J.R.; Johnson, D.M.; Kennedy, R.; et al. Landsat-8: Science and product vision for terrestrial global change research. Remote Sens. Environ. 2014, 145, 154–172. [Google Scholar] [CrossRef]
  2. Bicknell, W.E.; Digenis, C.J.; Forman, S.E.; Lencioni, D.E. EO-1 advanced land imager. Proc. SPIE 1999, 3750. [Google Scholar] [CrossRef]
  3. Irons, J.R.; Dwyer, J.L.; Barsi, J.A. The next Landsat satellite: The Landsat Data Continuity Mission. Remote Sens. Environ. 2012, 122, 11–21. [Google Scholar] [CrossRef]
  4. Storey, J.; Scaramuzza, P.; Schmidt, G.; Barsi, J. Landsat 7 scan line corrector-off gap-filled product development. In Proceedings of Pecora 16 “Global Priorities in Land Remote Sensing”, Sioux Falls, SD, USA, 23–27 October 2005.
  5. Tarde, R.W.; Dittman, M.G.; Kvaran, G.E. Next-generation pushbroom filter radiometers for remote sensing. Proc. SPIE 2012, 8510. [Google Scholar] [CrossRef]
  6. Cutlip, H.H.; Cole, J.; Johnson, B.C.; Maxwell, S.; Markham, B.; Ong, L.; Hom, M.; Biggar, S. The OLI radiometric scale realization round robin measurement campaign. In Proceedings of the Conference on Characterization and Radiometric Calibration for Remote Sensing, Logan, UT, USA, 29 August–1 September 2011.
  7. Biggar, S.F.; Thome, K.J.; Slater, P.N.; Holmes, A.W.; Barnes, R.A. Second SeaWiFS Preflight Solar-Radiation-Based Calibration Experiment; NASA Technical Memorandum 104566; NASA Goddard Space Flight Center: Greenbelt, MD, USA, 1995. [Google Scholar]
  8. Barnes, R.A.; Eplee, R.E.; Biggar, S.F.; Thome, K.J.; Zalewski, E.F.; Slater, P.N.; Holmes, A.W. The SeaWiFS Solar Radiation-Based Calibration and the Transfer-to-Orbit Experiment; NASA Technical Memorandum 206892; NASA Goddard Space Flight Center: Greenbelt, MD, USA, 1999. [Google Scholar]
  9. Barsi, J.A.; Lee, K.; Kvaran, G.; Markham, B.L.; Pedelty, J.A. The spectral response of the Landsat-8 Operational Land Imager. Remote Sens. 2014, 6, 10232–10251. [Google Scholar] [CrossRef]
  10. Markham, B.L.; Barsi, J.A.; Kvaran, G.; Ong, L.; Kaita, E.; Biggar, S.; Czapla-Myers, J.; Mishra, N.; Helder, D. Landsat-8 Operational Land Imager radiometric calibration and stability. Remote Sens. 2014, in press. [Google Scholar]
  11. Barrie, J.D.; Fuqua, P.D.; Meshishnek, M.J.; Ciofalo, M.R.; Chu, C.T.; Chaney, J.A.; Moision, R.M.; Graziani, L. Root cause determination of on-orbit degradation of the VIIRS rotating telescope assembly. Proc. SPIE 2012, 8510. [Google Scholar] [CrossRef]