1. Introduction
Synthetic aperture radars (SAR) can obtain stable image data as we are observing the planet Earth. It is not affected by light conditions and can be used day and night under various conditions [
1,
2]. In recent years, SAR image classification has received more attention as an important part of image understanding and interpretation. A considerable number of image classification algorithms have been proposed, such as support vector machine (SVM) [
3], neural network (NN) [
4], wavelet decomposition, and sparse representation classification (SRC) [
5], etc. Among these existing methods, the traditional SVM and NN methods show high reliability in pattern recognition. However, the relevant computation cost is expensive, and they are easily affected by the selection of features. SRC, which is based on sparse representation and was proposed by Mallat and Zhang [
6], has been proven to be an extremely powerful tool in image processing and can obtain good performance in the final processing results [
7,
8,
9,
10,
11,
12,
13,
14,
15].
The basic ideas of SRC are the linear description hypothesis and spatial joint representation mechanism. This is based on the minimum residual between the original and the reconstruction signal. The sparse coefficients associated with the different classes are selected to reconstruct the original signal. Actually, SRC cannot be directly applied to SAR image classification due to the imaging mechanisms of SAR being different to those of nature imagery. However, if an SAR image is transformed into a specific feature space, the SRC can be efficiently used in SAR image classification. A joint sparsity model (JSRM) is proposed based on SRC [
16], in which the small neighborhood around the test pixel are represented by linear combinations of a few common training samples. Furthermore, the features cannot be represented well on a single scale, which results in the low accuracy of classification results. Neighboring regions of different scales correspond to the same test pixel and they should offer complementary and correlated information for classification. Different sizes of textures in an image have different performance in different scales. The hierarchical sparse representation-based classification (HSRC) [
17] can solve the problem in a previous reference [
16] to a certain extent, but the HSRC belongs to classification based on each pixel, which only depends on the selection of features in the spatial domain and the selected scale for each layer. This may lead to a loss or misrepresentation of information, resulting in poor classification accuracy and time-consuming training requirements.
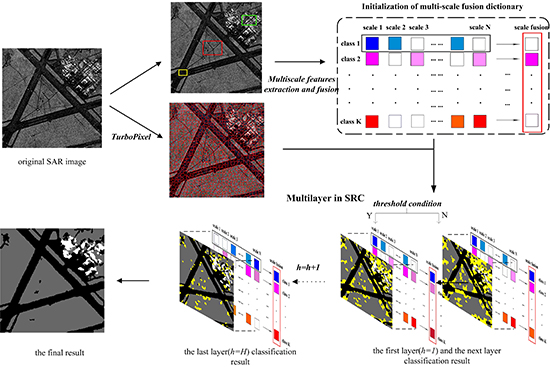
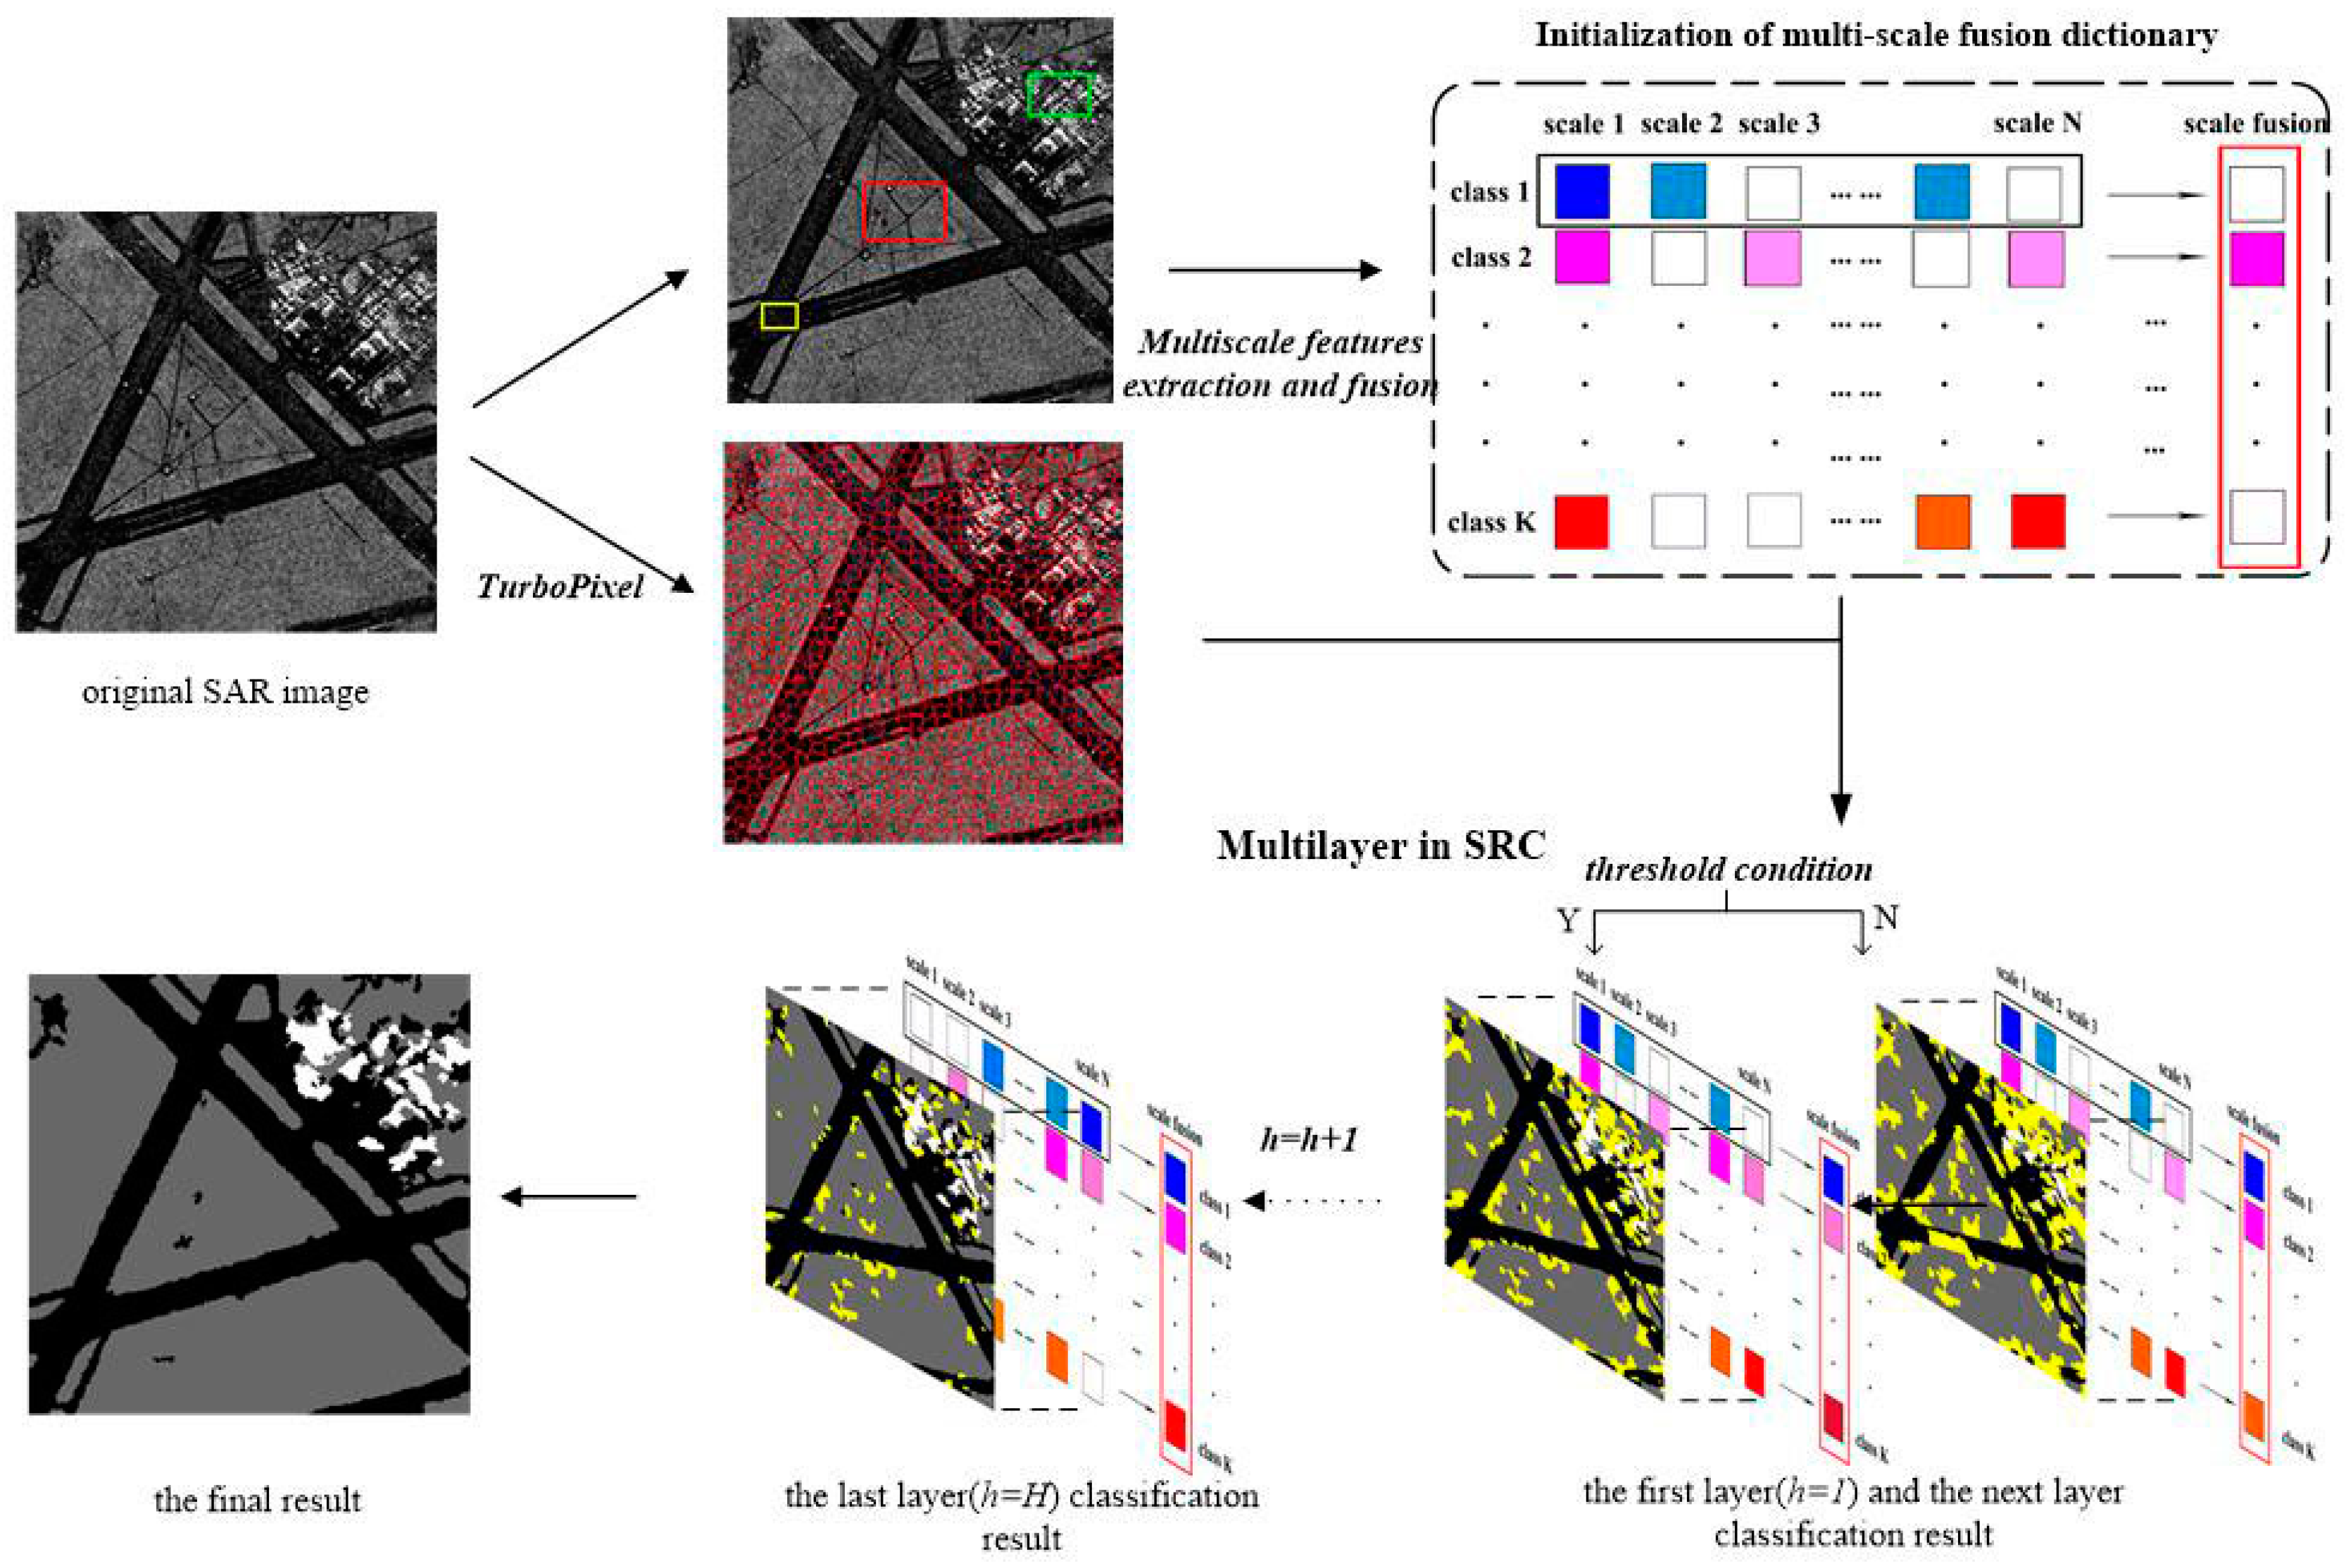
In this paper, aiming to overcome the above-mentioned problems, we proposed a novel approach, which is called the multi-layer with multi-scale and multi-feature fusion model (ML–MFM), for SAR image classification. This maintains high accuracy and robustness in addition to having reduced time requirements. Firstly, in order to fix the deficiency of using a single feature and to provide more textural and gray statistical level information [
5,
12,
16], we extracted three types of features of a SAR image for different classes and different scales, which are respectively the gray-level histogram, gray-level co-occurrence matrix (GLCM), and Gabor filter [
18,
19,
20,
21]. In other words, a discriminative feature vector is composed of the gray-level histogram, GLCM and Gabor filter for each class, while the feature matrix is constructed by the column vector composed of discriminative feature vectors of all classes and row vectors composed of discriminative feature vectors of all scales. Moreover, motivated by the fusion of characteristics from multiple frames in reference [
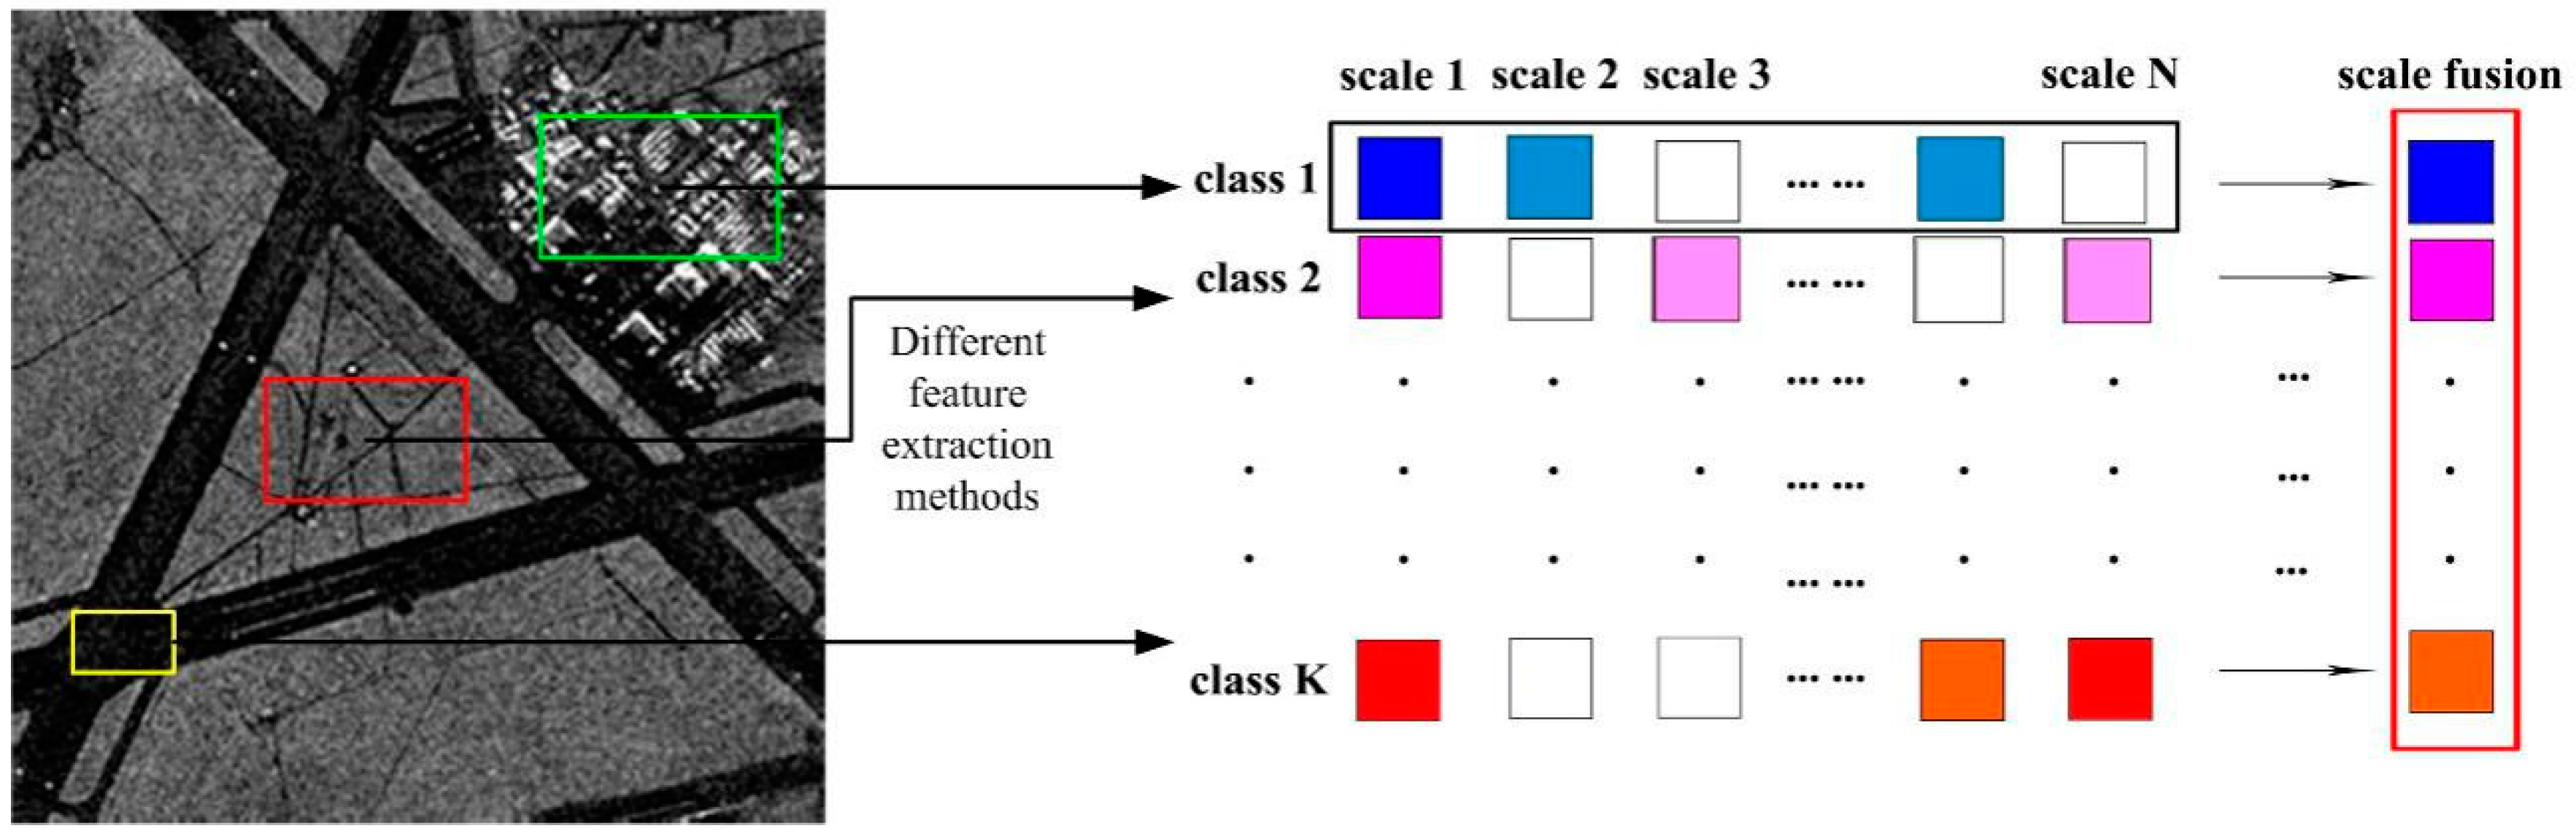
22], a multi-scale fusion strategy was used to construct the dictionary. Thus, the extracted features under different scales can be merged together to construct the column vectors of the dictionary (see
Figure 1), which can allow complementation between sample information and reduce the time complexity. Following this, we should segment an SAR image into a host of homogeneous regions called superpixels, with the structural information captured by a discriminative feature vector extraction for each superpixel. Finally, inspired by the idea of layers in the spatial pyramid in reference [
21], the multi-layer operation is utilized to refine the classification results by adding a threshold decision condition to SRC in an iterative way. If a superpixel meets the condition as the new atoms in the dictionary, the category is recorded. Otherwise, it will be used as the testing sample for the next layer (Figure 3 depicts the above-mentioned basic framework). Compared with other methods, the final classification results of the proposed method have higher accuracy.
The remainder of this paper is organized as follows. In
Section 2, we briefly review the SRC, while the procedure of our novel model regarding the use of ML–MFM for SAR image classification is explored. The experimental results for synthetic and real SAR images are presented and compared with others in
Section 3. Comparison with the HSRC [
17] and the major innovation points are provided in
Section 4. Finally, conclusions are drawn and future research directions are described in
Section 5.
3. Results
In this section, the proposed model is now applied in the classification of synthetic and real SAR images. To validate the performance of the proposed method, we use both types of images in quantitative evaluation and visualization results. We mainly compare our results with the results of previous studies [
3,
5,
16,
17], in which their parameters are tuned to obtain the best results. Figures 8a, 9a and 10a are the synthetic SAR images, which are from the Brodatz database. These synthetic SAR images have three, four and five types of different textural regions, while the size of each image is 512 × 512, 335 × 335, and 512 × 512, respectively. The test images are named Syn1, Syn2 and Syn3, respectively. In addition, three real SAR images (SAR1, SAR2 and SAR3) were tested in experiments. SAR1 has a size of 256 × 256, which covers the China Lake Airport, California, with a Ku-Band radar with a 3-m resolution. SAR2 has a size of 321 × 258, which covers the pipeline over the Rio Grande river near Albuquerque, New Mexico, with a Ku-Band radar with 1-m resolution. SAR3 has a size of 284 × 284, which covers the X-Band radar with 3-m resolution. The central processing unit time was obtained by running the Matlab code on a DELL computer with Inter (R) Core (TM) i7CPU, 3.4 GHz, 16 GB RAM with MATLAB 2014(a) on Windows 10 (64-bit operating system) in our experiment.
3.1. Experimental Settings
In the experiment, we used the TurboPixel [
25] algorithm to over-segment the original image into homogeneous regions and to obtain the superpixels. As each superpixel has different sizes, the features of each superpixel need to be processed so that the fusion features of all superpixels have the same dimensions (i.e., m = 60 in our method). Sixteen effective distribution features and four statistical features suggested by a previous study [
17] were used. Thus, the features extracted by gray-level histogram and GLCM have 16 dimensions and four dimensions for each superpixel, respectively. After calculating the convolution of the initial bank of Gabor filters, which consists of 40 filters with five scales and eight orientations, the mean value of the filter response corresponding to each superpixel was computed for every filter. Therefore, the Gabor feature of each superpixel was a 40-dimension vector corresponding to 40 Gabor filters with the total number of dimensions being 60. In addition, the ranges of the radial basis function kernel width and penalty coefficients are (0.0001, 0.001, 0.01, 0.1, 1, 10) and (0.1, 1, 10, 100, 500, 1000) respectively.
3.1.1. Influence of Parameters
It is necessary to set ideal parameters to obtain satisfactory results. There are two main parameters that need to be set in our model, namely
and
(threshold). Based on plenty of experimental data and the analysis of results, each parameter should satisfy the following condition:
,
. We noted that the parameter
is influenced by the resolution of the SAR images (similar to a previous reference [
17]), as mentioned in
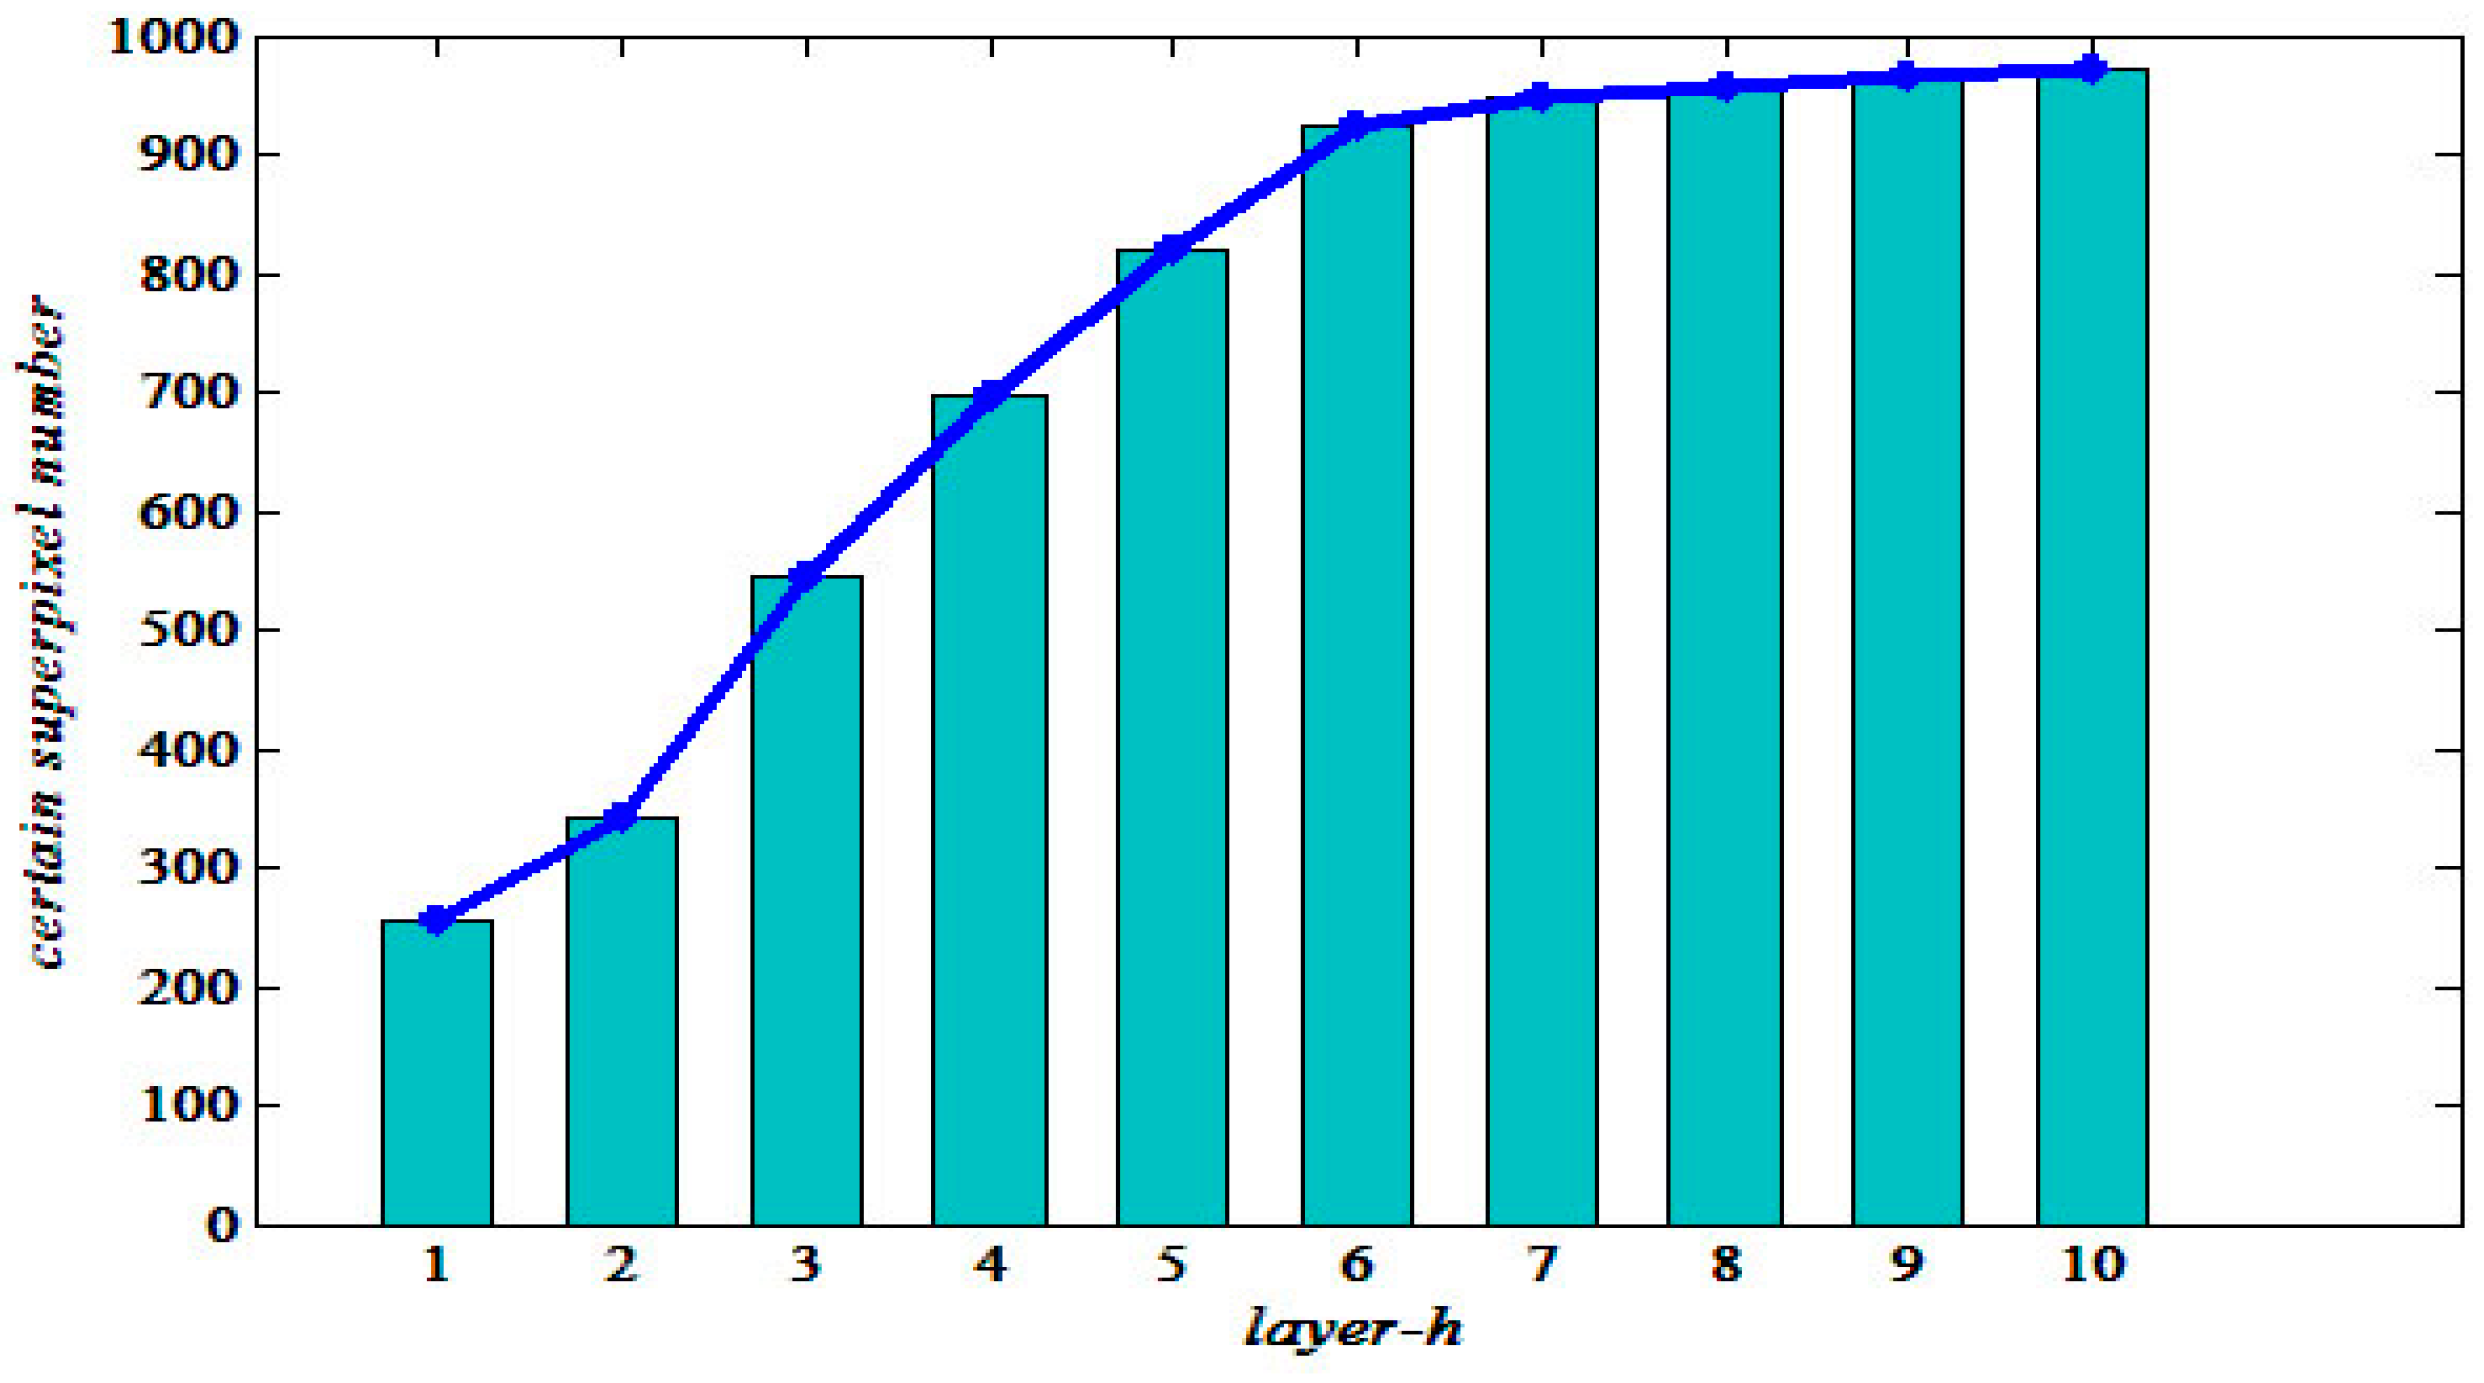
Section 2.2. We used an experiment to show the influence of
, which is depicted in
Figure 4. The horizontal axis represents the layer
, while the vertical axis represents a certain superpixel number. Here, we artificially set the total superpixel number to 1000 of SAR1. From
Figure 4, it is more intuitive to find the most suitable layer range. This is because when
, the speed of the growth of certain points slow significantly in histogram and line chart. In many experiments, if we set
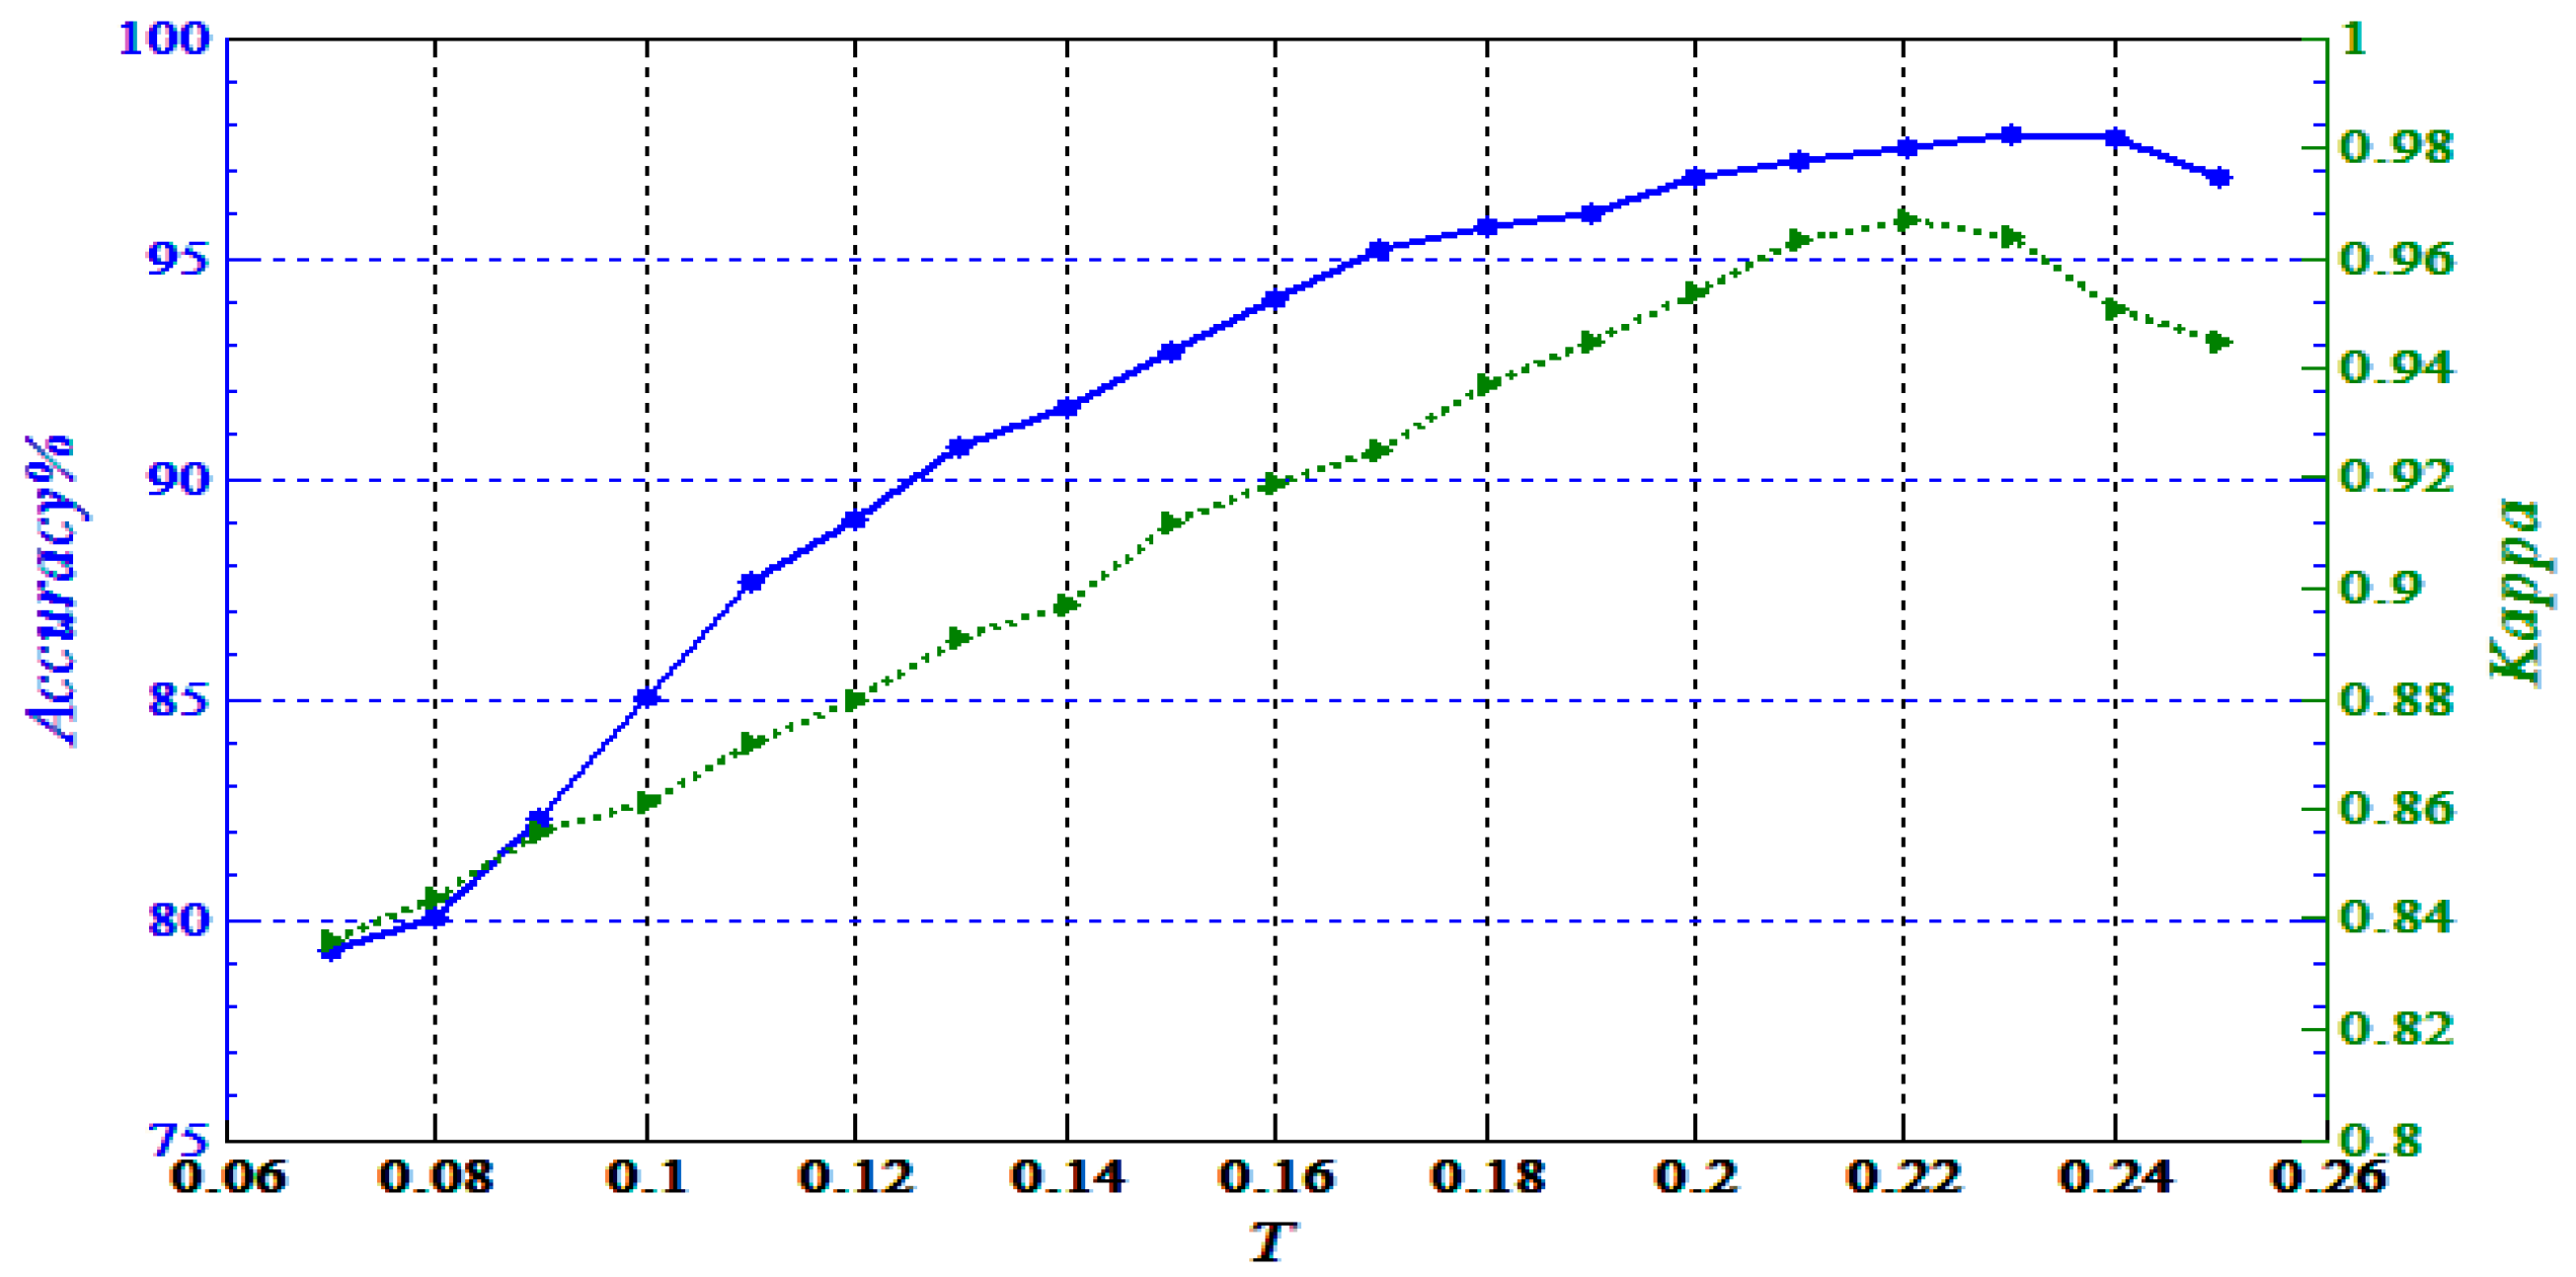
as the maximum number of layers, it is the best choice with regards to time and precision. In addition, it is worth noting that
is the threshold to control the categories of accuracy (blue solid line) and the kappa coefficient (green dotted line) with our proposed method. From
Figure 5, we can see that when
is too small, there are many uncertain superpixels until
. However, when
is too large, the finer areas cannot be placed into classes. Therefore, appropriate parameter selection is very important.
3.1.2. Analysis of Multi-Feature Fusion and Multi-Scale Fusion
Multi-Feature Fusion
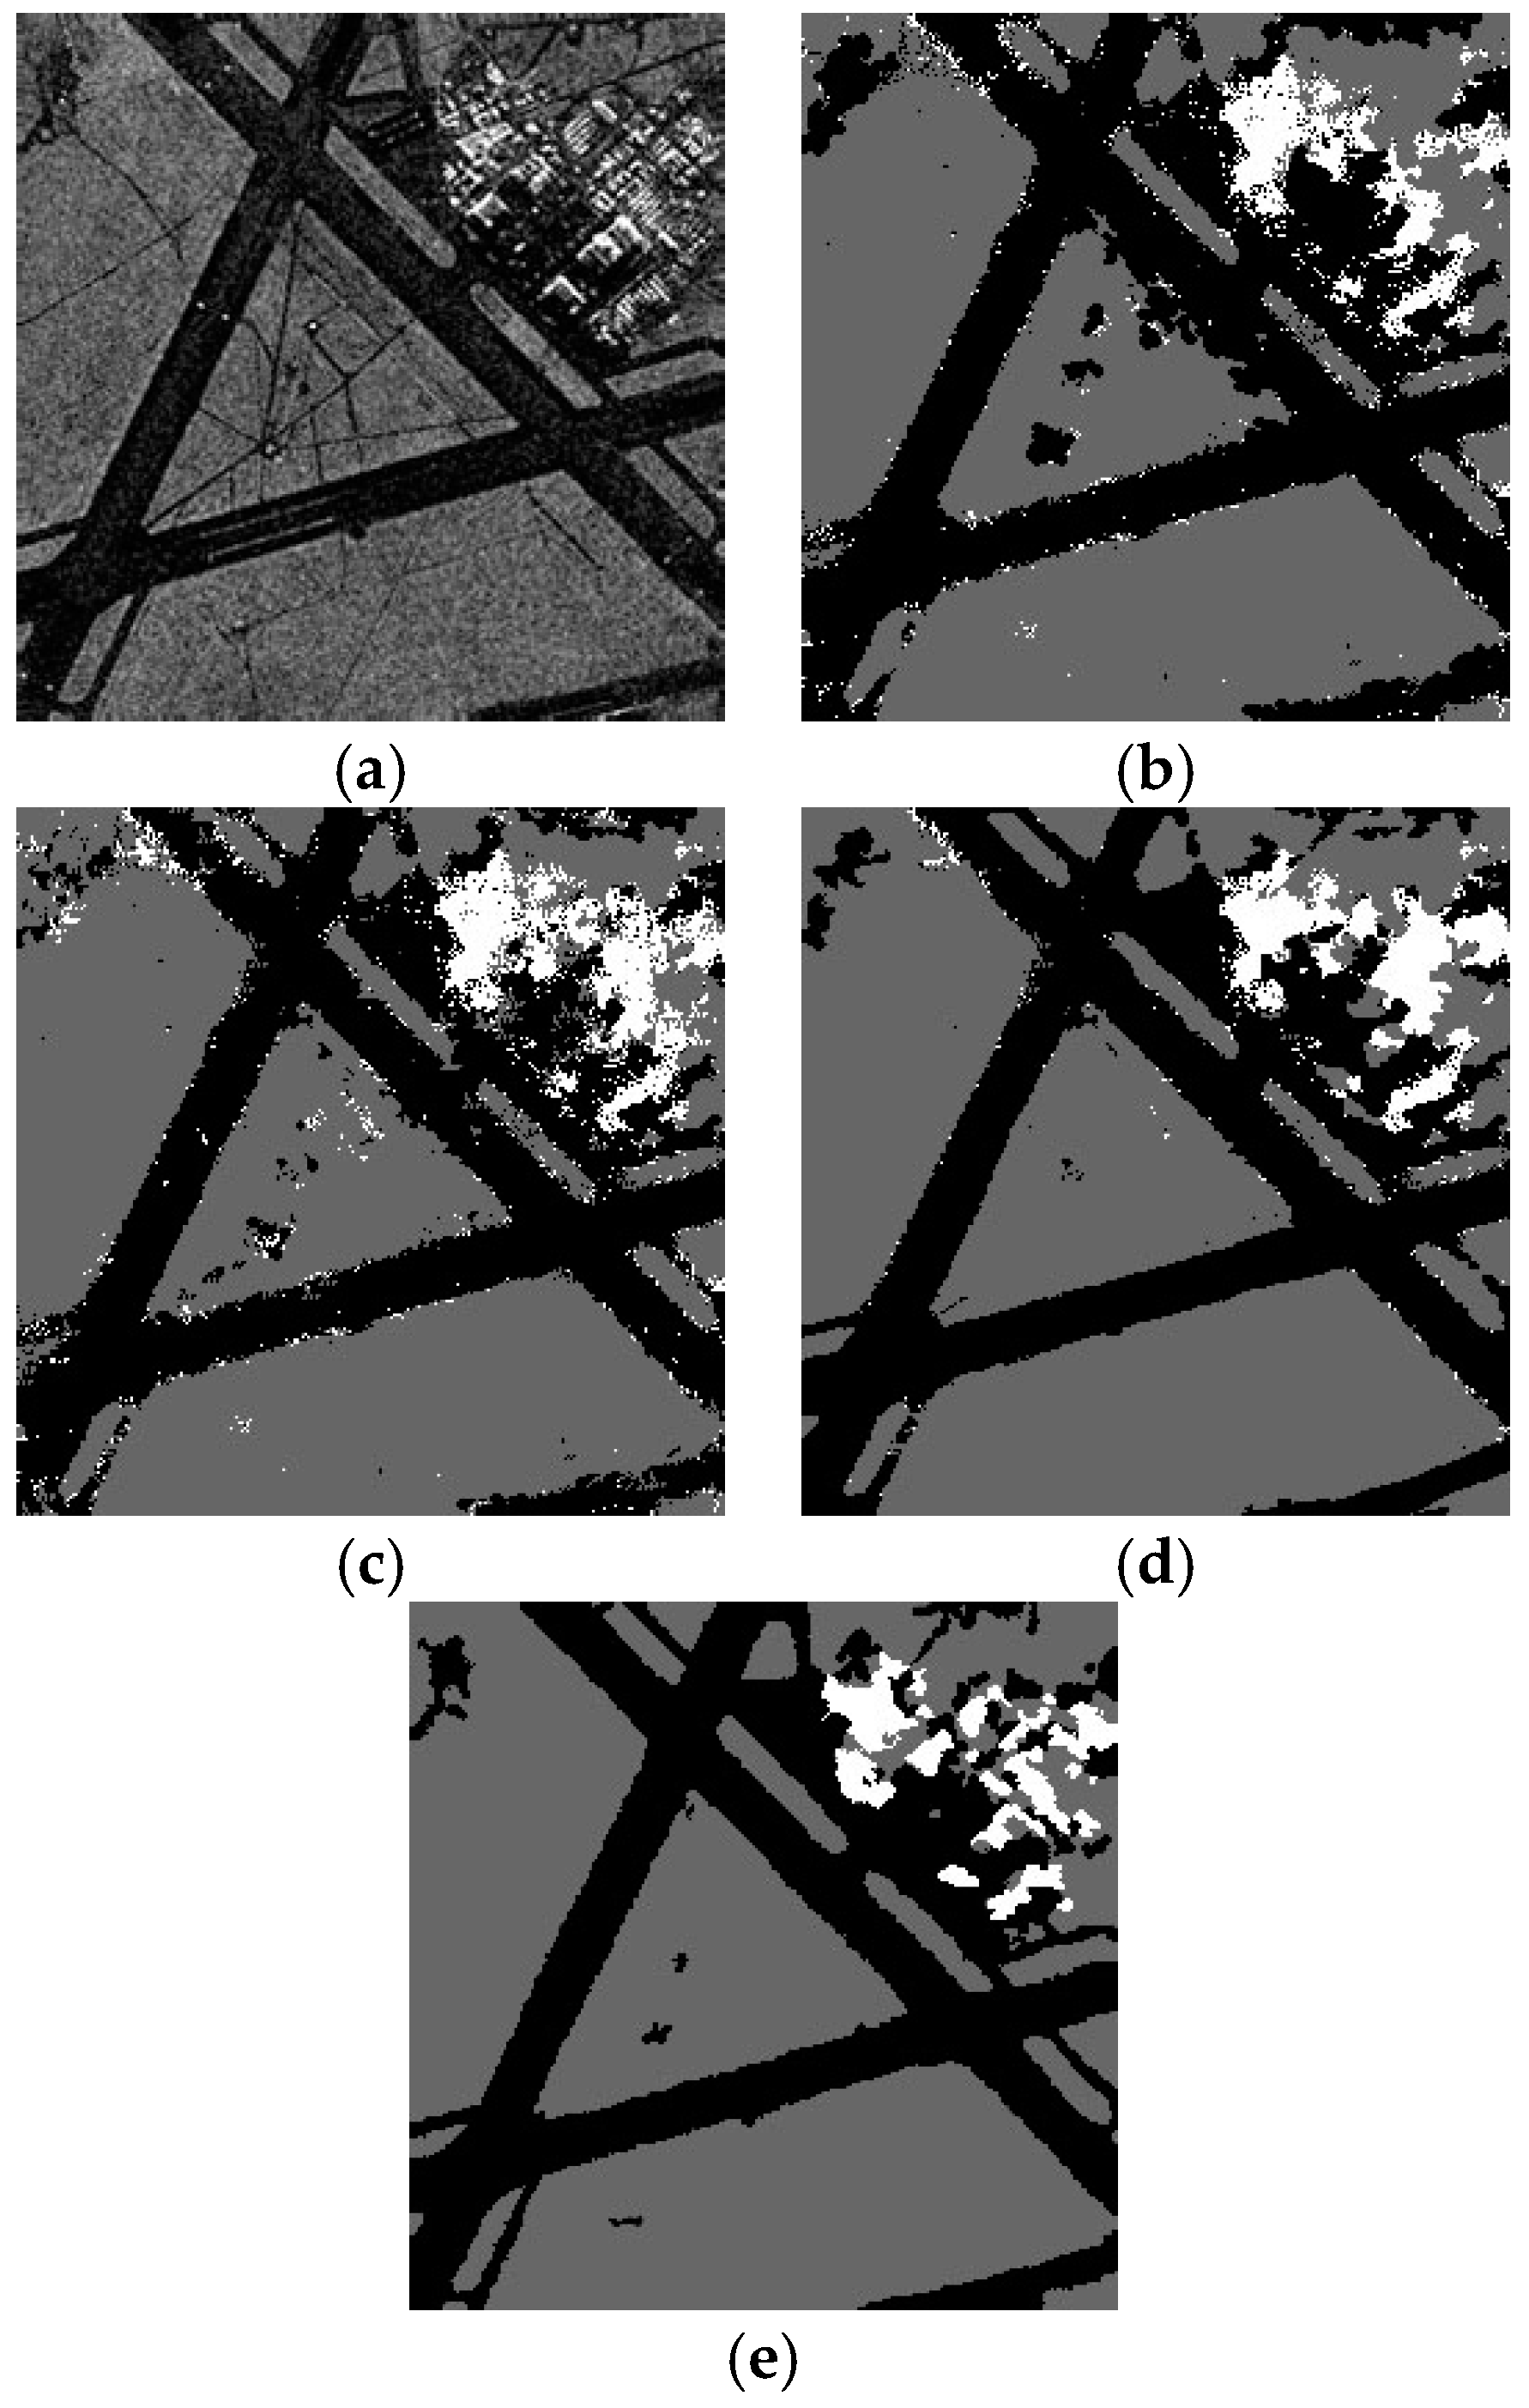
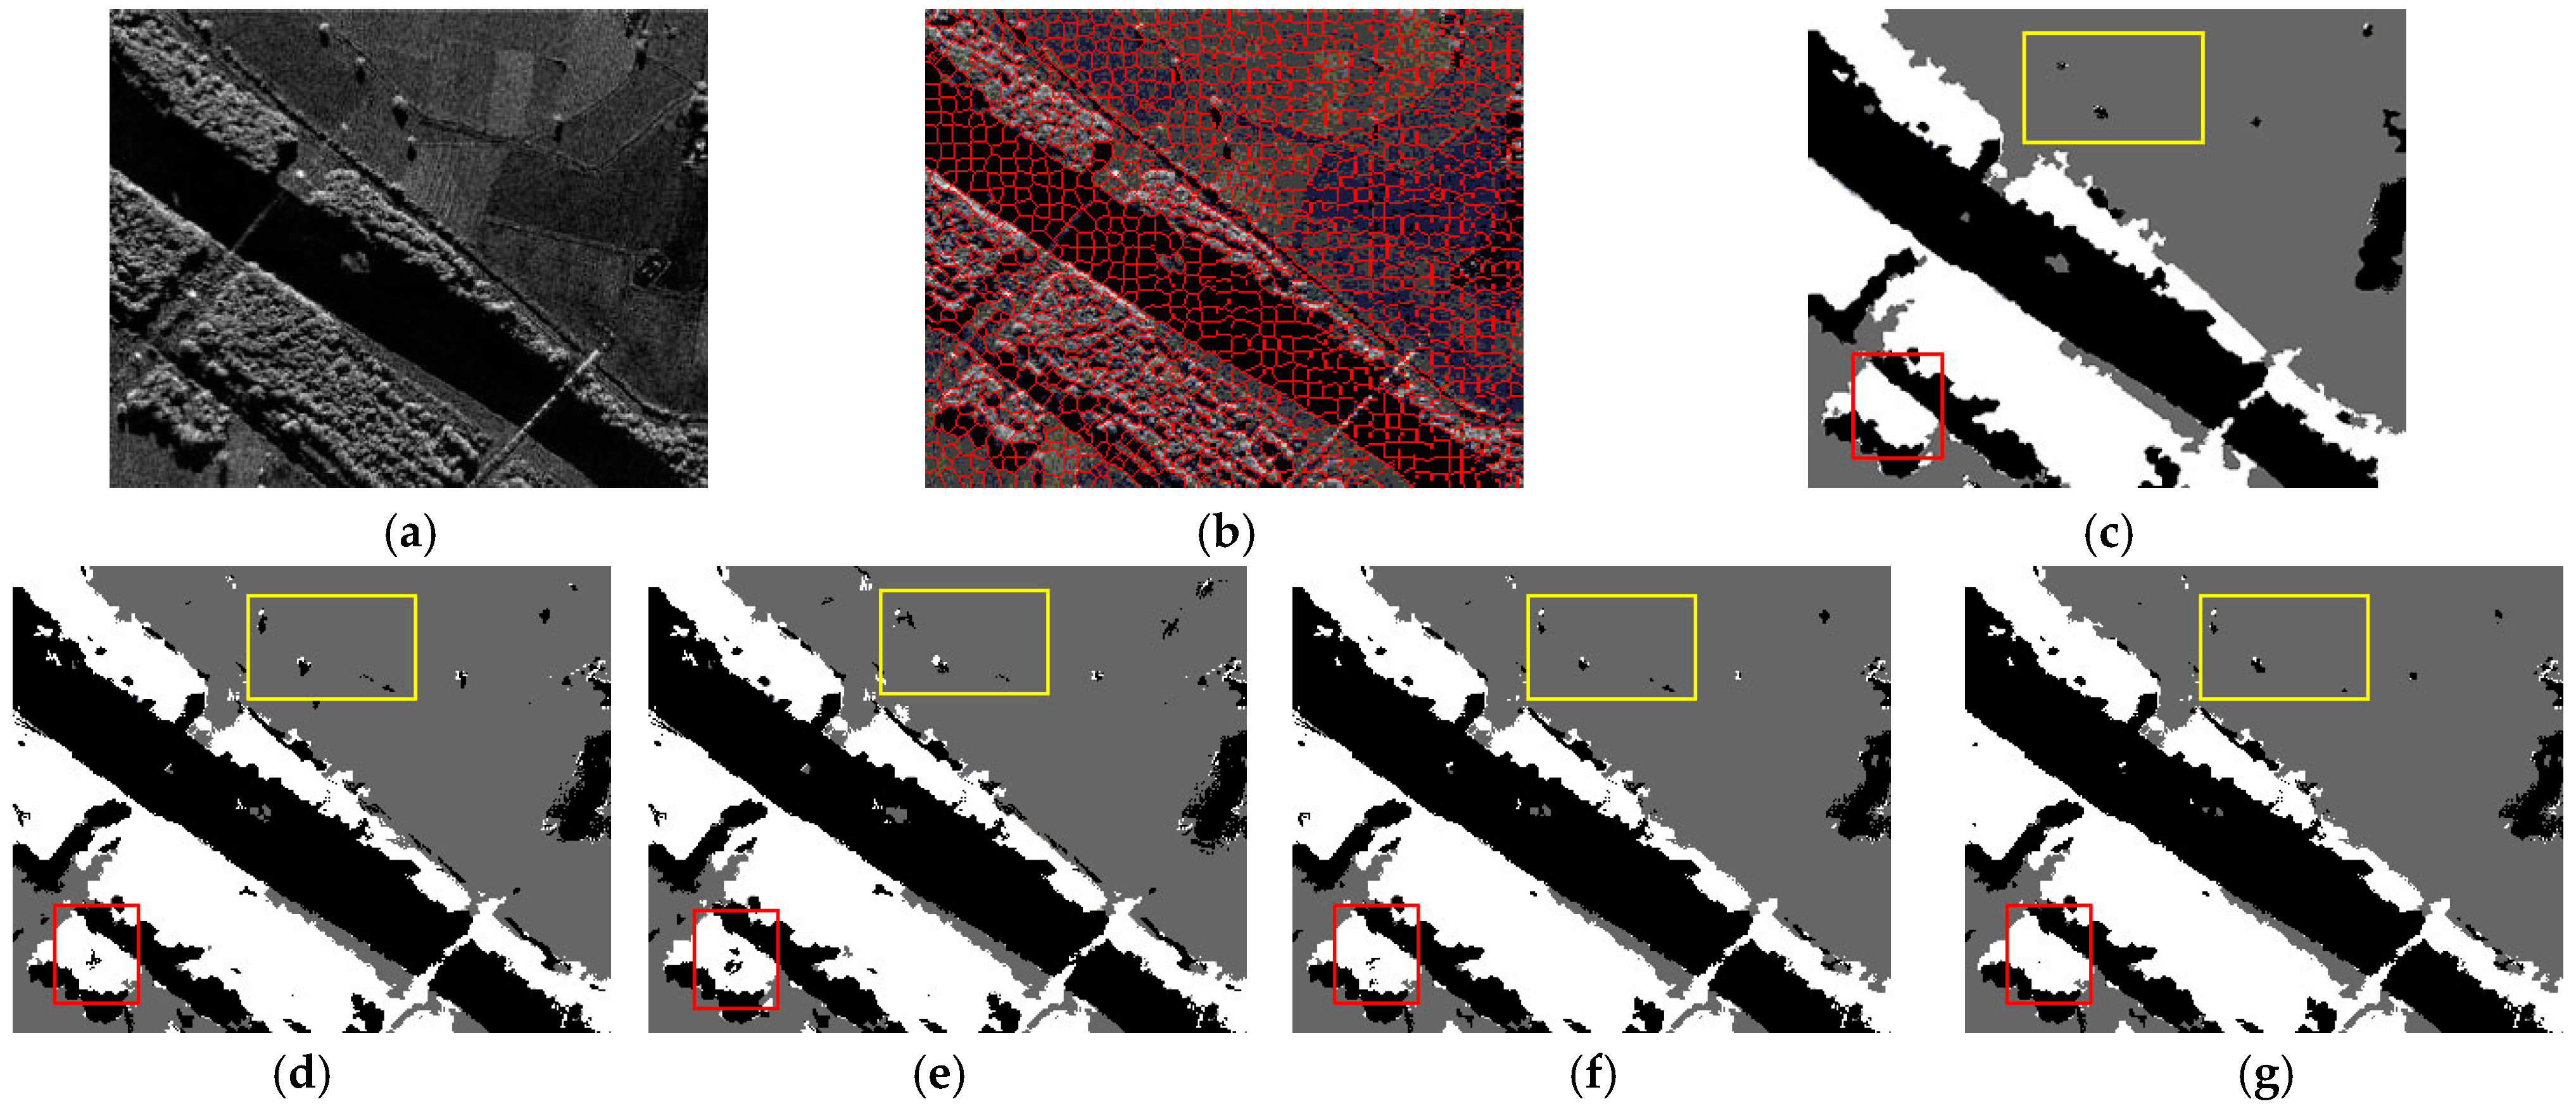
In this part, the multi-feature fusion is analyzed to verify its effectiveness in obtaining satisfactory results. In our paper, the fusion strategy is introduced to construct the dictionary. We perform an experiment on the original SAR1 (
Figure 6a) to show the influence of multi-feature fusion on the dictionary and the impact of classification results. The rectangular areas of
Figure 6a–e are marked by red, yellow and green, respectively.
Figure 6b shows the results of the method with the gray-level histogram;
Figure 6c shows the results of the GLCM;
Figure 6d shows the results of the Gabor method; and
Figure 6e shows the results of the multi-features method. We can see that
Figure 6e has fewer miscellaneous points than
Figure 6b–d. The reason is that the fusion features includes distribution features and four statistical features. Therefore, the dictionary
includes more information to obtain better results, which is an advantage that is absent in the method with single features. Therefore, the multi-feature fusion strategy is important.
Multi-Scale Fusion
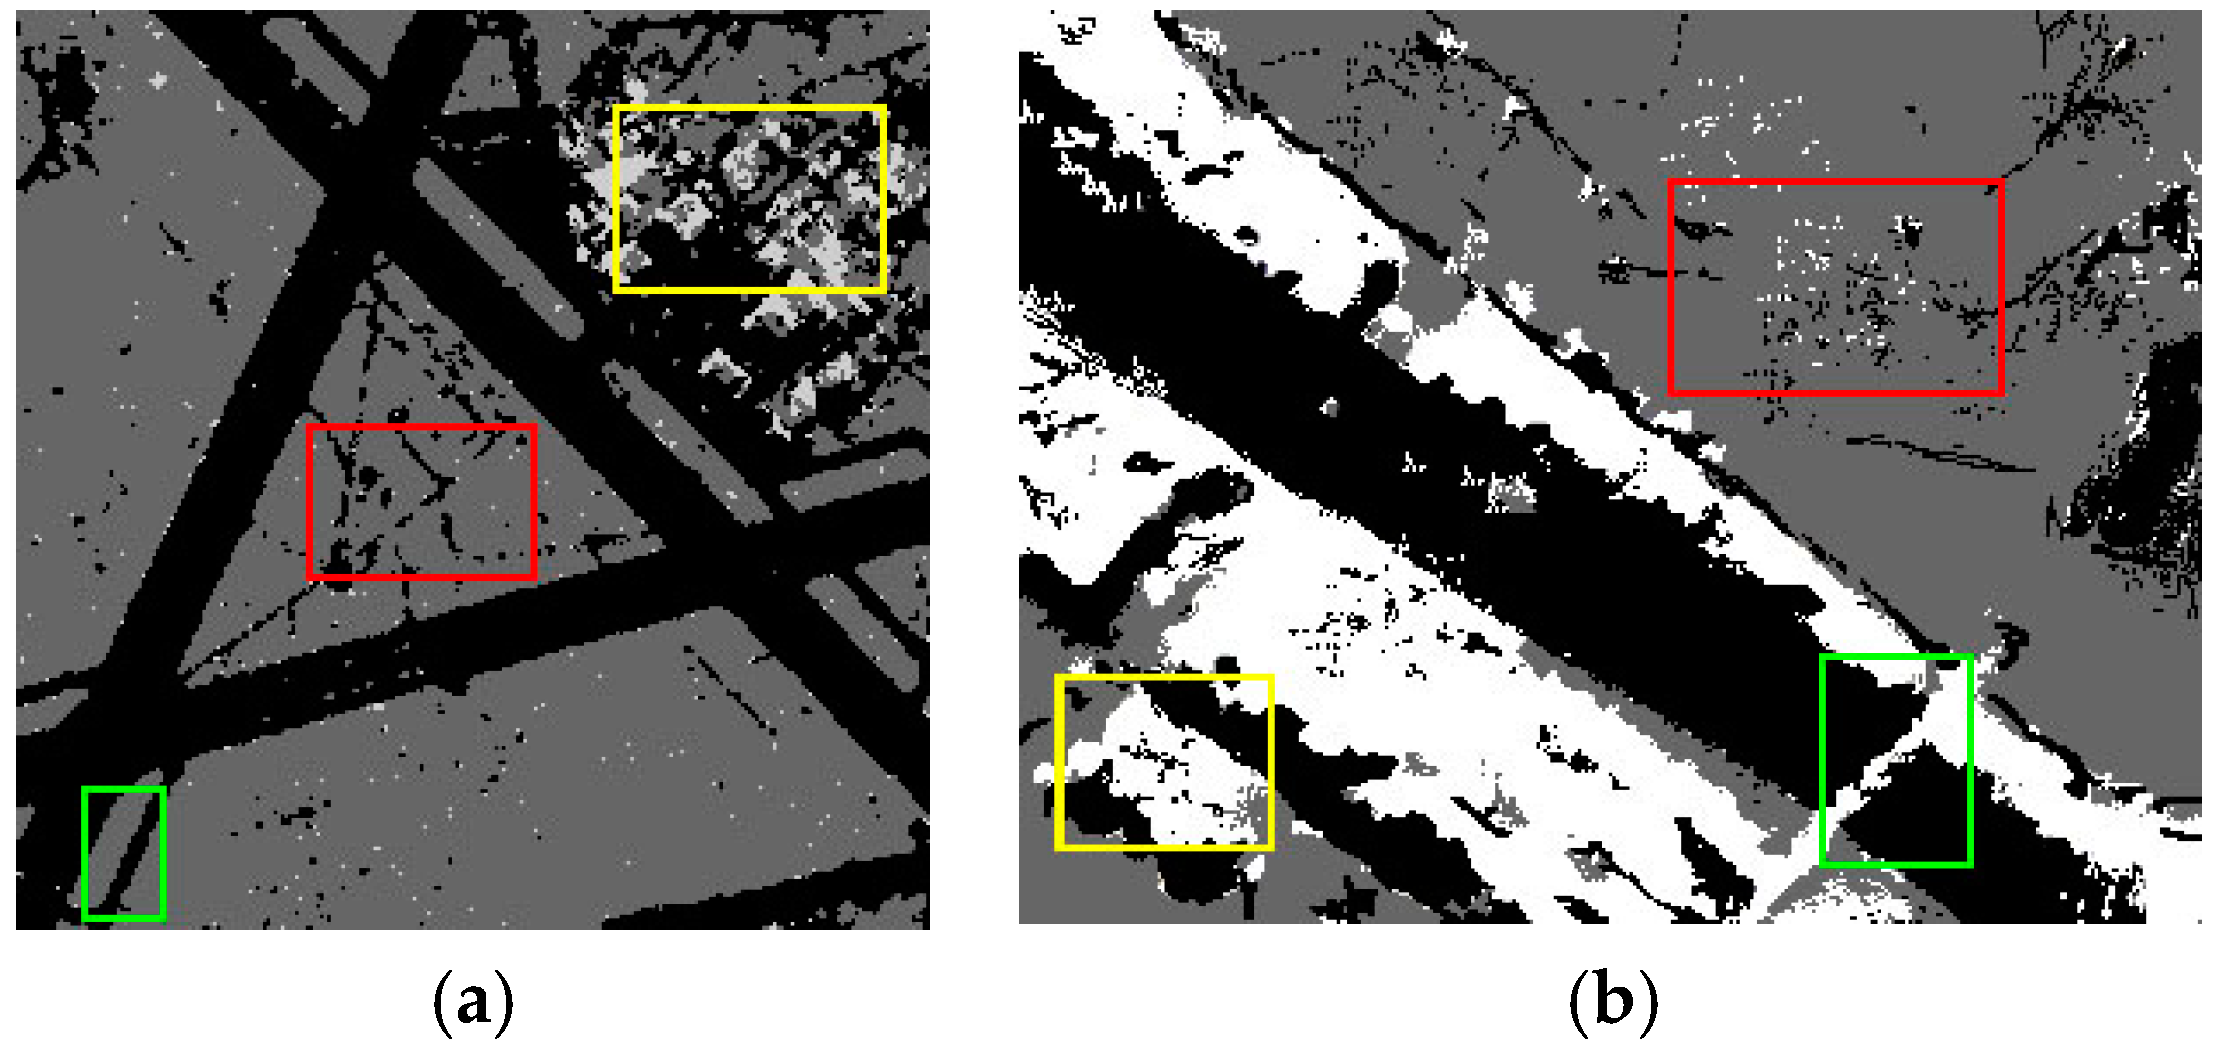
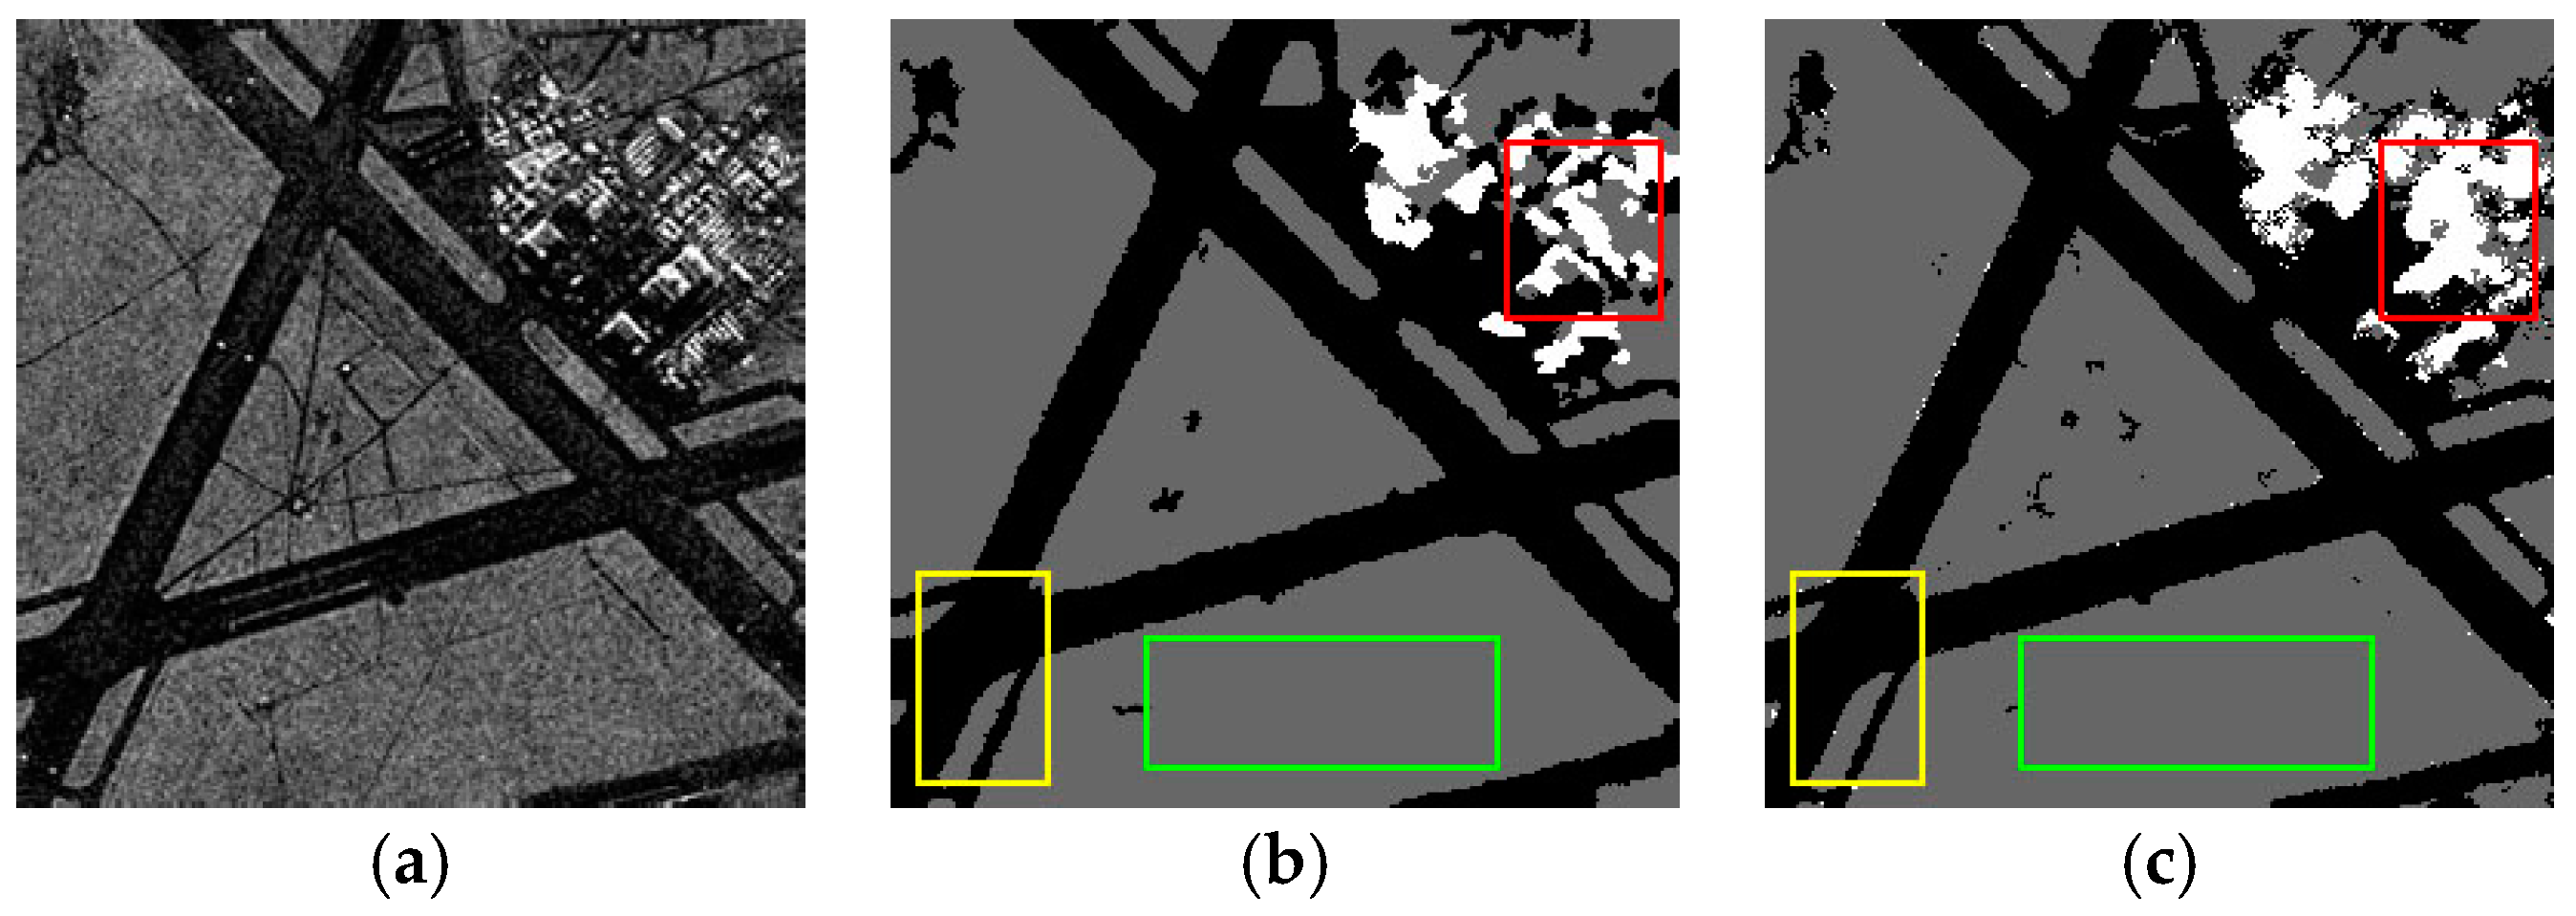
In this part, multi-scale fusion is analyzed to verify its effectiveness in obtaining satisfactory results. In our paper, the fusion strategy is introduced to construct the dictionary. We perform an experiment on the original SAR1 (
Figure 7a) to show the influence of the fusion strategy on the dictionary after merging features under different scales. The rectangular areas of
Figure 7b,c are both marked by red, yellow and green.
Figure 7b shows the results method with the fusion strategy;
Figure 7c shows the results method without the fusion strategy. We can see that
Figure 7b has fewer miscellaneous points than
Figure 7c. The reason for this is that the fusion dictionary
includes each scale information (homogeneous and marginal regions). This has similar effects on the dictionary under multi-scales, which are absent in the method without the fusion dictionary and are important to SAR image processing. Therefore, the multi-scale fusion strategy is important.
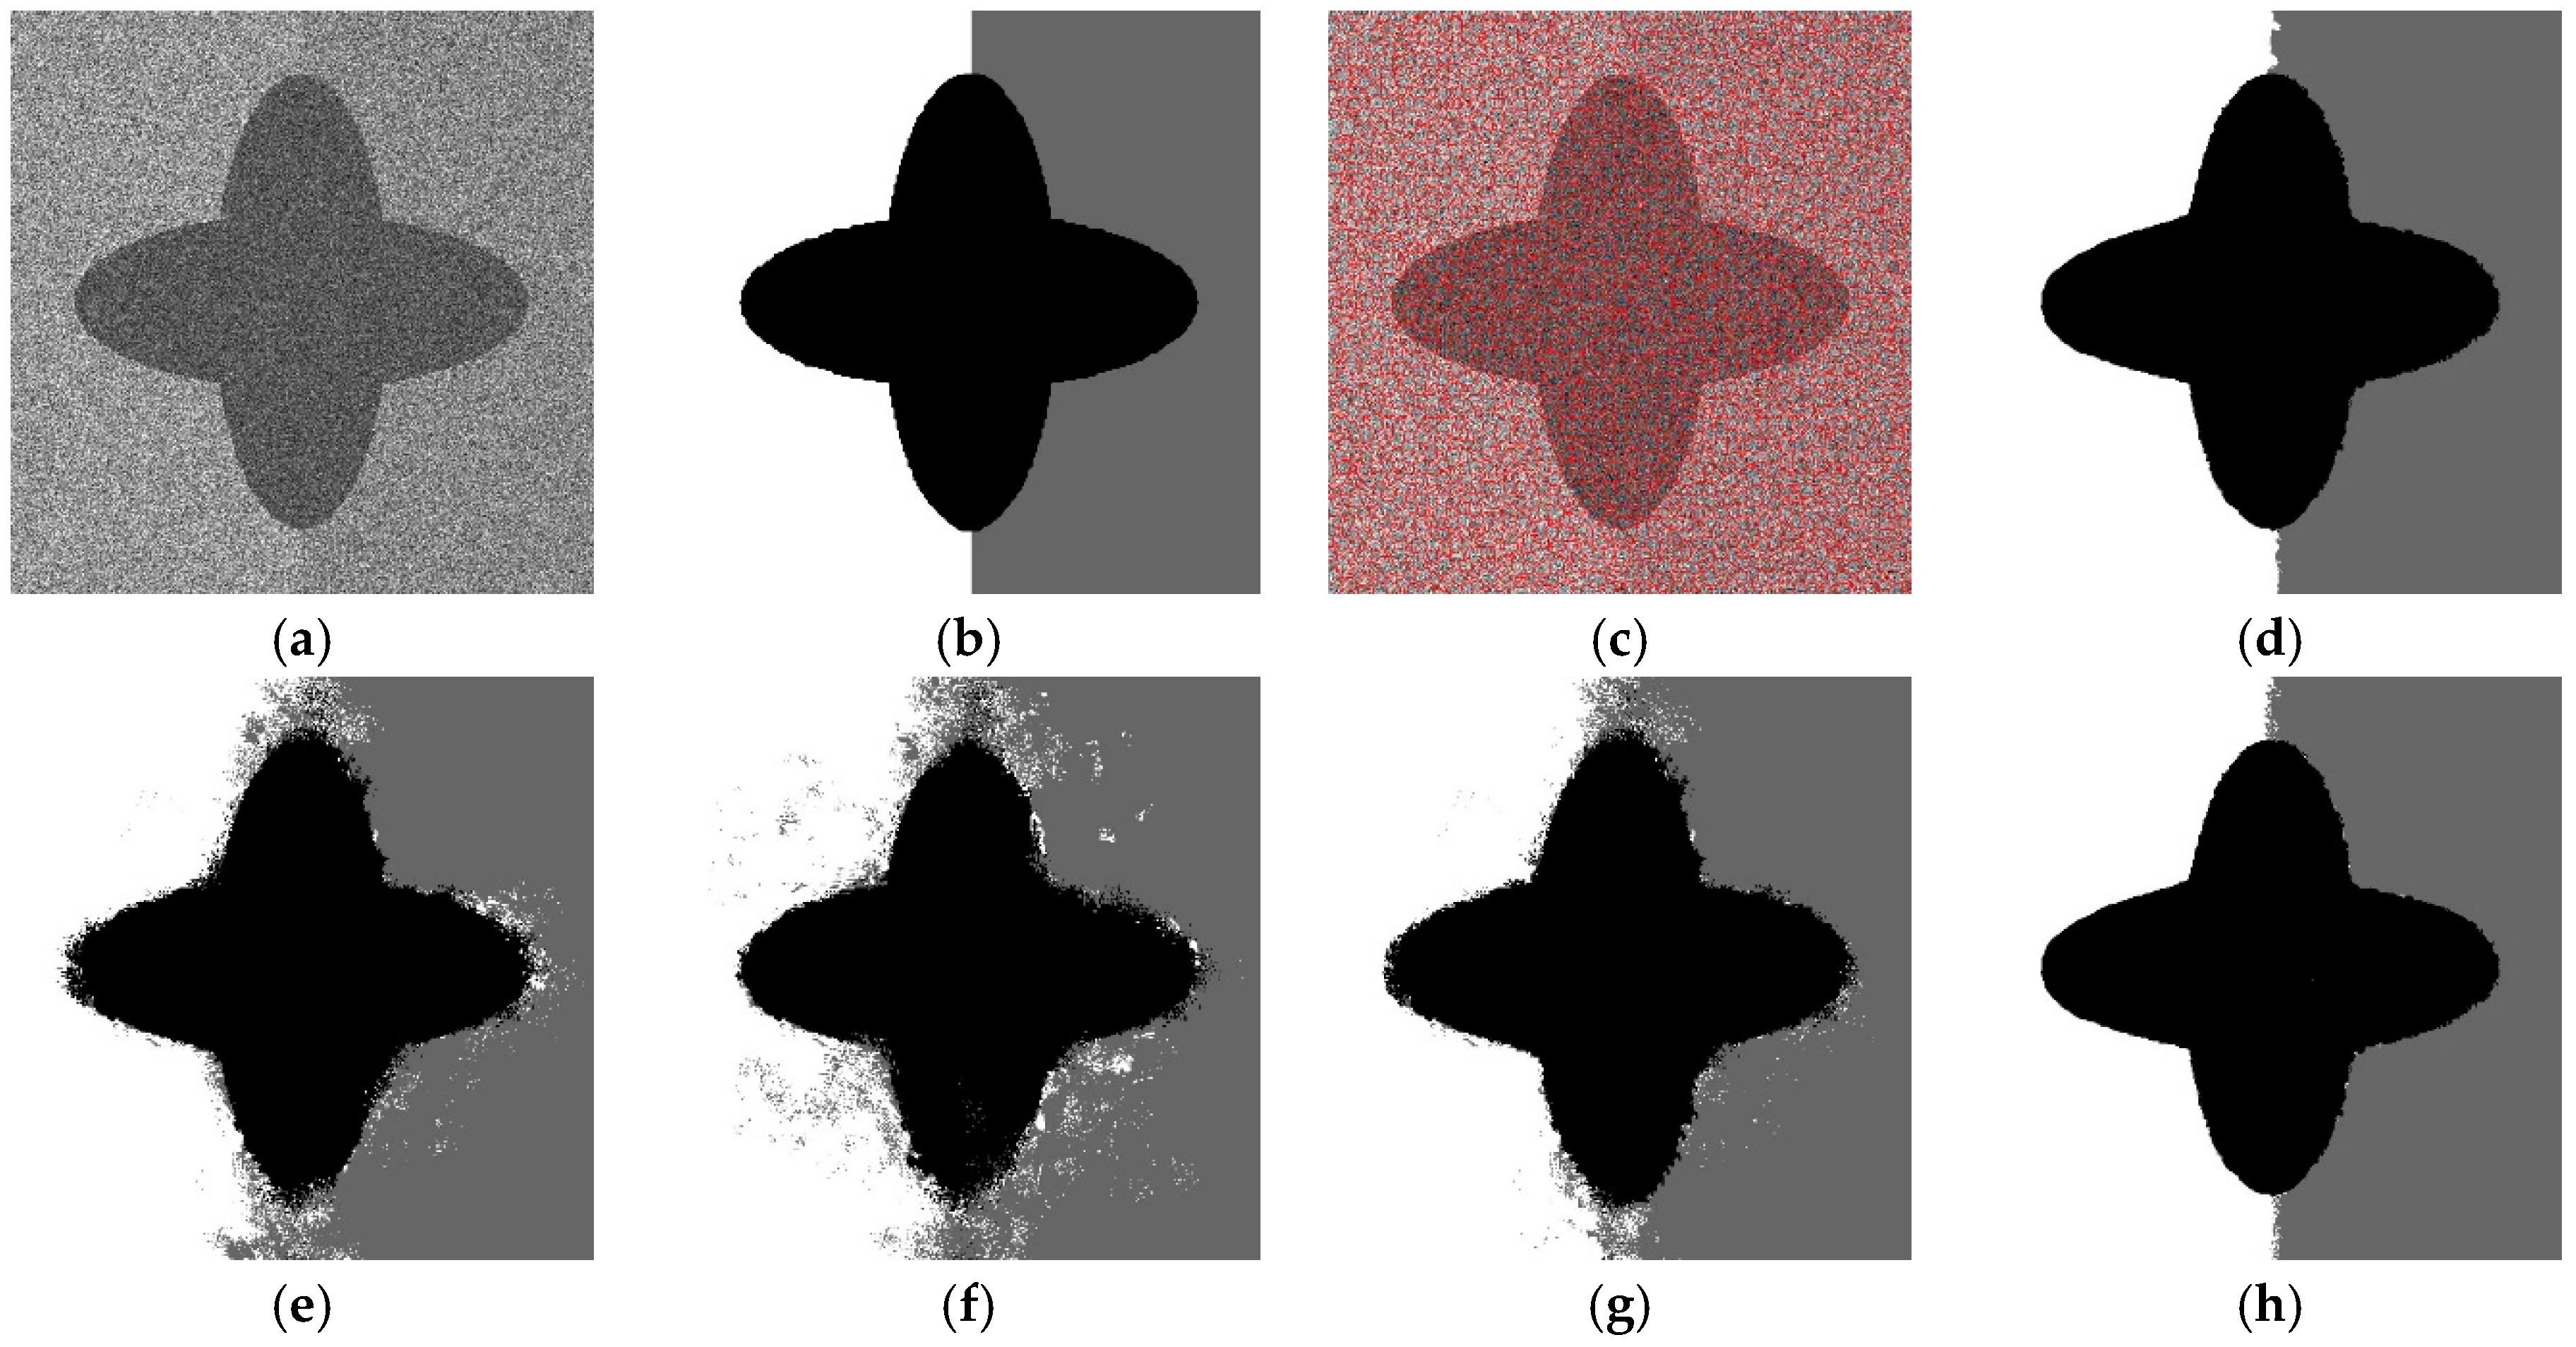
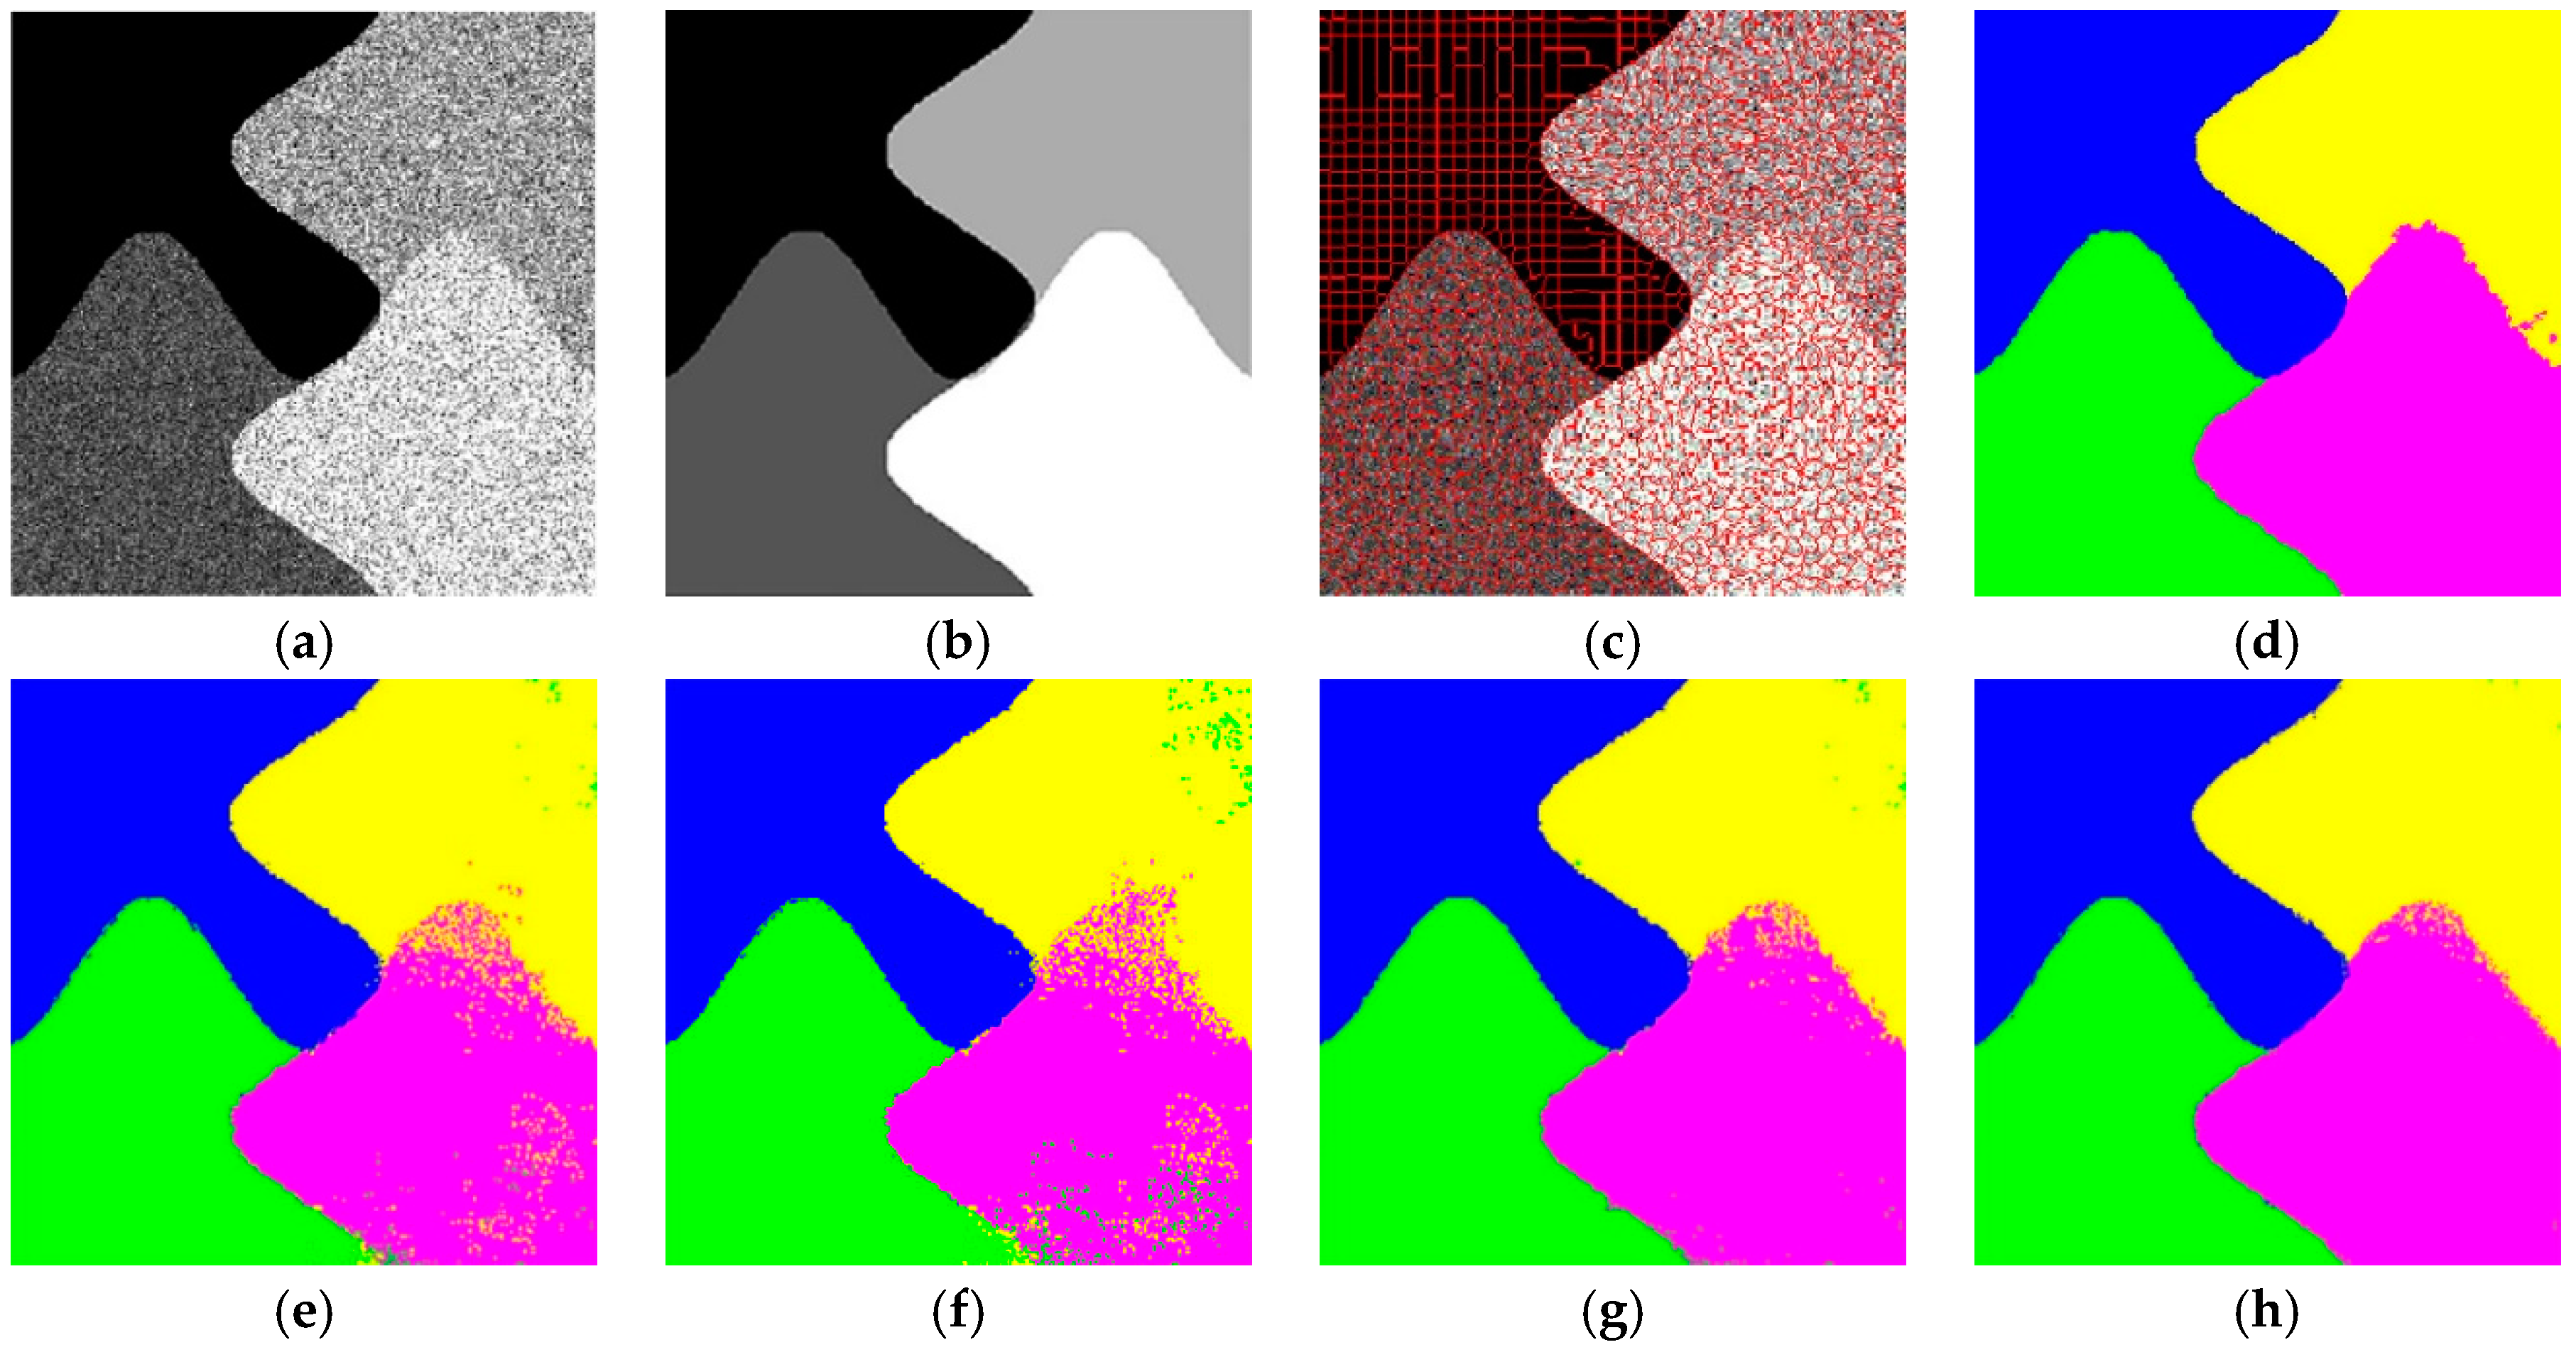
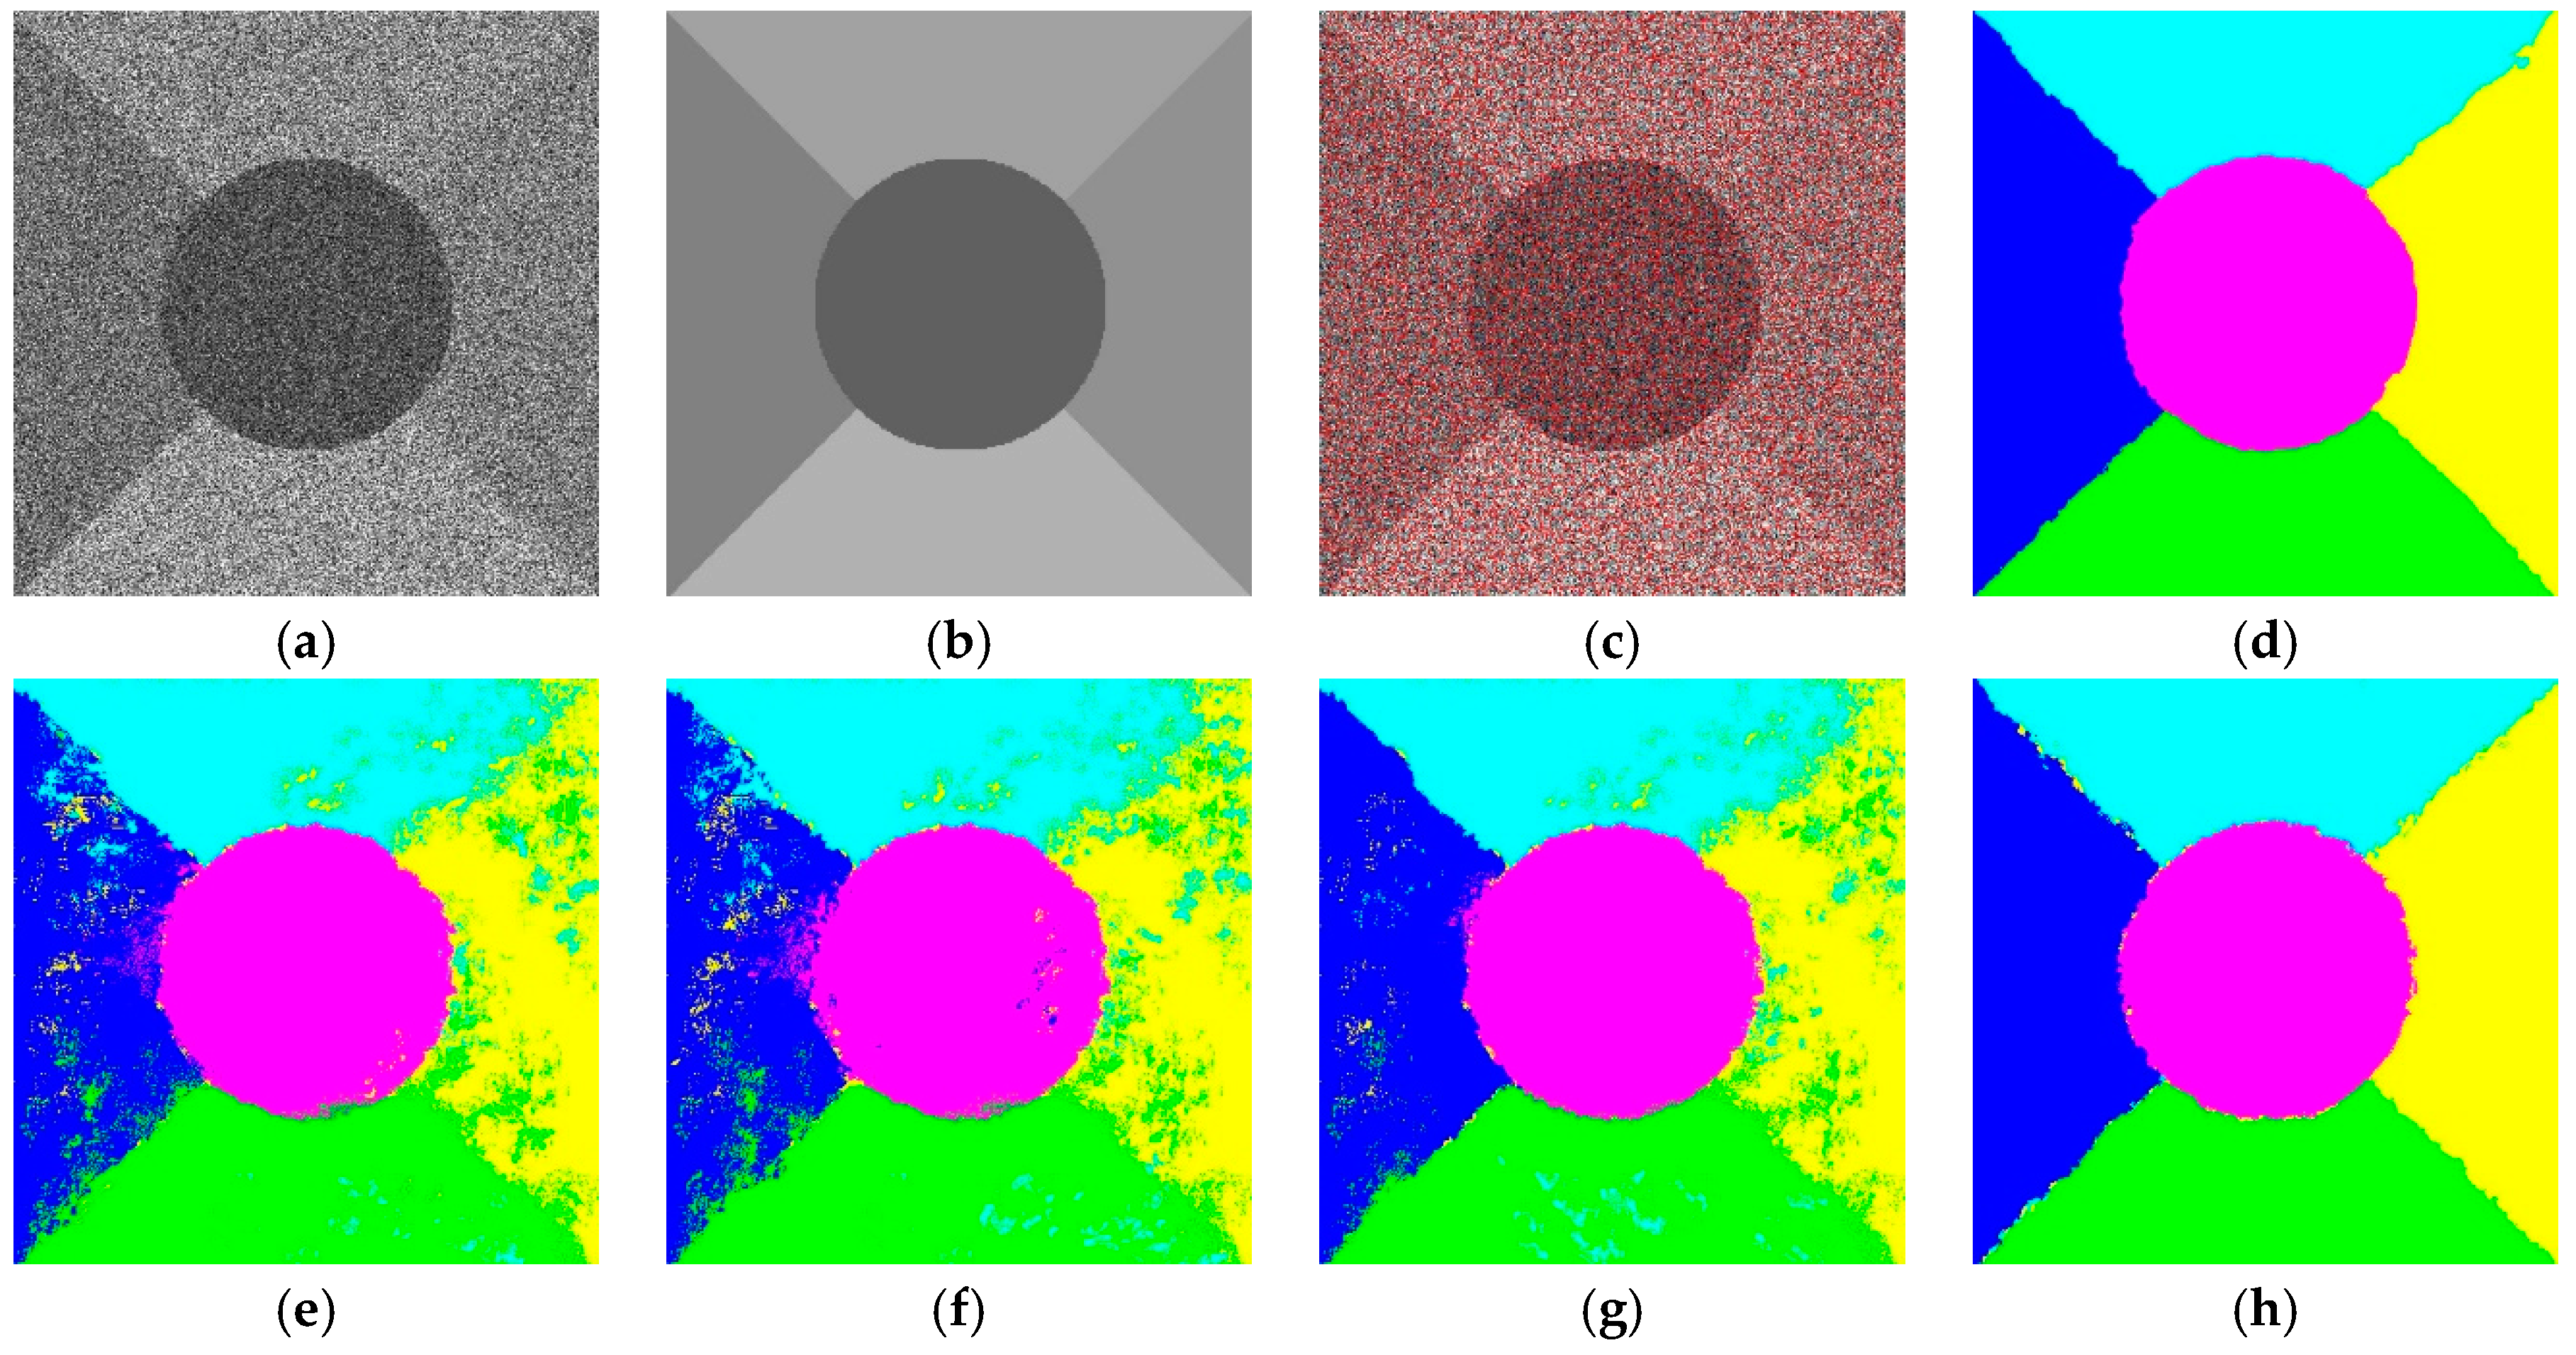
3.2. Results on Synthetic SAR Images
In this section, we test the capability of the proposed algorithm by applying it to the synthetic SAR images Syn1, Syn2, and Syn3. The superpixels of Syn1, Syn2, and Syn3 are 2800, 1500 and 2800, respectively. In our method,
and
is 0.221. The scale (patch) size in the support vector machine (SVM) [
3], SRC [
5] and JSRM [
16] is fixed and we set it to be 3 × 3. The ground truth was used to calculate the accuracy of the classification results to evaluate the contrast algorithms. We can see that the proposed method can obtain a higher accuracy of classification than the results of previous studies [
3,
5,
16] and can reduce the processing time found in reference [
17]. Moreover, as shown
Figure 8,
Figure 9 and
Figure 10, as well as
Table 1, the proposed method can keep the details (edges) in a similar way to reference [
17] in the visual representation. However, the results of the other methods in finer textural regions (marked with pink and yellow), such as
Figure 9e–g, have significantly different degrees of error, which is caused by the lack of samples. Although our method has no significant improvement in accuracy compared to the method in reference [
17], there are benefits to not requiring an extensive amount of time in pixel-by-pixel training and having less miscellaneous points existing in the final classification.
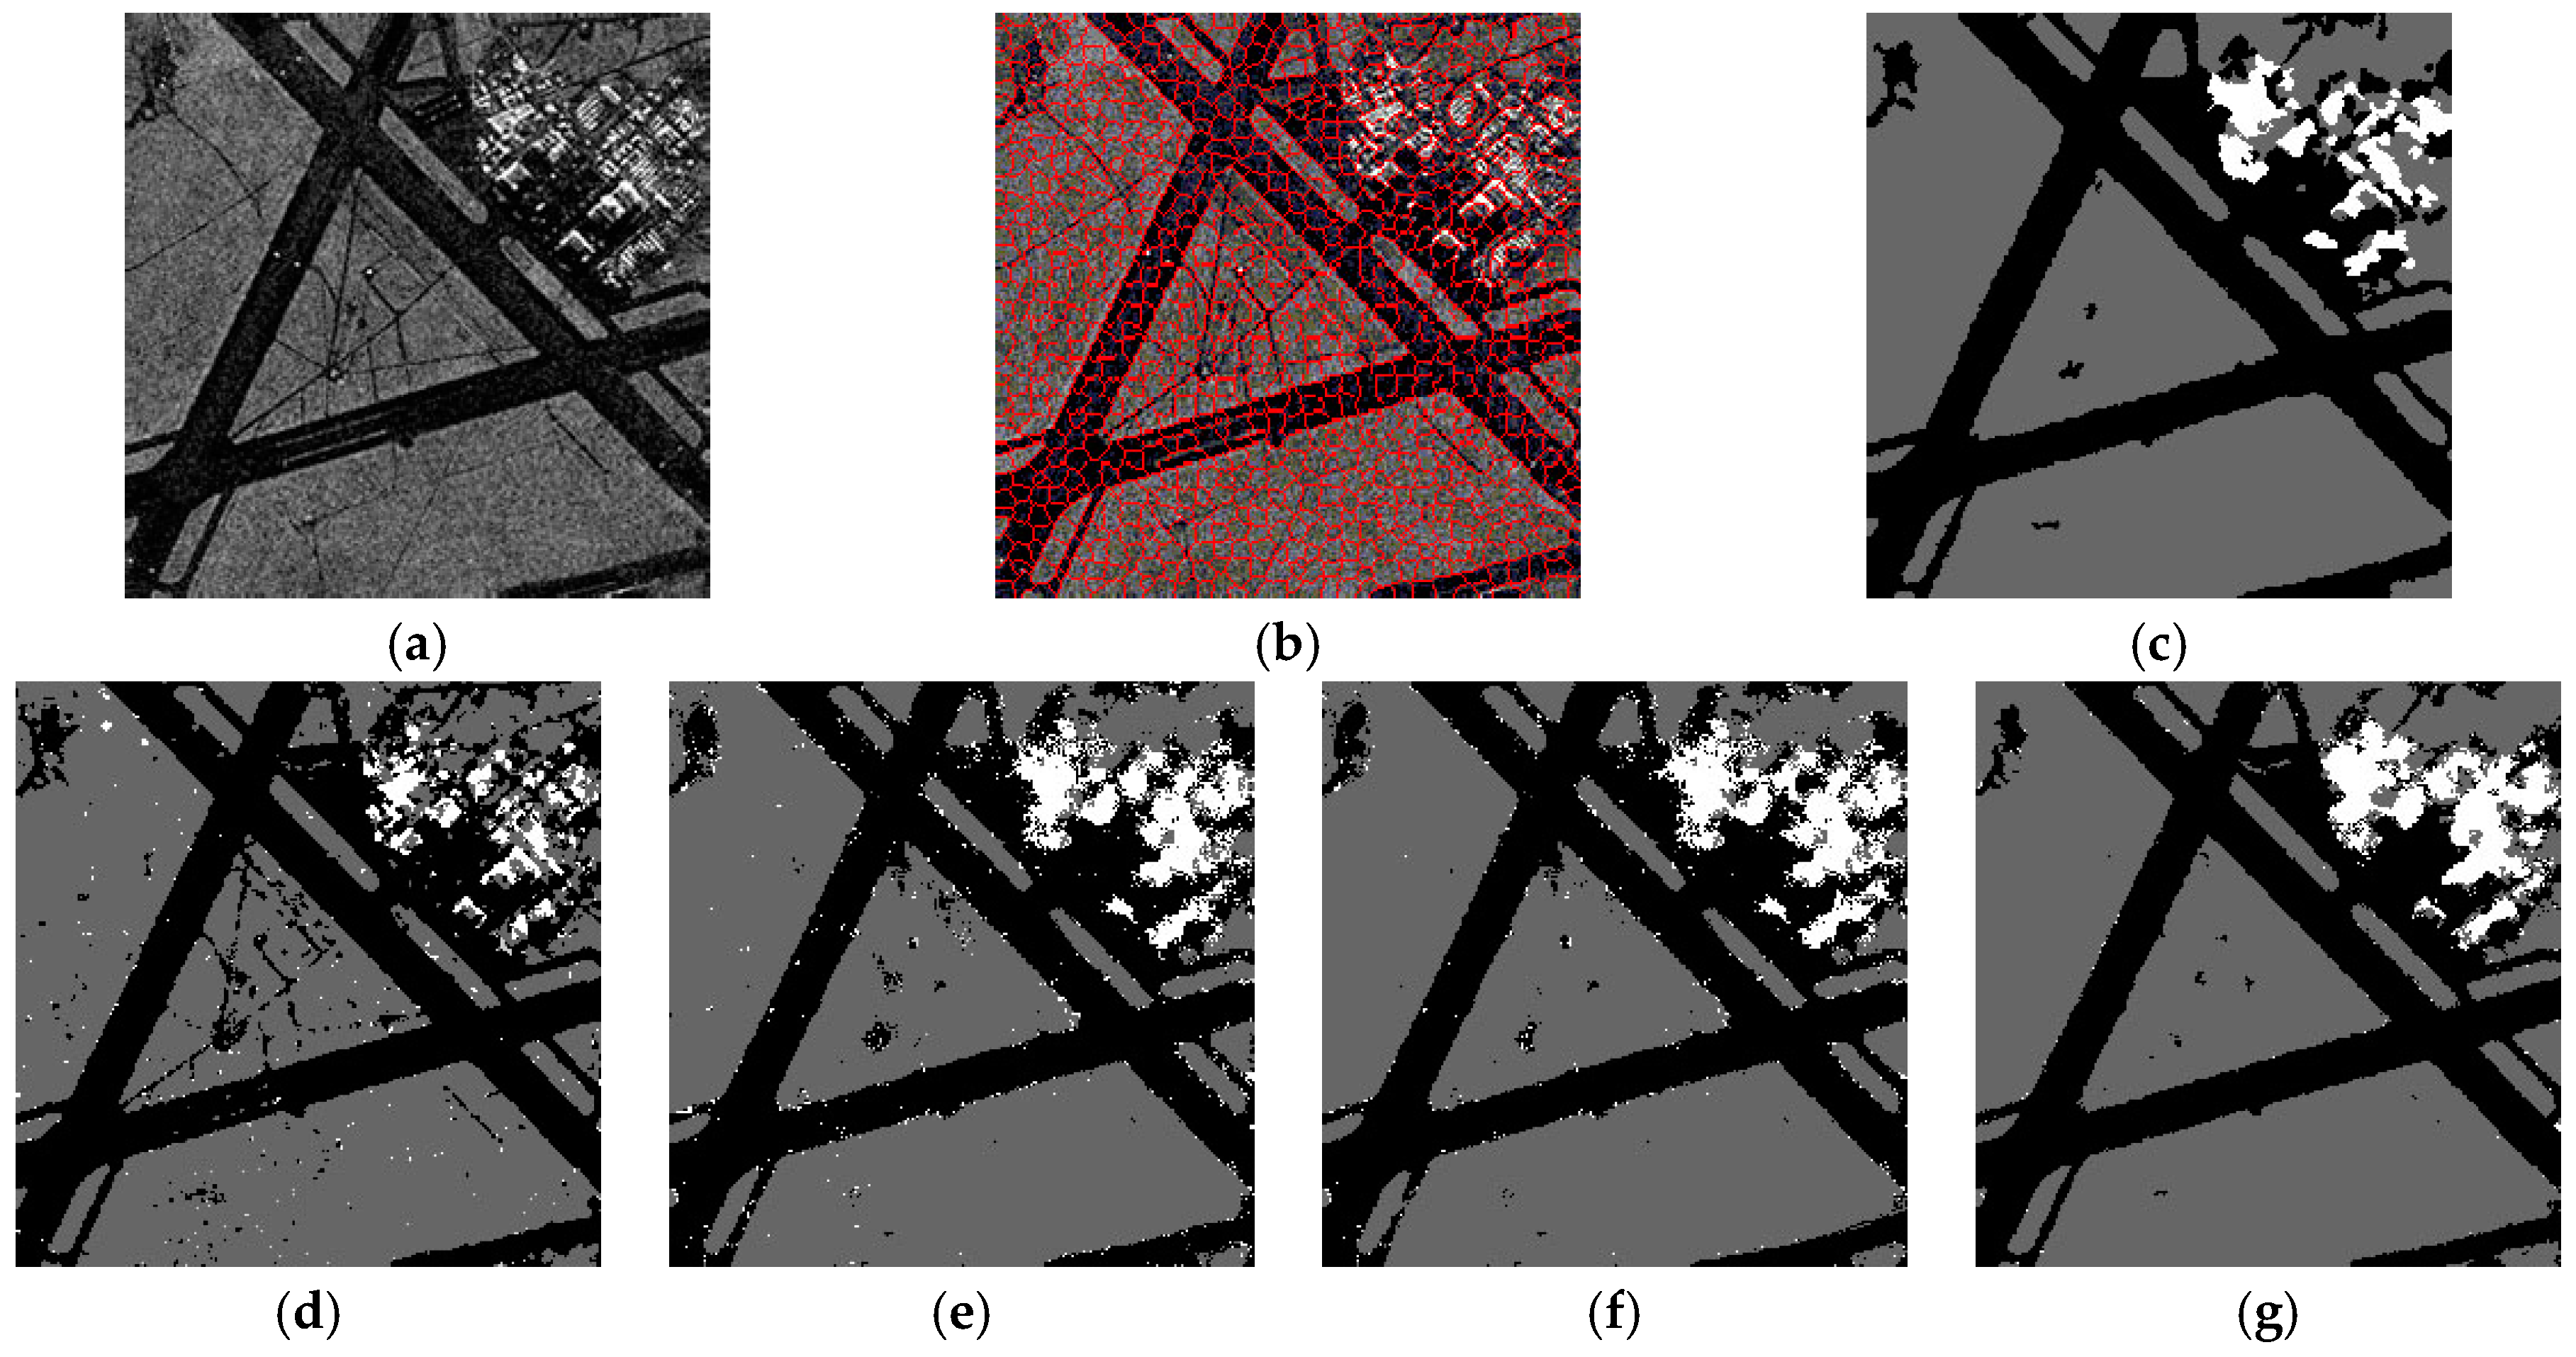
3.3. Results of Real SAR Images
In this section, three real SAR images are used for further analysis. The compared methods are the same as those used on synthetic SAR images. The results are shown in
Figure 11,
Figure 12 and
Figure 13. These original real images have three, three and four types of different regions as shown in
Figure 11b,
Figure 12b and
Figure 13b, respectively. The superpixels of SAR1, SAR2 and SAR3 are 1000, 1200 and 1100 as shown in
Figure 11b,
Figure 12b and
Figure 13b, respectively. The evaluation of the classification method is based on the visual inspection of the classification and the run time, accuracy, as well as the kappa coefficient. The scale in SVM, SRC and JSRM is set to 7 × 7, which represents the best result in the experiments.
From
Figure 11c–g, we can see that the proposed method can achieve the classification in different areas and eliminate the influence of shadows, which always leads to categories by mistake. However, when we compare
Figure 11c with 11g, it is difficult to know whether our proposed method is better, as it seems that
Figure 11g [
17] has better visualization results, albeit with some miscellaneous points. Therefore, the accuracy of the quantitative analysis is required for further analysis. From
Table 2, it can be seen that the accuracy of the previous study [
17] is only slightly higher than our proposed method, but the required running time is too long, as previously seen with synthetic SAR images.
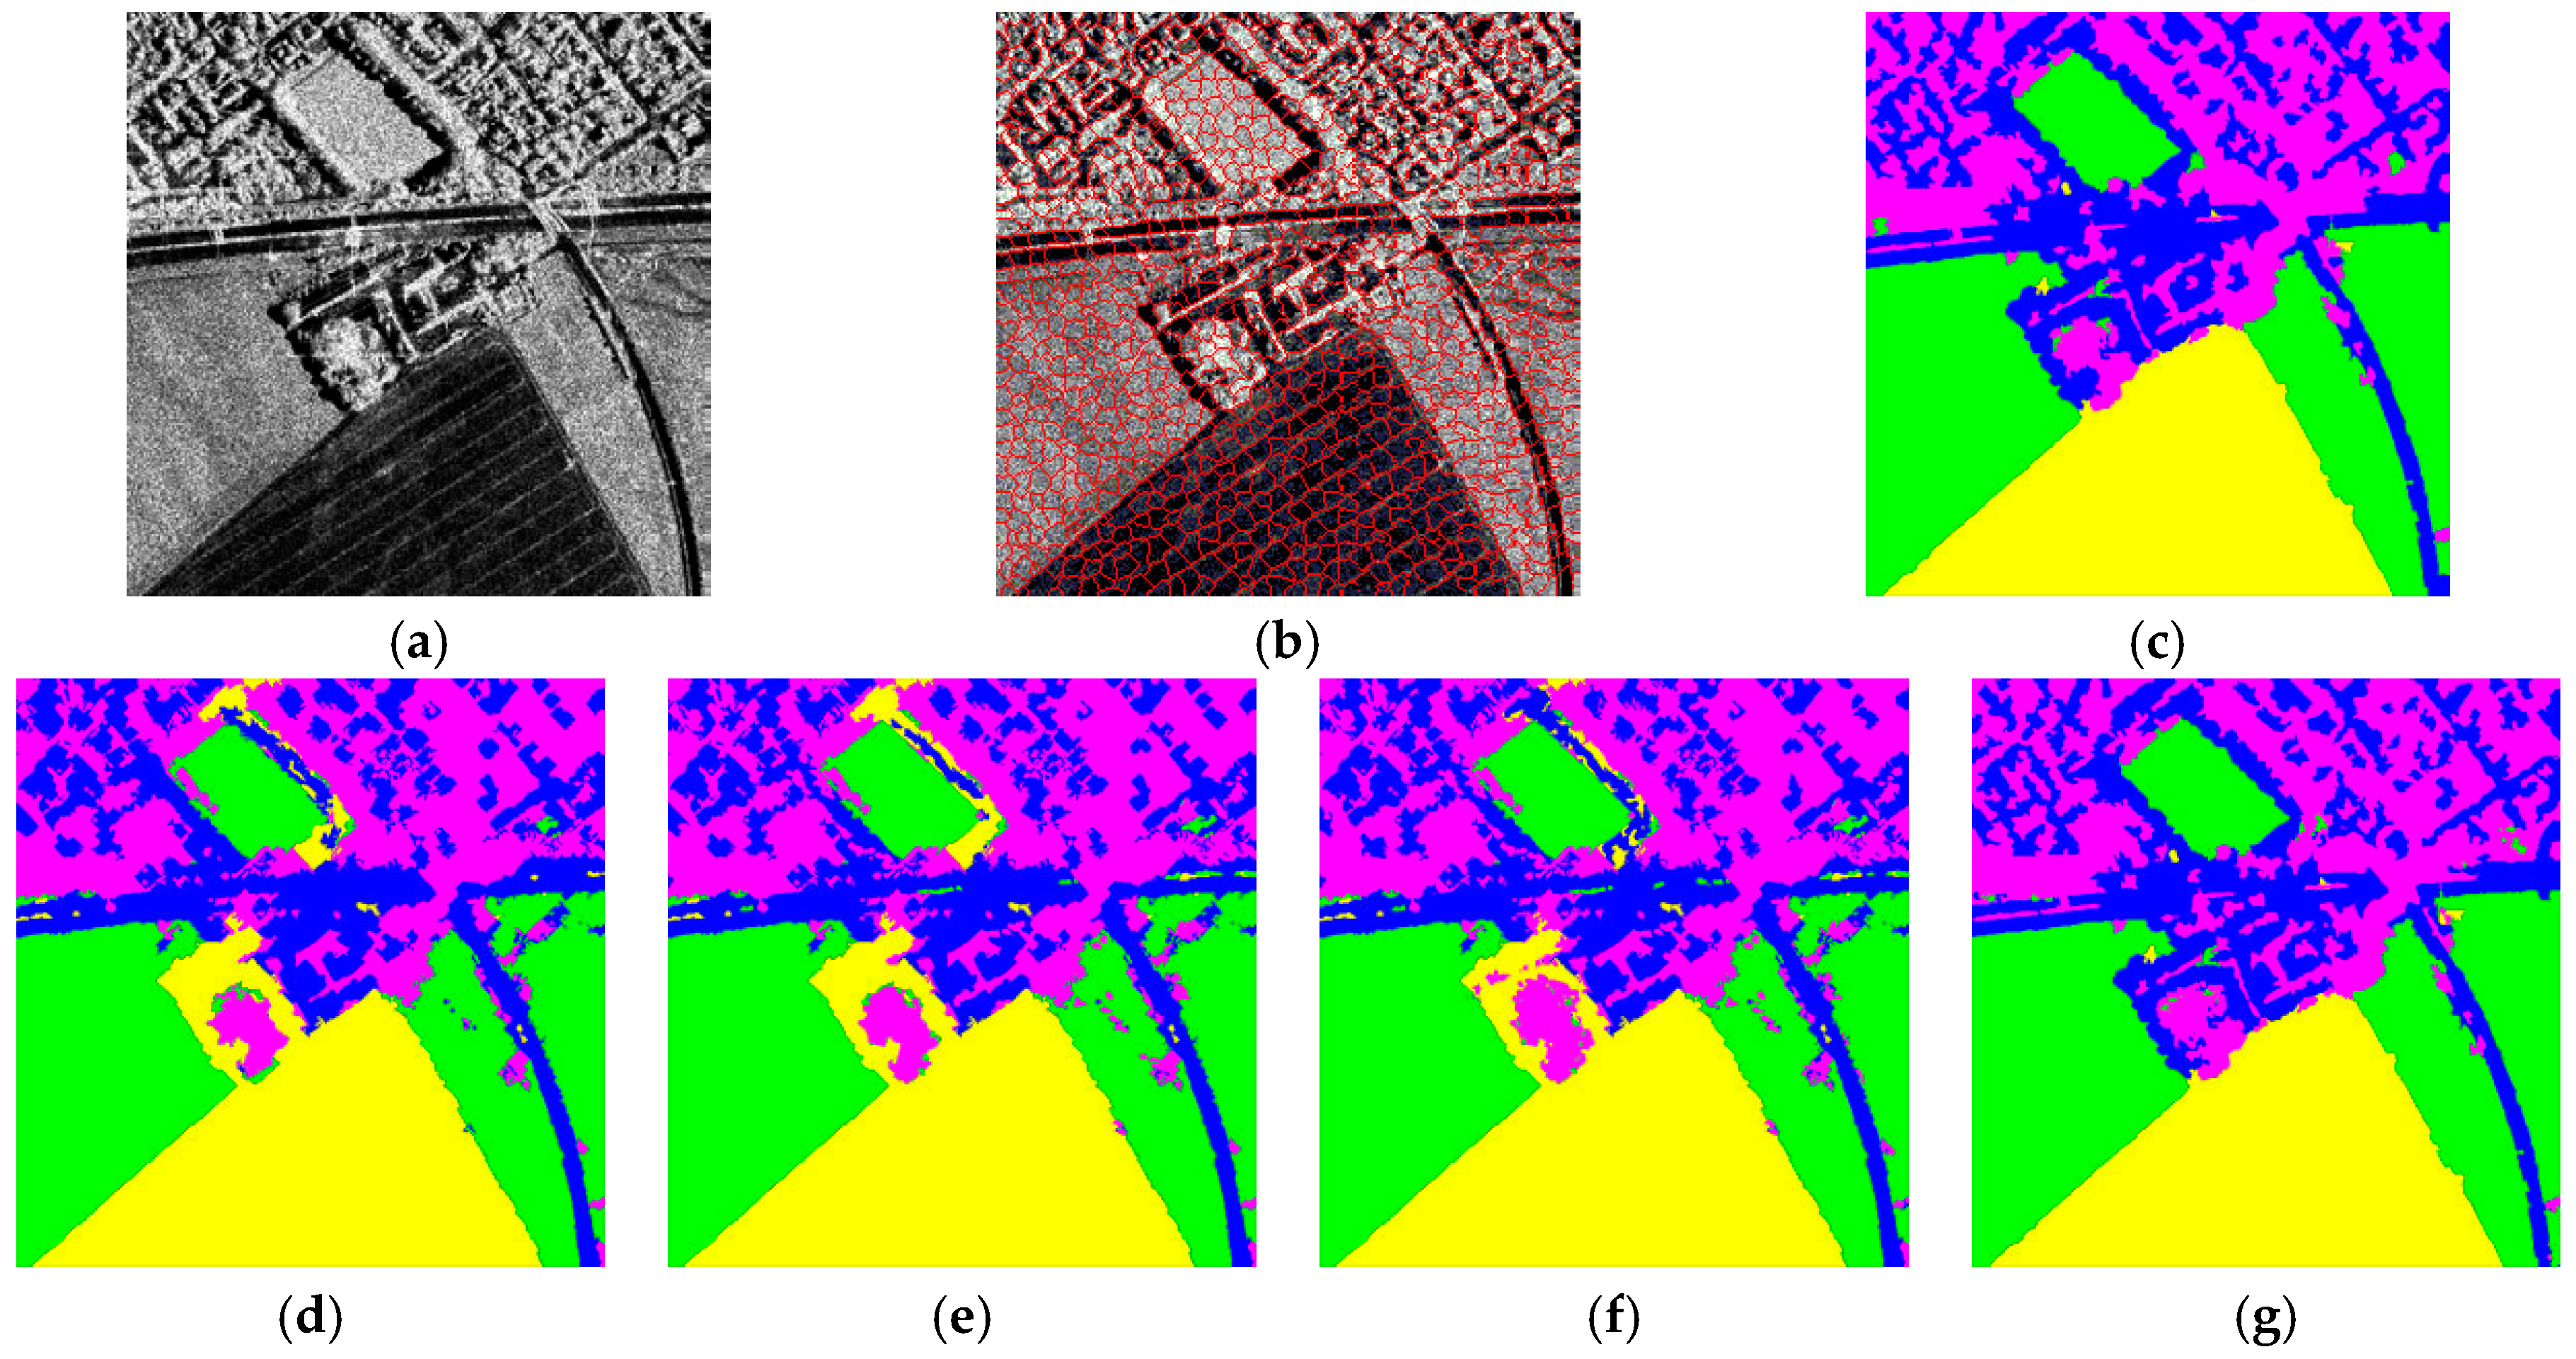
From
Figure 12c–g, we can see the classification results of different methods, especially in the yellow and red rectangle regions. The yellow and red rectangles of the proposed method in
Figure 12c have less miscellaneous points than
Figure 12d–f. In general, a smaller number of miscellaneous points indicates a more complete extraction of information and a more stable performance of the algorithm. The different rectangle regions highlight the superiority of the proposed algorithm. However, when we compare
Figure 12c with 12g, it is difficult to know whether our proposed method is better, as it seems that
Figure 12g [
17] has better visualization results, albeit with some miscellaneous points. Therefore, data analysis was used (accuracy, run time and kappa coefficient) for further analysis. From
Table 2, it can be seen that the accuracy of the previous method [
17] is only slightly higher than our proposed method, but the required running time was too long, as previously seen with synthetic SAR images.
The analysis of
Figure 13 is similar to
Figure 11 and
Figure 12. From
Figure 11,
Figure 12 and
Figure 13, the proposed method is shown to be suitable for the SAR image classification and obtains the optimal results.
Table 2 provides the quantitative evaluation of different methods. Although the HSRC obtains higher classification accuracy compared with the others, the running time is too long among the different methods. Our method has the absolute advantage in the running time, with competitive accuracy that is only slightly lower than HSRC. Moreover, our method gets the highest robustness, which is reflected by the kappa coefficient. Above all, our method outperforms the others in terms of time consumption and robustness.
4. Discussion
Traditional SVM [
3] is limited by lacking samples, which results in low classification accuracy. For instance, the number of training samples is 300, which is 0.46% of the total samples. Fewer samples affect the selection of optimal parameters by SVM for the testing samples, which will decrease the classification accuracy. In the sparse representation method, the HSRC [
13] can solve the problem of reference [
16] to a certain extent. It introduces the hierarchical concept and multi-size patch feature to solve the problem of lacking samples. Using SRC in SAR classification for both these methods improves the accuracy and stability. However, HSRC classifies images based on each pixel, which only depends on the selection of features in the spatial domain and the selected scale for each layer. This may lead to the loss or misrepresentation of information, which requires a long time for training.
In our paper, we inherit the advantages of reference [
17], such as multi-layer. However, the difference is the multi-scale and multi-feature fusion. In the multi-feature fusion stage, we take three different methods to extract the gray and texture characteristics, which are stable in the presence of noise and changes in view, and can enrich the information of images. Moreover, the strategy of the multi-feature fusion was inspired by [
23], which fused the different features from multiple layers. We fused the different features from different scales. This reduces the computational time and ensures a rich amount of information. Furthermore, classification based on superpixels can improve the speed of algorithms effectively. Three evaluation metrics (i.e., run time (time), average accuracy (AA) and the Kappa coefficient (K)) are adopted in these experiments to evaluate the quality of classification results. AA represents the mean of the percentage of correctly classified pixels for each class. K estimates the percentage of classified pixels corrected by the number of agreements. We performed comparative experiments with four other methods. The proposed method can solve the time redundancy problem of HSRC, but has its uncertainties. For instance, the uncertain points are always in the process of the algorithm until
. That is the reason we use the traditional SRC (this step is same as reference [
17]) in the last step.
5. Conclusions
In this paper, based on superpixels, we presented a new model of classification of SAR images. It validates that adding multiple features, scales and layers can benefit the results of SRC classification and enrich the information of the images. Furthermore, using multiple layers can decrease the computational time due to the use of superpixels. The fusion strategy was introduced to merge each scale together to form a multi-fusion dictionary. With the added benefits, robustness was enhanced and the classification accuracy was improved significantly. The comparison experiments based on synthetic SAR images and real SAR images clearly demonstrate the efficiency and advantages of the proposed classification method. Moreover, the proposed classification method is also able to achieve lower computational costs. These added benefits are general for SAR image classification, and can be suitable for utility in more applications in the area of SAR image classification, as well as in other areas where the SRC method could be applied.
This method provides a slight improvement in calculation time for SAR image classification and application. Moreover, future research will focus on developing more efficient algorithms to cope with the large-scale SAR images.


