Association of Cardiometabolic Multimorbidity Pattern with Dietary Factors among Adults in South Korea


Abstract
:1. Introduction
2. Materials and Methods
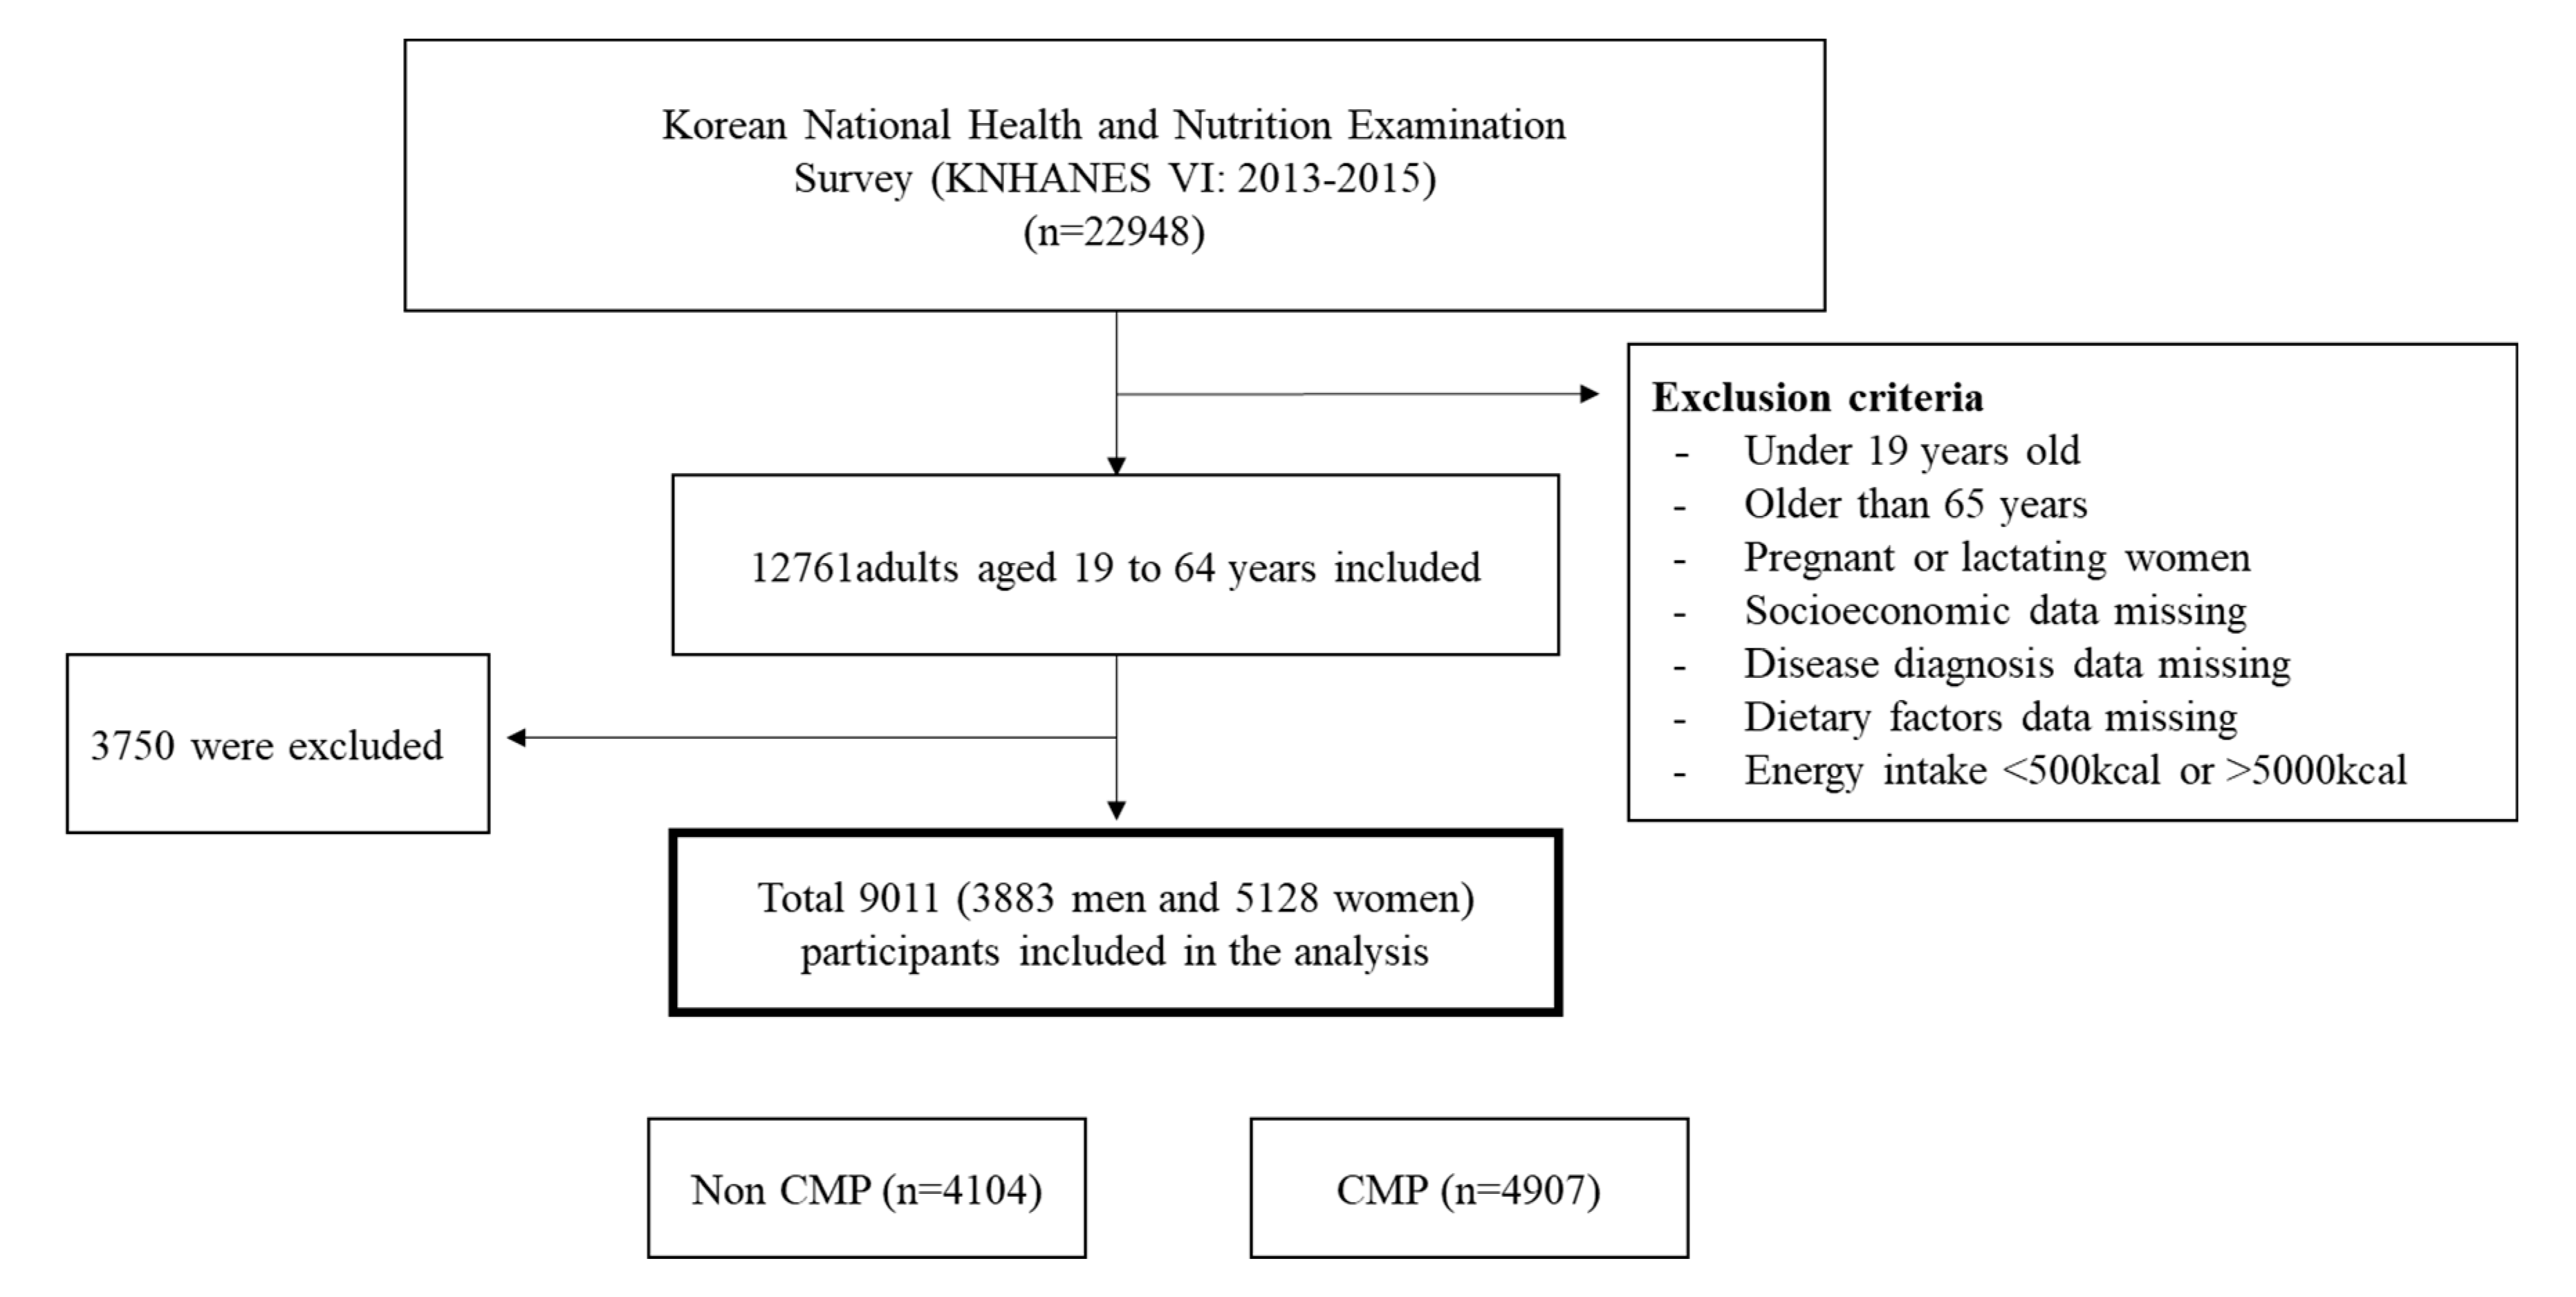
2.1. Study Population
2.2. Assessment of Dietary Factors
2.3. Health-Related Behaviors
2.4. Definition of Multimorbidity
2.5. Multimorbidity Pattern Analysis
2.6. Statistical Analysis
3. Results
3.1. Sociodemographic Characteristics and Health-Related Behaviors
3.2. Mean Daily Consumption of Food and Nutrients
3.3. Associations (ORs and 95% CIs) between Food and Nutrients and CMP
3.4. Associations (ORs and 95% CIs) between Health-Related Behaviors Including Dietary Habits and CMP
4. Discussion
5. Conclusions
Supplementary Materials
Author Contributions
Funding
Conflicts of Interest
References
- Van den Akker, M.; Buntinx, F.; Metsemakers, J.F.; Roos, S.; Knottnerus, J.A. Multimorbidity in general practice: Prevalence, incidence, and determinants of co-occurring chronic and recurrent diseases. J. Clin. Epidemiol. 1998, 51, 367–375. [Google Scholar] [CrossRef]
- Prados-Torres, A.; Poblador-Plou, B.; Calderón-Larrañaga, A.; Gimeno-Feliu, L.A.; González-Rubio, F.; Poncel-Falcó, A.; Sicras-Mainar, A.; Alcalá-Nalvaiz, J.T. Multimorbidity patterns in primary care: Interactions among chronic diseases using factor analysis. PLoS ONE 2012, 7, e32190. [Google Scholar] [CrossRef] [PubMed] [Green Version]
- Violan, C.; Foguet-Boreu, Q.; Flores-Mateo, G.; Salisbury, C.; Blom, J.; Freitag, M.; Glynn, L.; Muth, C.; Valderas, J.M. Prevalence, determinants and patterns of multimorbidity in primary care: A systematic review of observational studies. PLoS ONE 2014, 9, e102149. [Google Scholar] [CrossRef]
- Fortin, M.; Bravo, G.; Hudon, C.; Vanasse, A.; Lapointe, L. Prevalence of multimorbidity among adults seen in family practice. Ann. Fam. Med. 2005, 3, 223–228. [Google Scholar] [CrossRef] [Green Version]
- Fuchs, Z.; Blumstein, T.; Novikov, I.; Walter-Ginzburg, A.; Lyanders, M.; Gindin, J.; Habot, B.; Modan, B. Morbidity, comorbidity, and their association with disability among community-dwelling oldest-old in Israel. J. Gerontol. Ser. A Boil. Sci. Med Sci. 1998, 53, M447–M455. [Google Scholar] [CrossRef] [Green Version]
- Di Angelantonio, E.; Kaptoge, S.; Wormser, D.; Willeit, P.; Butterworth, A.S.; Bansal, N.; O’Keeffe, L.M.; Gao, P.; Wood, A.M.; Burgess, S.; et al. Association of Cardiometabolic Multimorbidity With Mortality. JAMA 2015, 314, 52–60. [Google Scholar] [CrossRef]
- Martin-Lesende, I.; Recalde, E.; Viviane-Wunderling, P.; Pinar, T.; Borghesi, F.; Aguirre, T.; Recio, M.; Martinez, M.E.; Asua, J. Mortality in a cohort of complex patients with chronic illnesses and multimorbidity: A descriptive longitudinal study. BMC Palliat. Care 2016, 15, 42. [Google Scholar] [CrossRef] [Green Version]
- Nunes, B.P.; Flores, T.R.; Mielke, G.I.; Thume, E.; Facchini, L.A. Multimorbidity and mortality in older adults: A systematic review and meta-analysis. Arch. Gerontol. Geriatr. 2016, 67, 130–138. [Google Scholar] [CrossRef]
- Prados-Torres, A.; Calderon-Larranaga, A.; Hancco-Saavedra, J.; Poblador-Plou, B.; van den Akker, M. Multimorbidity patterns: A systematic review. J. Clin. Epidemiol. 2014, 67, 254–266. [Google Scholar] [CrossRef] [PubMed]
- Ki, M.; Lee, Y.H.; Kim, Y.S.; Shin, J.Y.; Lim, J.; Nazroo, J. Socioeconomic inequalities in health in the context of multimorbidity: A Korean panel study. PLoS ONE 2017, 12, e0173770. [Google Scholar] [CrossRef]
- Kim, K.I.; Lee, J.H.; Kim, C.H. Impaired health-related quality of life in elderly women is associated with multimorbidity: Results from the Korean National Health and Nutrition Examination Survey. Gend. Med. 2012, 9, 309–318. [Google Scholar] [CrossRef] [PubMed]
- Tinetti, M.E.; Fried, T.R.; Boyd, C.M. Designing health care for the most common chronic condition--multimorbidity. JAMA 2012, 307, 2493–2494. [Google Scholar] [CrossRef]
- Laaksonen, D.E.; Lakka, H.-M.; Salonen, J.T.; Niskanen, L.K.; Rauramaa, R.; Lakka, T.A. Low levels of leisure-time physical activity and cardiorespiratory fitness predict development of the metabolic syndrome. Diabetes Care 2002, 25, 1612–1618. [Google Scholar] [CrossRef] [PubMed] [Green Version]
- Chen, C.-C.; Li, T.-C.; Chang, P.-C.; Liu, C.-S.; Lin, W.-Y.; Wu, M.-T.; Li, C.-I.; Lai, M.-M.; Lin, C.-C. Association among cigarette smoking, metabolic syndrome, and its individual components: The metabolic syndrome study in Taiwan. Metabolism 2008, 57, 544–548. [Google Scholar] [CrossRef] [PubMed]
- Fortin, M.; Haggerty, J.; Almirall, J.; Bouhali, T.; Sasseville, M.; Lemieux, M. Lifestyle factors and multimorbidity: A cross sectional study. BMC Public Health 2014, 14, 686. [Google Scholar] [CrossRef] [PubMed] [Green Version]
- Ruel, G.; Shi, Z.; Zhen, S.; Zuo, H.; Kroger, E.; Sirois, C.; Levesque, J.F.; Taylor, A.W. Association between nutrition and the evolution of multimorbidity: The importance of fruits and vegetables and whole grain products. Clin. Nutr. 2014, 33, 513–520. [Google Scholar] [CrossRef]
- Calder, P.C. n−3 polyunsaturated fatty acids, inflammation, and inflammatory diseases. Am. J. Clin. Nutr. 2006, 83, 1505S–1519S. [Google Scholar] [CrossRef]
- Micha, R.; Penalvo, J.L.; Cudhea, F.; Imamura, F.; Rehm, C.D.; Mozaffarian, D. Association Between Dietary Factors and Mortality from Heart Disease, Stroke, and Type 2 Diabetes in the United States. JAMA 2017, 317, 912–924. [Google Scholar] [CrossRef] [Green Version]
- St-Onge, M.P.; Ard, J.; Baskin, M.L.; Chiuve, S.E.; Johnson, H.M.; Kris-Etherton, P.; Varady, K. Meal Timing and Frequency: Implications for Cardiovascular Disease Prevention: A Scientific Statement from the American Heart Association. Circulation 2017, 135, e96–e121. [Google Scholar] [CrossRef]
- National Academy of Agricultural Sciences. Food Composition Table, 8th ed.; Rural Resources Development Institute: Suwon, Korea, 2011; pp. 1–636. [Google Scholar]
- Korean Nutrition Society. Dietary Reference Intakes for Koreans; Korean Nutrition Society: Seoul, Korea, 2015. [Google Scholar]
- Clerc, O.; Nanchen, D.; Cornuz, J.; Marques-Vidal, P.; Gmel, G.; Daeppen, J.B.; Paccaud, F.; Mooser, V.; Waeber, G.; Vollenweider, P.; et al. Alcohol drinking, the metabolic syndrome and diabetes in a population with high mean alcohol consumption. Diabet. Med. 2010, 27, 1241–1249. [Google Scholar] [CrossRef]
- Chun, M.Y. Validity and reliability of korean version of international physical activity questionnaire short form in the elderly. Korean J. Fam. Med. 2012, 33, 144–151. [Google Scholar] [CrossRef] [Green Version]
- Chobanian, A.; Bakris, G.; Black, H.; Cushman, W.; Green, L.; Izzo, J., Jr.; Jones, D.; Materson, B.; Oparil, S.; Wright, J., Jr.; et al. Seventh report of the joint national committee on prevention, detection, evaluation, and treatment of high blood pressure. Hypertension 2003, 42, 1206–1252. [Google Scholar] [CrossRef] [PubMed] [Green Version]
- Soebardi, S.; Purnamasari, D.; Oemardi, M.; Soewondo, P.; Waspadji, S.; Soegondo, S. Dyslipidemia in newly diagnosed diabetes mellitus: The Jakarta primary non-communicable disease risk factors surveillance 2006. Acta Med. Indones. 2009, 41, 186–190. [Google Scholar]
- Ko, S.-H.; Kim, S.-R.; Kim, D.-J.; Oh, S.-J.; Lee, H.-J.; Shim, K.-H.; Woo, M.-H.; Kim, J.-Y.; Kim, N.-H.; Kim, J.-T. 2011 Clinical practice guidelines for type 2 diabetes in Korea. Diabetes Metab. J. 2011, 35, 431–436. [Google Scholar] [CrossRef] [PubMed]
- World Health Organization, Regional Office for the Western Pacific, International Association for the Study of Obesity, International Obesity Task Force. The Asia-Pacific Perspective: Redefining Obesity and Its Treatment; Health Communications Australia: Melbourne, Australia, 2000. [Google Scholar]
- Vayá, A.; Giménez, C.; Sarnago, A.; Alba, A.; Rubio, O.; Hernández-Mijares, A.; Cámara, R. Subclinical hypothyroidism and cardiovascular risk. Clin. Hemorheol. Microcirc. 2014, 58, 1–7. [Google Scholar] [CrossRef] [PubMed]
- Fabrigar, L.R.; Wegener, D.T. Exploratory Factor Analysis; Oxford University Press: Oxford, UK, 2011. [Google Scholar]
- Osborne, J.W.; Banjanovic, E.S. Exploratory Factor Analysis with SAS; SAS Institute: Cary, NC, USA, 2016. [Google Scholar]
- Cruz-Jentoft, A.J.; Bahat, G.; Bauer, J.; Boirie, Y.; Bruyere, O.; Cederholm, T.; Cooper, C.; Landi, F.; Rolland, Y.; Sayer, A.A.; et al. Sarcopenia: Revised European consensus on definition and diagnosis. Age Ageing 2019, 48, 16–31. [Google Scholar] [CrossRef] [Green Version]
- Marengoni, A.; Angleman, S.; Melis, R.; Mangialasche, F.; Karp, A.; Garmen, A.; Meinow, B.; Fratiglioni, L. Aging with multimorbidity: A systematic review of the literature. Ageing Res. Rev. 2011, 10, 430–439. [Google Scholar] [CrossRef] [PubMed]
- An, K.O.; Kim, J. Association of Sarcopenia and Obesity with Multimorbidity in Korean Adults: A Nationwide Cross-Sectional Study. J. Am. Med Dir. Assoc. 2016, 17, 960.e1–960.e7. [Google Scholar] [CrossRef]
- Garin, N.; Koyanagi, A.; Chatterji, S.; Tyrovolas, S.; Olaya, B.; Leonardi, M.; Lara, E.; Koskinen, S.; Tobiasz-Adamczyk, B.; Ayuso-Mateos, J.L.; et al. Global Multimorbidity Patterns: A Cross-Sectional, Population-Based, Multi-Country Study. J. Gerontol. Ser. A Boil. Sci. Med Sci. 2016, 71, 205–214. [Google Scholar] [CrossRef] [Green Version]
- Agborsangaya, C.B.; Lau, D.; Lahtinen, M.; Cooke, T.; Johnson, J.A. Multimorbidity prevalence and patterns across socioeconomic determinants: A cross-sectional survey. BMC Public Health 2012, 12, 201. [Google Scholar] [CrossRef] [Green Version]
- Marengoni, A.; Winblad, B.; Karp, A.; Fratiglioni, L. Prevalence of chronic diseases and multimorbidity among the elderly population in Sweden. Am. J. Public Health 2008, 98, 1198–1200. [Google Scholar] [CrossRef] [PubMed] [Green Version]
- Gan, Y.; Tong, X.; Li, L.; Cao, S.; Yin, X.; Gao, C.; Herath, C.; Li, W.; Jin, Z.; Chen, Y.; et al. Consumption of fruit and vegetable and risk of coronary heart disease: A meta-analysis of prospective cohort studies. Int. J. Cardiol. 2015, 183, 129–137. [Google Scholar] [CrossRef] [PubMed]
- Mozaffarian, D. Dietary and Policy Priorities for Cardiovascular Disease, Diabetes, and Obesity: A Comprehensive Review. Circulation 2016, 133, 187–225. [Google Scholar] [CrossRef] [PubMed]
- Shi, Z.; Ruel, G.; Dal Grande, E.; Pilkington, R.; Taylor, A.W. Soft drink consumption and multimorbidity among adults. Clin. Nutr. ESPEN 2015, 10, e71–e76. [Google Scholar] [CrossRef]
- Hu, F.B. Resolved: There is sufficient scientific evidence that decreasing sugar-sweetened beverage consumption will reduce the prevalence of obesity and obesity-related diseases. Obes. Rev. 2013, 14, 606–619. [Google Scholar] [CrossRef]
- McCarron, D.A.; Reusser, M.E. Are low intakes of calcium and potassium important causes of cardiovascular disease? Am. J. Hypertens. 2001, 14, 206s–212s. [Google Scholar] [CrossRef] [Green Version]
- Ascherio, A.; Rimm, E.B.; Hernan, M.A.; Giovannucci, E.L.; Kawachi, I.; Stampfer, M.J.; Willett, W.C. Intake of potassium, magnesium, calcium, and fiber and risk of stroke among US men. Circulation 1998, 98, 1198–1204. [Google Scholar] [CrossRef] [Green Version]
- Jacobsen, R.; Lorenzen, J.K.; Toubro, S.; Krog-Mikkelsen, I.; Astrup, A. Effect of short-term high dietary calcium intake on 24-h energy expenditure, fat oxidation, and fecal fat excretion. Int. J. Obes. 2005, 29, 292–301. [Google Scholar] [CrossRef] [Green Version]
- Gomes, J.; Costa, J.; Alfenas, R. Effect of increased calcium consumption from fat-free milk in an energy-restricted diet on the metabolic syndrome and cardiometabolic outcomes in adults with type 2 diabetes mellitus: A randomised cross-over clinical trial. Br. J. Nutr. 2018, 119, 422–430. [Google Scholar] [CrossRef]
- Wang, L.; Manson, J.E.; Buring, J.E.; Lee, I.M.; Sesso, H.D. Dietary intake of dairy products, calcium, and vitamin D and the risk of hypertension in middle-aged and older women. Hypertension 2008, 51, 1073–1079. [Google Scholar] [CrossRef]
- Sacks, F.M.; Svetkey, L.P.; Vollmer, W.M.; Appel, L.J.; Bray, G.A.; Harsha, D.; Obarzanek, E.; Conlin, P.R.; Miller, E.R., 3rd; Simons-Morton, D.G.; et al. Effects on blood pressure of reduced dietary sodium and the Dietary Approaches to Stop Hypertension (DASH) diet. N. Engl. J. Med. 2001, 344, 3–10. [Google Scholar] [CrossRef] [PubMed]
- Kotchen, T.A.; Kotchen, J.M. Dietary sodium and blood pressure: Interactions with other nutrients. Am. J. Clin. Nutr. 1997, 65, 708S–711S. [Google Scholar] [CrossRef] [PubMed] [Green Version]
- Alderman, M.H. Evidence relating dietary sodium to cardiovascular disease. J. Am. Coll. Nutr. 2006, 25, 256S–261S. [Google Scholar] [CrossRef] [PubMed]
- Díaz-Redondo, A.; Giráldez-García, C.; Carrillo, L.; Serrano, R.; García-Soidán, F.J.; Artola, S.; Franch, J.; Díez, J.; Ezkurra, P.; Millaruelo, J.M. Modifiable risk factors associated with prediabetes in men and women: A cross-sectional analysis of the cohort study in primary health care on the evolution of patients with prediabetes (PREDAPS-Study). BMC Fam. Pract. 2015, 16, 5. [Google Scholar] [CrossRef] [Green Version]


| Variables | Non-CMP | CMP | p-Value † |
|---|---|---|---|
| (n = 4104) | (n = 4907) | ||
| Age | 36.27 ± 0.21 | 45.07 ± 0.24 | <0.0001 |
| Sex (n,%) | |||
| Male | 1379 (41.65) | 2504 (58.87) | <0.0001 |
| Female | 2725 (58.35) | 2403 (41.13) | |
| Region (n,%) | |||
| Urban | 3046 (74.11) | 3456 (71.09) | 0.013 |
| Rural | 1058 (25.89) | 1451 (28.91) | |
| Education (n, %) | |||
| ≤Elementary school | 147 (2.92) | 685 (10.99) | <0.0001 |
| Middle school | 215 (4.45) | 626 (11.06) | |
| High school | 1728 (44.56) | 1876 (40.32) | |
| ≥College | 2014 (48.08) | 1720 (37.63) | |
| Income (n,%) 1 | |||
| Lowest | 890 (22.96) | 1278 (26.06) | 0.010 |
| Low-middle | 1013 (25.14) | 1264 (26.10) | |
| Middle-high | 1088 (25.77) | 1192 (23.93) | |
| Highest | 1113 (26.12) | 1173 (23.91) | |
| Occupation (n,%) 2 | |||
| Office worker | 2016 (48.68) | 2014 (42.91) | <0.0001 |
| Laborer | 678 (17.00) | 1426 (29.17) | |
| Unemployed | 1410 (34.31) | 1467 (27.92) | |
| Physical activity (n,%) 3 | |||
| Inactive | 1518 (35.34) | 1808 (34.98) | 0.330 |
| Active | 1904 (46.53) | 2219 (45.47) | |
| Health enhancing | 682 (18.13) | 880 (19.55) | |
| Smoking status (n, %) | |||
| Current-smoker | 696 (19.67) | 1214 (28.74) | <0.0001 |
| Ex-smoker | 581 (15.70) | 1039 (22.48) | |
| Non-smoker | 2819 (64.63) | 2627 (48.78) | |
| Alcohol intake (n,%) 4 | |||
| Low risk | 3566 (86.59) | 3979 (79.21) | <0.0001 |
| High risk | 538 (13.41) | 928 (20.79) |
| Variables | Non-CMP | CMP | p-Value † |
|---|---|---|---|
| (n = 4104) | (n = 4907) | ||
| Nutrients | |||
| Energy (kcal) | 2117.10 ± 15.20 | 2118.08 ± 15.33 | |
| Percentage from energy | |||
| Carbohydrates (%) | 63.8 ± 0.20 | 63.8 ± 0.21 | |
| Protein (%) | 14.7 ± 0.09 | 14.8 ± 0.08 | |
| Fat (%) | 21.5 ± 0.16 | 21.4 ± 0.16 | |
| Carbohydrates (g) | 318.22 ± 1.46 | 313.95 ± 1.57 | 0.050 |
| Protein (g) | 74.97 ± 0.49 | 74.71 ± 0.43 | |
| Fat (g) | 49.98 ± 0.44 | 49.83 ± 0.40 | |
| Cholesterol (mg) | 277.34 ± 4.23 | 277.85 ± 4.21 | |
| Fiber (g) | 21.99 ± 0.24 | 22.66 ± 0.27 | |
| Calcium (mg) | 515.83 ± 4.82 | 501.21 ± 4.69 | 0.030 |
| Phosphorus (mg) | 1134.60 ± 6.00 | 1123.77 ± 5.52 | |
| Iron (mg) | 17.89 ± 0.23 | 18.06 ± 0.38 | |
| Sodium (mg) | 4132.09 ± 42.11 | 4111.74 ± 39.02 | |
| Potassium (mg) | 3164.58 ± 23.58 | 3106.58 ± 22.06 | |
| Vitamin A (μg RE) | 768.6 ± 17.53 | 755.5 ± 16.86 | |
| Thiamine (mg) | 2.11 ± 0.01 | 2.1 ± 0.01 | |
| Riboflavin (mg) | 1.47 ± 0.01 | 1.44 ± 0.01 | |
| Niacin (mg) | 17.45 ± 0.13 | 17.31 ± 0.13 | |
| Vitamin C (mg) | 102.13 ± 2.25 | 99.6 ± 2.39 | |
| Food group | |||
| Cereals (g) | 298.09 ± 2.39 | 297.99 ± 2.79 | |
| Potato and starches (g) | 42.76 ± 1.92 | 40.54 ± 2.00 | |
| Sugar and sweeteners (g) | 13.08 ± 0.44 | 11.51 ± 0.34 | 0.000 |
| Pulses (g) | 35.38 ± 1.40 | 36.91 ± 1.73 | |
| Nuts and seeds (g) | 8.8 ± 0.62 | 7.46 ± 0.58 | |
| Vegetables (g) | 326.88 ± 4.07 | 325.89 ± 4.02 | |
| Fungi and mushrooms (g) | 6.4 ± 0.37 | 6.89 ± 0.48 | |
| Fruits (g) | 208.7 ± 5.19 | 192.07 ± 5.40 | 0.020 |
| Meats (g) | 111.43 ± 2.45 | 112.41 ± 2.32 | |
| Eggs (g) | 29.58 ± 0.84 | 30.12 ± 0.85 | |
| Fish and shellfish (g) | 100.67 ± 3.49 | 97.23 ± 2.66 | |
| Seaweeds (g) | 25.92 ± 1.94 | 24.02 ± 1.59 | |
| Milks (g) | 90.2 ± 2.79 | 88.42 ± 2.96 | |
| Oil and fat (g) | 9.26 ± 0.19 | 9.63 ± 0.19 | |
| Beverages § (g) | 342.62 ± 8.08 | 370.13 ± 10.01 | 0.050 |
| Seasonings (g) | 41.17 ± 1.14 | 41.35 ± 1.02 | |
| Processed foods (g) | 0.23 ± 0.15 | 0.46 ± 0.18 |
| Variables | Crude | Model 1 † | Model 2 ‡ | |||
|---|---|---|---|---|---|---|
| OR | 95% CI | OR | 95% CI | OR | 95% CI | |
| Nutrients | ||||||
| PUFAs§(g) | ||||||
| Tertile 1 (Ref) | 1 | - | 1 | - | 1 | - |
| Tertile 2 | 1.215 | (1.076–1.373) | 0.827 | (0.723–0.946) | 0.875 | (0.763–1.003) |
| Tertile 3 | 1.217 | (1.068–1.388) | 0.843 | (0.714–0.995) | 0.912 | (0.770–1.081) |
| p for trend | 0.003 | 0.02 | 0.157 | |||
| Dietary fiber (g) | ||||||
| Tertile 1 (Ref) | 1 | - | 1 | - | 1 | - |
| Tertile 2 | 0.867 | (0.767–0.980) | 0.855 | (0.746–0.979) | 0.901 | (0.784–1.064) |
| Tertile 3 | 0.652 | (0.579–0.735) | 0.823 | (0.701–0.967) | 0.901 | (0.763–1.064) |
| p for trend | <0.0001 | 0.038 | 0.316 | |||
| Calcium (mg) | ||||||
| Tertile 1 (Ref) | 1 | - | 1 | - | 1 | - |
| Tertile 2 | 0.983 | (0.870–1.111) | 0.781 | (0.656–0.930) | 0.843 | (0.734–0.969) |
| Tertile 3 | 0.903 | (0.802–1.017) | 0.814 | (0.676–0.980) | 0.809 | (0.691–0.945) |
| p for trend | 0.17 | 0.015 | 0.018 | |||
| Sodium (mg) | ||||||
| Tertile 1 (Ref) | 1 | - | 1 | - | 1 | - |
| Tertile 2 | 1.019 | (0.896–1.158) | 0.833 | (0.724–0.959) | 0.866 | (0.751–0.997) |
| Tertile 3 | 0.870 | (0.700–0.983) | 0.86 | (0.730–1.013) | 0.901 | (0.763–1.063) |
| p for trend | 0.008 | 0.038 | 0.135 | |||
| Potassium (mg) | ||||||
| Tertile 1 (Ref) | 1 | - | 1 | - | 1 | - |
| Tertile 2 | 0.963 | (0.849–1.092) | 0.765 | (0.663–0.883) | 0.804 | (0.696–0.929) |
| Tertile 3 | 0.775 | (0.685–0.876) | 0.759 | (0.639–0.901) | 0.838 | (0.704–0.998) |
| p for trend | <0.0001 | 0.001 | 0.013 | |||
| Foods | ||||||
| Cereals (g) | ||||||
| Tertile 1 (Ref) | 1 | - | 1 | - | 1 | - |
| Tertile 2 | 0.926 | (0.826–1.040) | 0.901 | (0.796–1.021) | 0.921 | (0.813–1.044) |
| Tertile 3 | 0.823 | (0.736–0.920) | 0.921 | (0.793–1.069) | 0.953 | (0.818–1.110) |
| p for trend | 0.003 | 0.255 | 0.385 | |||
| Fruits (g) | ||||||
| Tertile 1 (Ref) | 1 | - | 1 | - | 1 | - |
| Tertile 2 | 1.205 | (1.069–1.358) | 0.769 | (0.675–0.877) | 0.818 | (0.717–0.933) |
| Tertile 3 | 1.071 | (0.952–1.205) | 0.759 | (0.666–0.865) | 0.841 | (0.736–0.960) |
| p for trend | 0.009 | <0.0001 | 0.001 | |||
| Vegetables (g) | ||||||
| Tertile 1 (Ref) | 1 | - | 1 | - | 1 | - |
| Tertile 2 | 0.857 | (0.757–0.971) | 0.836 | (0.729–0.960) | 0.857 | (0.746–0.985) |
| Tertile 3 | 0.642 | (0.566–0.728) | 0.877 | (0.751–1.024) | 0.911 | (0.778–1.067) |
| p for trend | <0.0001 | 0.04 | 0.091 | |||
| Meats (g) | ||||||
| Tertile 1 (Ref) | 1 | - | 1 | - | 1 | - |
| Tertile 2 | 1.300 | (1.149–1.470) | 0.872 | (0.760–1.000) | 0.912 | (0.793–1.049) |
| Tertile 3 | 1.423 | (1.253–1.616) | 0.881 | (0.761–1.021) | 0.911 | (0.784–1.059) |
| p for trend | <0.0001 | 0.121 | 0.376 | |||
| Variables | Crude | Model 1 † | Model 2 †† | |||
|---|---|---|---|---|---|---|
| OR | 95% CI | OR | 95% CI | OR | 95% CI | |
| Dietary habits | ||||||
| Meal frequency | ||||||
| 3 times a day (Ref) | 1 | - | 1 | - | 1 | - |
| 2 times a day | 0.779 | (0.700–0.867) | 1.217 | (1.083–1.367) | 1.164 | (1.034–1.312) |
| Once a day | 0.780 | (0.558–1.091) | 1.509 | (1.043–2.185) | 1.392 | (0.950–2.041) |
| Breakfast frequency | ||||||
| 5–7 times a week (Ref) | 1 | - | 1 | - | 1 | - |
| 3–4 times a week | 0.632 | (0.542–0.737) | 1.027 | (0.870–1.212) | 1.020 | (0.863–1.206) |
| 1–2 times a week | 0.760 | (0.652–0.885) | 1.326 | (1.118–1.573) | 1.279 | (1.078–1.518) |
| Less than once a week | 0.697 | (0.600–0.810) | 1.131 | (0.960–1.332) | 1.060 | (0.898–1.251) |
| Eat out frequency | ||||||
| More than once a day | 0.702 | (0.603–0.871) | 0.822 | (0.689–0.980) | 0.895 | (0.745–1.076) |
| 1~6 times a week | 0.649 | (0.571–0.739) | 0.846 | (0.735–0.973) | 0.910 | (0.786–1.054) |
| Less than once a week (Ref) | 1 | - | 1 | - | 1 | - |
| Health-related behaviors | ||||||
| Physical activity | ||||||
| Inactive (Ref) | 1 | - | 1 | - | 1 | - |
| Active | 0.987 | (0.890–1.095) | 1.020 | (0.910–1.144) | 1.054 | (0.939–1.182) |
| Health enhancing | 1.089 | (0.944–1.257) | 1.098 | (0.937–1.286) | 1.118 | (0.955–1.310) |
| Smoking status | ||||||
| Current-smoker | 1.936 | (1.716–2.185) | 1.353 | (1.151–1.591) | 1.303 | (1.108–1.533) |
| Ex-smoker | 1.897 | (1.656–2.173) | 1.061 | (0.892–1.263) | 1.063 | (0.893–1.266) |
| Non-smoker (Ref) | 1 | - | 1 | - | 1 | - |
| Alcohol drinking | ||||||
| High risk | 1.694 | (1.487–1.931) | 1.515 | (1.314–1.747) | 1.490 | (1.292–1.718) |
| Low risk (Ref) | 1 | - | 1 | - | 1 | - |
© 2020 by the authors. Licensee MDPI, Basel, Switzerland. This article is an open access article distributed under the terms and conditions of the Creative Commons Attribution (CC BY) license (http://creativecommons.org/licenses/by/4.0/).
Share and Cite
Jeong, D.; Kim, J.; Lee, H.; Kim, D.-Y.; Lim, H. Association of Cardiometabolic Multimorbidity Pattern with Dietary Factors among Adults in South Korea. Nutrients 2020, 12, 2730. https://doi.org/10.3390/nu12092730
Jeong D, Kim J, Lee H, Kim D-Y, Lim H. Association of Cardiometabolic Multimorbidity Pattern with Dietary Factors among Adults in South Korea. Nutrients. 2020; 12(9):2730. https://doi.org/10.3390/nu12092730
Chicago/Turabian StyleJeong, Dawoon, Jieun Kim, Hansongyi Lee, Do-Yeon Kim, and Hyunjung Lim. 2020. "Association of Cardiometabolic Multimorbidity Pattern with Dietary Factors among Adults in South Korea" Nutrients 12, no. 9: 2730. https://doi.org/10.3390/nu12092730
APA StyleJeong, D., Kim, J., Lee, H., Kim, D.-Y., & Lim, H. (2020). Association of Cardiometabolic Multimorbidity Pattern with Dietary Factors among Adults in South Korea. Nutrients, 12(9), 2730. https://doi.org/10.3390/nu12092730