Article

Symmetry-Induced Light Confinement in a Photonic Quasicrystal-Based Mirrorless Cavity

1
Department of Physics E. Pancini, University of Naples Federico II, via Cintia, 80126 Naples, Italy
2
Istituto Nazionale di Ottica (INO) Consiglio Nazionale delle Ricerche; via Campi Flegrei 34, 80078 Pozzuoli, Italy
3
Istituto SPIN Consiglio Nazionale delle Ricerche; via Cintia, 80126 Napoli, Italy
*
Authors to whom correspondence should be addressed.
Current address: Istituto di Biochimica delle Proteine, Consiglio Nazionale delle Ricerche, Via Pietro Castellino 111, 80131 Napoli, Italy
Crystals 2016, 6(9), 111; https://doi.org/10.3390/cryst6090111
Submission received: 17 June 2016 / Revised: 25 August 2016 / Accepted: 5 September 2016 / Published: 8 September 2016
(This article belongs to the Special Issue Structure and Properties of Quasicrystals 2016)

Abstract

:
We numerically investigate the electromagnetic field localization in a two-dimensional photonic quasicrystal generated with a holographic tiling. We demonstrate that light confinement can be induced into an air mirrorless cavity by the inherent symmetry of the spatial distribution of the dielectric scatterers forming the side walls of the open cavity. Furthermore, the propagation direction can be controlled by suitable designs of the structure. This opens up new avenues for designing photonic materials and devices.

Graphical Abstract

1. Introduction

Photonic Quasicrystals (PQCs) represent a natural extension to higher symmetries of crystallographic dielectric patterns, and, like photonic crystals [1,2], can be used to design photonic band-gap (PBG) devices [3,4,5]. PQCs lack conventional translational symmetries [6], but possess a higher degree of rotational symmetry that allows a more isotropic destructive interference of light scattered by the dielectric elements of the pattern, which gives the benefit of more isotropic band-gap properties [7,8,9,10,11,12]. In addition, the larger extent to which wavelets superposition occurs in the k -space upon multiple scattering, allows opening the band-gap with lower dielectric contrast than required for crystals [13]. This has opened the door to “soft” fabrication techniques including holographic lithography which can be easily applied to soft, externally tunable materials having lower refractive index like polymers and liquid crystals [14,15,16].
Other reflection symmetries are in general present in quasicrystal patterns and can be exploited to design a specific response. Similarly, the presence of nonequivalent sites in the quasiperiodic geometry can be used to mold the light flow with improved versatility and functionality [17]. Light confinement in structure defects is of course important because allows strong light-matter interaction for sensing applications, lasing, etc. In this regard, the existence of localized modes is sometimes possible without an effective defect site in the quasiperiodic lattice [18,19,20]. Such photonic modes are typically referred to as defect-free localized modes (DFLMs) [18]. At the frequency of the DFLM, light is confined into specific sites as ruled by local topology of the dielectric scatterers.
In a recent paper, an unexpected capability of a specific DFLM existent in the PBG of a two-dimensional PQC designed by a holographic tiling (HT) having a local 8-fold rotational symmetry was discussed [21]. Counterintuitively, at the frequency of the DFLM, propagation through an air waveguide is hampered, i.e., light, once reached the center of symmetry of the HT where the DFLM resides, is back-reflected to the source (despite propagating through an open channel). This result was demonstrated experimentally in the microwave range as a proof of principle. In fact, provided that variations in the dispersion spectrum are negligible, photonic band diagrams are fully scalable with the size of the geometry. This means that same results hold in the visible range into suitably rescaled structures at the nanoscale. Herein, we further investigate theoretically this phenomenon by finite-difference time-domain (FDTD) simulations and show that light can be trapped into a mirrorless, longitudinal air channel thanks only to the use of two DFLMs, acting as top and bottom virtual mirrors with up to 98% of power reflected in the open cavity. Other propagation geometries are then investigated.

2. Results

2.1. Octagonal-Based Holographic Tiling

A quasiperiodic holographic tiling of the plane is obtained by placing dielectric pillars at the maxima of a multi-beam interference pattern (hologram). In case of a multi-beam interference, in fact, it is possible to achieve controlled quasiperiodic irradiance profiles [22,23,24]. Our HT is generated according to the following relation:
I ( r ) = m = 1 N A m e i k m · r + φ m 2 ,
where N = 8, and where r = ( x , y ) is the position vector in the plane of interest, and with
k m = 2 π λ n sin m 2 π N sin θ , cos m 2 π N sin θ ,
which defines wave-vectors pointing from the vertices of an octagon towards the center, forming an angle θ with respect to the normal to the plane ( x , y ) , in a medium of refractive index n. The resulting interference constists of a quasiperiodic pattern whose primitive reciprocal quasilattice vectors are determined by the difference of the wave vectors k m [23]. The so-obtained HT is invariant under rotations of an integer multiple of 2 π / 8 when there is no relative phase delay (e.g., φ m = 0 m ) between the 8 interfering waves. In addition, varying the relative phases φ m allows one to manipulate straightforwardly the irradiance profile I ( x , y ) (so the quasicrystal tiling), still preserving its global 8-fold rotational symmetry, or modifying it depending on the actual values of φ m used. As for instance, for φ 1 = φ 3 = φ 5 = φ 7 = 0 and φ 2 = φ 4 = φ 6 = φ 8 = π / 2 ( A m = 1 m ), a different holographic tiling of the plane can be obtained with preserved global 8-fold rotational symmetry. We choose the amplitudes A m = 1 m , and we set φ 1 = φ 5 = 0 , φ 2 = φ 4 = φ 6 = φ 8 = π / 2 and φ 3 = φ 7 = π in order to define the holographic tiling on which we focus our discussion (Figure 1a). This set of phases gives an irradiance profile that can be written as
I ( x , y ) = 16 sin 2 ( k x ) sin 2 ( k y ) + 4 [ cos ( k 0 x ) + sin ( k 0 y ) ] 2 ,
where k 0 = 2 π λ n sin θ and k = 2 2 k 0 . The binarization of this holograhic pattern is shown in Figure 1a. Equation (3) indicates two constituent patterns, i.e., a first term depending on k and a second term depending on k 0 . Both constituent patterns possess a 4-fold rotational symmetry. Since k and k 0 are incommensurate, the overall pattern is quasiperiodic and gives rise to local subpatterns with 8-fold rotational symmetry (Figure 1a). Our quasiperiodic function is therefore characterized by a global 4-fold rotational symmetry and a local 8-fold symmetry. It represents an example of quasiperiodic crystal without forbidden symmetries [25,26]. The diffraction spectrum of this pattern shows groups of sharp Bragg peaks (inset in Figure 1a) denoting long range order along 8 symmetric directions but only with near-octagonal symmetry since the peaks do not identically overlap upon a rotation of 2 π / 8 around ( k x = 0 , k y = 0 ) . Therefore, we will refer to this tiling as pseudo-octagonal.
The photonic quasicrystal (quasiperiodic dielectric pattern) is build by infinite cylinders along the z-axis placed at the centroids of the relative maxima of I ( x , y ) (Figure 1a). A two-dimensional finite pattern obtained from the HT is shown in Figure 1b. The filling fraction r / a , given as the ratio between rod radius r and average pillar distance a was set to 0 . 2 in order to maximize the gap width of the pseudo-octagonal structure for a fixed refractive index difference ( Δ n = 2 . 0 ) and was left unvaried in all simulations. Details of the simulation are given in Methods section. Given the lack of a lattice constant, the value a represents a characteristic length of the structure that is calculated as the root square of the finite pattern area divided by the number of pillars contained in it. We set a = 1 . 2 μ m in all simulations, whereas r = 240 nm for the pillars.

2.2. Methods

A 2D FDTD method with uniaxial perfectly matched layer boundary conditions was used in all numerical simulations. The discretization grid provided a minimum of 32 grid points per unit length a or 64 points per free space wavelength, d g = λ / 64 . A Gaussian time-pulse excitation was used to calculate the bandgap windows of the structure. In order to simulate the electromagnetic field propagation through the open channels, we used instead a continuous wave with Gaussian spatial profile with beam width of 4 μ m. The source was placed at several positions in the structure in different simulations to determine the optical response of the pattern. As for instance, the source was placed at the entrance of the channel in Figure 1 and Figure 2 and at the structure’s center in Figure 3. The specific position of the source is indicated by the solid line segment (red or grey) for each simulation (Figure 1, Figure 2, Figure 3 and Figure 4). The rise time was 0 . 03 ( λ / c ) so to have a pulse wide-enough in the frequency domain to cover the range of frequencies of interest.
Several field monitors (detectors) were placed in particular positions (x, y) and these allowed us to store the field components ( E ( x , y ) , H ( x , y ) ) along different propagation directions. Their positions were chosen to cover the angular range related to an 8-fold rotational symmetry. We used rectangular field monitors (width = 2 μ m, length = 0.5 μm) positioned with normal to the input face (width) pointing towards the center and with angle, with respect to the x-axis, ranging from 0 to 90 ( 0 , 30 , 45 , 60 , 90 ). The monitors used to calculate the density of states are indicated as circles in Figure 1 only to distinguish them from the sources. Sources are in fact indicated as line segments to individuate the discontinuity line segments between input and scattered fields that may arise when the scattered field is superimposed to the source position (shown in Figure 2, Figure 3 and Figure 4). Data associated to full-circle monitors, the position of which can be seen, e.g., in Figure 1b, are shown in the local density of states (LDOS) spectra (see, e.g, Figure 1e), while data associated to open-circle monitors (Figure 1b) were calculated but are not shown in the spectra only for the sake of clarity. Extended monitors are indicated as full rectangles in Figure 1, Figure 2, Figure 3 and Figure 4 and were used to determine the power flow through their extended input faces. These last were positioned at entrance and exit faces of the structure/channel (see Figure 1c, yellow and red rectangles).
After a sufficiently large time of calculation (typically 2 19 Δ t , with Δ t the FDTD time step given by 0 . 5 d g / c ), the field was Fourier transformed to calculate the transmission spectrum along specific directions. The corresponding wavelength range was 0 . 1 6 . 0 μ m with a resolution of δ = 5.0 × 10 4 μ m. The density of photonic states was calculated for different values of the dielectric constant of the rods in air, for both TM polarization (electric field E z parallel to the rod axis) and TE polarization (magnetic field H z parallel to the rod axis). A bandgap for TM polarization emerged already for Δ n = 0 . 8 , although much less pronounced than the strong-attenuation bandgap obtained for Δ n = 2 . 0 . In general, increasing the dielectric contrast resulted in a more pronounced bandgap, redshifted as a consequence of the larger average refractive index of the structure. Nonetheless, the effects associated to the presence of DFLMs are evident also for low dielectric contrast. The transmission coefficient was normalized with respect to the incident power of the source.
Regarding power measurements, the field monitor detects the power flow across its domain (the size of the monitor can be suitably modified) as a function of time t and is calculated as the real part of Poynting vector flux S ( t ) = A E ( t ) × H * ( t ) · d A across the domain area A, normalized to the input power S 0 .
The channel-PQC pattern is shown in Figure 1c. The pattern is a square of side L = 16 μ m (Figure 1b,c and Figure 2a,b) centered at coordinates ( x = 0 , y = 0 ). The width of the air waveguide is 2.2 μ m between closest pillar edges (Figure 1c). The air waveguide is obtained by removing 3 central lines of pillars along the y-axis. For larger widths, no mirror effect was observed. For narrower channels, light propagation was not efficient. The doubled channel-PQC pattern considered in our study and shown in Figure 3 have width L and length 2L and is simply obtained by duplicating the PQC of side L centered at ( x = 0 , y = 0), at the new position ( x = 0 , y = L ). While the combined structure loses the rotational symmetry of the parent PQC pattern, both sub-patterns preserve the optical properties of the PQC for what concerns the photonic bandgap and the existence of DFLMs, which relies on the local symmetry and topology of the dielectric scatterers. Therefore, in the doubled channel-PQC pattern (Figure 3 and Figure 4), the top virtual mirror produced by the DFLM is located at the coordinates ( x = 0 , y = 0 ), whereas the bottom virtual mirror at position ( x = 0 , y = L ). In principle, more complex patterns can be obtained tiling the plane with PQC tiles.

2.3. Mirrorless Cavity

The 2D HT-PQC was shown to possess a DLFM at a specific frequency within the PBG of the pattern [21]. In particular, it was demonstrated that such mode hampers light propagation through an open waveguide (channel) passing across the center, as shown in Figure 1c, because of the excitation of the DFLM at the center of the pattern ( x = 0 , y = 0 ) [21]. When the air channel is opened along the pattern, the frequency of the mode is redshifted because of the lower effective index experienced. The local density of states (LDOS) for the finite HT-PQC is shown in Figure 1d,e for field pulse source placed, respectively, outside of the pattern and in its center. Several resonances can be seen in the PBG of the pattern, to which DFLMs can be associated. The resonance profile is asymmetric and resembles a Fano-like profile.
We focused our simulations on the case of lossless materials providing low refractive index difference Δ n = 0 . 8 , as for instance given by Al 2 O 3 rods in air in the near infrared, or doped polymer [27].
The spectrum of the channel-PQC pattern is shown in Figure 1f. We observe that the resonances associated to the behavior reported in reference [21] are those for which spectral dips in the spectrum of the field monitor detecting light along the x-axis (perpendicular to the channel) exist simultaneously to the transmission dips (propagation along the channel), which indicates a better confinement of the light in the waveguide. Such modes can be seen by inspecting the localized density of states mapped by the field monitor (magenta circle) shown in Figure 1f. In Figure 2a, we report the spatial distribution of the electric field amplitude E z inside the open channel pattern for Δ n = 0 . 8 , after a transient time, set as t > 10 L / c , where L is the pattern side and c the speed of light in vacuum, for λ = 2 . 01 μm (star point in Figure 1f). Light propagation along the open channel is hampered. On the contrary, positioning a dielectric pillar at a specific position in the center of the channel allows restoring the propagation through the air waveguide, as shown in Figure 2b. This position corresponds to the center of symmetry of the DFLM. Without the central pillar, as in Figure 2a, the specific symmetry of the DFLM is broken. The field distribution ruled by the local geometry of the scatterers around the center does not allow an efficient coupling towards the top part of the channel ( y > 0 ). Across the center of symmetry, the scattered electromagnetic field undergoes a phase-shift and interferes with the background field. Since light cannot propagate in the surrounding structure because of the photonic bandgap, light can only back-couple to the bottom part of the air channel. This phenomenon is more efficient in correspondence of the above mentioned spectral dips detected along the x axis, which point out a necessary back-reflection of the light to the source for energy conservation. When a pillar is placed in the middle of the channel in correspondence of the DFLM, its symmetry is restored and light can again couple to the top half structure as shown in Figure 2b.
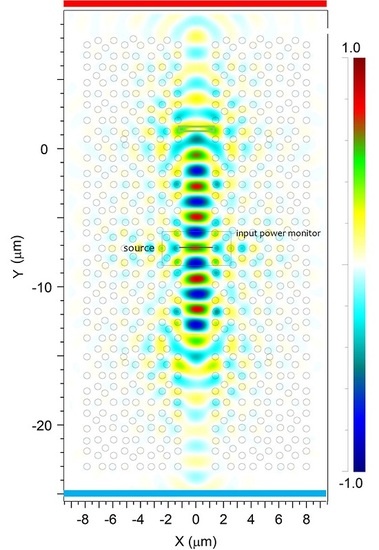
Of course, the opposite situation occurs if we consider a light source injected from the top and propagating toward the center, i.e., the field is back-reflected toward the source from the virtual mirror at (x = 0, y = 0). This means that is possible to form a combined photonic structure made of two HT-PQC patterns arranged along the y axis (with coincident channel axes) in order to have a top and a bottom DFLM along the air waveguide (Methods). Light between the two localized modes can be trapped in it. This singular behavior is shown in Figure 3a where we plot, again, the field component E z at the DFLM wavelength of 2.01 μ m into a doubled channel-PQC ( Δ n = 0 . 8 ). As clearly visible, light cannot efficiently cross the top and bottom DFLMs acting as virtual mirrors. The electromagnetic field is confined inside a mirrorless cavity. In Figure 3b, we plot the power vs. time expressed in length units ( c t ) monitored by the detectors represented in the scheme in Figure 3a. The electromagnetic field reaches a steady state with only ∼ 10% of power loss through the open waveguide despite the relative low refractive index contrast of the photonic PQC. This value can be reduced to only 2 % for Δ n = 2 . 0 , i.e., increasing the dielectric contrast to the typical values of silicon-based photonic structures (of course, at the corresponding DFLM wavelength).
We investigated several patterns with global 8-fold rotational symmetry, including the geometric 8-fold quasicrystal with Ammann-Beenker tiling [13], but we did not observe the formation of virtual mirrors. We believe the origin of the virtual mirror in our tiling to be associated to the specific set of relative phases φ m used for calculating the interference pattern, i.e., to the peculiar 4-fold quasiperiodic pattern resulting from Equation (3) (pseudo 8-fold quasicrystal). Further research is in progress to validate this hypothesis.
To further explore the potentiality of this unusual confinement, we now consider the three-port waveguide represented in Figure 4a, with a bottom (B) and top (T) transmission port and a left side channel (S) opened at the boundary between the two pattern subunits. As it can be seen from the field map, there is a significant unbalance in the energy flow between the vertical top (T) and bottom (B) paths and the horizontal side path (S) because light cannot travel through the symmetry barrier offered by the DFLMs. This effect is emphasized in Figure 4b, where a four-port structure (R, B, S1, S2) having two side channels (S1, S2) is depicted. While the electromagnetic field can efficiently propagate through the bottom side channel S1, this is not true for the top side channel S2 since it is located above the top virtual mirror ( x = 0 , y = 0 ). This result also demonstrates the local character of the DFLM which appears to be ruled mainly by the local dielectric scatterers since not affected by the side channels.

3. Conclusions

In conclusion, we have studied a photonic quasiperiodic pattern with local 8-fold rotational symmetry. We have numerically investigated with the finite-difference time-domain method the unexpected capability of defect-free localized modes existent in the photonic bandgap of this two-dimensional pseudo-octagonal quasicrystal of reflecting incident light into an open waveguide. By extending this concept with two DFLMs acting as top and bottom virtual mirrors, we have shown that light can be trapped into a mirrorless air channel with nearly 90% of power reflected back along the channel for Δ n = 0 . 8 (up to 98% for Δ n = 2 . 0 ). Other propagation geometries have been investigated, in particular a three- and four-port waveguide, to further explore the potentiality of this mechanism. We have shown that light flow at specific wavelengths can be molded to follow paths directed either by geometry and/or symmetry-induced virtual mirrors, which provides an interesting mechanism that could expand design capabilities and applications of photonic architectures.

Acknowledgments

We are grateful to the Academic Editor for his valuable comments. We acknowledge University of Naples Federico II, Compagnia di San Paolo e Istituto Banco di Napoli - Fondazione (LARA) for financial support.

Author Contributions

Gianluigi Zito and Sergio De Nicola conceived and designed the work; Gianluigi Zito carried out simulations and analyzed the data; Giulia Rusciano and Antonio Sasso contributed to analyze the data; Gianluigi Zito wrote the manuscript with contributions from Sergio De Nicola.

Conflicts of Interest

The authors declare no conflict of interest.

Abbreviations

The following abbreviations are used in this manuscript:
PQC
Photonic quasi-crystal
PBG
Photonic band gap
DFLM
Defect-free localized mode
HT
Holographic tiling

References

  1. Yablonovitch, E. Inhibited spontaneous emission in solid-state physics and electronics. Phys. Rev. Lett. 1987, 58, 2059–2062. [Google Scholar] [CrossRef] [PubMed]
  2. John, S. Strong localization of photons in certain disordered dielectric superlattices. Phys. Rev. Lett. 1987, 58, 2486–2489. [Google Scholar] [CrossRef] [PubMed]
  3. Shechtman, D.; Blech, I.; Gratias, D.; Cahn, J.W. Metallic phase with long-range orientational order and no translational symmetry. Phys. Rev. Lett. 1984, 53, 1951–1953. [Google Scholar] [CrossRef]
  4. Zoorob, M.; Charlton, M.; Parker, G.; Baumberg, J.; Netti, M. Complete photonic bandgaps in 12-fold symmetric quasicrystals. Nature 2000, 404, 740–743. [Google Scholar] [PubMed]
  5. Della Villa, A.; Enoch, S.; Tayeb, G.; Pierro, V.; Galdi, V.; Capolino, F. Band gap formation and multiple scattering in photonic quasicrystals with a Penrose-type lattice. Phys. Rev. Lett. 2005, 94, 183903. [Google Scholar] [CrossRef] [PubMed]
  6. Zito, G.; Pepe, G.P.; De Nicola, S. Hidden translational symmetry in square–triangle-tiled dodecagonal quasicrystal. J. Opt. 2015, 17, 055103. [Google Scholar] [CrossRef]
  7. Senechal, M. Quasicrystals and Geometry; Cambridge University Press: Cambridge, UK, 1995. [Google Scholar]
  8. Levine, D.; Steinhardt, P.J. Quasicrystals: A new class of ordered structures. Phys. Rev. Lett. 1984, 53, 2477–2480. [Google Scholar] [CrossRef]
  9. Wang, N.; Chen, H.; Kuo, K. Two-dimensional quasicrystal with eightfold rotational symmetry. Phys. Rev. Lett. 1987, 59, 1010–1013. [Google Scholar] [CrossRef] [PubMed]
  10. Mikhael, J.; Roth, J.; Helden, L.; Bechinger, C. Archimedean-like tiling on decagonal quasicrystalline surfaces. Nature 2008, 454, 501–504. [Google Scholar] [CrossRef] [PubMed]
  11. Bendersky, L. Quasicrystal with one-dimensional translational symmetry and a tenfold rotation axis. Phys. Rev. Lett. 1985, 55, 1461–1463. [Google Scholar] [CrossRef] [PubMed]
  12. Rose, P.T.; Di Gennaro, E.; Abbate, G.; Andreone, A. Isotropic properties of the photonic band gap in quasicrystals with low-index contrast. Phys. Rev. B 2011, 84, 125111. [Google Scholar]
  13. Zito, G.; Rose, P.T.; Di Gennaro, E.; Andreone, A.; Santamato, E.; Abbate, G. Bandgap properties of low-index contrast aperiodically ordered photonic quasicrystals. Microwa. Opt. Tech. Lett. 2009, 51, 2732–2737. [Google Scholar] [CrossRef]
  14. Zito, G.; Piccirillo, B.; Santamato, E.; Marino, A.; Tkachenko, V.; Abbate, G. Two-dimensional photonic quasicrystals by single beam computer-generated holography. Opt. Exp. 2008, 16, 5164–5170. [Google Scholar] [CrossRef]
  15. Zito, G.; Pissadakis, S. Holographic polymer-dispersed liquid crystal Bragg grating integrated inside a solid core photonic crystal fiber. Opt. Lett. 2013, 38, 3253–3256. [Google Scholar] [CrossRef] [PubMed]
  16. Zito, G.; Finizio, A.; De Nicola, S. Spatially resolved refractive index profiles of electrically switchable computer-generated holographic gratings. Opt. Exp. 2009, 17, 18843–18851. [Google Scholar] [CrossRef] [PubMed]
  17. Maciá, E. Exploiting quasiperiodic order in the design of optical devices. Phys. Rev. B 2001, 63, 205421. [Google Scholar] [CrossRef]
  18. Della Villa, A.; Enoch, S.; Tayeb, G.; Capolino, F.; Pierro, V.; Galdi, V. Localized modes in photonic quasicrystals with Penrose-type lattice. Opt. Exp. 2006, 14, 10021–10027. [Google Scholar] [CrossRef]
  19. Notomi, M.; Suzuki, H.; Tamamura, T.; Edagawa, K. Lasing action due to the two-dimensional quasiperiodicity of photonic quasicrystals with a Penrose lattice. Phys. Rev. Lett. 2004, 92, 123906. [Google Scholar] [CrossRef] [PubMed]
  20. Wang, Y.; Hu, X.; Xu, X.; Cheng, B.; Zhang, D. Localized modes in defect-free dodecagonal quasiperiodic photonic crystals. Phys. Rev. B 2003, 68, 165106. [Google Scholar] [CrossRef]
  21. Rose, P.; Zito, G.; Di Gennaro, E.; Abbate, G.; Andreone, A. Control of the light transmission through a quasiperiodic waveguide. Opt. Exp. 2012, 20, 26056–26061. [Google Scholar]
  22. Escuti, M.J.; Crawford, G.P. Holographic photonic crystals. Opt. Eng. 2004, 43, 1973–1987. [Google Scholar]
  23. Gorkhali, S.P.; Qi, J.; Crawford, G.P. Switchable quasi-crystal structures with five-, seven-, and ninefold symmetries. JOSA B 2006, 23, 149–158. [Google Scholar] [CrossRef]
  24. Roichman, Y.; Grier, D.G. Holographic assembly of quasicrystalline photonic heterostructures. Opt. Exp. 2005, 13, 5434–5439. [Google Scholar] [CrossRef]
  25. Lifshitz, R. Quasicrystals: A matter of definition. Found. Phys. 2003, 33, 1703–1711. [Google Scholar] [CrossRef]
  26. Elcoro, L.; Perez-Mato, J.M. Cubic superspace symmetry and inflation rules in metastable MgAl alloy. Eur. Phys. J. B 1999, 7, 85–89. [Google Scholar] [CrossRef]
  27. Obreja, P.; Cristea, D.; Purica, M.; Gavrila, R.; Comanescu, F. Polymers doped with metal oxide nanoparticles with controlled refractive index. Polimery 2007, 52, 679–685. [Google Scholar]
Figure 1. (a) Holographic-tiling binary irradiance: black points correspond to high intensity levels; the inset shows the Fourier diffraction spectrum of the pattern with pseudo-octagonal symmetry. (b) 2D Photonic Quasicrystal (PQC) finite pattern: open black circles correspond to the higher index pillars with r = 240 nm; the positions of the sources and field monitors is indicated in the scheme (please note that monitors in different positions along the pattern detect different propagation direction of scattered field). (c) Same as in (b) for a structure in which an air channel is open along the vertical y-axis; extended monitors are used for integral power measurements. (d,e) local density of states (LDOS) of the finite holographic tiling (HT)-PQC for excitation pulse in different positions (red and grey source) in accordance with the scheme in (b). The spectra were calculated from several field monitors: the line color corresponds to the field monitor color depicted in (b) (red open circle monitors are not shown:); in (e), a different spectral range is used to better visualize the defect-free localized mode (DFLM) resonances in the wide PBG around 2.8 μ m. (f) LDOS for the channel-PQC pattern shown in (c) for low refractive index. The star indicates a representative resonance (2.01 μ m, DFLM) at which light propagation is forbidden above the symmetry center x = 0, y = 0 along the channel (crossed lines are a guide to the eye). The spectra line colors correspond to the field monitor colors in (c).
Crystals 06 00111 g001
Figure 2. (a) Contour map of the normalized field amplitude E z at the DFLM wavelength of 2.01 μ m in the channel-PQC ( Δ n = 0 . 8 ): light cannot efficiently cross the pattern center. (b) Normalized contour map of E z at 2.01 μ m in the channel-PQC with a central pillar ( Δ n = 0 . 8 ): light couples efficiently to the top half channel thanks to the central pillar. The field around the source is due to the sum of input and back-scattering fields, and takes into account also back-scattering from the pillars around the channel (due to the source injection).
Crystals 06 00111 g002
Figure 3. (a) Contour map of the normalized field amplitude E z at the DFLM wavelength of 2.01 μ m in the doubled channel-PQC ( Δ n = 0 . 8 ): light cannot efficiently cross the top and bottom DFLMs, respectively at coordinates ( x = 0 , y = 0 ) and ( x = 0 , y = L ), acting as virtual mirrors that confine the electromagnetic field inside a mirrorless cavity. (b) Power monitored by the detectors placed as represented in the scheme in (a). The color of the solid lines corresponds to the field monitor colors in (a), i.e., blue for the input power, red for top transmitted power (T), yellow for the bottom transmitted power (B) and green for power detected just above the top virtual mirror ( x = 0 , y = 0 ). The field reaches a steady state with only ∼ 10% of loss through the open waveguide despite the relative low refractive index contrast of the photonic PQC. The input field has unitary power. The blue line indicates total power integrated in the blue-box area around the center where input source is launched.
Crystals 06 00111 g003
Figure 4. (a) Contour map of E z at the DFLM wavelength of 2.01μm in the three-port channel-PQC ( Δ n = 0 . 8 ). (b) Contour map of E z at the DFLM wavelength of 2.01μm in the four-port channel-PQC ( Δ n = 0 . 8 ).
Crystals 06 00111 g004