Article

Separating NaCl and AlCl3·6H2O Crystals from Acidic Solution Assisted by the Non-Equilibrium Phase Diagram of AlCl3-NaCl-H2O(-HCl) Salt-Water System at 353.15 K

1
Institute of Resources and Environmental Engineering, State Environment Protection Key Laboratory of Efficient Utilization of Coal Waste Resources, Shanxi University, Taiyuan 030006, China
2
College of Chemical Engineering, Qinghai University, Xining 810016, China
*
Author to whom correspondence should be addressed.
Crystals 2017, 7(8), 244; https://doi.org/10.3390/cryst7080244
Submission received: 30 June 2017 / Revised: 26 July 2017 / Accepted: 2 August 2017 / Published: 4 August 2017
(This article belongs to the Special Issue Solution-Processed Inorganic Functional Crystals)

Abstract

:
Extracting AlCl3·6H2O from acid leaching solution through crystallization is one of the key processes to extracting aluminum from fly ash, coal gangue and other industrial solid wastes. However, the obtained products usually have low purity and a key problem is the lack of accurate data for phase equilibrium. This paper presented the non-equilibrium phase diagrams of AlCl3-NaCl-H2O (HCl) salt-water systems under continuous heating and evaporation conditions, which were the main components of the acid leaching solution obtained through a sodium-assisted activation hydrochloric acid leaching process. The ternary system was of a simple eutonic type under different acidities. There were three crystalline regions; the crystalline regions of AlCl3·6H2O, NaCl and the mixture AlCl3·6H2O/NaCl, respectively. The phase diagram was used to optimize the crystallization process of AlCl3·6H2O and NaCl. A process was designed to evaporate and remove NaCl at the first stage of the evaporation process, and then continue to evaporate and crystallize AlCl3·6H2O after solid-liquid separation. The purities of the final salt products were 99.12% for NaCl and up to 97.35% for AlCl3·6H2O, respectively.

Graphical Abstract

1. Introduction

Activation-leaching-crystallization is one of the key methods for extracting AlCl3·6H2O from coal fly ash [1], which is viewed as the bulk of industrial waste and is one of the most complex anthropogenic materials [2]. However, a large amount of NaCl is usually precipitated with the crystallization of AlCl3·6H2O as a result of the presence of a large number of sodium ions in the leaching solution. Since the solubilities of NaCl and AlCl3·6H2O are so high, they cannot be easily separated from each other. Therefore, separating NaCl from AlCl3·6H2O during the crystallization process is one of the key issues for making the process more feasible in the industry.
The crystallization method is a good option to extract AlCl3 if the salt water system is relatively pure [3]. In general, the crystallization method has the widest application for salt separation from salt-water systems, including cooling crystallization, evaporation crystallization, salting-out crystallization, reaction crystallization and other methods [4]. For aluminum chloride, both salting out and evaporation are common crystallization methods. For instance, gaseous or liquid HCl is usually added into the acid-leaching solution of aluminum-bearing minerals so that the solubility of AlCl3·6H2O is reduced for crystallization [5]. The solubility of AlCl3·6H2O can also be reduced by adding FeCl2 into the Fe-Al-Mg-Ca-K-Cl-H2O system [6]. Evaporative crystallization is a more direct way, and refers to the method of removing some solvent through evaporation and getting precipitated crystals. The crystals usually need to be evaporated under negative pressure. However, no matter which method is used, it is not easy to separate NaCl and AlCl3, due to their similar solubility at different temperatures. It should be noted that some similar studies have provided valuable information, suggesting that the separation of NaCl from AlCl3 is feasible. For example, for the extraction of elements from acid leaching solution, some researchers have investigated the separation problems of AlCl3, FeCl3 and CaCl2. All of these salts are soluble, and their solubility is similar to that of NaCl and AlCl3. The phase diagrams [7,8] of the AlCl3-FeCl3-H2O, AlCl3-CaCl2-H2O and FeCl3-CaCl2-H2O systems at 298.15 K were drawn, and then the evaporation process was optimized to achieve the separation of different components. Researchers studied the crystallization separation of crystalline AlCl3 from fly ash with rich calcium impurities and mainly examined the phase diagrams of binary AlCl3-H2O systems and ternary AlCl3-CaCl2-H2O systems within a temperature range of 278.15–363.15 K [7], which are very similar to the separation of NaCl from AlCl3, meaning that there is the possibility of separating the two salts if there is a phase diagram.
References [9,10] reported the phase diagram of neutral AlCl3-NaCl-H2O systems, which can provide a lot of information about the separation strategy between AlCl3 and NaCl. For acidic leaching solutions, more solubility data of salts are necessary. Phase diagrams are undoubtedly one of the important topics in industrial crystallization [11]. Besides that, there is still a problem to which sufficient attention needs to be given; that of the non-equilibrium feature [12] of salt water systems during the industrial evaporation process. Forced evaporation is generally used in practical production, and the operation temperature is usually set at 353.15–368.15 K. There is a dynamic balance between continuous heating and evaporation in the practical process, and thus the phase diagram is different from that in an equilibrium status. As a result, a non-equilibrium phase diagram needs to be drawn if the separation between AlCl3 and NaCl is to be optimized.
With regard to the non-equilibrium phase diagram data for the system in acidic conditions, the relevant research of the non-equilibrium phase diagram of the AlCl3-NaCl-H2O (-HCl) salt-water system is carried out. After studying the phase diagram of the mixed system, the law of salt precipitation can be analyzed and then the technological process can be optimized to prepare pure AlCl3·6H2O and NaCl.

2. Materials and Methods

The non-equilibrium phase diagram of AlCl3-NaCl-H2O salt-water system under acidic conditions was drawn. In a 1000 mL glass beaker placed in the constant temperature water bath, analytically pure AlCl3·6H2O (Tianjin Bodi Chemical Co., Ltd., Tianjin, China) was mixed with different concentrations of HCl (Shanxi Huihongyuan Chemical Co., Ltd., Taiyuan, China) solution at a temperature of 353.15 K and analytically pure NaCl (Tianjin Bodi Chemical Co., Ltd., Tianjin, China) was gradually added. Then, the beaker was tightly sealed using a plastic film. After 8 hours, the two salts reached equilibrium state, and the film was loosened so that the vapors could be slowly released at atmospheric pressure, and the heating-evaporation could be simultaneously maintained for about 1 hour, when the liquid phase was used to simulate the non-equilibrium conditions of evaporation of the leaching solution in an open system. The solution was then sampled and analyzed, and a series of solubility data was obtained. In the same way, a set of reverse experiments was carried out when the co-saturation phenomenon of the acidic solution of AlCl3 and NaCl has occurred, i.e., NaCl was first dissolved in HCl solution followed by the addition of AlCl3·6H2O.
The evaporation and precipitation features of the leaching solution were investigated. Firstly, an acidic solution containing 7.16 wt% AlCl3 and 2.30 wt% NaCl, which is similar to the leaching solution in practice, was theoretically analyzed for the crystallization law of salts combined with the phase diagram. Secondly, based on the typical components of the acid leaching solution of coal waste [5], analytically pure AlCl3·6H2O, NaCl, FeCl3·6H2O (Tianjin Bodi Chemical Co., Ltd., Tianjin, China), CaCl2 (Tianjin Bodi Chemical Co., Ltd., Tianjin, China) salts and HCl solutions were used to prepare the modeled leaching solution. The modeled solution contained 7.50 wt% AlCl3, 4.89% NaCl, 1.75 wt% FeCl3 and 2.26 wt% CaCl2, which was evaporated to obtain high-purity NaCl and AlCl3·6H2O crystals guided by the calculation of phase diagram. In the preparation of the above solutions, the prepared solution was stirred for 12 h and kept standing for 12 h, respectively. Then a filtration with a pore size of 2.5 μm was carried out. The filtrate was put in a constant-temperature water bath for evaporation and crystallization. The obtained salt was separated and analyzed.
The precipitation ratio was used to describe the precipitated salt in comparison to the total salt dissolved in the feed solution, with the evaporation ratio referring to weight of the evaporated water compared to the feed solution in weight. The ion contents of liquid and solid phases were determined by inductively coupled plasma emission spectrometry, and then the purity of the salts was determined by the ion contents, which were finally converted to the mass contents of AlCl3·6H2O and NaCl.

3. Results and Discussion

3.1. The Phase Diagram of the AlCl3-NaCl-H2O System

The phase diagram of the AlCl3-NaCl-H2O salt-water system under different H+ concentrations is shown in Figure 1. Since the temperature of the acid leaching solution of fly ash is generally around 353.15 K in practical processes, there is no diagram drawn in ambient temperature. It can be seen that the phase diagram of the ternary system is of a simple eutonic type under different acidities, i.e., the system has no double salt or solid solution. As a comparison, some of the data of refereces [9,13] are included in Figure 1.
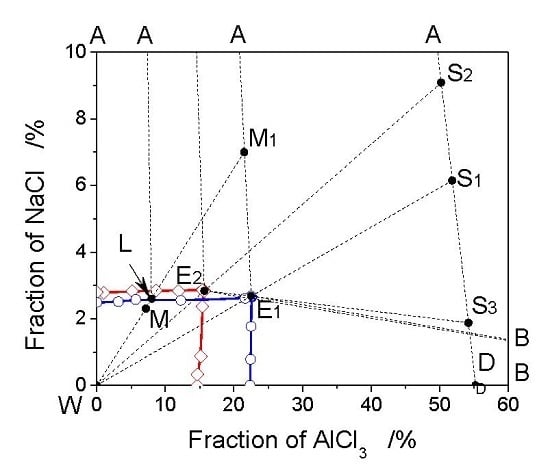
The phase diagram consists of three solid phase crystalline regions, two solubility univariate curves and one co-saturated point. The points A, B and W represent the solid phase NaCl, AlCl3 and the liquid phase, respectively. Besides those, there is another solid phase, i.e., the point D, representing AlCl3·6H2O. Taking the phase diagram of the system with 1.3 mol/L in H+ concentration as an example, there are three crystalline regions. The areas BE1K1 and AE1K2 are the crystalline regions of AlCl3 and NaCl, respectively, and AE1B is the co-crystalline region of AlCl3 and NaCl. The curve K2E1 represents the solubility of NaCl, and the curve K1E1 shows that of AlCl3. The point E1 is the intersection of the solubility curves, indicating the co-saturated state of the leaching solution. According to the rules of the phase diagram, the composition of the solution would not be changed when its position is at the point E1 in Figure 1.
Moreover, it can be seen that the acid concentration has a great impact on solubility, but the solubility curves are similar in trend under different acid concentrations. The solubility of the two salts is very low under hydrochloric acid conditions due to the homoion effect of Cl. In general, the increase in temperature helps the salts to be dissolved more easily, and the increase in acidity makes the salts dissolve less. For the AlCl3-NaCl-H2O (-HCl) salt-water system, the effect of temperature on the solubility is not obvious, but the inhibition effect of acidity is very great. For example, the research [9] showed that the solubility of AlCl3 in aqueous solutions increased from 31.16% (3.39 mol/kg in molality) to 31.53% (3.45 mol/kg) in mass percent when the temperature rose from 298.3 K to 338.1 K, for which increase of the solubility was not significant; the solubility of AlCl3 increased from 30.15% (3.26 mol/kg) to 31.30% (3.44 mol/kg) in the aqueous solution containing 0.53–0.56% (0.134–0.138 mol/kg) NaCl in the same range of temperature. Similarly, when the concentration of AlCl3 was about 30.47–30.61% (3.30–3.33 mol/kg), the solubility of NaCl increased from 0.37% (0.092 mol/kg) to 0.84% (0.21 mol/kg) when the temperature rose from 298.1 K to 322.9 K [9]. All of the increases in solubility were relatively small; thus, it could be considered that the solubility of salts did not change much at different temperatures in the AlCl3-NaCl-H2O system. In contrast, the effect of acidity on the solubility in the system was more significant. For instance, Figure 1 shows that the solubility of AlCl3 only reaches 22.60%, although the temperature was higher, and thus the dissolution was easier enhance, where the value of solubility in acidic solutions was much lower than that under neutral conditions [9]. Furthermore, the stronger the acidity in Figure 1, the smaller the solubility of AlCl3. Similarly, the research work [9] showed that the solubility of NaCl in aqueous solution was about 22.64% (5.252 mol/kg) when the concentration of AlCl3 was about 3.67% (0.373 mol/kg), while the solubility of NaCl was only about 2.55 % (H+ = 1.3M) to 2.80% (H+ = 4.0M) under the acidic conditions in Figure 1. The NaCl solubility could only reach lower than 0.55% when the H+ concentration reached 7.67 mol/L (28 wt% HCl) [13]. Obviously, these phenomena were caused by the strong inhibition of solubility by acidity. In addition, it should have to be noted that the solubility of NaCl unexpectedly increases when the acidity increases in Figure 1; presumably, this phenomenon could be due to the non-equilibrium evaporation state. Since the acidic solution was already in an unbalanced state for one hour at the time of sampling, the acidity drop caused by the volatilization of HCl and the convection of the liquid phase caused by heating might increase the solubility of NaCl, which made the salt solubility slightly disordered.

3.2. The Analysis of Crystallization Process Based on Phase Diagrams

Figure 2 shows a part of the phase diagram of AlCl3-NaCl-H2O system. Firstly, the process of evaporating crystals from the acid leaching solution is analyzed. As shown in Figure 2, the phase point M representing the feed solution in the phase diagram at 353.15 K is found. When the solution at point M is concentrated during the evaporation process, the system point moves away from the liquid point W due to loss of water until the solution begins to precipitate solid salt crystals. At this moment, the solid phase point is locked at point A of NaCl. When the evaporation continues, the liquid phase point moves from point M to point L, representing the saturated state of NaCl in the leaching solution and then to point E1 along the saturation curve. Finally the solid phase, liquid phase and system points are located at points A, E1 and M1, respectively. In this process, the system point falls into the crystallization region of NaCl, and thus the solid NaCl first gets saturated and begins to precipitate out. The system includes two parts, i.e., the solid phase of NaCl and the solution that is saturated for NaCl. According to the lever law of the phase diagram, the precipitation amount of NaCl can be calculated by M1E1/AE1. It can be seen that the ratio of M1E1/AE1 increases along with the evaporation process, indicating that the precipitation amount of NaCl is gradually increasing. The precipitation amount of NaCl reaches the maximum value when the system point reaches M1 and the liquid phase point reaches E1. Then, solid-liquid separation should be carried out to obtain the pure NaCl and the solution at point E1. When the evaporation of solution E1 continues, the liquid phase point is locked at point E1 because it represents the co-saturated solution of NaCl and AlCl3 and the degree of freedom is zero in the co-crystalline region of the two solid phases. The solid phase AlCl3·6H2O begins to precipitate, and the solid phase point appears at the point S1, representing the mixture of NaCl and AlCl3·6H2O, and then the system point gradually moves towards S1 until the solution E1 is evaporated to dryness. Finally, the liquid phase point disappears at point E1 and the solid mixture at point S1 is obtained. According to the coordinates of E1, the obtained salt should comprise 6.15% NaCl and 93.85% AlCl3·6H2O in weight percent. Based on the phase diagram rules, 93.85% should be the upper limit of the purity of AlCl3·6H2O prepared by using the evaporation method. According to the lever rule of the phase diagram, about 40% of the water should be evaporated out of the feed leaching solution when the system point moves from M to L and then the solid NaCl begins to precipitate. Before the liquid phase point reaches E1, it is in the single crystalline region of NaCl. At this time, the obtained salt should be pure NaCl; after a further 50% water is evaporated, the liquid phase point reaches point E and the mixed salts of NaCl and AlCl3·6H2O are gradually precipitated.
Secondly, the acid-adding crystallization process of the leaching solution is analyzed. As shown in Figure 2, the concentrated hydrochloric acid should be added when the solution at point E1 has been obtained. The solution at point E1 immediately falls into the area of AE2B, representing the co-precipitation region of NaCl and AlCl3·6H2O when H+ reaches 4.0 mol/L in concentration, and the liquid and solid phase points appears at E2 and S3, respectively. The coordinates of S3 show that the precipitated salt should be 1.88% NaCl and 98.12% AlCl3·6H2O in weight percent. The purity of AlCl3·6H2O is higher than that in the previous study [5]. However, calculated based on the lever rules of the phase diagram, the precipitated solid phase is less than about 0.18 times the weight of the whole solution at point E1, and most of the AlCl3 still exists in the solution at point E2, leading to a low yield. If the solution at point E2 is evaporated to dryness, the solid product at point S2 shows an AlCl3·6H2O content of 90.91%. It should be noted that, similar to the analysis of Figure 1, there was a certain degree of disorder phenomenon in the non-equilibrium evaporation and acid-adding processes, which could make the quality of the final product lower than the expectations in Figure 2. However, in any case, the analysis process based on Figure 2 was generally predictive of the grade of the product. In general, pure salt crystals can be achieved using the method of acid addition, but a large consumption of acid may be necessary. For example, the crystallization process in the previous study [5] is similar to the process in Figure 2, suggesting that AlCl3·6H2O could reach 96.8% in purity when the HCl is about 7.40 mol/L (27.0%) in concentration [5], which is close to the theoretical expectation in Figure 2.

3.3. Optimization of Crystallization Process Based on Phase Diagram

Figure 3 shows the precipitation ratio of solid salt when the acid leaching solution is evaporated at 1.3 mol/L in H+ concentration. The precipitation ratio of NaCl was more than 90% when the evaporation ratio of the acid leaching solution reached about 78%, while the crystallization ratio of AlCl3·6H2O was only about 20%. After that, the precipitation ratio of AlCl3·6H2O was obviously accelerated. In Figure 3, AlCl3 began to precipitate significantly after the NaCl content was reduced to a certain amount, which is in accordance with the analysis of Figure 2. However, there was a phenomenon that the AlCl3·6H2O was precipitated a little ahead of the prediction of Figure 2, which was assumed to be because FeCl3 and CaCl2 affected the phase transition of AlCl3·6H2O. Since the precipitation sequence of NaCl and AlCl3·6H2O agreed basically with the theoretical analysis of Figure 2, the phase diagram can be considered reliable, and can be used to guide the separation of pure NaCl and AlCl3·6H2O.
It is worth mentioning that the precipitation ratio for calcium chloride and iron chloride was approximately 20% when the leaching solution exhibited approximately an evaporation ratio of 23–78%. It is assumed that the high ion strength in the leaching solution greatly decreased the solubility of FeCl3 and CaCl2, resulting in their precipitation in advance. For instance, the data for the phase equilibrium of the AlCl3-CaCl2-H2O system [7] has provides an example; i.e., the solubility of CaCl2 sharply fell from 59.52% (13.246 mol/kg) to 0 when the concentration of AlCl3 rose from 0 to 32.52% (3.610 mol/kg) at 353.15 K. The AlCl3-FeCl3-H2O system [8] showed a similar phenomenon. This means that the solubility of FeCl3 and CaCl2 can be significantly reduced in the concentrated salt solution.
After considering the above theoretical analysis and experimental results, the technological processes described in Figure 2 were tested. The acid leaching solution of fly ash was used for the experiment to prepare salt crystals. Following crystallization and solid-liquid separation, the purity of the final salt products is shown in Table 1. It can be seen that the NaCl and AlCl3·6H2O reach 99.12% and 97.35% in purity, respectively, which is higher than the previous results [5]. However, it is important to note that, in the actual process experiment, when the temperature is high, the mixture of AlCl3·6H2O and NaCl derived from the separation may contain a large iron salt and calcium salt content. It is assumed that the iron-calcium impurities may be entrained when the precipitation of AlCl3·6H2O and NaCl occurs. Furthermore, fluid mechanics also have a great influence on the precipitation, which may affect the purity of salts in the practical production.

4. Conclusions

The non-equilibrium phase diagram of AlCl3-NaCl-H2O (-HCl) salt-water systems under continuous heating and evaporation conditions was investigated. The ternary system is of a simple co-saturated type under different acidity conditions, i.e., the system has no double salt or solid solution. The phase diagram consists of one co-saturated point, two solubility univariate curves and three solid phase crystalline regions of pure AlCl3·6H2O, pure NaCl and mixed AlCl3·6H2O/NaCl, respectively. Increasing the acidity will reduce the solubility of each salt. The phase diagram was used to analyze the crystallization process of AlCl3·6H2O and NaCl. The crystallization rule of the acid leaching solution at different acidities was analyzed theoretically and experimentally. Based on the phase diagrams, a procedure was designed to remove NaCl at the first stage of evaporation, and then continue to evaporate and crystallize AlCl3·6H2O after solid-liquid separation. The experimental results of this program were consistent with the prediction based on the phase diagram, and NaCl and AlCl3·6H2O with purities of 99.12% and up to 97.35%, respectively, were finally obtained.

Acknowledgments

This work was financially supported by National Natural Science Foundation of China (51674162), the Tri-Jin Scholars and Natural Science Foundation of Shanxi Province (201601D102058) and the Provincial Research Projects (2016JD06, 2016-HZ-803).

Author Contributions

Huaigang Cheng and Fangqin Cheng conceived and designed the experiments; the high-purity NaCl and AlCl3·6H2O crystals were separated from acidic solution by Jianwei Zhang, and the data of non-equilibrium phase diagram was obtained by Huibin Lv; the experimental platform and corresponding support were provided by Fangqin Cheng; Huaigang Cheng drew the phase diagram and analyzed the data with Yanxia Guo, Wenting Cheng and Jing Zhao; Huaigang Cheng wrote the paper.

Conflicts of Interest

The authors declare no conflict of interest.

References

  1. Sibanda, V.; Ndlovu, S.; Dombo, G.; Shemi, A.; Rampou, M. Towards the Utilization of Fly Ash as a Feedstock for Smelter Grade Alumina Production: A Review of the Developments. J. Sustain. Metall. 2016, 2, 167–184. [Google Scholar] [CrossRef]
  2. Yao, Z.T.; Ji, X.S.; Sarker, P.K.; Tang, J.H.; Ge, L.Q.; Xia, M.S.; Xi, Y.Q. A comprehensive review on the applications of coal fly ash. Earth-Sci. Rev. 2015, 141, 105–121. [Google Scholar] [CrossRef]
  3. Gong, J.B.; Wang, Y.; Du, S.C.; Dong, W.B.; Yu, B.; Wu, S.G.; Hou, J.; Wang, J.K. Industrial Crystallization in China. Chem. Eng. Technol. 2016, 39, 807–814. [Google Scholar] [CrossRef]
  4. Lewis, A.; Seckler, M.; Kramer, H.; Van Rosmalen, G. Industrial Crystallization: Fundamentals and Applications, 1st ed.; Cambridge University Press: Cambridge, UK, 2015; pp. 4–13. [Google Scholar]
  5. Guo, Y.; Lv, H.; Yang, X.; Cheng, F. AlCl3·6H2O recovery from the acid leaching liquor of coal gangue by using concentrated hydrochloric inpouring. Sep. Purif. Technol. 2015, 151, 177–183. [Google Scholar] [CrossRef]
  6. Gao, W.C.; Li, Z.B. Solubility of AlCl3·6H2O in the Fe(II) plus Mg plus Ca plus K+Cl+H2O System and its salting-out crystallization with FeCl2. Ind. Eng. Chem. Res. 2013, 52, 14282–14290. [Google Scholar] [CrossRef]
  7. Wang, J.; Petit, C.; Zhang, X.; Cui, S. Phase Equilibrium Study of the AlCl3-CaCl2-H2O System for the Production of Aluminum Chloride Hexahydrate from Ca-Rich Flue Ash. J. Chem. Eng. Data 2016, 61, 359–369. [Google Scholar] [CrossRef]
  8. Yuan, M.; Qiao, X.; Yu, J. Phase equilibria of AlCl3 + FeCl3 + H2O, AlCl3 + CaCl2 + H2O, and FeCl3 + CaCl2 + H2O at 298.15 K. J. Chem. Eng. Data 2016, 61, 1749–1755. [Google Scholar] [CrossRef]
  9. Farelo, F.; Fernandes, C.; Avelino, A. Solubilities for Six Ternary Systems: NaCl+NH4Cl+H2O, KCl+NH4Cl+H2O, NaCl+LiCl+H2O, KCl+LiCl+H2O, NaCl+AlCl3+H2O, and KCl+AlCl3+H2O at T=(298 to 333) K. J. Chem. Eng. Data 2005, 50, 1470–1477. [Google Scholar] [CrossRef]
  10. Sarkarov, R.A.; Mironova, O.P. Solubility in the AlCl3-LiCl-NaCl-H2O System. Zh. Neorg. Khim. 1990, 35, 280–282. [Google Scholar]
  11. Ulrich, J.; Frohberg, P. Problems, potentials and future of industrial crystallization. Front. Chem. Sci. Eng. 2013, 7, 1–8. [Google Scholar] [CrossRef]
  12. Zhou, H.; Chen, Y.; Kang, Q.; Zhang, J.; Zhang, H.; Yuan, J.; Sha, Z. Non-equilibrium State Salt-forming Phase Diagram: Utilization of Bittern Resource in High Efficiency. Chin. J. Chem. Eng. 2010, 18, 635–641. [Google Scholar] [CrossRef]
  13. Skiba, G.S.; Sel’kina, Y.A. The NaCl-AlCl3-HCl-H2O System at 25 °С. Russ. J. Inorg. Chem. 2016, 61, 1031–1034. [Google Scholar] [CrossRef]
Figure 1. The phase diagram of AlCl3-NaCl-H2O system. A—NaCl, B—AlCl3, W—(HCl+H2O), D—AlCl3·6H2O; ○—H+ = 1.3 mol/L at 353.15 K (this work), —H+ = 4.0 mol/L at 353.15 K (this work); ▲—Aqueous solution at approximate 330 K [9], ▼—Aqueous solution at approximate 298 K [9], ■—H+ = 7.67 mol/L at 298.15 K [13].
Crystals 07 00244 g001
Figure 2. The part of the phase diagram of the NaCl-AlCl3-H2O system at 353.15 K. A—NaCl, B—AlCl3, W—(HCl+H2O), D—AlCl3·6H2O; —H+ = 1.3 mol/L, —H+ = 4.0 mol/L.
Crystals 07 00244 g002
Figure 3. The precipitation sequence of crystal salts.
Crystals 07 00244 g003
Table 1. The purities of precipitated salts.
SaltsContents (wt%)
AlCl3·6H2ONaClImpurities
ExperimentalTheoreticalExperimentalTheoretical
NaCl0099.12100.000.88
AlCl3·6H2O (S1)90.0693.855.206.154.74
AlCl3·6H2O (S3)97.3598.121.321.881.33