Author Contributions
Conceptualization, H.W.; methodology, H.Z.; validation, N.Z. and H.W.; formal analysis, N.Z.; investigation, N.Z.; resources, H.W.; data curation, N.Z.; writing—original draft preparation, N.Z.; writing—review and editing, N.Z.; supervision, H.Z.; project administration, H.W.; funding acquisition, H.W. All authors have read and agreed to the published version of the manuscript.
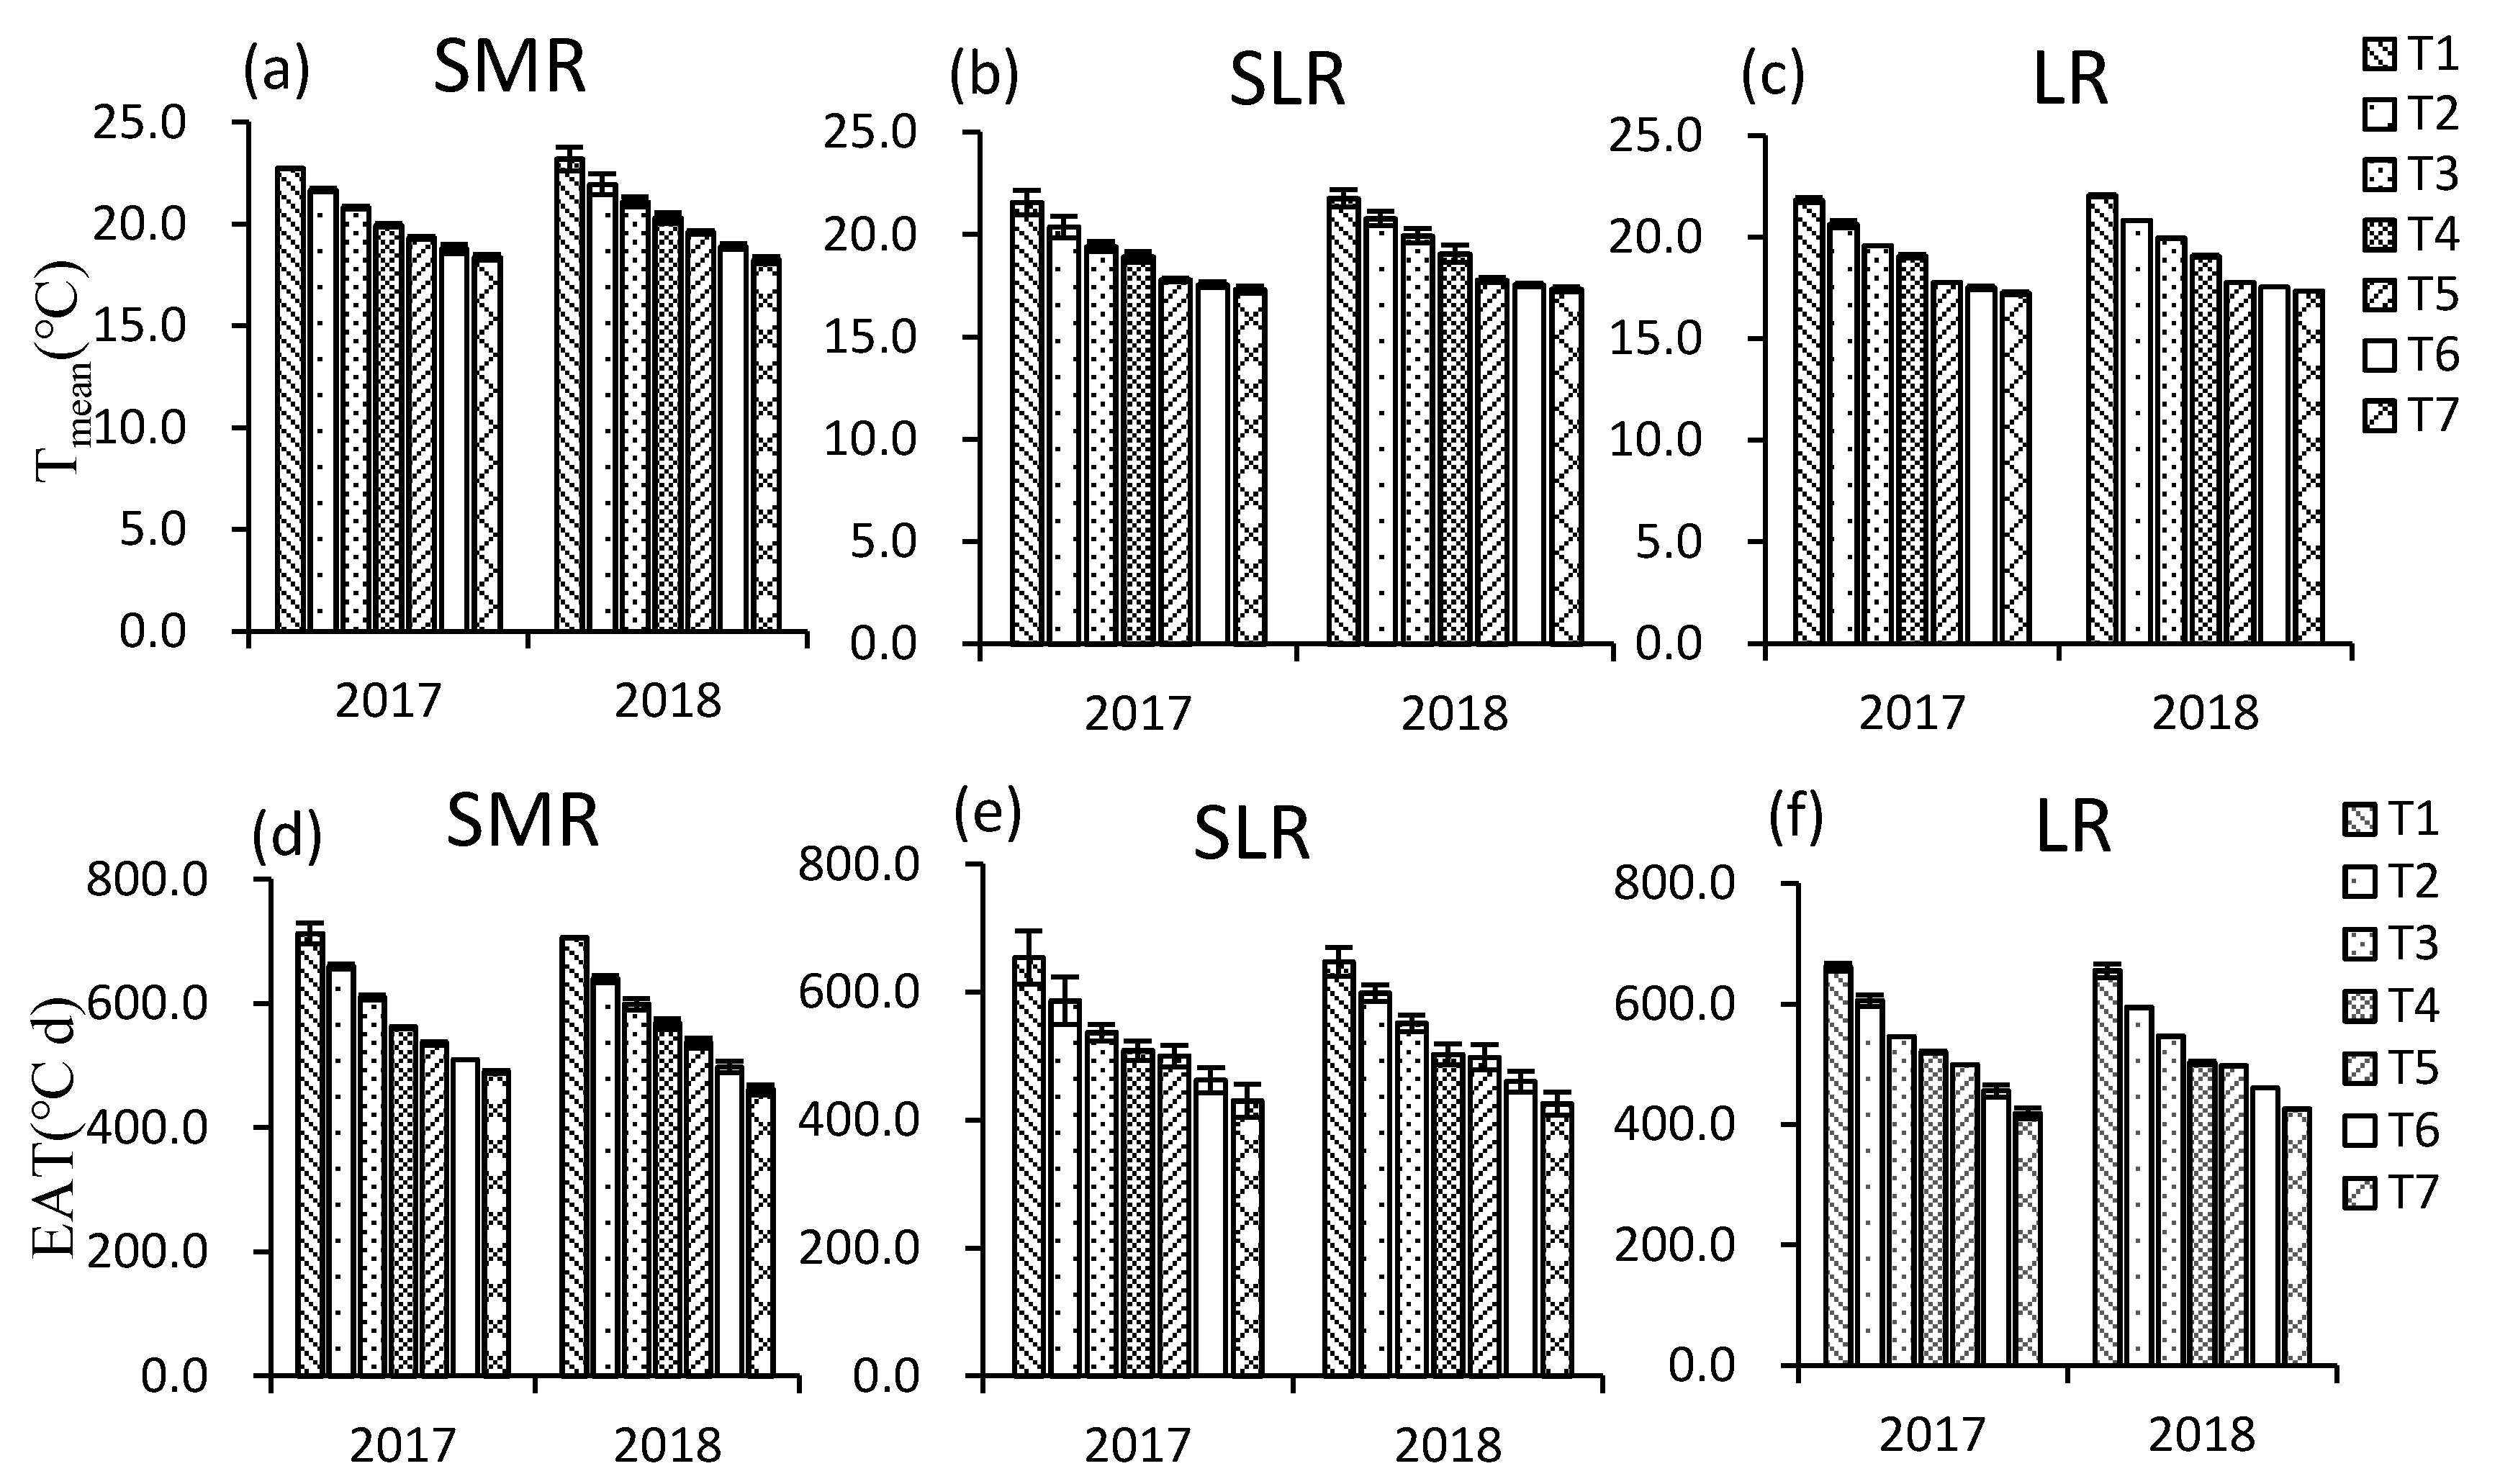
Figure 1.
Differences in mean daily temperature (Tmean, °C) and effective accumulated temperature (EAT, °C d) of rice at the stage from heading–maturity in the seven environmental condition treatments. (a–c) respesent the Tmean of SMR, SLR and LR at the stage from heading-maturity in the seven environmental condition treatments. (d–f) respesent the EAT of SMR, SLR and LR at the stage from heading-maturity in the seven environmental condition treatments. T1, T2, T3, T4, T5, T6, and T7 represent the sowing dates 10 May, 17 May, 24 May, 31 May, 7 June, 14 June, and 21 June. SMR: medium-maturing japonica soft rice, SLR: late-maturing japonica soft rice, LR: late-maturing japonica non-soft rice.
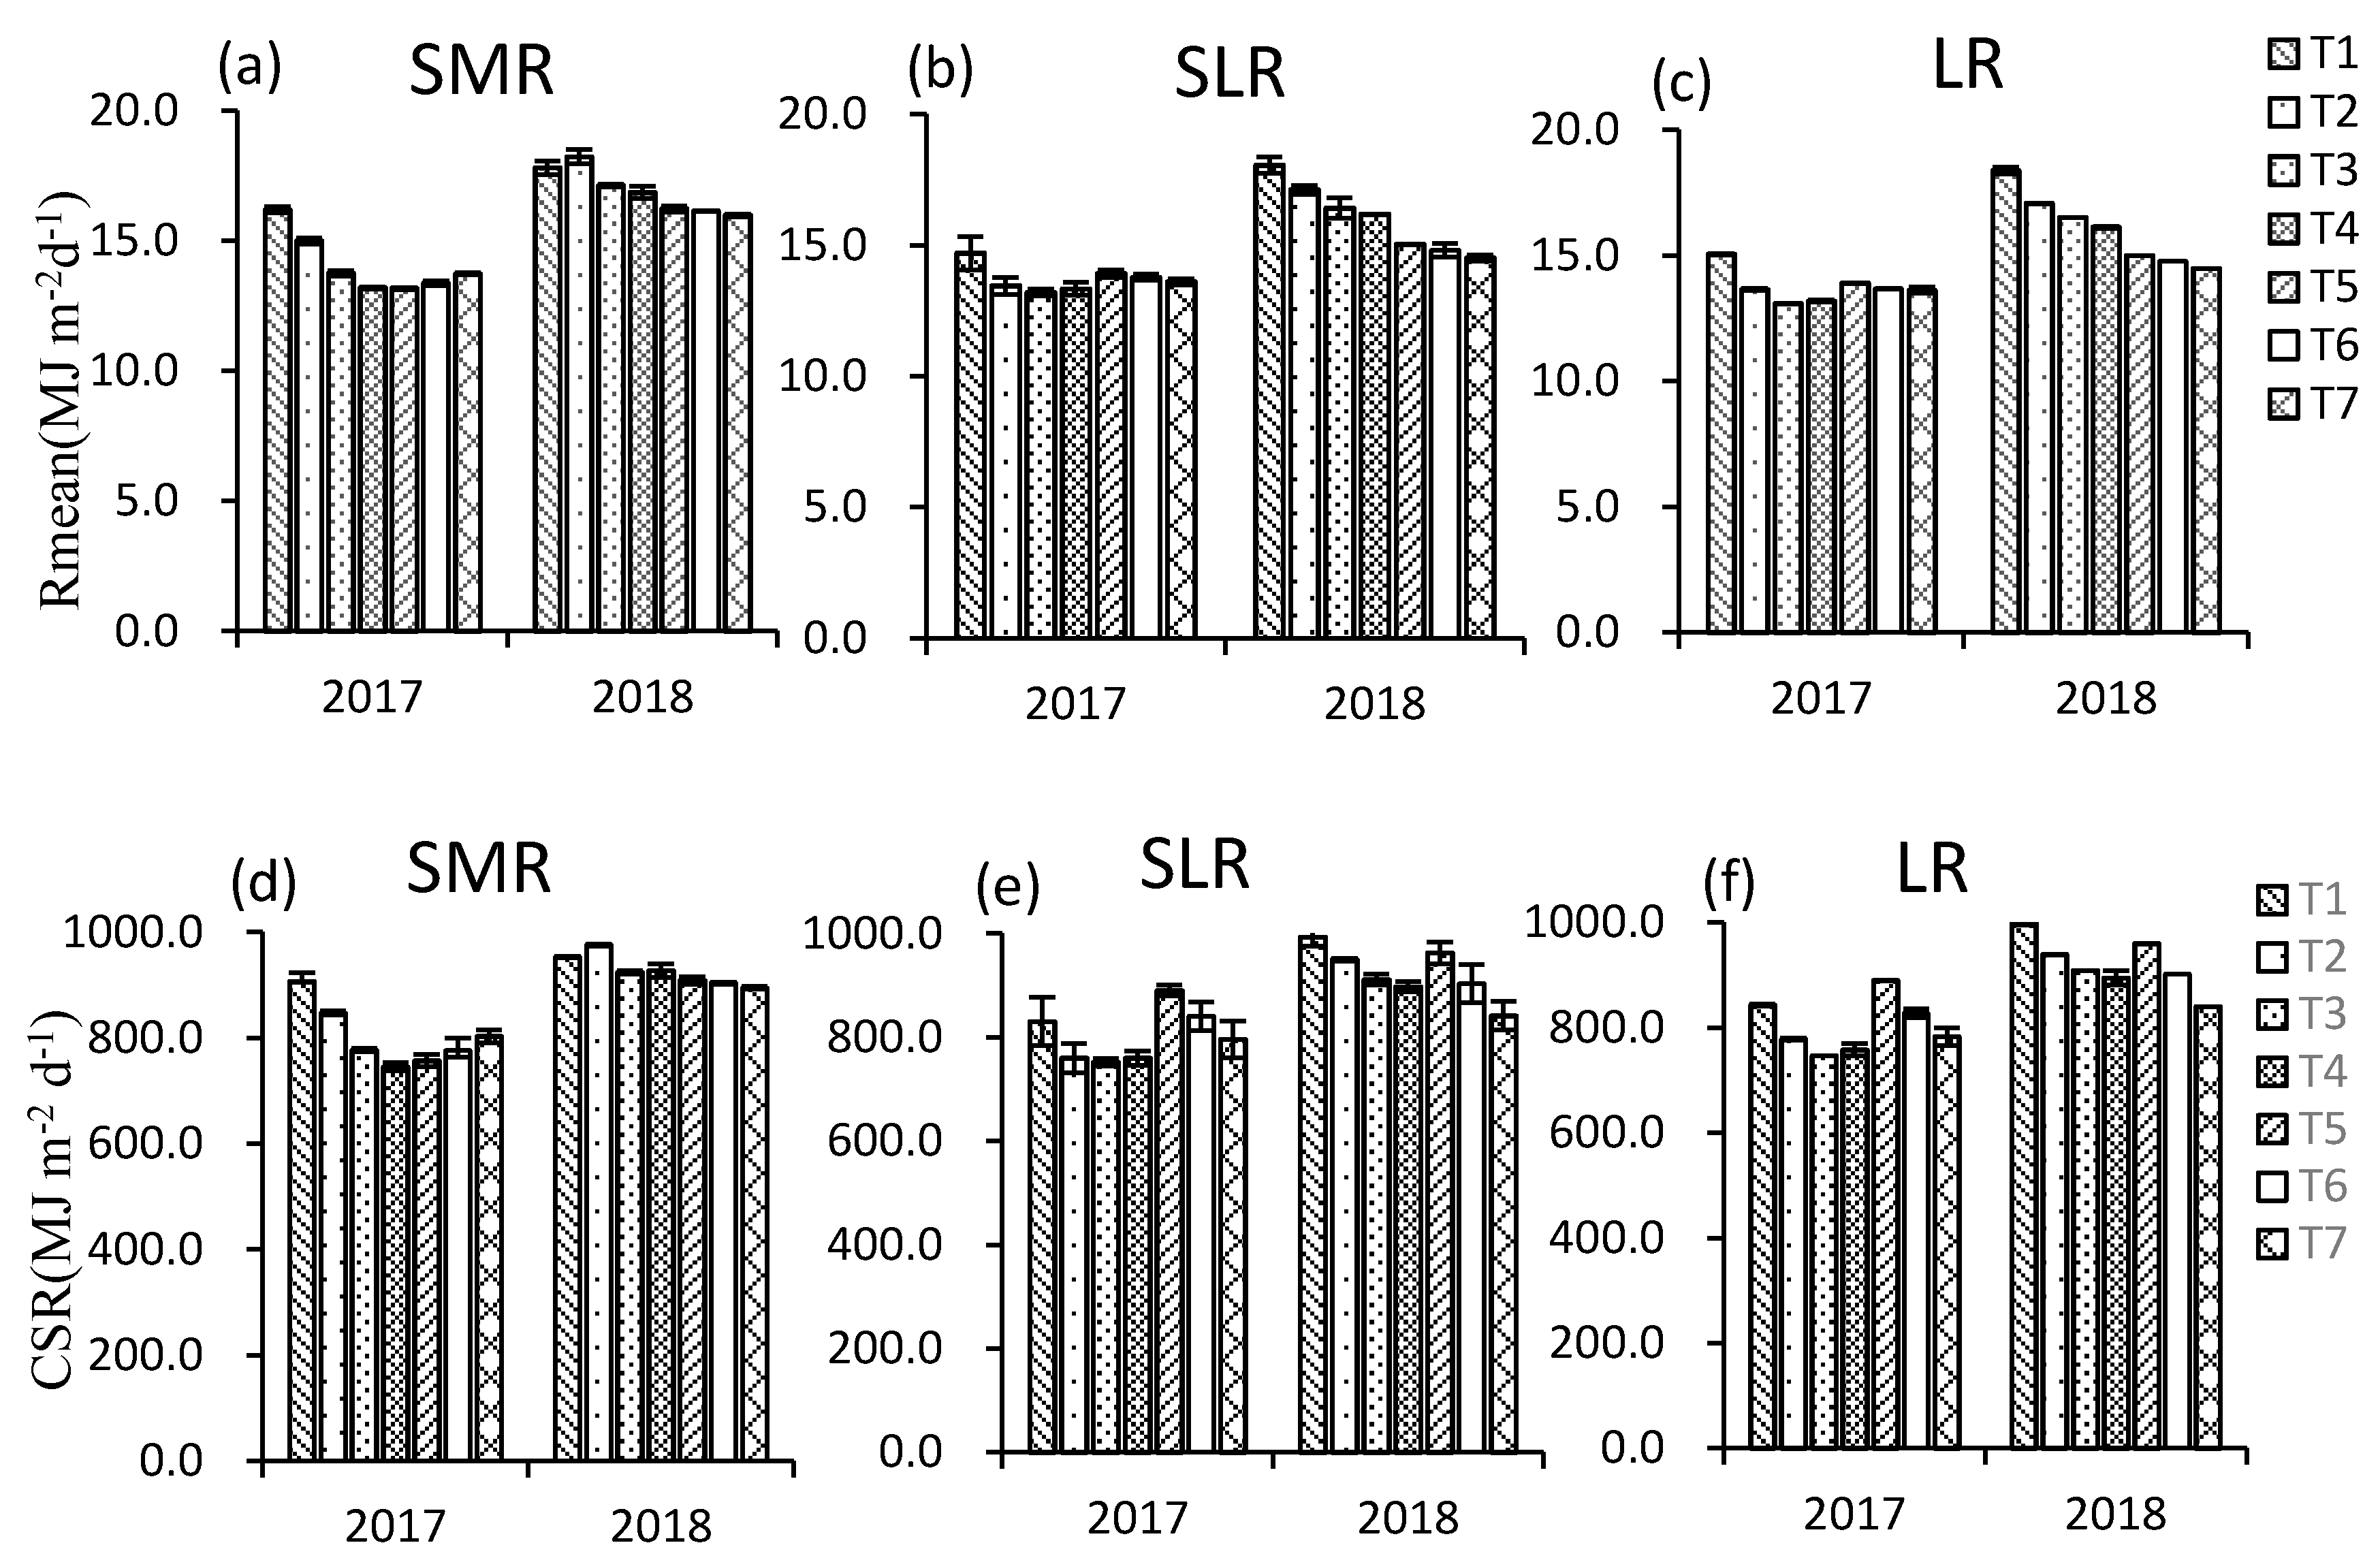
Figure 2.
Differences in mean daily solar radiation (Rmean MJ m−2 d−1) and cumulative solar radiation (CSR MJ m−2) of rice at the stage from heading–maturity in the seven environmental condition treatments. (a–c) respesent the Rmean of SMR, SLR and LR at the stage from heading-maturity in the seven environmental condition treatments. (d–f) respesent the CSR of SMR, SLR and LR at the stage from heading-maturity in the seven environmental condition treatments.
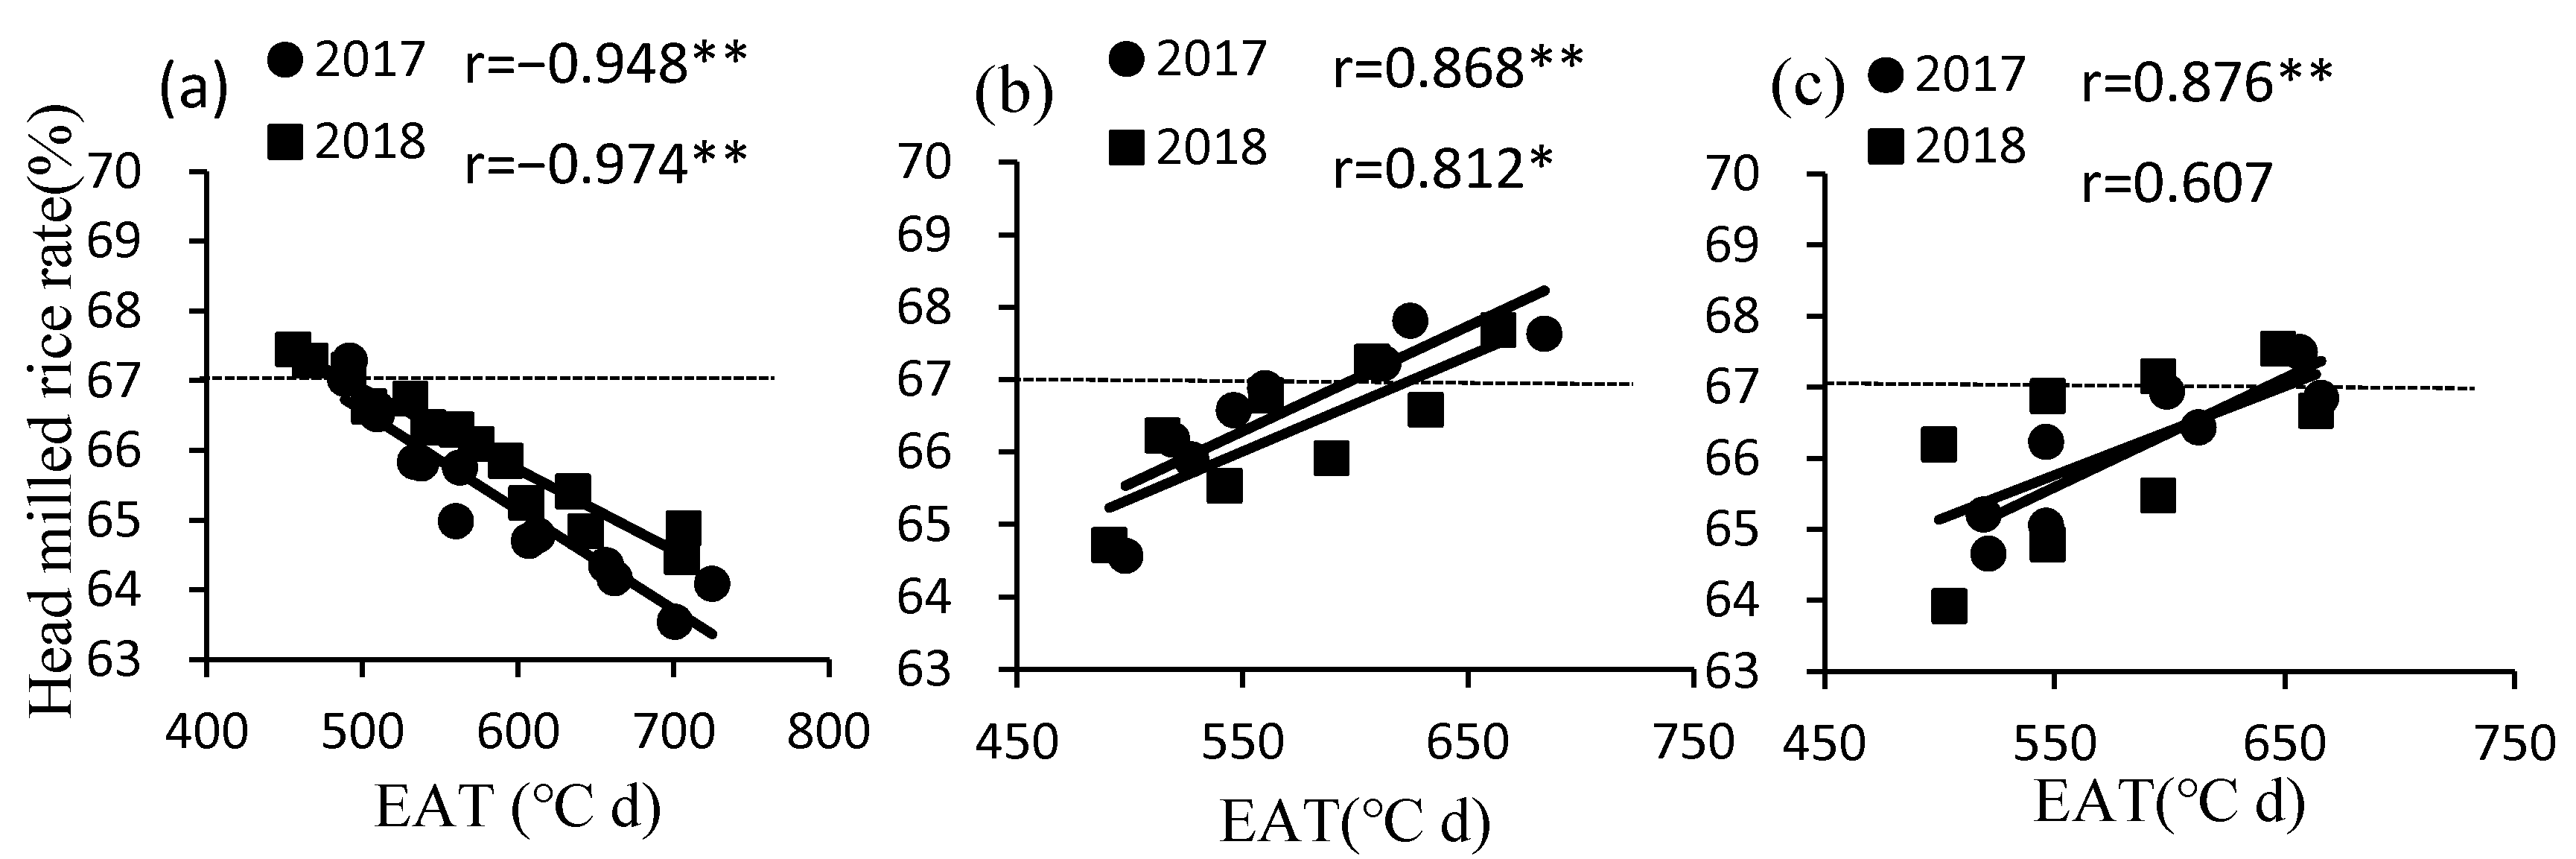
Figure 3.
The correlation between head milled rice rate and the EAT of rice at stage of heading–maturity (a): SMR, n = 14, (b): SLR, n = 8, (c): LR, n = 8, the (immature treatment including T5, T6 and T7 was removed from SLR and LR). * and ** indicate p <0.05 and p < 0.01, respectively.
Figure 3.
The correlation between head milled rice rate and the EAT of rice at stage of heading–maturity (a): SMR, n = 14, (b): SLR, n = 8, (c): LR, n = 8, the (immature treatment including T5, T6 and T7 was removed from SLR and LR). * and ** indicate p <0.05 and p < 0.01, respectively.
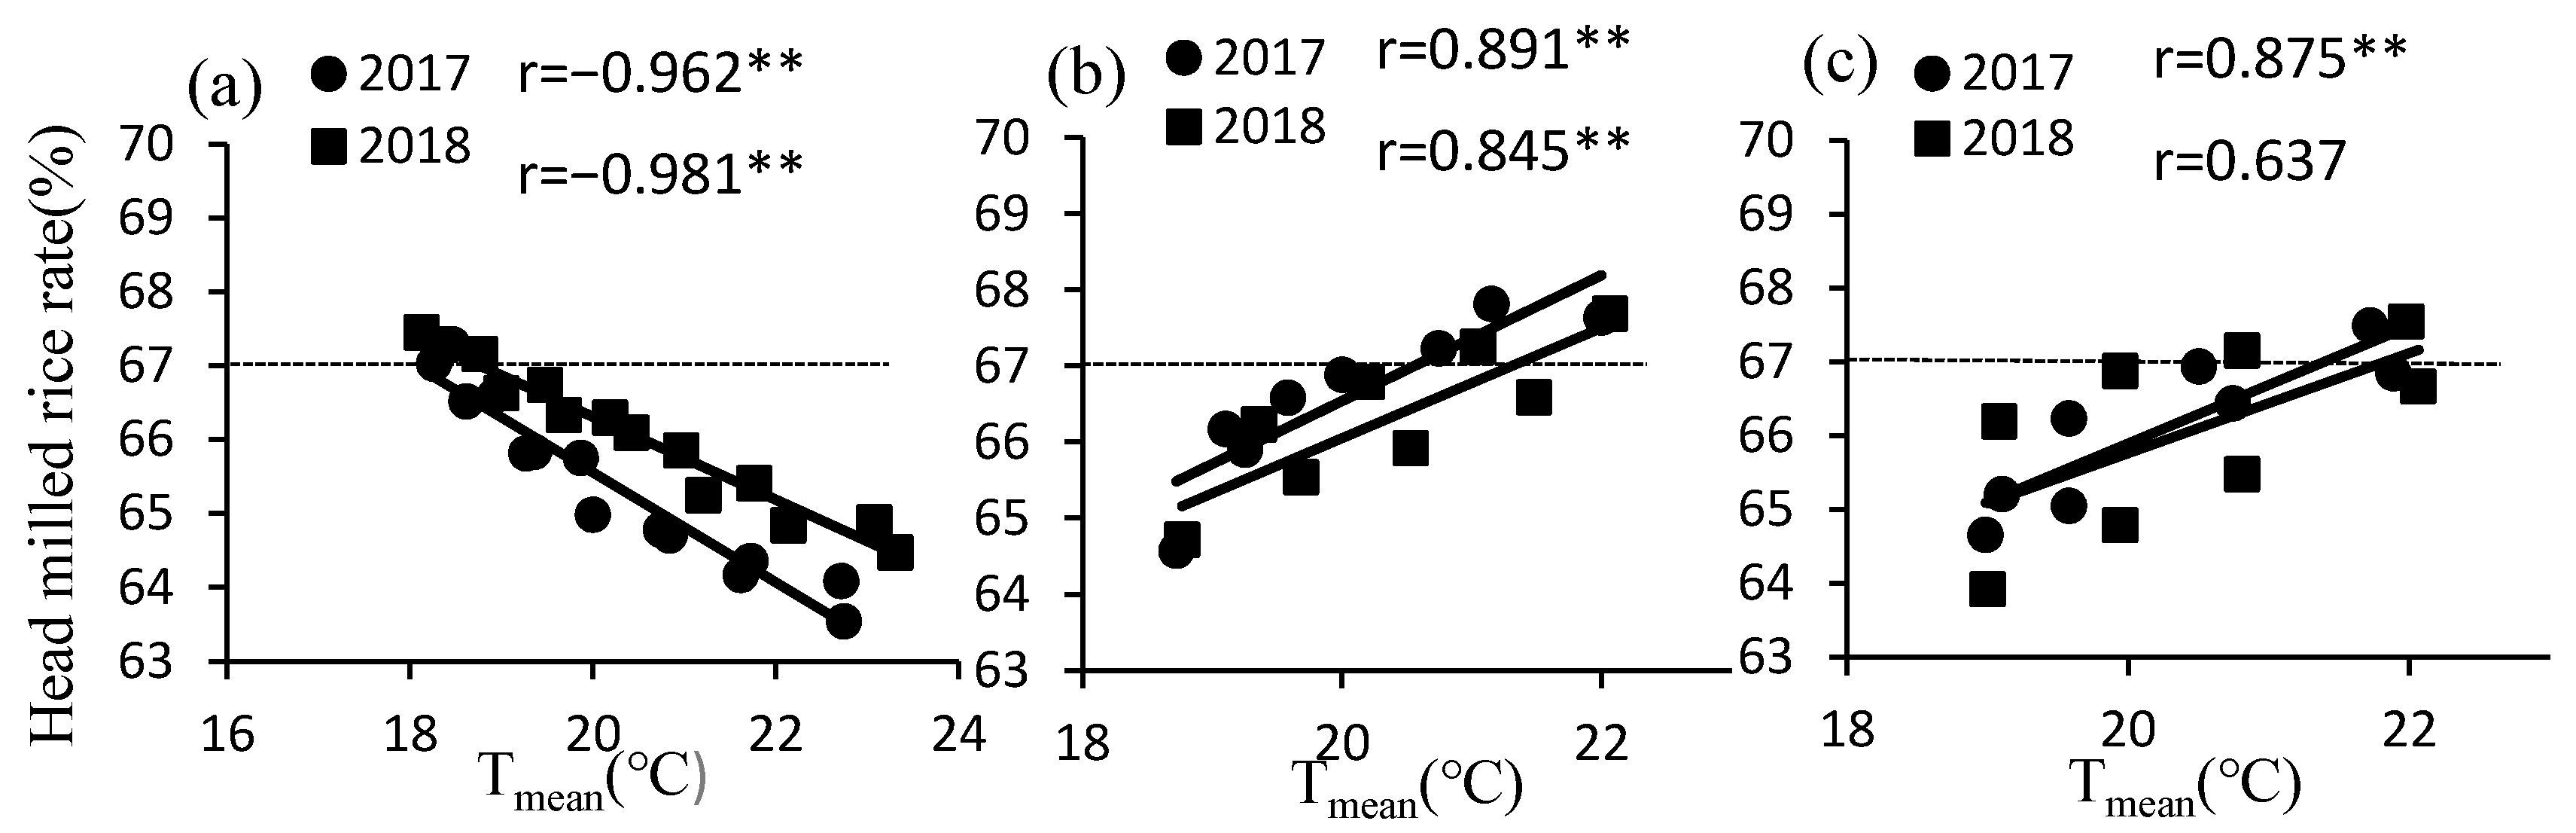
Figure 4.
The correlation between head milled rice rate and the Tmean of rice at stage of heading–maturity (a): SMR, n = 14, (b): SLR, n = 8, (c): LR, n = 8, (the immature treatment including T5, T6 and T7 was removed from SLR and LR). ** indicate p < 0.01.
Figure 4.
The correlation between head milled rice rate and the Tmean of rice at stage of heading–maturity (a): SMR, n = 14, (b): SLR, n = 8, (c): LR, n = 8, (the immature treatment including T5, T6 and T7 was removed from SLR and LR). ** indicate p < 0.01.
Figure 5.
The correlation between chalkiness degree and the EAT of rice at stage of heading-maturity (a): SMR, n = 14, (b): SLR, n = 8, (c): LR, n = 8, (the immature treatment including T5, T6 and T7 was removed from SLR and LR). * and ** indicate p <0.05 and p < 0.01, respectively.
Figure 5.
The correlation between chalkiness degree and the EAT of rice at stage of heading-maturity (a): SMR, n = 14, (b): SLR, n = 8, (c): LR, n = 8, (the immature treatment including T5, T6 and T7 was removed from SLR and LR). * and ** indicate p <0.05 and p < 0.01, respectively.
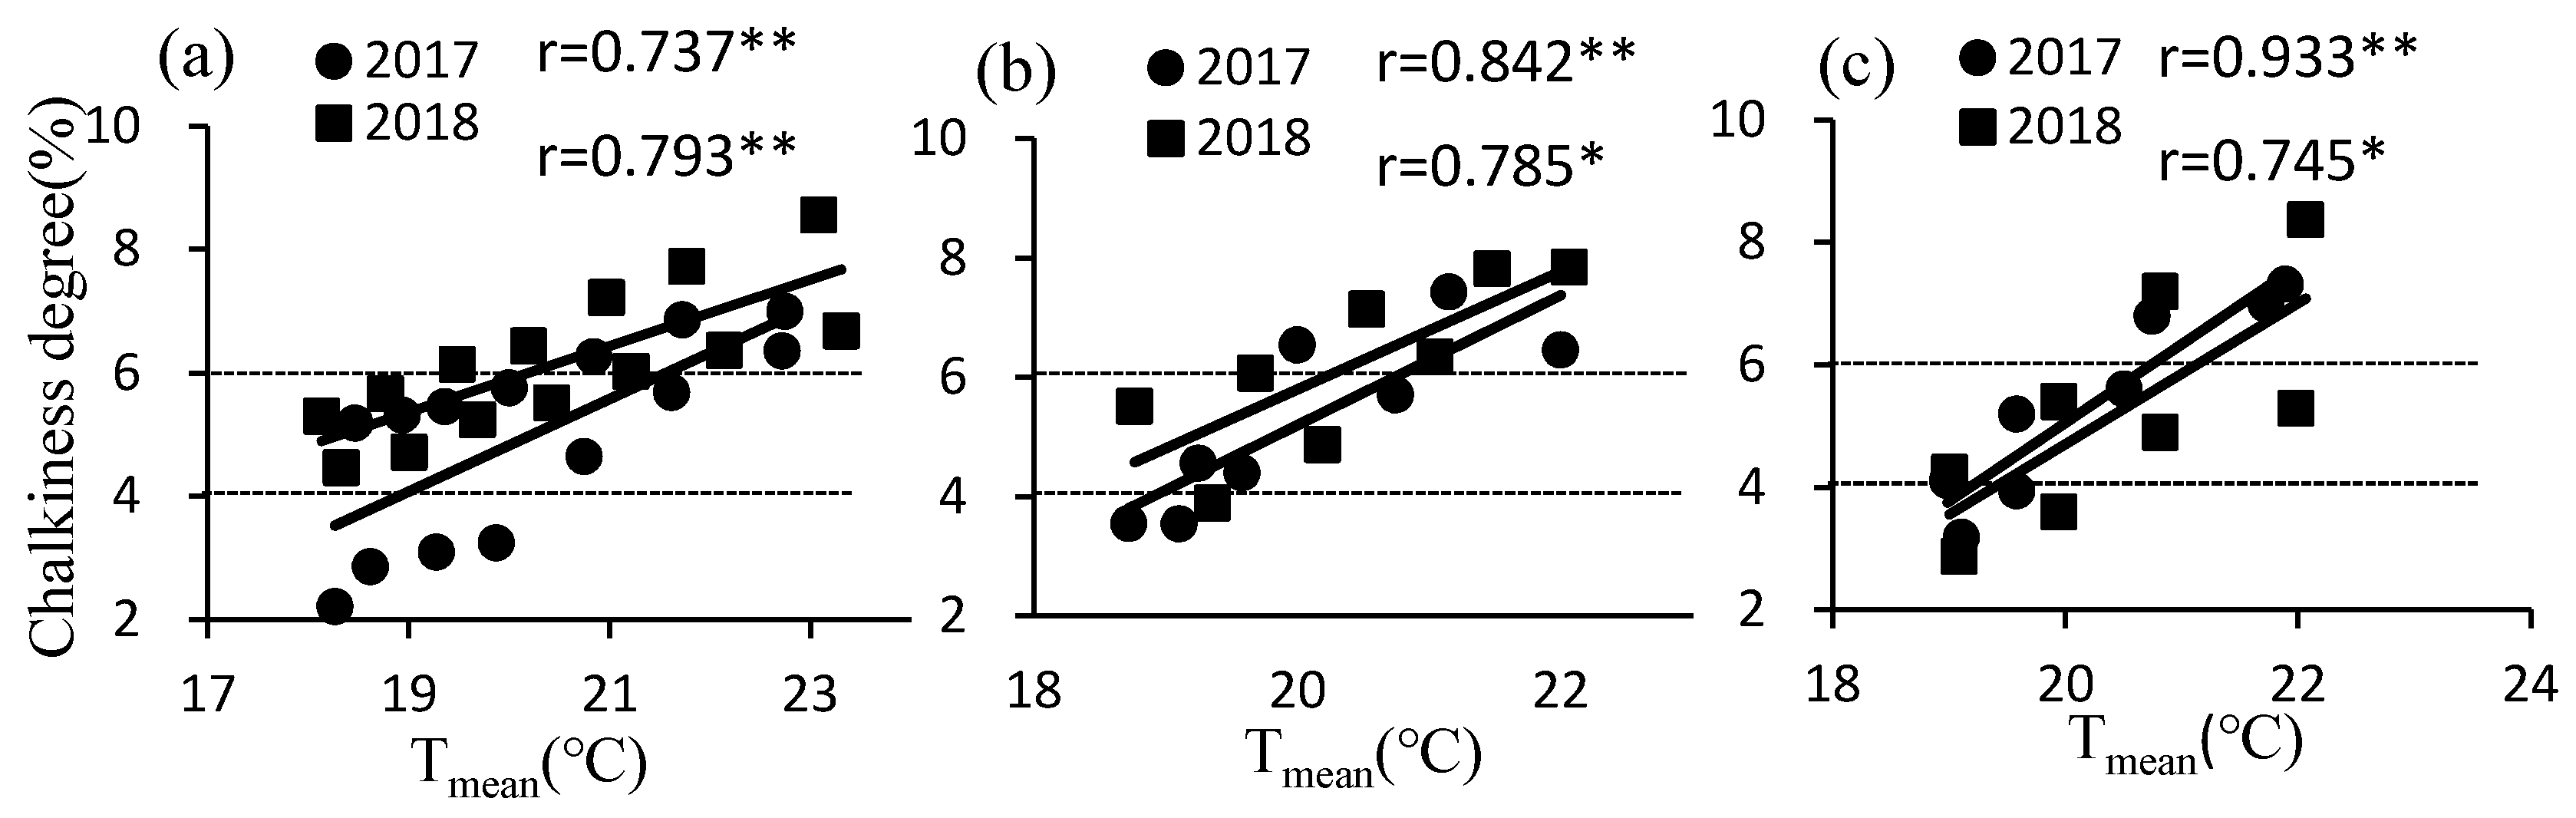
Figure 6.
The correlation between chalkiness degree and the Tmean of rice at stage of heading-maturity (a): SMR, n = 14, (b): SLR n = 8, (c): LR, n = 8, the immature treatment including T5, T6 and T7 was removed from SLR and LR). * and ** indicate p <0.05 and p < 0.01, respectively.
Figure 6.
The correlation between chalkiness degree and the Tmean of rice at stage of heading-maturity (a): SMR, n = 14, (b): SLR n = 8, (c): LR, n = 8, the immature treatment including T5, T6 and T7 was removed from SLR and LR). * and ** indicate p <0.05 and p < 0.01, respectively.
Table 1.
The coefficients a and b for each month in the Angstrom-Prescott model.
Table 1.
The coefficients a and b for each month in the Angstrom-Prescott model.
| Coefficient | May | June | July | August | September | October | November |
|---|
| a | 0.211 | 0.239 | 0.303 | 0.272 | 0.304 | 0.290 | 0.206 |
| b | 0.712 | 0.624 | 0.529 | 0.576 | 0.487 | 0.567 | 0.679 |
Table 2.
Analysis of variance table for milling and appearance quality of rice among years, sowing dates and varieties.
Table 2.
Analysis of variance table for milling and appearance quality of rice among years, sowing dates and varieties.
| Analysis of Variance | df | Brown Rice Rate | Milled Rice Rate | Head Milled Rice Rate | Chalky Grains | Chalkiness Degree |
|---|
| Year (Y) | 1 | 50.956 ** | 11.653 ** | 3.004 NS | 28.403 ** | 319.798 ** |
| Type (T) | 2 | 11.481 ** | 26.513 ** | 36.675 ** | 3488.960 ** | 55.969 ** |
| Sowing date (S) | 6 | 28.068 ** | 31.464 ** | 48.648 ** | 459.804 ** | 444.033 ** |
| Variety (V) | 1 | 92.966 ** | 19.921 ** | 36.472 ** | 437.967 ** | 306.443 ** |
| Y × T | 2 | 67.557 ** | 31.659 ** | 5.760 ** | 92.896 ** | 108.934 ** |
| Y × S | 6 | 0.380 NS | 1.105 NS | 0.324 NS | 29.270 ** | 2.974 * |
| Y × V | 1 | 2.183 NS | 35.045 ** | 1.692 NS | 15.430 ** | 485.505 ** |
| T × S | 12 | 58.571 ** | 76.606 ** | 47.115 ** | 141.089 ** | 59.200 ** |
| T × V | 2 | 73.169 ** | 13.829 ** | 16.992 ** | 320.189 ** | 248.186 ** |
| S × V | 6 | 2.276 * | 2.229 * | 0.613 NS | 9.717 ** | 4.856 ** |
| Y × T × S | 12 | 1.372 NS | 2.633 ** | 0.581 NS | 10.609 ** | 0.690 NS |
| Y × T × V | 2 | 3.730 * | 24.066 ** | 2.411 NS | 11.225 ** | 119.044 ** |
| Y × S × V | 6 | 1.328 NS | 2.191 NS | 0.206 NS | 2.757 * | 1.477 NS |
| T × S × V | 12 | 3.660 ** | 2.264 * | 0.389 NS | 10.793 ** | 5.388 ** |
| Y × T × S × V | 12 | 0.627 NS | 1.346 NS | 0.291 NS | 6.278 ** | 6.801 ** |
Table 3.
Differences in milling quality of rice under different temperature and solar radiation conditions.
Table 3.
Differences in milling quality of rice under different temperature and solar radiation conditions.
| Variety | Treatment | Brown Rice Rate (%) | Milled Rice Rate (%) | Head Milled Rice Rate (%) |
|---|
| 2017 | 2018 | 2017 | 2018 | 2017 | 2018 |
|---|
| Nangeng2728 | T1 | 83.17 d | 82.45 b | 70.57 d | 71.41 b | 63.54 b | 64.47 c |
| T2 | 83.59 c,d | 82.66 b | 71.40 d | 71.34 b | 64.35 b | 64.84 b,c |
| T3 | 84.06 c | 83.02 a,b | 71.71 c,d | 71.66 b | 64.70 a,b | 65.25 b,c |
| T4 | 84.90 b | 83.43 a,b | 72.63 b,c | 72.53 a | 64.98 a,b | 66.09 a,b,c |
| T5 | 85.37 b | 83.53 a,b | 73.09 a,b | 72.66 a | 65.83 a,b | 66.33 a,b |
| T6 | 85.62 b | 83.67 a,b | 73.74 a,b | 72.92 a | 66.60 a | 66.63 a,b |
| T7 | 86.65 a | 84.22 a | 74.25 a | 73.24 a | 67.29 a | 67.29 a |
| Nangeng505 | T1 | 83.82 c | 82.06 c | 70.47 d | 70.10 d | 64.09 c | 64.88 b |
| T2 | 84.61 b,c | 82.12 c | 70.66 d | 70.81 c,d | 64.17 c | 65.41 a,b |
| T3 | 84.61 b,c | 82.56 c | 71.63 c,d | 71.27 c,d | 64.78 b,c | 65.85 a,b |
| T4 | 85.72 a,b | 83.18 b,c | 72.69 b,c | 71.77 b,c | 65.75 a,b,c | 66.30 a,b |
| T5 | 86.10 a,b | 83.51 a,b,c | 73.25 b,c | 72.19 a,b,c | 65.81 a,b,c | 66.74 a,b |
| T6 | 86.29 a | 84.07 a,b | 72.97 a,b | 72.88 a,b | 66.52 a,b | 67.16 a |
| T7 | 87.17 a | 84.66 a | 74.53 a | 73.72 a | 67.03 a | 67.45 a |
| Nangeng9108 | T1 | 85.31 a | 85.25 a | 73.77 a | 73.65 a | 67.63 a | 67.68 a |
| T2 | 84.89 a | 85.09 a | 73.20 a | 73.25 a | 67.23 a | 67.25 a |
| T3 | 84.76 a | 84.84 a | 73.12 a | 73.18 a | 66.58 a | 66.78 a |
| T4 | 83.75 a | 83.70 b | 73.05 a | 73.07 a | 66.17 a | 66.23 a |
| T5 | 81.08 b | 81.83 c | 71.36 b | 71.62 b | 64.37 b | 63.67 b |
| T6 | 80.35 b | 81.35 c | 70.43 b | 70.69 b | 63.25 b,c | 62.77 b,c |
| T7 | 80.00 b | 79.01 d | 68.53 c | 68.60 c | 62.36 c | 61.61 c |
| Fenggeng1606 | T1 | 86.72 a | 86.83 a | 73.87 a | 73.57 a | 67.81 a | 66.58 a |
| T2 | 86.29 a,b | 86.14 a,b | 73.59 a | 73.34 a | 66.88 a,b | 65.92 a |
| T3 | 85.22 a,b,c | 86.58 a,b | 73.25 a | 72.97 a | 65.90 a,b | 65.53 a |
| T4 | 84.99 b,c | 85.57 b | 72.25 b | 72.49 a,b | 64.57 b,c | 64.71 a |
| T5 | 84.61 c,d | 84.27 c | 71.66 b | 71.45 b,c | 62.50 c,d | 61.69 b |
| T6 | 83.32 d | 84.03 c | 70.30 c | 71.07 c,d | 61.03 d | 61.28 b |
| T7 | 83.16 d | 83.66 c | 69.63 c | 69.87 d | 60.43 d | 60.20 b |
| Fenggeng3227 | T1 | 84.85 a | 84.63 a | 75.86 a | 75.64 a | 67.49 a | 67.54 a |
| T2 | 84.68 a,b | 84.27 a,b | 72.06 b | 75.32 a | 66.94 a | 67.15 a |
| T3 | 84.14 a,b,c | 83.98 a,b,c | 71.66 b,c | 74.98 a | 66.23 a,b | 66.87 a |
| T4 | 83.97 a,b,c | 83.57 a,b,c | 71.06 b,c | 74.47 a,b | 65.20 b | 66.19 a,b |
| T5 | 83.19 a,b,c | 83.77 a,b,c | 70.89 b,c | 73.57 b,c | 63.49 c | 64.50 b,c |
| T6 | 82.88 b,c | 83.20 b,c | 71.64 b,c | 73.17 b,c | 62.31 c,d | 64.06 c |
| T7 | 82.68 c | 82.80 c | 72.65 c | 72.96 c | 61.82 d | 62.99 c |
| Wuyungeng80 | T1 | 85.40 a | 84.82 a | 74.48 a | 73.61 a | 66.84 a | 66.66 a |
| T2 | 84.94 a | 84.69 a | 73.86 a,b | 73.30 a | 66.43 a | 65.47 a,b |
| T3 | 84.50 a,b | 83.81 b | 72.98 b,c | 72.85 a,b | 65.04 b | 64.78 b |
| T4 | 83.46 b,c | 83.53 b | 72.50 c | 72.13 a,b,c | 64.65 b | 63.92 b,c |
| T5 | 83.13 b,c | 82.91 c | 71.90 c | 71.58 b,c | 62.67 c | 62.81 c,d |
| T6 | 82.79 c | 82.43 c,d | 70.52 d | 71.04 c | 61.72 c,d | 62.61 c,d |
| T7 | 82.03 c | 82.71 d | 70.05 d | 70.95 c | 61.50 d | 61.31 d |
Table 4.
Differences in appearance quality of rice under different temperature and solar radiation conditions.
Table 4.
Differences in appearance quality of rice under different temperature and solar radiation conditions.
| Variety | Treatment | Chalky Grains (%) | Chalkiness Degree (%) |
|---|
| 2017 | 2018 | 2017 | 2018 |
|---|
| Nangeng2728 | T1 | 53.61 a | 53.89 a | 7.00 a | 6.68 a |
| T2 | 53.31 a | 53.69 a | 6.86 b | 6.36 a,b |
| T3 | 53.07 a | 48.11 b | 6.27 c | 6.03 b |
| T4 | 38.26 b | 44.89 c | 5.76 d | 5.52 c |
| T5 | 30.09 c | 44.42 c | 5.46 e | 5.24 c |
| T6 | 26.63 d | 38.00 d | 5.32 f | 4.72 d |
| T7 | 21.77 e | 29.20 e | 5.18 g | 4.46 d |
| Nangeng505 | T1 | 52.08 a | 52.44 a | 6.36 a | 8.56 a |
| T2 | 50.11 a,b | 49.80 a,b | 5.69 b | 7.73 a,b |
| T3 | 47.39 b | 47.49 b | 4.65 c | 7.22 b,c |
| T4 | 40.07 c | 41.43 c | 3.24 d | 6.44 c,d |
| T5 | 35.96 c,d | 37.96 c,d | 3.09 d | 6.14 d,e |
| T6 | 32.54 d | 35.73 d | 2.86 e | 5.67 d,e |
| T7 | 28.23 e | 26.18 e | 2.21 f | 5.30 e |
| Nangeng9108 | T1 | 46.58 a | 46.70 a | 6.46 a | 7.84 a |
| T2 | 44.95 a | 39.04 b | 5.70 b | 6.34 b |
| T3 | 30.41 c | 32.15 c | 4.40 d | 4.87 c |
| T4 | 23.39 d | 21.02 e | 3.54 e | 3.89 c |
| T5 | 28.83 c | 27.81 d | 4.06 d | 4.44 d |
| T6 | 40.24 b | 33.71 c | 5.01 c | 5.61 e |
| T7 | 42.45 a,b | 37.97 b | 5.41 b,c | 5.88 f |
| Fenggeng1606 | T1 | 36.95 a | 30.05 a | 7.43 a | 7.82 a |
| T2 | 30.16 b | 23.90 b | 6.54 b | 7.14 b |
| T3 | 20.87 c,d | 19.93 c | 4.56 d | 6.06 d,e |
| T4 | 18.38 d | 19.58 c | 3.55 e | 5.51 f |
| T5 | 20.71 c,d | 19.84 c | 4.25 d | 5.82 e,f |
| T6 | 21.80 c,d | 20.99 b,c | 5.52 c | 6.55 s,d |
| T7 | 24.97 c | 21.62 b,c | 6.21 b | 7.02 b,c |
| Fenggeng3227 | T1 | 33.89 a | 23.33 a | 6.99 a | 5.29 a |
| T2 | 28.68 b | 20.92 a,b | 5.60 b | 4.89 a,b |
| T3 | 17.32 d | 18.07 c,d | 3.94 d | 3.60 c,d |
| T4 | 14.51 d | 15.53 d | 3.18 e | 2.87 e |
| T5 | 14.91 d | 17.36 c,d | 3.55 d,e | 3.37 d,e |
| T6 | 22.05 c | 18.71 b,c | 4.53 c | 3.99 d,e,c |
| T7 | 24.61 c | 18.85 b,c | 5.47 c | 4.68 b |
| Wuyungeng80 | T1 | 33.88 a | 22.96 a | 7.32 a | 8.37 a |
| T2 | 27.50 b | 19.63 b | 6.80 b | 7.20 b |
| T3 | 16.11 d | 16.44 c | 5.20 e | 5.40 e |
| T4 | 14.27 d | 16.21 c | 4.11 g | 4.24 f |
| T5 | 14.78 d | 16.38 c | 4.79 f | 5.21 e |
| T6 | 21.90 c | 17.38 b,c | 5.65 d | 6.19 d |
| T7 | 26.44 b | 18.66 b,c | 6.26 c | 6.83 c |
Table 5.
Correlation analysis between rice quality and environmental factors at the stage from heading to maturity.
Table 5.
Correlation analysis between rice quality and environmental factors at the stage from heading to maturity.
| Type | Rice Quality | Tmean | EAT | Rmean | CSR |
|---|
| 2017 | 2018 | 2017 | 2018 | 2017 | 2018 | 2017 | 2018 |
|---|
| SMR | brown rice rate (%) | −0.939 ** | −0.933 ** | −0.909 ** | −0.938 ** | −0.716 ** | −0.867 ** | −0.538 * | −0.844 ** |
| milled rice rate (%) | −0.963 ** | −0.904 ** | −0.967 ** | −0.912 ** | −0.765 ** | −0.824 ** | −0.654 * | −0.803 ** |
| head milled rice (%) | −0.962 ** | −0.981 ** | −0.948 ** | −0.974 ** | −0.717 ** | −0.921 ** | −0.609 * | 0.853 ** |
| Chalky grains (%) | 0.924 ** | 0.943 ** | 0.921 ** | 0.945 ** | 0.690 ** | 0.881 ** | 0.568 * | 0.846 ** |
| Chalkiness degree (%) | 0.737 ** | 0.793 ** | 0.692 ** | 0.803 ** | 0.617 * | 0.716 ** | 0.440 | 0.711 ** |
| SLR | brown rice rate (%) | 0.719 ** | 0.683 ** | 0.621* | 0.628 * | 0.045 | 0.686 ** | 0.045 | 0.686 ** |
| milled rice rate (%) | 0.862 ** | 0.864 ** | 0.837 ** | 0.860 ** | 0.083 | 0.875 ** | 0.083 | 0.875 ** |
| head milled rice (%) | 0.917 ** | 0.931 ** | 0.905 ** | 0.909 ** | 0.130 | 0.931 ** | 0.130 | 0.931 ** |
| Chalky grains (%) | 0.475 | 0.456 | 0.531 | 0.494 | 0.537 * | 0.440 | 0.537* | 0.440 |
| Chalkiness degree (%) | 0.440 | 0.413 | 0.387 | 0.388 | 0.451 | 0.396 | 0.451 | 0.396 |
| LR | brown rice rate (%) | 0.962 ** | 0.927 ** | 0.964 ** | 0.932 ** | 0.369 | 0.916 ** | −0.137 | 0.706 ** |
| milled rice rate (%) | 0.881 ** | 0.675 ** | 0.895 ** | 0.642 * | 0.634 * | 0.673 ** | 0.127 | 0.423 |
| head milled rice (%) | 0.956 ** | 0.859 ** | 0.945 ** | 0.839 ** | 0.300 | 0.859 ** | −0.221 | 0.601 * |
| Chalky grains (%) | 0.553 * | 0.664 ** | 0.489 | 0.677 ** | 0.730 ** | 0.648 * | 0.114 | 0.532 |
| Chalkiness degree (%) | 0.496 | 0.352 | 0.442 | 0.369 | 0.667 ** | 0.313 | 0.119 | 0.261 |
Table 6.
Characteristics of EAT at stage from heading to maturity of good eating quality rice.
Table 6.
Characteristics of EAT at stage from heading to maturity of good eating quality rice.
| Type | SMR | SLR | LR |
|---|
| 2017 | 2018 | 2017 | 2018 | 2017 | 2018 |
|---|
| Relatively high-yield | 580.6–724.9 °C | 574.6–606.3 °C | 576.1–683.9 °C | 575.3–663.6 °C | 576.1–683.9 °C | 575.3–663.6 °C |
| GBMI | 450.3–470.4 °C | 455.4–490.6 °C | 599.6–683.9 °C | 623.8–663.6 °C | 642.0–665.9 °C | 647.3–663.6 °C |
| GBMII | 450.3–713.9 °C | 455.4–708.6 °C | 431.8–683.9 °C | 450.7–663.6 °C | 488.6–665.9 °C | 400.6–663.6 °C |
| GBAII | 488.6–508.3 °C | - | 498.1–502.2 °C | - | 518.0–528.2 °C | 499.7–520.7 °C |
| GBAIII | 488.6–654.3 °C | 455.4–560.6 °C | 498.1–609.1 °C | 491.0–566.2 °C | 519.0–607.9 °C | 499.7–606.9 °C |
Table 7.
Characteristics of Tmean at stage from heading to maturity of good eating quality rice.
Table 7.
Characteristics of Tmean at stage from heading to maturity of good eating quality rice.
| Type | SMR | SLR | LR |
|---|
| 2017 | 2018 | 2017 | 2018 | 2017 | 2018 |
|---|
| Relatively high-yield | 20.2–22.7 °C | 20.5–23.3 °C | 20.2–22.0 °C | 20.4–22.1 °C | 20.2–22.0 °C | 20.4–22.1 °C |
| GBMI | 17.7–18.1 °C | 18.1–18.8 °C | 20.6–22.0 °C | 21.3–22.1 °C | 21.4–21.9 °C | 21.8–22.1 °C |
| GBMII | 17.7–22.7 °C | 18.1–23.8 °C | 17.6–22.0 °C | 18.2–22.1 °C | 18.4–21.9 °C | 17.3–22.1 °C |
| GBAII | 18.3–18.9 °C | - | 18.7–18.9 °C | - | 19.0–19.2 °C | 19.0–19.4 °C |
| GBAIII | 18.3–21.6 °C | 18.1–20.2 °C | 18.7–20.7 °C | 18.8–20.2 °C | 19.0–20.7 °C | 19.0–21.1 °C |
Table 8.
The optimal sowing dates for rice to obtain high yield and good quality.
Table 8.
The optimal sowing dates for rice to obtain high yield and good quality.
| Year | EOS | SMR | SLR | LR |
|---|
| LOS | LOS | LOS |
|---|
| 2017 | 2018 | 2017 | 2018 | 2017 | 2018 |
|---|
| 2007 | 5/10 | 5/30 | 6/1 | 5/21 | 5/21 | 5/21 | 5/22 |
| 2008 | 5/15 | 5/31 | 6/2 | 5/21 | 5/22 | 5/21 | 5/22 |
| 2009 | 4/28 | 6/1 | 6/3 | 5/22 | 5/22 | 5/22 | 5/24 |
| 2010 | 5/14 | 6/4 | 6/7 | 5/23 | 5/24 | 5/23 | 5/25 |
| 2011 | 5/23 | 5/26 | 5/28 | - | - | - | - |
| 2012 | 4/18 | 5/30 | 6/1 | 5/18 | 5/21 | 5/18 | 5/21 |
| 2013 | 4/27 | 6/4 | 6/7 | 5/24 | 5/25 | 5/24 | 5/25 |
| 2014 | 5/6 | 5/19 | 5/21 | 5/6 | 5/8 | 5/6 | 5/8 |
| 2015 | 4/23 | 5/18 | 5/22 | 5/6 | 5/6 | 5/5 | 5/6 |
| 2016 | 4/26 | 6/1 | 6/3 | 5/18 | 5/20 | 5/18 | 5/20 |


