1. Introduction
Strawberry (
Fragaria × ananassa Duch.), a perennial herbaceous plant of the Rosaceae family, is one of the most important crops widely cultivated worldwide. China’s strawberry planting and production scale accounts for more than one-third of the global total [
1]. It is rich in antioxidants, and has a beautiful fragrance and flavor, making it widely popular among consumers [
2]. Based on the differences in photoperiod and fruiting period, strawberries can be divided into short-day and long-day types. Short-day strawberries, also known as seasonal strawberries, are sensitive to photoperiod, and grow and produce the best yields in environments with no more than 12 h of sunlight. If the light duration is too long, flower bud formation will be affected. Long-day strawberries, also called everbearing strawberries, require at least 12 h of sunlight for growth and development. At suitable temperatures, everbearing strawberries can grow and bear fruit all year round without a clear dormancy period [
3].
In recent years, global climate change has been intensifying, leading to a significant increase in extreme weather events, including extremely low temperatures, which are expected to become even more frequent in the future [
4]. Strawberries are a warm-loving crop that is highly sensitive to low temperatures. The optimal temperature range for their growth is between 15 and 25 °C [
5,
6]. Strawberry seedlings have underdeveloped growing points and new leaves, making them more vulnerable to cold snaps and low temperatures. Exposure of strawberries to excessively low temperatures on seedlings induces depolymerization of microtubules and microfilaments [
7,
8], and has a sustained impact on growth and production [
9,
10].
Photosynthesis is the most fundamental life activity of plants, serving as the fundamental source of organic matter and energy, and photosynthetic organs are the cold-sensitive parts of plants [
10,
11]. Photosynthetic parameters can be used to describe the efficiency of a plant leaf in utilizing photosynthetically active radiation (PAR) and the rate of photosynthesis [
12]. The impact of low temperature on the photosynthetic performance of thermophilic crops outweighs that on winter plants [
13]. Transient chlorophyll fluorescence induction kinetics curve (OJIP transient) and its parameters [
14,
15,
16], as well as solar-induced chlorophyll fluorescence (SIF) [
17,
18], can reveal the effects of biotic or abiotic stress on plant photosynthesis. This makes chlorophyll fluorescence, whether induced artificially or by sunlight, an important factor in assessing photosynthesis [
19] or cold tolerance diagnosis of crops [
20,
21]. Hence, these indicators can serve as non-destructive probes to reflect the photosynthetic capacity and physiological activity of plants [
22,
23].
Measuring the electrolyte leakage rate of plant tissues can quantitatively assess the extent of damage to plants under stress [
23]. Relative electrical conductivity (REC) reflects the degree of electrolyte leakage. Using the Logistic equation can fit the continuous changes in REC under different stress levels, providing information about the differences in stress tolerance among different cultivars. In practical agricultural production, however, the widespread use of this method for assessing and monitoring low-temperature stress would undoubtedly require a significant amount of time and manpower for sampling and experimentation, which could cause damage to crops and consequently affect economic benefits. Therefore, finding a method that can assess plant cell damage without the need for destructive sampling is of great significance.
To our knowledge, there are few studies that have investigated the changes in the photosynthetic physiological activity of strawberry seedlings under low-temperature stress, and no research has revealed the differences in cold resistance between short-day-type and long-day-type strawberry seedlings. Different photoperiodic strawberry varieties are suitable for growth in different seasons, which leads us to speculate that there may be differences in cold adaptation between short-day and long-day types. Thus, the study aims to investigate the variations and discrepancies in the photosynthetic physiological activity of short-day-type and long-day-type strawberry seedlings under low-temperature stress, and to establish a non-destructive diagnostic method for low-temperature stress degree during the seedling stage by key indicators derived from photosynthetic parameters and chlorophyll fluorescence characteristics.
2. Materials and Methods
2.1. Plant Materials
Different photoperiodic types of strawberry varieties widely cultivated in China were selected for the experiment, including short-day-type cultivars ‘Toyonoka’, ‘Red Face’, and long-day-type cultivars ‘Selva’, ‘Sweet Charlie’. Seedlings with 4–6 fully formed and evenly colored true leaves, sturdy petioles, and a plant height of approximately 10–13 cm were selected and transplanted into plastic pots with dimensions of 15 cm (height) × 17.5 cm (upper diameter) × 14 cm (lower diameter), one plant per pot. The pots were filled with 3 L of substrate composed of vermiculite, perlite, peat, and garden soil in a ratio of 1:1:1:3 (v:v:v:v). Low-temperature experiments were conducted 20 days after transplantation. During the cultivation period, all test seedlings were subjected to uniform water and nutrient management until the start of the low-temperature treatment. The soil was fertilized with nitrogen (urea, 46% N, 150 kg/ha), phosphorus (calcium superphosphate, 12% P2O5, 200 kg/ha), and potassium (potassium sulfate, 52% K2O, 250 kg/ha) as the basal fertilizer, without further fertilization since then. Water was supplied according to the ‘5-point sampling method’, with additional watering to saturation when the average soil moisture content reached approximately 60%. The watering was carried out between 16:00 and 18:00. Each treatment involved three strawberry plants, resulting in a total of 24 plants for each variety. A total of 96 strawberry seedlings were utilized for the four varieties with 96 separate pots.
2.2. Experimental Management and Treatment
The experiment was conducted at the Agrometeorological Experimental Station of Nanjing University of Information Science and Technology (NUIST) from October to November 2022. The strawberry seedlings were cultivated in an artificial climate chamber (PGC-FLEX, Conviron, Canada) with consistent light, temperature, and humidity. The photoperiod in the chamber was set to 12 h (7:00–19:00), and the photosynthetically active radiation (PAR) was set at 800
. The temperature and humidity in the chamber were set to simulate the hourly changes in the greenhouse microclimate in Nanjing (
Figure 1) [
24].
Seven low-temperature treatments were set to a continuous −20, −15, −10, −5, 0, 5, and 10 °C, with 20 °C as the control (CK). The treatments followed the photoperiod, with a duration of 12.5/11.5 h dark/light. The plants were moved into low-temperature incubator at 18:30 and taken out at the next 7:00. Due to limitations in observed variables and sample size, only two strawberry varieties could be treated at a time for low-temperature treatments, alternating between ‘Toyonoka’ and ‘Selva’ or ‘Red Face’ and ‘Sweet Charlie’. Six plants (pots) were treated in each batch, and a total of 16 batches of stress treatments were conducted under controlled conditions. After stress treatment, plants were given a 2 h recovery period in the climate chamber to allow for acclimation to the environment. Observations began at 9:00 am, and the parameters of photosynthesis, transient chlorophyll fluorescence induction kinetics curve (OJIP transient), solar-induced chlorophyll fluorescence (SIF), and relative electrical conductivity (REC) were sequentially measured. Each observation was repeated using three plants per treatment.
2.3. The Methods of Measurement
2.3.1. Semi-Lethal Temperature
Semi-lethal temperature (LT
50) was calculated using the Logistic equation based on REC of strawberry leaves. Two to three healthy functional leaves were selected per plant, wiped clean with deionized water, the main and secondary veins removed, and cut into pieces (d ≤ 0 mm). Weigh 1.5 g of chopped leaves and place them into a 25 mL conical flask. Add 20 mL of deionized water to the flask and vacuum the mixture for 20 min until the leaves settle at the bottom. The conductivity value C
1 was measured using a conductivity meter (DDS-307A, INESA, CHN). Then, the conical flask was placed in a constant temperature water bath with boiling water for 15 min, and the conductivity value C
2 was recorded after it cooled down. REC was calculated using the following Equation (1).
In the equation, C1 represents the REC at environment temperature of 20 °C; C2 represents the REC after high-temperature water bath.
The general form of the Logistic equation is shown in Equation (2), where K is the saturation parameter of y, which, in this study, is REC and has a value of 100. The parameters a and b at the inflection point of the equation were calculated according to the method of Otieno et al. [
25]. Then, LT
50 can be calculated based on Equation (3).
In the equation, y represents the value of REC; x represents the temperature of cold treatment.
2.3.2. Photosynthetic Parameters
Photosynthetic characteristics were measured using portable photosynthesis system (Li-6400xt, LI-COR, USA) from 9:00 to 12:00 by measuring the center leaf of the second or third healthy functional leaf from the top of the tested plant [
26]. The instrument was set with a flow rate of 500
, leaf chamber temperature and humidity were set at 25 °C and 65%, and the reference chamber CO
2 concentration was set at 400
. The PAR gradient was set as 0, 20, 50, 100, 150, 200, 400, 600, 800, 1000, 1200, 1400, 1600, and 1800
. Photosynthetic parameters were recorded by Li-6400xt automatically, including net photosynthetic rate (
), stomatal conductance (
), intercellular
concentration (
), and atmospheric
concentration (
) and others. Water-use efficiency (WUE) and stomatal limitation (
) were calculated based on Equations (4) and (5), respectively [
27]. The maximum net photosynthetic rate (
) and apparent quantum yield (AQE) were obtained by fitting the light response curve using photosynthetic model [
28].
In the equation, represents the transpiration rate.
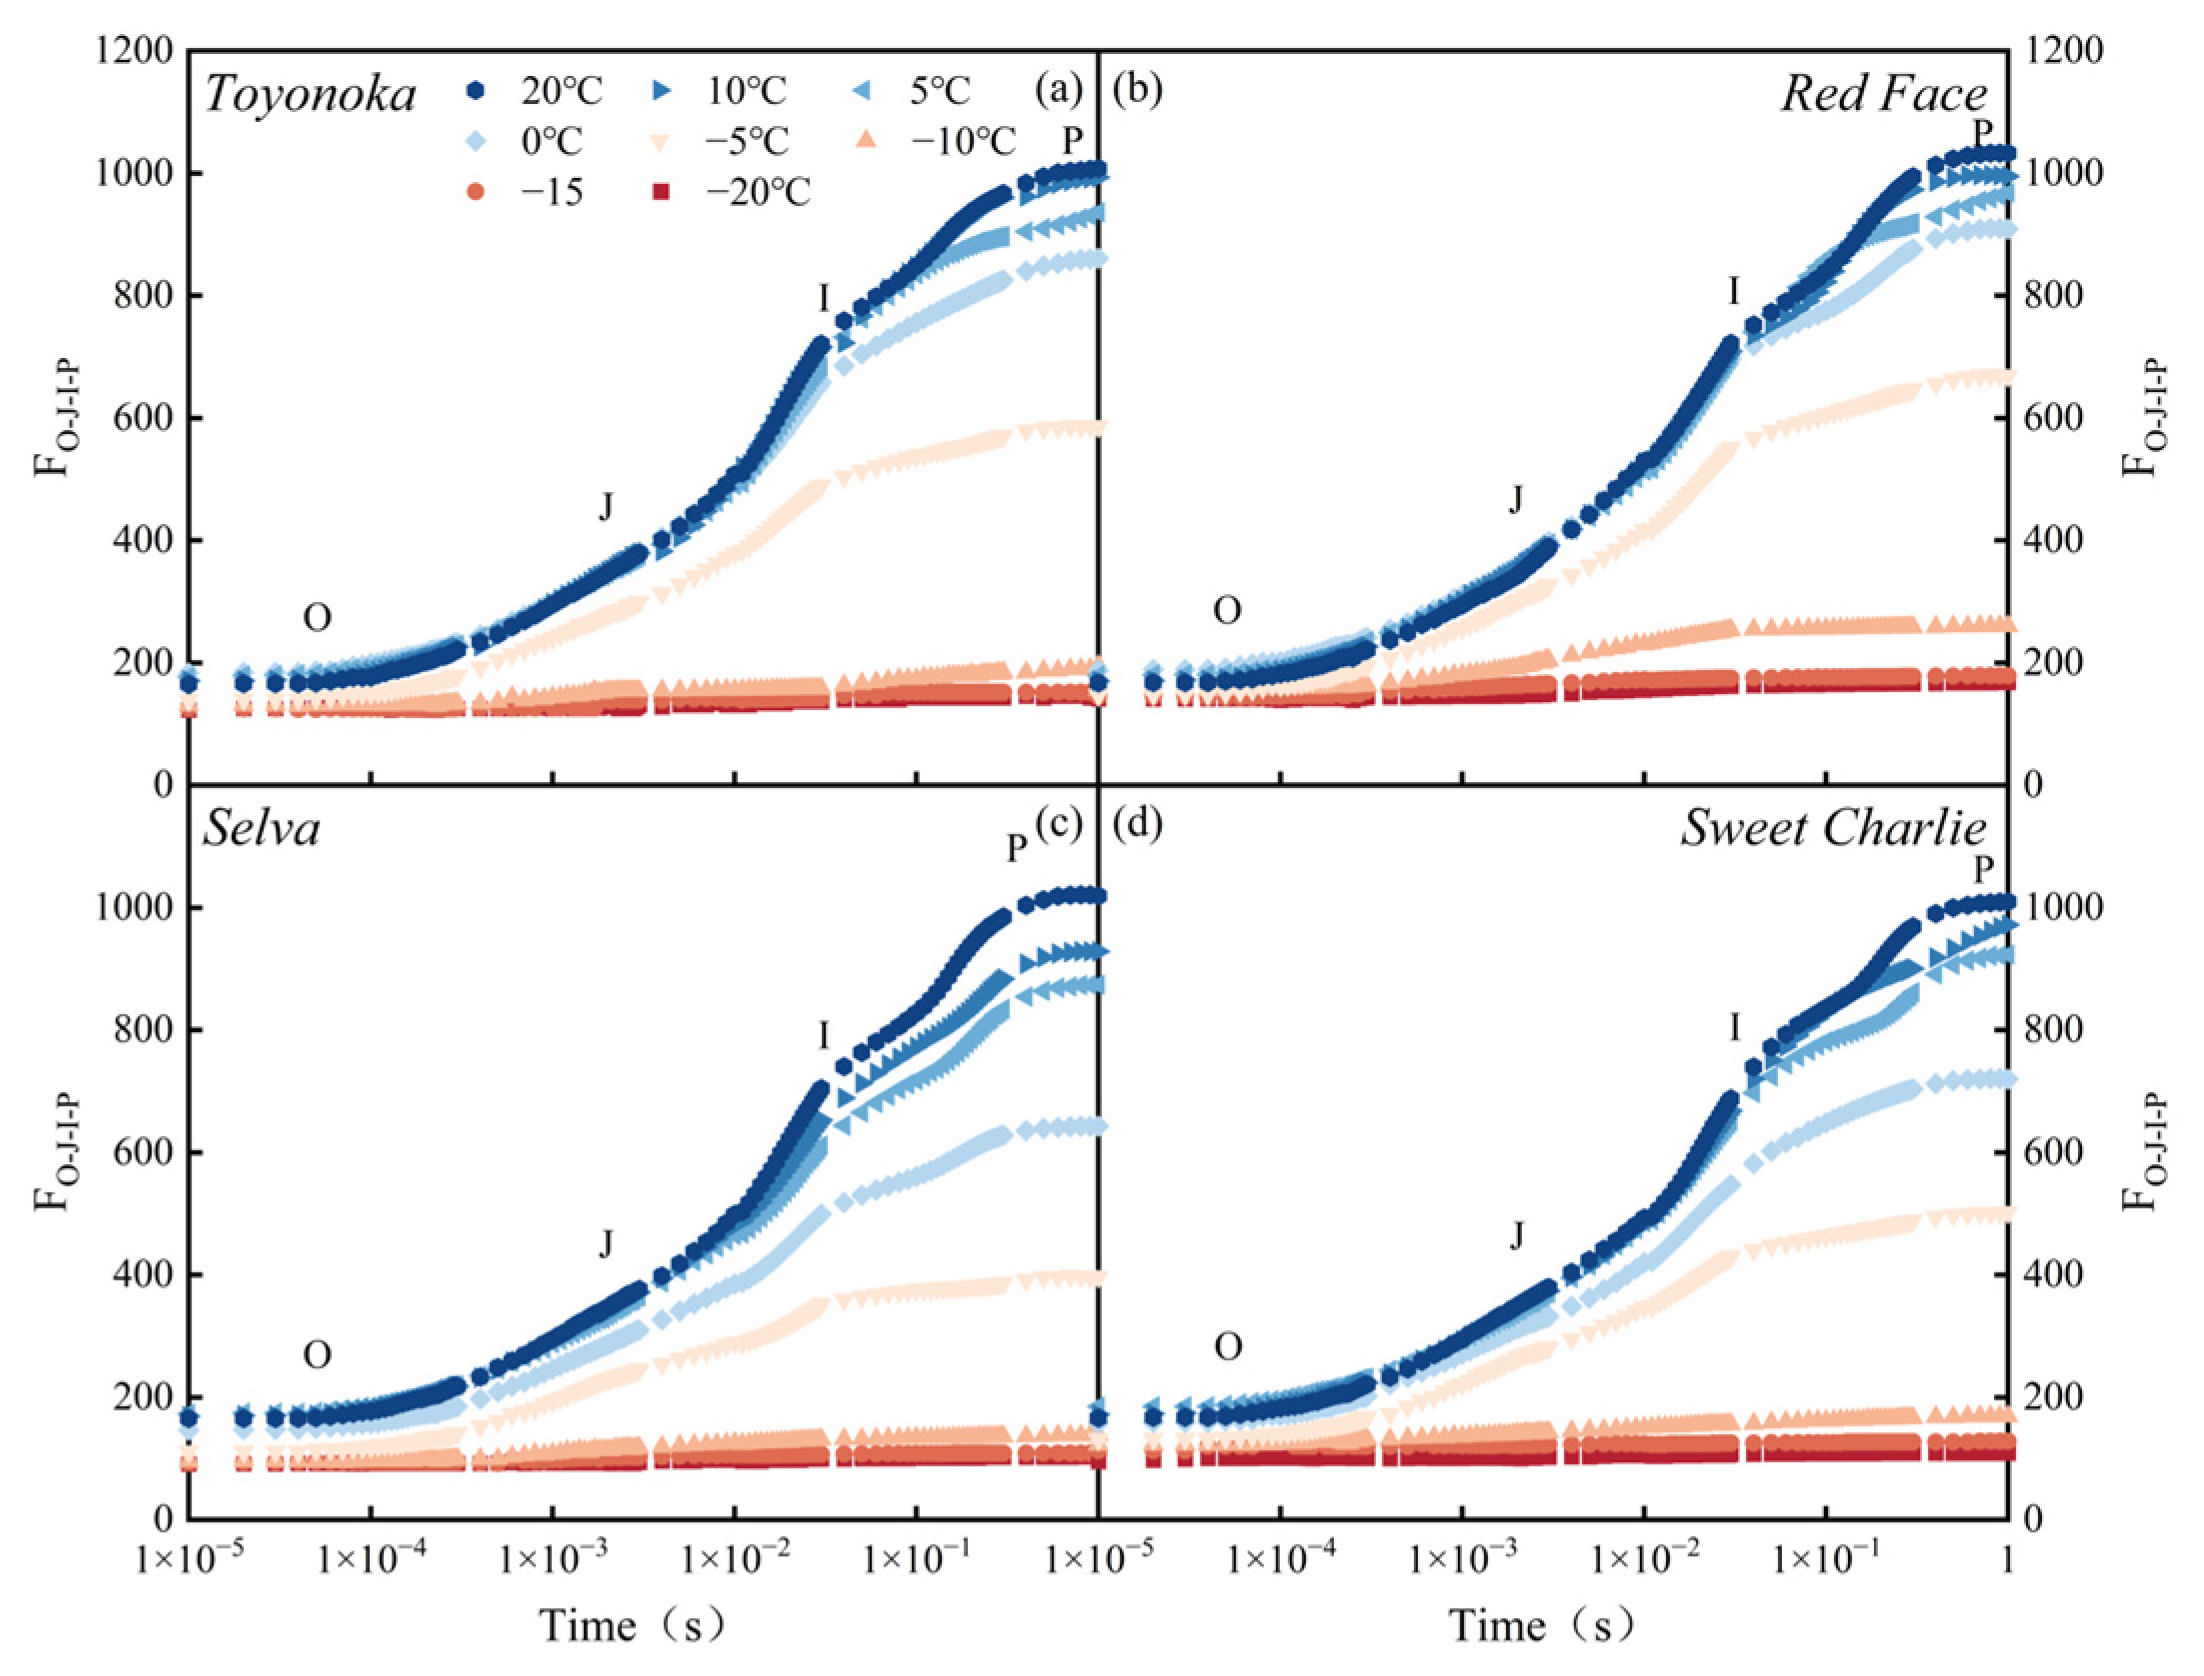
2.3.3. Transient Chlorophyll Fluorescence Induction Kinetics
Plant Efficiency Analyzer (Pocket PEA, Hansatech, UK) was used to measure the transient chlorophyll fluorescence induction kinetics curves (OJIP transient) of strawberry leaves from 9:00 to 11:00. The saturating pulse intensity and actinic light intensity were set at 3000 and 200 . The saturation pulse intensity was set at 3000 with a duration of 1s. The actinic light intensity was set at 200 with a duration of 9s. Each single-point measurement lasted for 210 s, with alternating saturation pulse and actinic light every 10 s in each cycle. We selected the central leaflet of the 2nd, 3rd, and 4th healthy functional leaves, from top to bottom, of each plant for measurement after 30 min’s dark adaptation. The measuring points of one leaf were located on both sides of the midrib using clips, and the other two measuring one side of the midrib.
The OJIP transient contains abundant information that reflects the photochemical reaction state of the PSII reaction center.
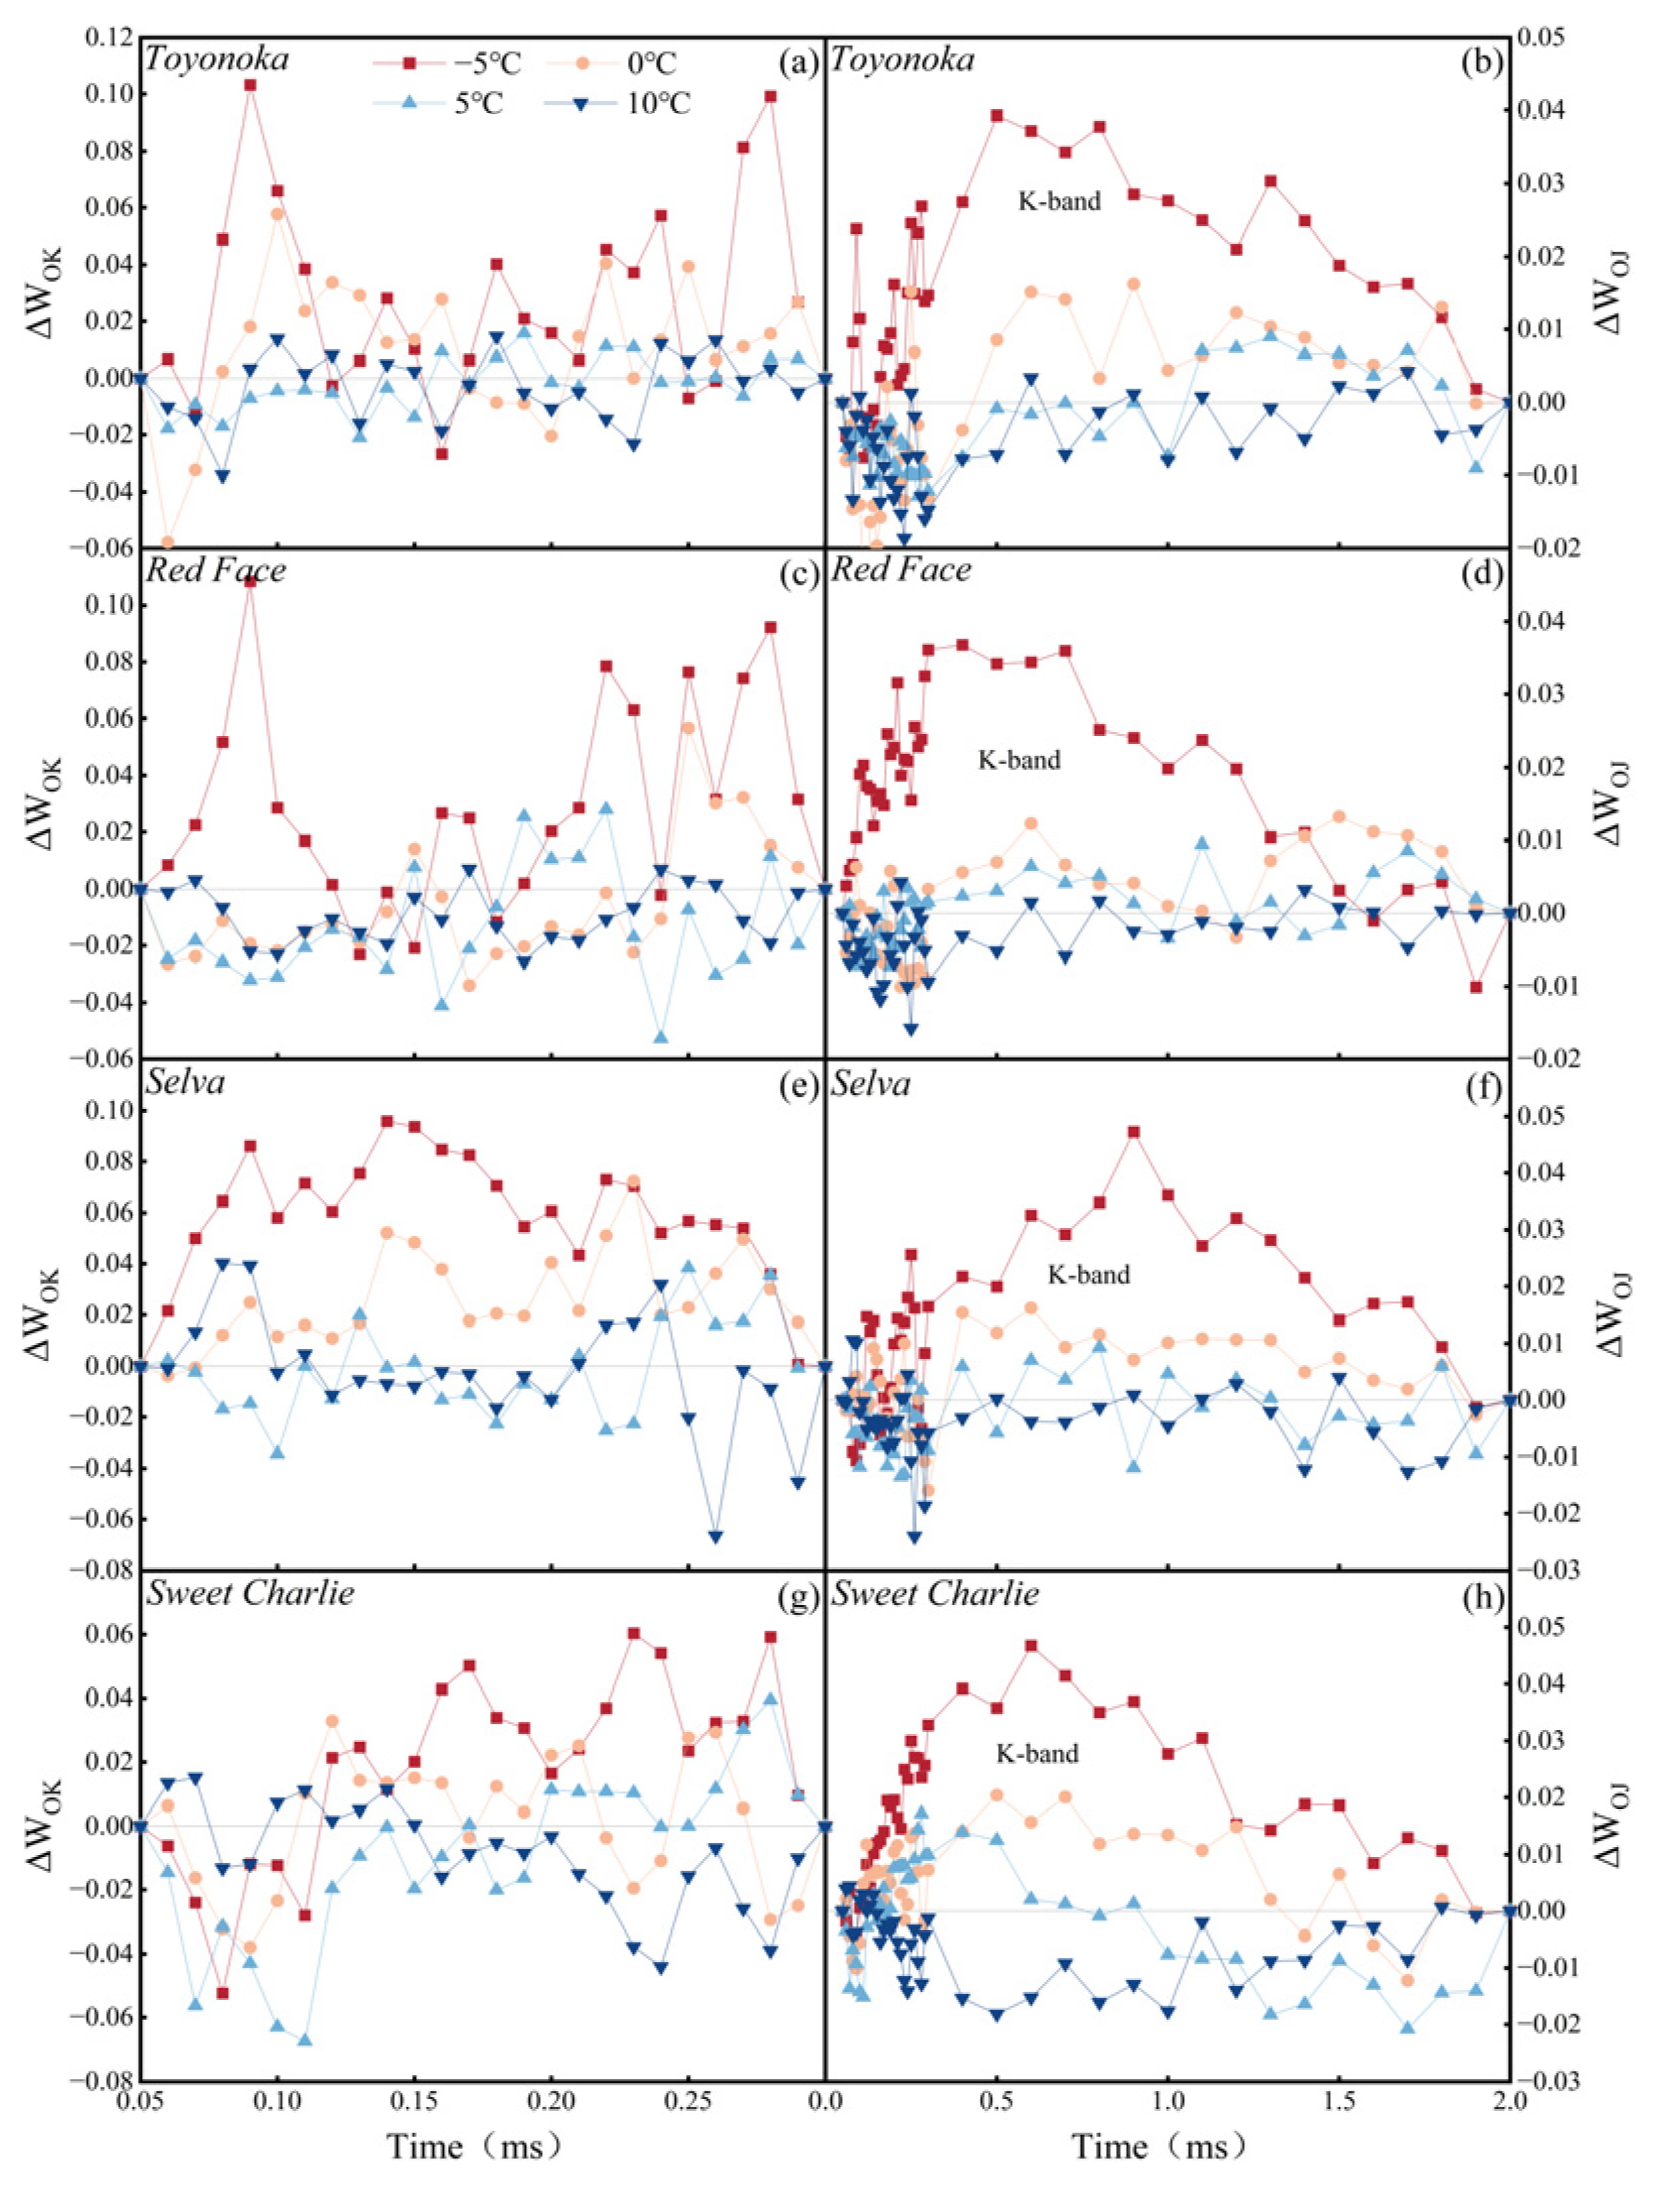
The relative standardization of OJIP transient (ΔW) represents the difference between two phases on the OJIP transient and CK. The calculation methods of ΔW for the O-K and O-J phases are shown in Equations (6) and (7). In this study, CK refers to 20 °C.
In the equation, and represent ΔW on O-K and O-J phase; and represent the fluorescence value (F) at one certain moment and minimum F; and represent the F at the J and K phase.
JIP-test [
28] based on the energy flow through the photosynthetic membrane to analyze the measured chlorophyll fluorescence data. The JIP-test indices and terminology mentioned in this paper are presented in
Table 1 [
16,
29].
2.3.4. Solar-Induced Chlorophyll Fluorescence
Fluorescence radiance spectra were measured using fiber optic spectrometer (QE65 Pro, Ocean Optics, USA) from 11:00 to 12:00. The spectral resolution of the spectrometer is 1.4 nm, and spectral range from 645 to 800 nm. A 45° limiting device was used to fix the angle between the sun and the fiber optic probe. Whiteboard calibration was performed prior to data collection, radiance of whiteboard and leaves were sequentially recorded, consistent with the observation site for OJIP transient observation. Each measurement was repeated twice.
We adopted the absolute SIF (aFSR) algorithm proposed by Zhao et al. [
30] to reconstruct the solar-induced chlorophyll fluorescence (SIF) spectrum. aFSR involves collecting the chlorophyll fluorescence radiation within the absorption band and using singular value decomposition (SVD) to obtain the principal components of the complete and continuous SIF spectrum based on the fluorescence radiance simulated by the SCOPE [
31]. Compared with other SIF inversion algorithms such as FLD [
32,
33] and SFM [
34], aFSR not only reflects the bimodal characteristics of SIF but also reconstructs the continuous SIF spectrum. The SIF information reconstructed by aFSR is absolute SIF (aSIF), which includes information from solar irradiance. To mitigate the unstable influence of the irradiance, the study also calculated relative SIF (rSIF), as shown in Equation (8).
In the equation, E represents the solar irradiance.
2.4. Statistical and Analytical Methods
IBM SPSS 24 (SPSS, IL, USA) was utilized for one-way ANOVA, Duncan’s multiple comparisons (
p = 0.05), and principal component analysis (PCA). Experimental data were presented in ‘mean ± standard deviation (SD)’ format. PCA is a core method for building minimal data sets. It reduces the dimensionality of data and extracts the main features, transforming multiple indicators into a few indicators. This method reduces the correlation between different indicators and makes them independent of each other [
35]. Mean-centered standardized distance (MCSD) was one of the methods used in this study to extract diagnostic indicators of low-temperature stress in strawberry seedlings, with its calculation method shown in Equation (9).
In the equation, D represents the MCSD between two density functions; and represent the means of one parameter under two levels of low-temperature stress; and represent the SD of one parameter under two levels of low-temperature stress.
The model evaluation indicators used in this study were coefficient of determination (R
2), root-mean-square error (RMSE), and accuracy (Acc), as shown in Equations (10)–(12).
In the equation, represents the predicted value; represents the actual value; represents the mean value; n represents the number of validation samples; represents the number of correctly predicted validation samples.
2.5. Stress Diagnosis Comparative Models
Three types of machine learning models, multi-layer perceptron (MLP) [
36], random forest (RF) [
37], and support vector machine (SVM) [
38], as well as multiple linear regression (MLR) [
36] were used to evaluate the performance differences in different input data for strawberry seedlings low-temperature stress diagnosis applications. In this study, MLP was configured with 5 hidden layers, including 2 layers of 12 neurons, 2 layers of 24 neurons, and 1 layer of 6 neurons. The Relu function was used for activation, and the dropout layer was added before the fully connected layer to prevent overfitting. The model was trained for 3000 iterations. The number of trees in the RF was set to 100. The SVM model used the Linear kernel function with a Gamma value of 0.25.
4. Discussion
The physiological effects of low-temperature stress on plants depend on their own cold tolerance, growth stage, and exposure, as well as the intensity and duration of the low-temperature stress. [
41]. Seedlings have weaker resistance to low temperatures during different growth stages. Low-temperature stress during the seedling stage can have adverse and far-reaching effects on crop growth, development, and yield quality [
42]. This study investigated the low-temperature tolerance differences among strawberry varieties of different photoperiod types, under identical conditions controlling for plant growth stage, exposure, and duration, using continuous low-temperature gradients. The study proposed sensitive diagnostic indicators and methods for low-temperature stress diagnosis during the strawberry seedling stage. The results of this study may provide theoretical support for the strawberry industry in different climatic regions. In areas with lower temperatures, short-day-type, seasonal strawberries may be more suitable for cultivation, while long-day-type, everbearing cultivars require reliable insulation measures. If strawberries have already been subjected to low-temperature stress, the diagnostic methods proposed in this study can assess the degree of strawberry damage without causing further harm and allow for timely remedial actions to minimize losses.
Low temperature primarily affects plant damage at the cellular membrane level, leading to a loss or reduction in selective permeability, and resulting in electrolyte leakage such as K+ and amino acids. The plasma membrane is considered the main site of injury in plant cells exposed to extracellular freezing [
43]. Measuring the relative electrical conductivity (REC) of strawberry leaves reflects the degree of electrolyte leakage and reveals the level of plant damage under low-temperature stress. This study found that the relative electrical conductivity (REC) of strawberry leaves ranged from 20% to 85%. Between 0 and −10 °C, the cell membrane lipids of four strawberry varieties changed from the liquid crystalline phase to the gel phase, resulting in the disorder-to-order rearrangement of fatty acid chains and consequent cracking of the cell membrane [
44]. The electrolyte leakage no longer significantly increased when the temperature dropped to −15 °C or lower. In this case, severe structural damage appeared in the leaves, with the degree of plasma membrane damage reaching a maximum and photosynthetic activity almost completely lost. This is consistent with the conclusion reached by Maughan et al. [
45] after summarizing a large number of low-temperature stress experiments on strawberries, namely that unprotected strawberry plants suffer severe damage at −9 °C and die at −12 °C. We also noted that the low-temperature semi-lethal threshold (LT
50) for ‘Selva’ strawberries was measured at −16.4 °C in one study [
46], which is likely due to insufficient treatment time. The shorter the duration of low-temperature stress, the less impact it has on plants, which may lead to a lower calculated LT
50 value.
In terms of photosynthetic parameters, Gs and Pn
max are more sensitive indicators of sub-low temperature stress than WUE, Ls, and AQE. The study found that WUE first increased and then decreased as temperature decreased, with the highest WUE for short-day-type and long-day-type strawberries occurring at 5 °C and 10 °C, respectively. This may be due to the fact that water consumption per unit of time by plants decreases in sub-low temperature environments, leading to an increase in WUE. Combining Ci and Ls analysis can effectively determine whether the reduction in plant photosynthetic capacity is due to stomatal limitation or non-stomatal limitation factors [
47]. We found the decrease in Pn
max during the entire cooling process occurred due to both stomatal and non-stomatal factors. Ci continued to decrease during the cooling process that did not fall below 0 °C, while Ls showed the opposite trend, indicating that the decrease in photosynthetic rate caused by temperatures above 0 °C is due to stomatal factors. When the temperature further decreased, Ci increased significantly at −5 °C, while Ls decreased significantly, indicating that the influence of temperatures below 0 °C on photosynthesis is due to non-stomatal factors, such as RuBP carboxylation limitation and photochemical activity limitation, which hinder CO
2 utilization and lead to an accumulation of intercellular CO
2 [
48].
Transient chlorophyll fluorescence induction kinetics curve (OJIP transient) characteristics of four tested strawberry varieties revealed that the energy transfer of the PSII reaction center and OEC activity in different photoperiod types of strawberry will not be negatively affected in a sub-low temperature environment not lower than 5 °C. Short-day-type strawberries exhibit stress characteristics at lower temperatures compared to long-day-type varieties. In terms of monitoring the stress of performance parameters of the PSII reaction center, it was found that in sub-low temperature environments, ABS/RC and TR
0/RC first increased and then decreased with decreasing temperature, while ET
0/RC showed an overall decreasing trend. The increase in TR
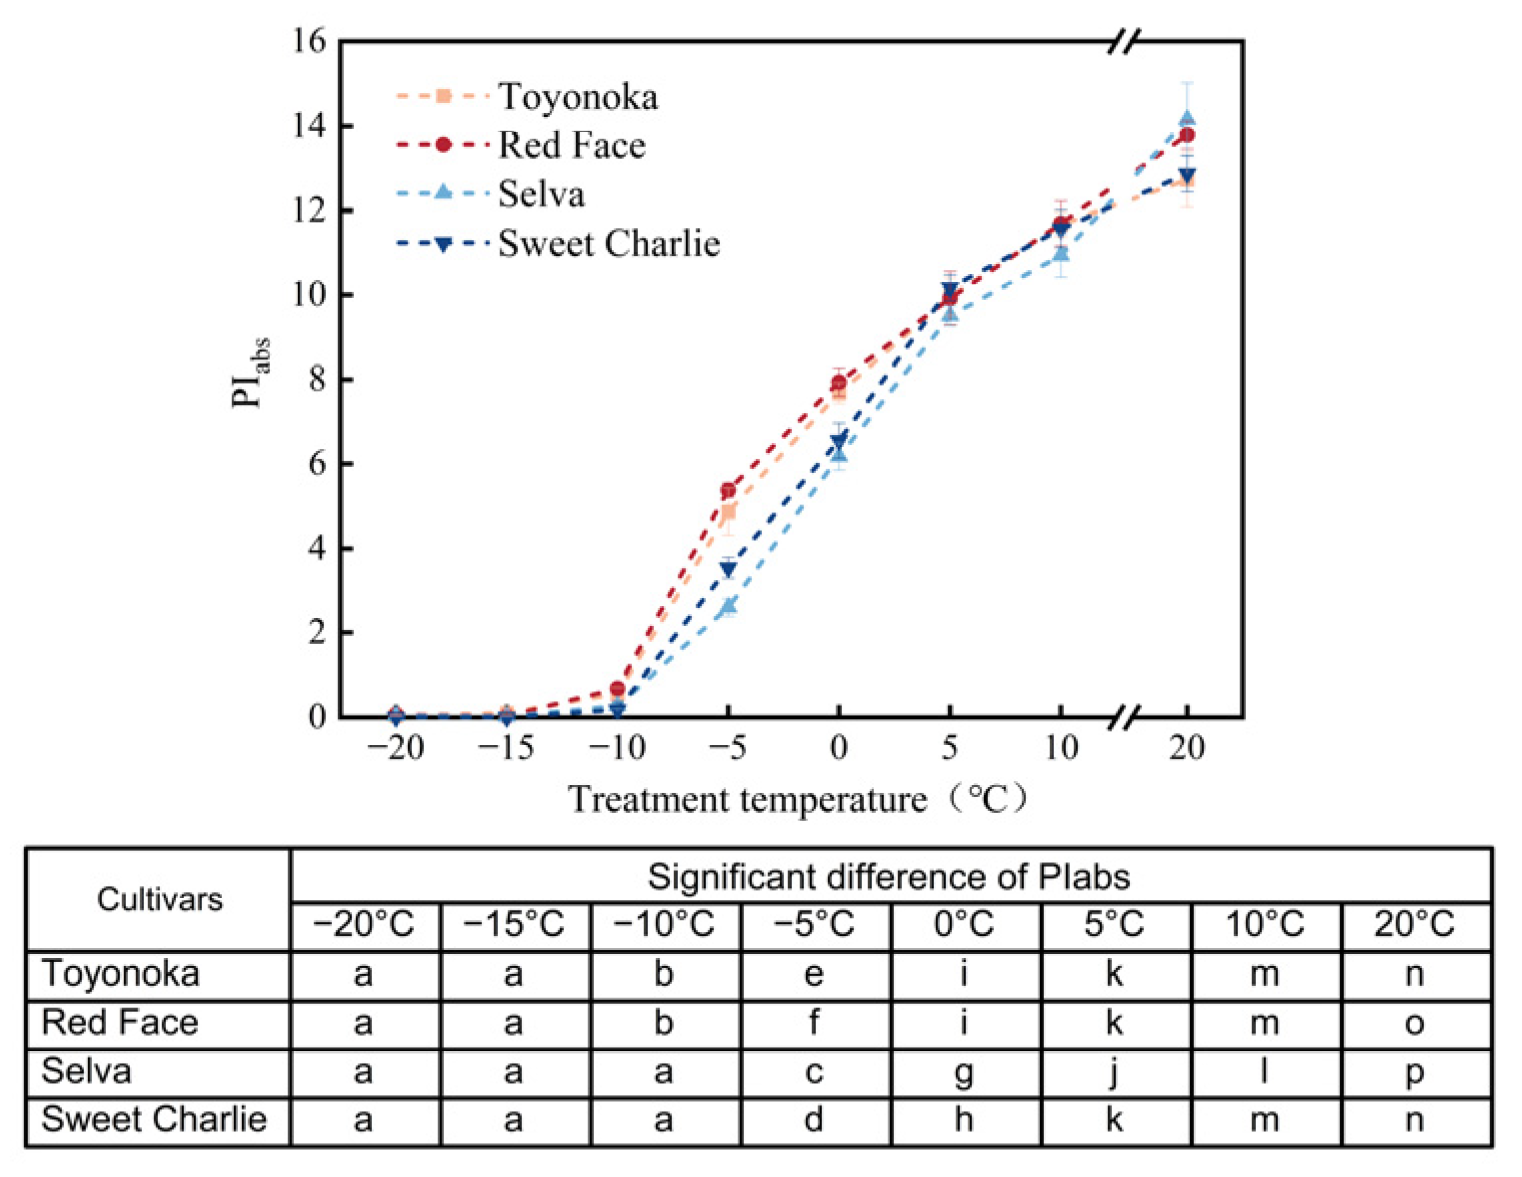
0/RC was lower than that in ABS/RC, and the temperature at which it reached its peak was also higher. It indicated that the ability to capture energy was less than the energy absorbed by the reaction center, but the absorbed light energy could not be used to promote electron transfer, leading to insufficient energy to maintain photosynthesis, forming an ‘energy trap’. PI
abs is an important indicator for evaluating the efficiency of photosynthetic reactions and reflecting the impact of stress on photosynthetic structures [
49]. In a study of 30 soybean varieties, Strauss et al. [
50] pointed out that PI
abs can not only reflect the differences in cold resistance between different varieties, but also characterize the differences in the ability of reaction centers to absorb light energy. The performance of PI
abs in this study confirms this conclusion. PI
abs not only performs well in distinguishing stress levels, but also reflects the differences between short-day-type and long-day-type strawberries under low-temperature stress. Compared with long-day-type strawberries, the PI
abs of short-day-type cultivars decreases more slowly under low-temperature stress, indicating a stronger adaptation to low temperatures.
This study innovatively introduced solar-induced chlorophyll fluorescence (SIF) into the leaf-scale diagnosis of cold stress. SIF has the advantage of not requiring artificial light sources and is suitable for the non-destructive detection of plant photosynthetic physiological changes in natural environments. Recently, researchers have used SIF satellite inversion data to estimate vegetation productivity [
51], potential evapotranspiration [
52], and drought severity [
53], and some studies have quantitatively calculated SIF for diseases [
18] and chlorophyll content [
16] at the leaf scale, but few researchers to date have explored SIF changes in plants under different degrees of low-temperature stress. In this study, SIF was used as the third type of data for low-temperature stress diagnosis, in conjunction with photosynthetic parameters and transient chlorophyll fluorescence parameters. SIF’s potential for stress diagnosis at the leaf scale was investigated based on its absolute and relative spectral features. The results showed that the combination of aSIF
742 and rSIF
760 was the best match for differentiating low-temperature stress levels using SIF data. It is worth noting that different batches of samples observed under varying solar irradiance could affect absolute SIF, but this did not appear to affect its status as an important factor for diagnosing strawberry cold damage.
Distinguishing adjacent levels of low-temperature stress is crucial but challenging, as physiological indicators of plants tend to be similar and often overlap. Compared to principal component analysis (PCA), mean-centered standardized distance (MCSD) focuses on differences between samples, resulting in less redundant information and better performance in distinguishing low-temperature stress levels. While feature indicators selected by PCA are less diagnostic than distance characteristic parameters (DCPs) for low-temperature stress levels, they are still significantly better than using one single type of data. Although the parameters of photosynthesis, transient chlorophyll fluorescence, and SIF all describe plant light performance, the information they provide is not entirely redundant and still has complementary space. In addition, the combination of different types of parameters can effectively avoid the randomness that may exist when using a single type of data. This research combines the decision trees model with DCPs. Although decision tree is a classic classification method in geosciences, their characteristic of sequential judgment based on key indicators and step-by-step screening is similar to the relationship between plant physiological indicators and stress levels. This has led to the development of a non-destructive diagnostic procedure for low-temperature stress with plant physiological significance in a concise and clear manner.
The conclusions of this study are based on short-day-type strawberry cultivars ‘Toyonoka’ and ‘Red Face’, and long-day-type varieties ‘Selva’ and ‘Sweet Charlie’. Whether the low-temperature resistance of other strawberry cultivars matches the patterns summarized in this study or if the threshold values of the low-temperature stress diagnosis model for strawberry seedlings need to be further adjusted and optimized, will require additional stress experiments with more strawberry cultivars and samples in the future.
5. Conclusions
Under 12 h, low-temperature stress of varying degrees, the short-day-type strawberries represented by ‘Toyonoka’ and ‘Red Face’ exhibited better tolerance to low temperatures during the seedling stage than the long-day-type varieties represented by ‘Selva’ and ‘Sweet Charlie’. This was reflected in terms of cell damage and photosynthetic activity. The semi-lethal temperatures for ‘Toyonoka’, ‘Red Face’, ‘Selva’, and ‘Sweet Charlie’ were −5.48 °C, −7.67 °C, −2.13 °C, and −3.38 °C, respectively. The cold resistance of the four strawberry cultivars ranked from strong to weak is ‘Red Face’, ‘Toyonoka’, ‘Sweet Charlie’, and ‘Selva’. Strawberries of different photoperiodic types start experiencing low-temperature stress at temperatures below 5 °C and all suffer severe damage when exposed to temperatures within the range of 0 to −10 °C. Short-day cultivars have a lower critical temperature for low-temperature damage than long-day cultivars. The photosynthetic performance of long-day-type strawberries begins to decline significantly at 0 °C, while the photosynthetic ability of the short-day-type cultivars only significantly decreases at −5 °C. When the temperature drops to −10 °C, the physiological activity of different photoperiod types of strawberries is almost completely lost.
Mean-centered standardized distance is a good method for extracting indicators of stress level distinguishability. Ci, AQE, φR0, PIabs, aSIF742, and rSIF760 showed great ability to distinguish different levels of low-temperature stress, and combining different physiological parameters is more comprehensive in describing the stress state of vegetation than relying solely on single indices of a certain type. Based on the above, the study constructed a non-destructive diagnosis decision tree model and established five non-destructive diagnosis formulas for low-temperature stress on strawberry seedlings. This study provides scientific references and a decision-making approach for the selection of strawberry cultivars, as well as the prevention and non-destructive diagnosis of low-temperature stress during the seedling stage in practical production.
In future work, we plan to expand the number and variety of strawberry cultivars studied, investigate the physiological significance between different types of non-destructive stress diagnostic indicators, and further enrich the knowledge regarding low-temperature stress on strawberry seedlings based on this study.


