1. Introduction
The global population is growing, requiring food production to be increased 50% to 70% higher by 2050 in order to meet population needs [
1]. Additionally, the growing demand in biofuels over the years [
2] has led to higher interest in increasing crop production. Weather conditions such as rainfall, solar radiation (sunlight), daylight, and night temperatures, together with management practices such as population density, availability of nutrients and irrigation, and proper tillage method can have favorable results in increasing crop yields.
Maize (
Zea mays) is one of the world’s most highly produced crops and one of the most important crops in the U.S.A. [
3]. It is used for human consumption, livestock feed, and biofuel production, especially maize-based ethanol [
2]. However, it is vulnerable to water, nutrient, and sunlight stresses. Any shortage of sunlight, from full canopy through the reproductive period, is potentially limiting to maize yield [
4]. According to Pioneer, cloudy, rainy periods during susceptible stages of maize development can have significant effects on yield because the photosynthetically active radiation (PAR), which is the portion of the solar radiation spectrum that plants can use (43% to 50% of the total solar radiation) is reduced proportionately to cloud cover [
4]. A research conducted in California and Kentucky, USA, during the 1969 and 1970 growing seasons testing the sunlight and temperature effects in maize yield, showed that locations with high sunlight, high daylight temperatures and low night temperatures had higher yield results than locations with low sunlight, daylight temperatures and high night temperatures [
5]. Night temperatures above the average accelerate the phenological development and, during reproductive stages, can reduce kernel number and kernel weight, resulting in lower yields [
6].
Water stress can influence maize developmental and physiological processes resulting in reduced biomass and consequently yield, due to a reduced number of kernels per ear or kernel weight [
7,
8]. Consequently, proper irrigation should be applied to avoid some of the stresses that limit yield potential. Although irrigation is one of the most important uses of water in agriculture and a key tool in managing maize production, it should be used wisely. Globally the highest amount of fresh water (70%) is used for irrigation in agriculture [
9] while the total irrigation withdrawals were 446,678,592,400 L/day (118,000 Mgal/day) in the United States during 2015, which can be translated to 42% of total freshwater withdrawals [
10]. According to the United States Geological Survey (USGS) [
11], only half of the irrigated water is returnable through the ground or streams. The main irrigation issue that needs to be addressed is finding ways to increase agricultural production while using less water, making irrigation efficiency crucial [
12]. For increasing the irrigation efficiency, a scheduling method meaning a process of deciding the time and amount of water to be applied should be followed. The choice of the irrigation scheduling method depends on the objectives of the irrigator and the capabilities of the irrigation system [
13] and they can be classified as plant-based, soil-based, climate-based, or combination [
14]. Instruments and tools assisting in irrigation scheduling includes soil moisture sensors, weather stations, crop water use estimators, daily soil water balance checkbook worksheets, and software programs for estimating daily soil water balance [
15].
A water balance method or checkbook method is the simplest way of scheduling irrigation. It estimates the soil water balance by measuring the amount of water that infiltrates the soil through irrigation or rainfall and the amount of water that is used by plants and evaporation. An example of a water balance method is the UGA Checkbook method found by Harrison and Lee (2007) for maize in Georgia, which was developed from a historical average of evapotranspiration [
16]. Water balance are cost-effective methods because they do not require purchase of equipment and tools and do not require fieldwork [
17]. However, the checkbook method might include challenging calculations and the irrigator should pay a close attention to the weather conditions [
17]. The use of soil moisture sensors is another method for scheduling irrigation. The data from the sensors can be used for taking proper decisions about the time and the amount of water that needs to be applied based on the soil conditions. A detailed description of the University of Georgia smart sensor array (UGA SSA) system was presented by Vellidis et al. [
18]. Some notable characteristics and advantages of the system are the use of mesh networks for the communication of the irrigation sensor nodes, the system does not need calibration meaning that it can be used in any type of soil, the design of the antenna which allows field equipment such as sprayers to pass over the sensors and its low cost [
18]. Several studies have shown that one of the most important factors for increasing maize yield is by optimizing plant population density (total number of plants present in an area of land (plants/ha)), which is related to water availability [
19,
20,
21]. In many cases, farmers favor planting maize in high plant densities for pursuing high maize yields [
22] even if there is possibility of interplant competition, particularly for light, water, and nutrients [
23,
24], which affects maize growth [
25].
Another important factor for increasing maize yield that should be addressed is the tillage method. Conventional tillage usually involves turning the whole of the topsoil. By employing conventional tillage, it is possible to accelerate the organic matter break-down due to soil inversion and thereby soil aeriation is increased. Until recently, conventional tillage was the common practice in many fields as a means of mechanical weed control. However, this is not the only reason that tillage is important. In a long-term tillage study, it was found that it is possible to conserve soil moisture and reduce evaporation by following a no till method in comparison to conventional tillage [
26]. Moreover, conservation tillage practices have the potential for improving root penetration, minimizing erosion, enhancing water infiltration and overall yield [
27]. Strip tillage and no tillage can have favorable results in maize yield and water productivity (grain yield/crop water use) and can be used especially in areas that water is limited [
28].
The goal of this study was to evaluate the water requirements of different maize population densities and tillage methods, based on soil moisture data collected by soil moisture sensors installed at different depths in the field. Two irrigation scheduling methods were implemented. One of them was the checkbook method, which is based on historical evapotranspiration data, while the other one was the sensor-based method, in which each treatment was irrigated accordingly based on daily Soil Water Tension (SWT) data collected by the soil moisture sensors. The treatments consisted of four plant densities, 69K, 88K, 99K, and 133K plants/ha, and two tillage methods, conservation (strip tillage) and conventional. The different irrigation methods were correlated to yield data collected at the end of each growing season.
2. Materials and Methods
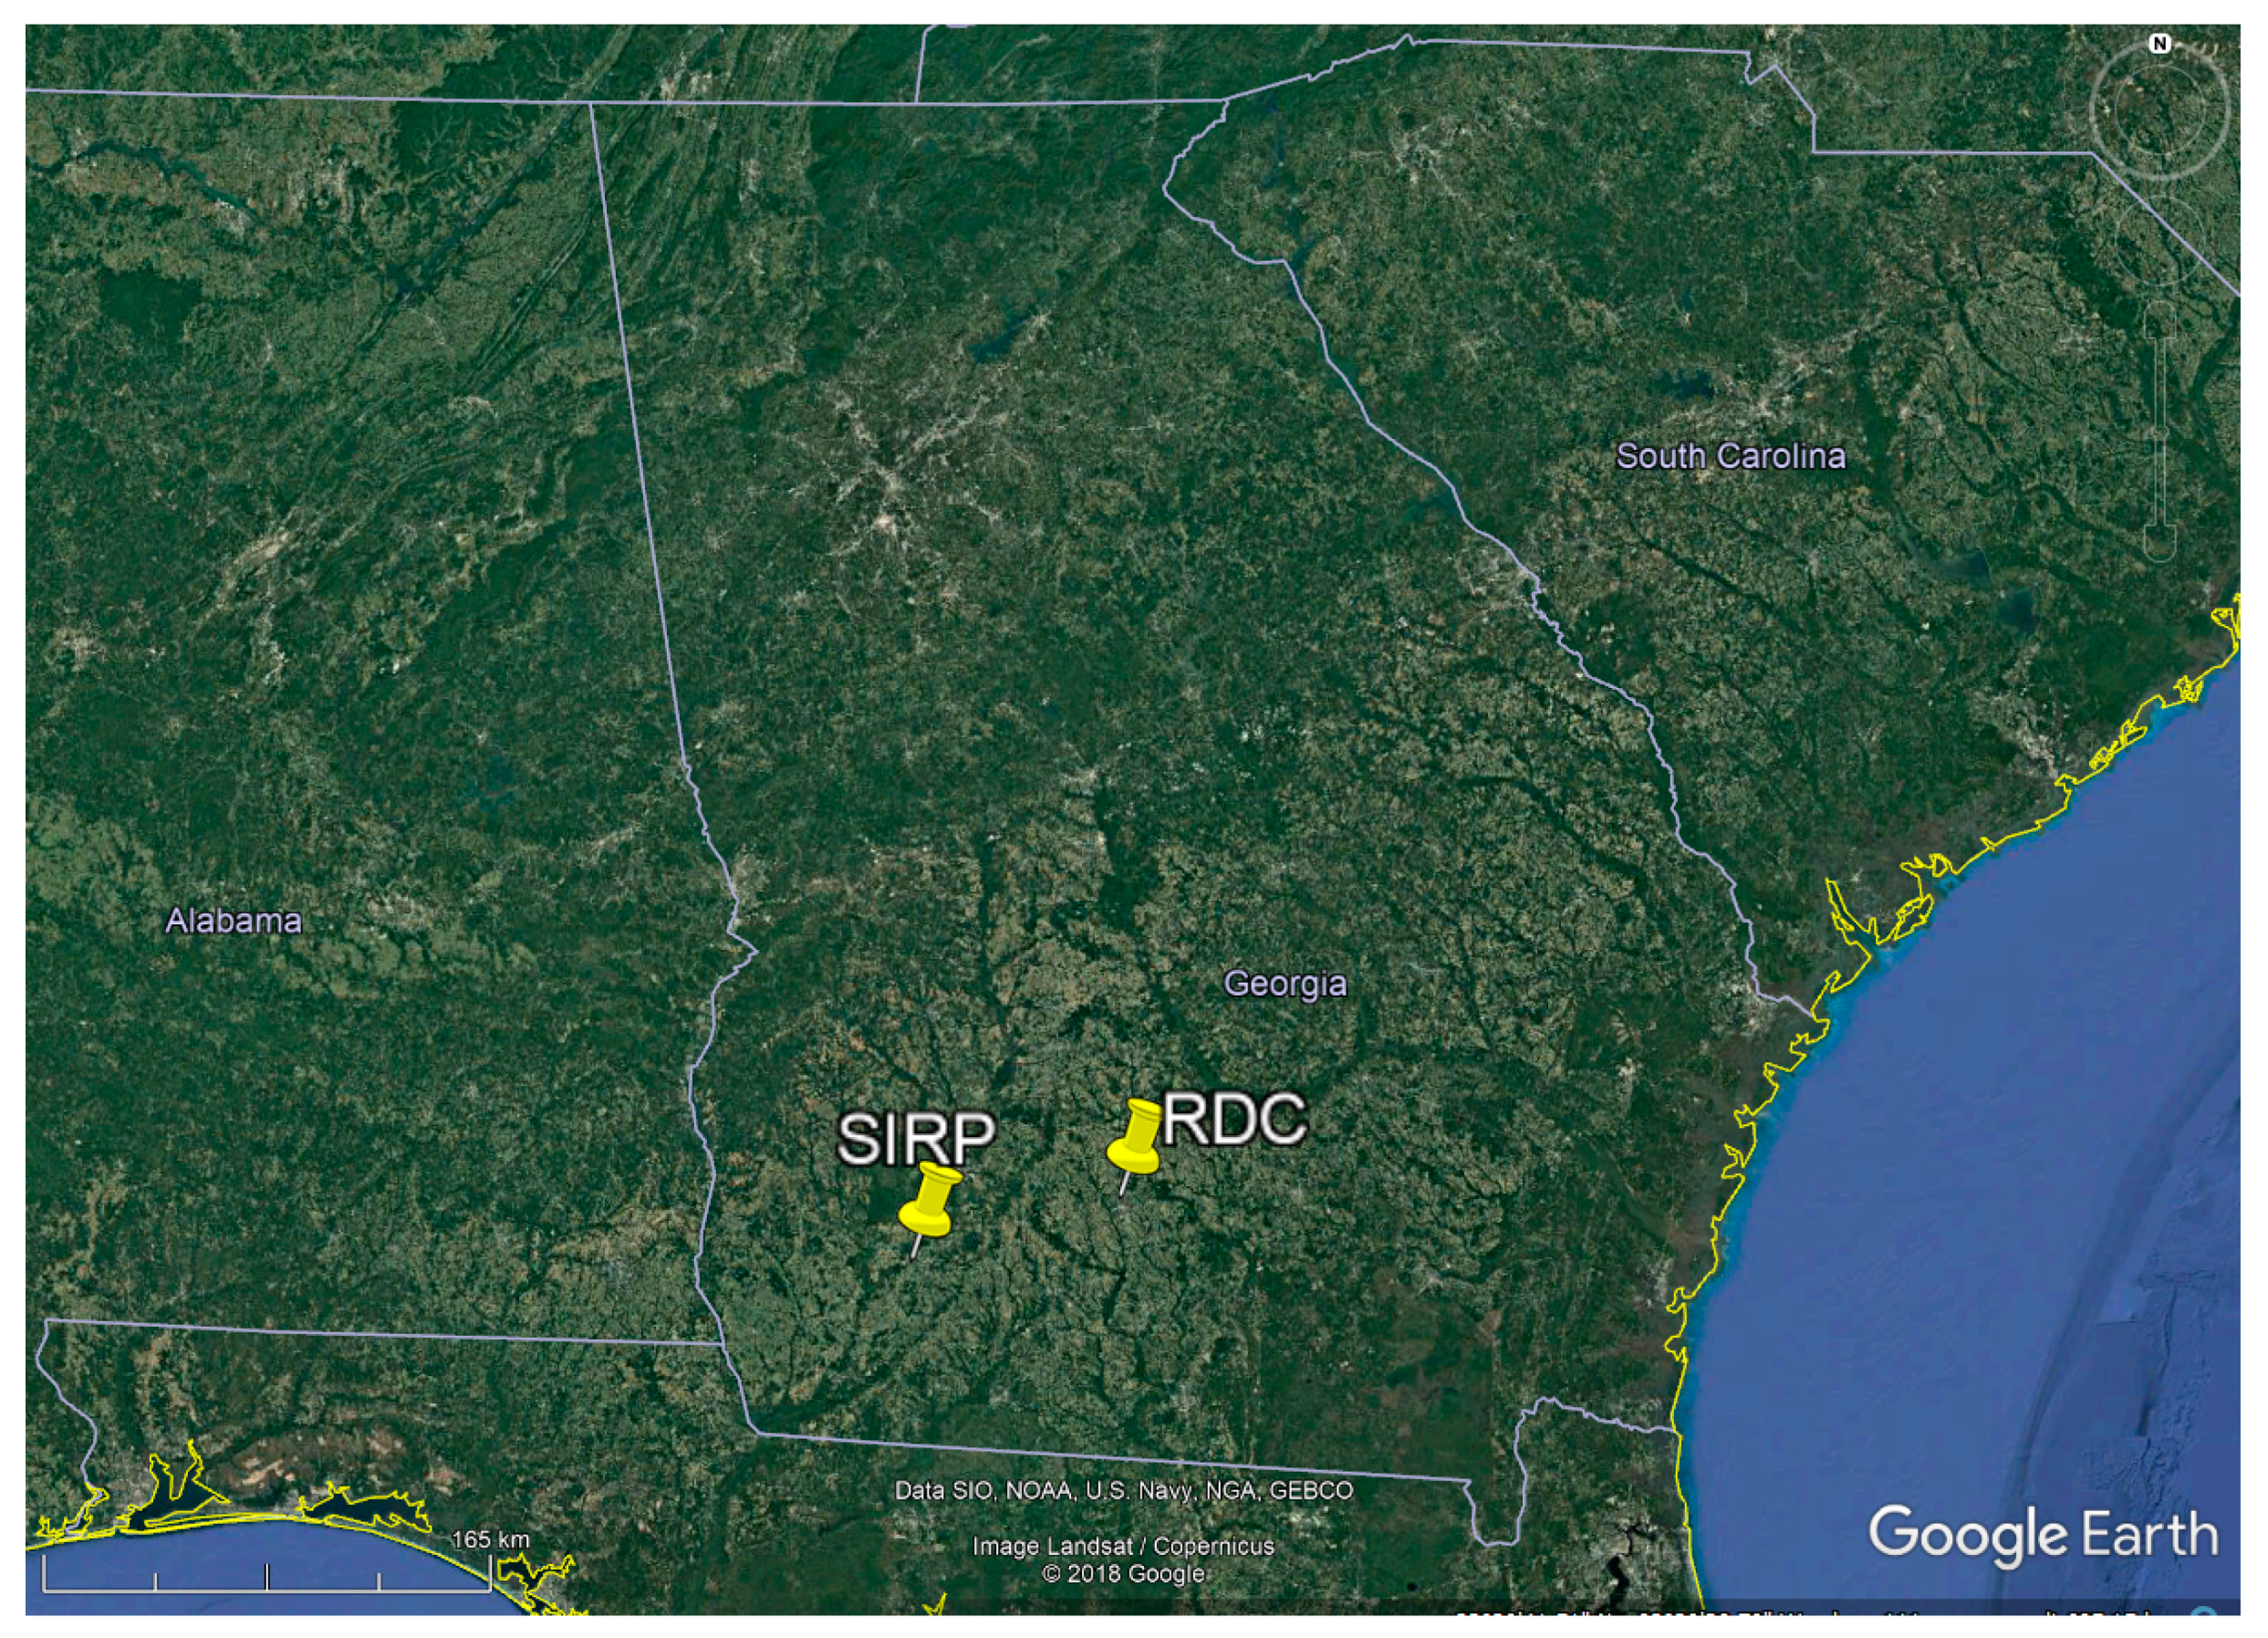
A three-year project focusing on maize production utilizing the hybrid P1916YHR (Pioneer, Johnston, IA, USA) began in 2015, making 2017 the third consecutive maize growing season, in two locations in South Georgia (
Figure 1). Both locations were on one of the University of Georgia’s research farms; the Rural Development Center (RDC) field was in Tifton, GA (31°29′4.32″ N, 83°31′18.07″ W), and the other one called SIRP was located at Stripling Irrigation Research Park (SIRP) (31°16′46.44″ N, 84°17′59.48″ W) in Camilla, GA. Both fields were chosen due to space availability. Maize is planted at these two locations to follow proper crop rotations and both conservation and conventional tillage are employed every year. Additionally, the variable rate irrigation (VRI) system in SIRP field was essential for conducting this study.
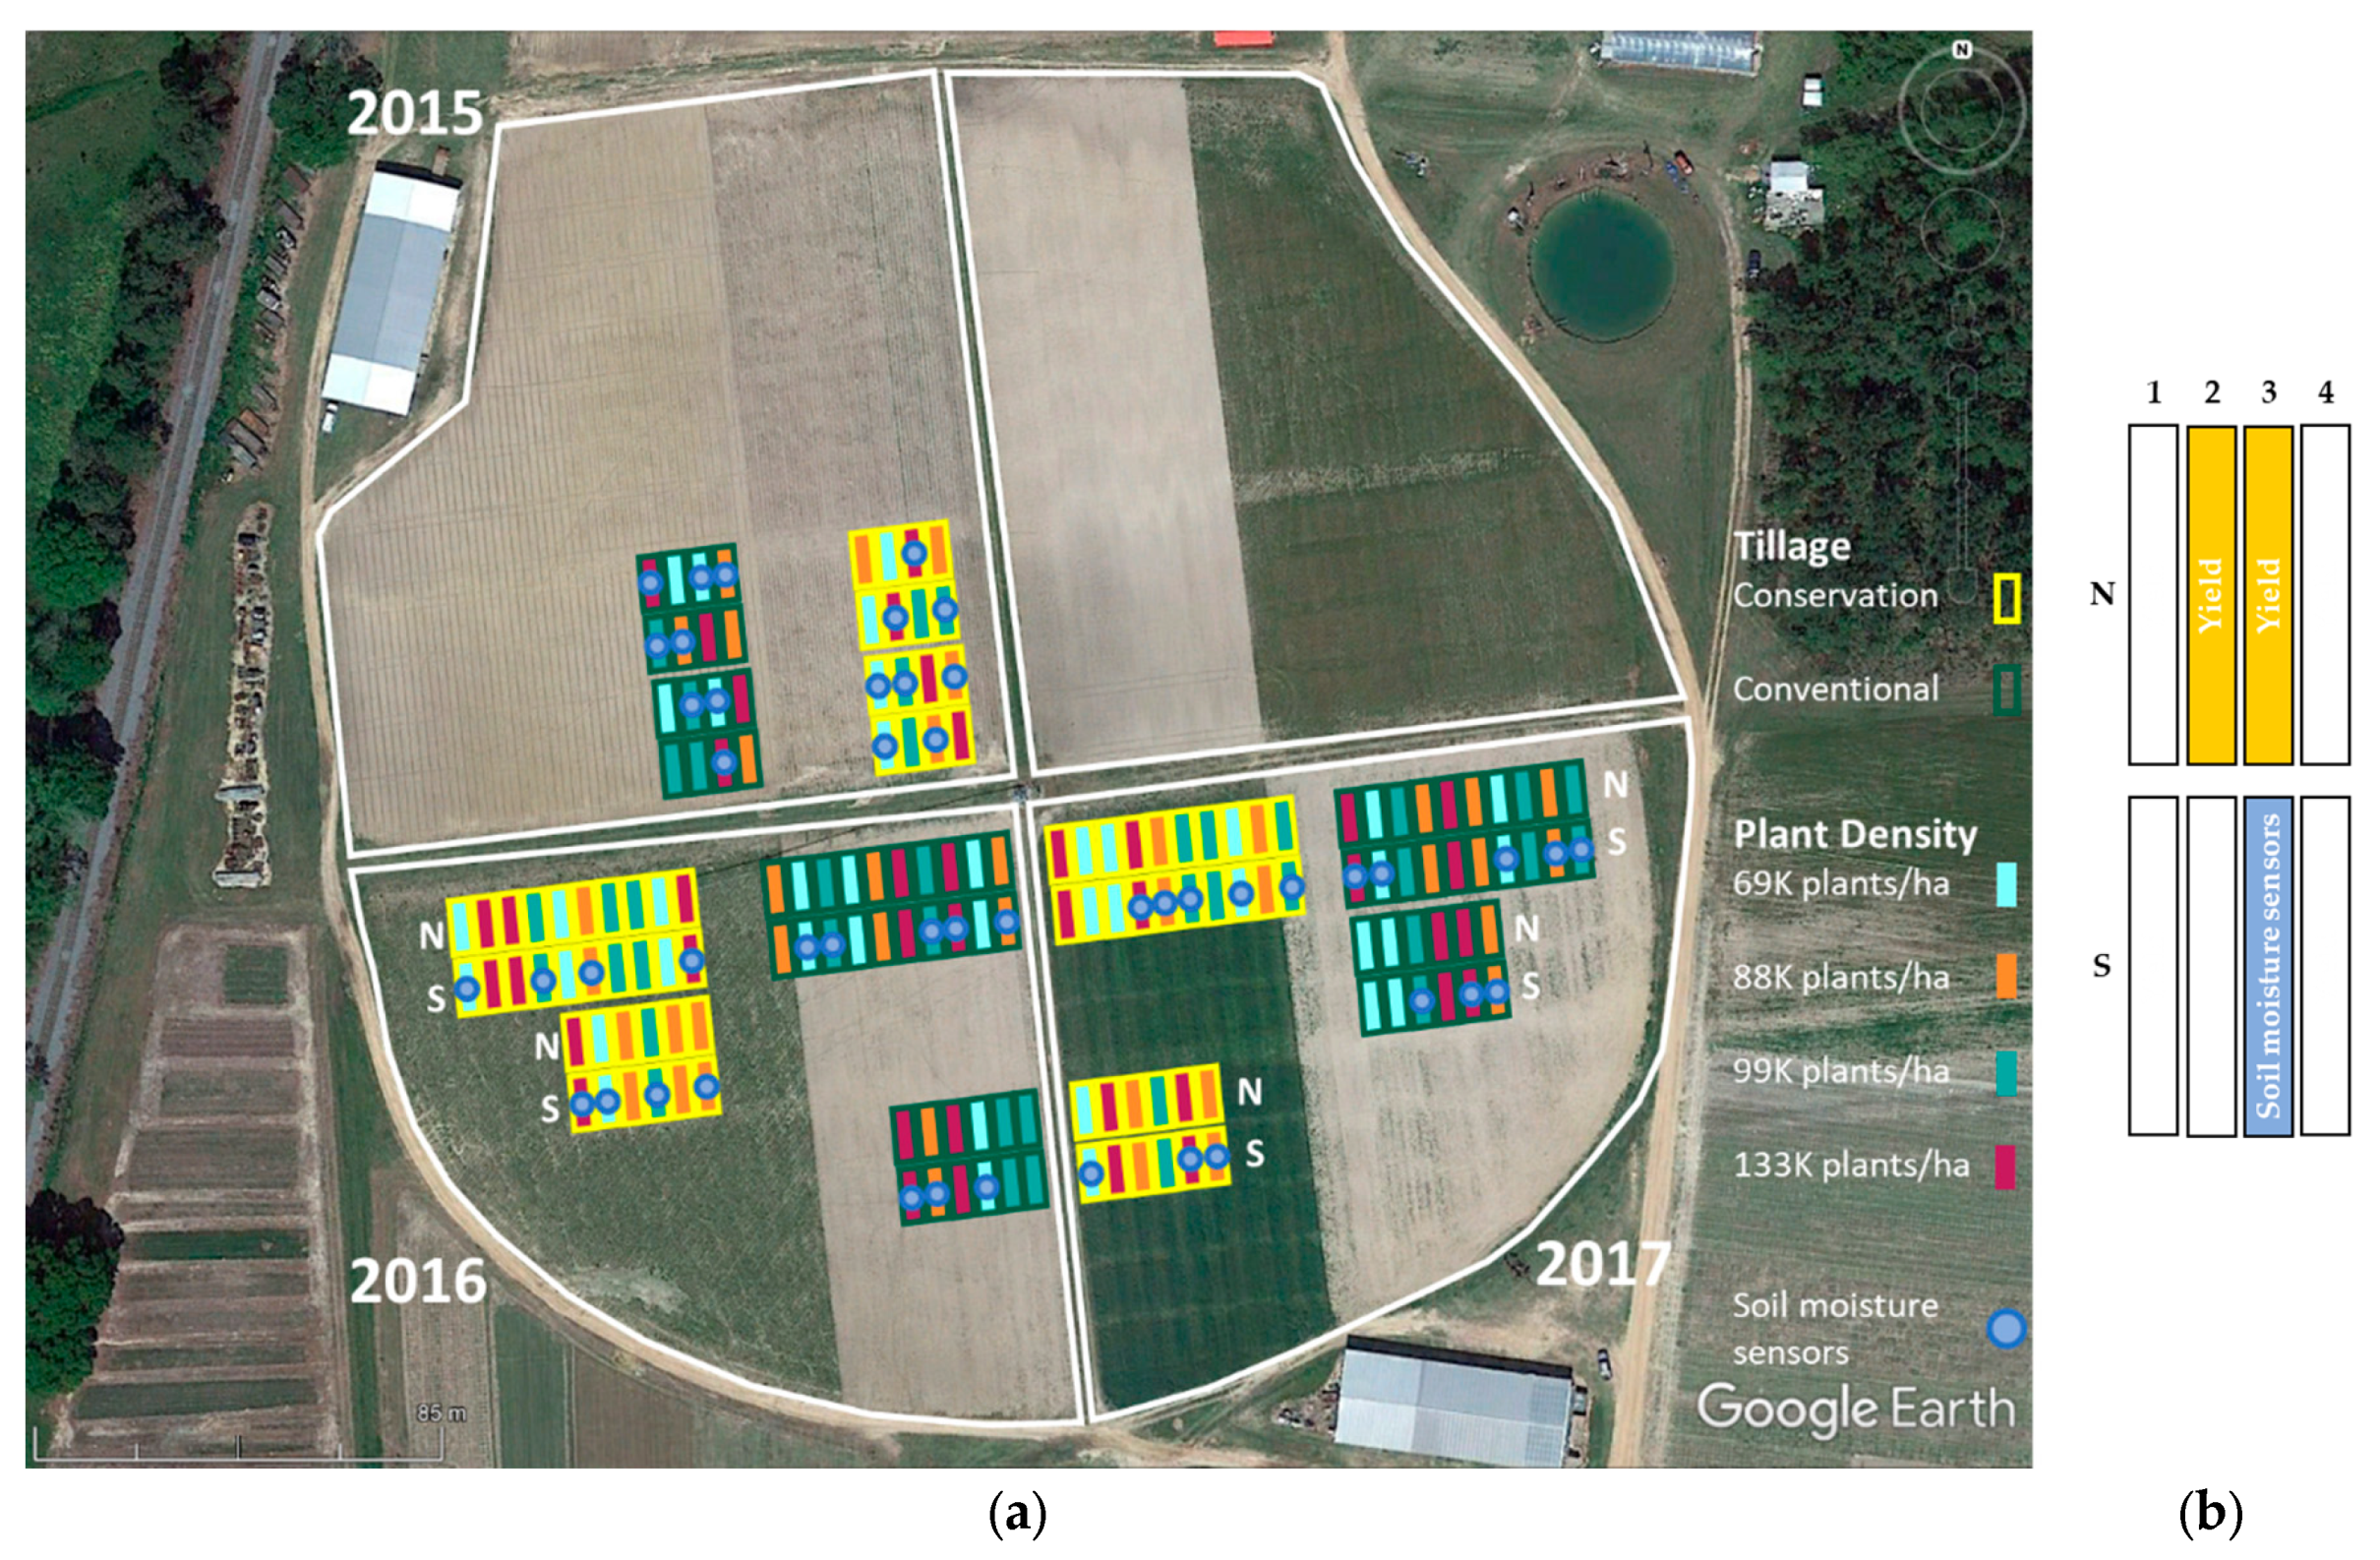
The RDC field was 6 ha and consisted of four blocks (quadrants), shown with white borders in
Figure 2. A proper crop rotation between soybeans, cotton, peanuts and maize was followed between the years. Maize always followed peanuts and the map in
Figure 2 shows the location that maize was planted each year between 2015 and 2017.
A split plot design was followed during the three years of the project. There were two main plots assigned to the tillage method. Conservation and conventional tillage methods were implemented and are shown with yellow and green borders respectively in
Figure 2a. The main plots were separated into subplots of 4 m wide (four rows) and 9 m long for the different treatments of plant density to be applied. The plant densities are marked with light blue for 69K plants/ha, orange for 88K plants/ha, green for 99K plants/ha and red for 133K plants/ha.
Sixteen subplots were chosen from each tillage method in order to have four replications of the four plant densities and were completely randomized in each tillage treatment. During the second and third years of the project, i.e., 2016 and 2017, the length of the subplots was doubled (18 m) for sampling purposes and they were further separated into north (N) and south (S) subplots. The middle two rows of the north plots were used for collecting the yield data, while the south plots were used for installing soil moisture sensors (
Figure 2b).
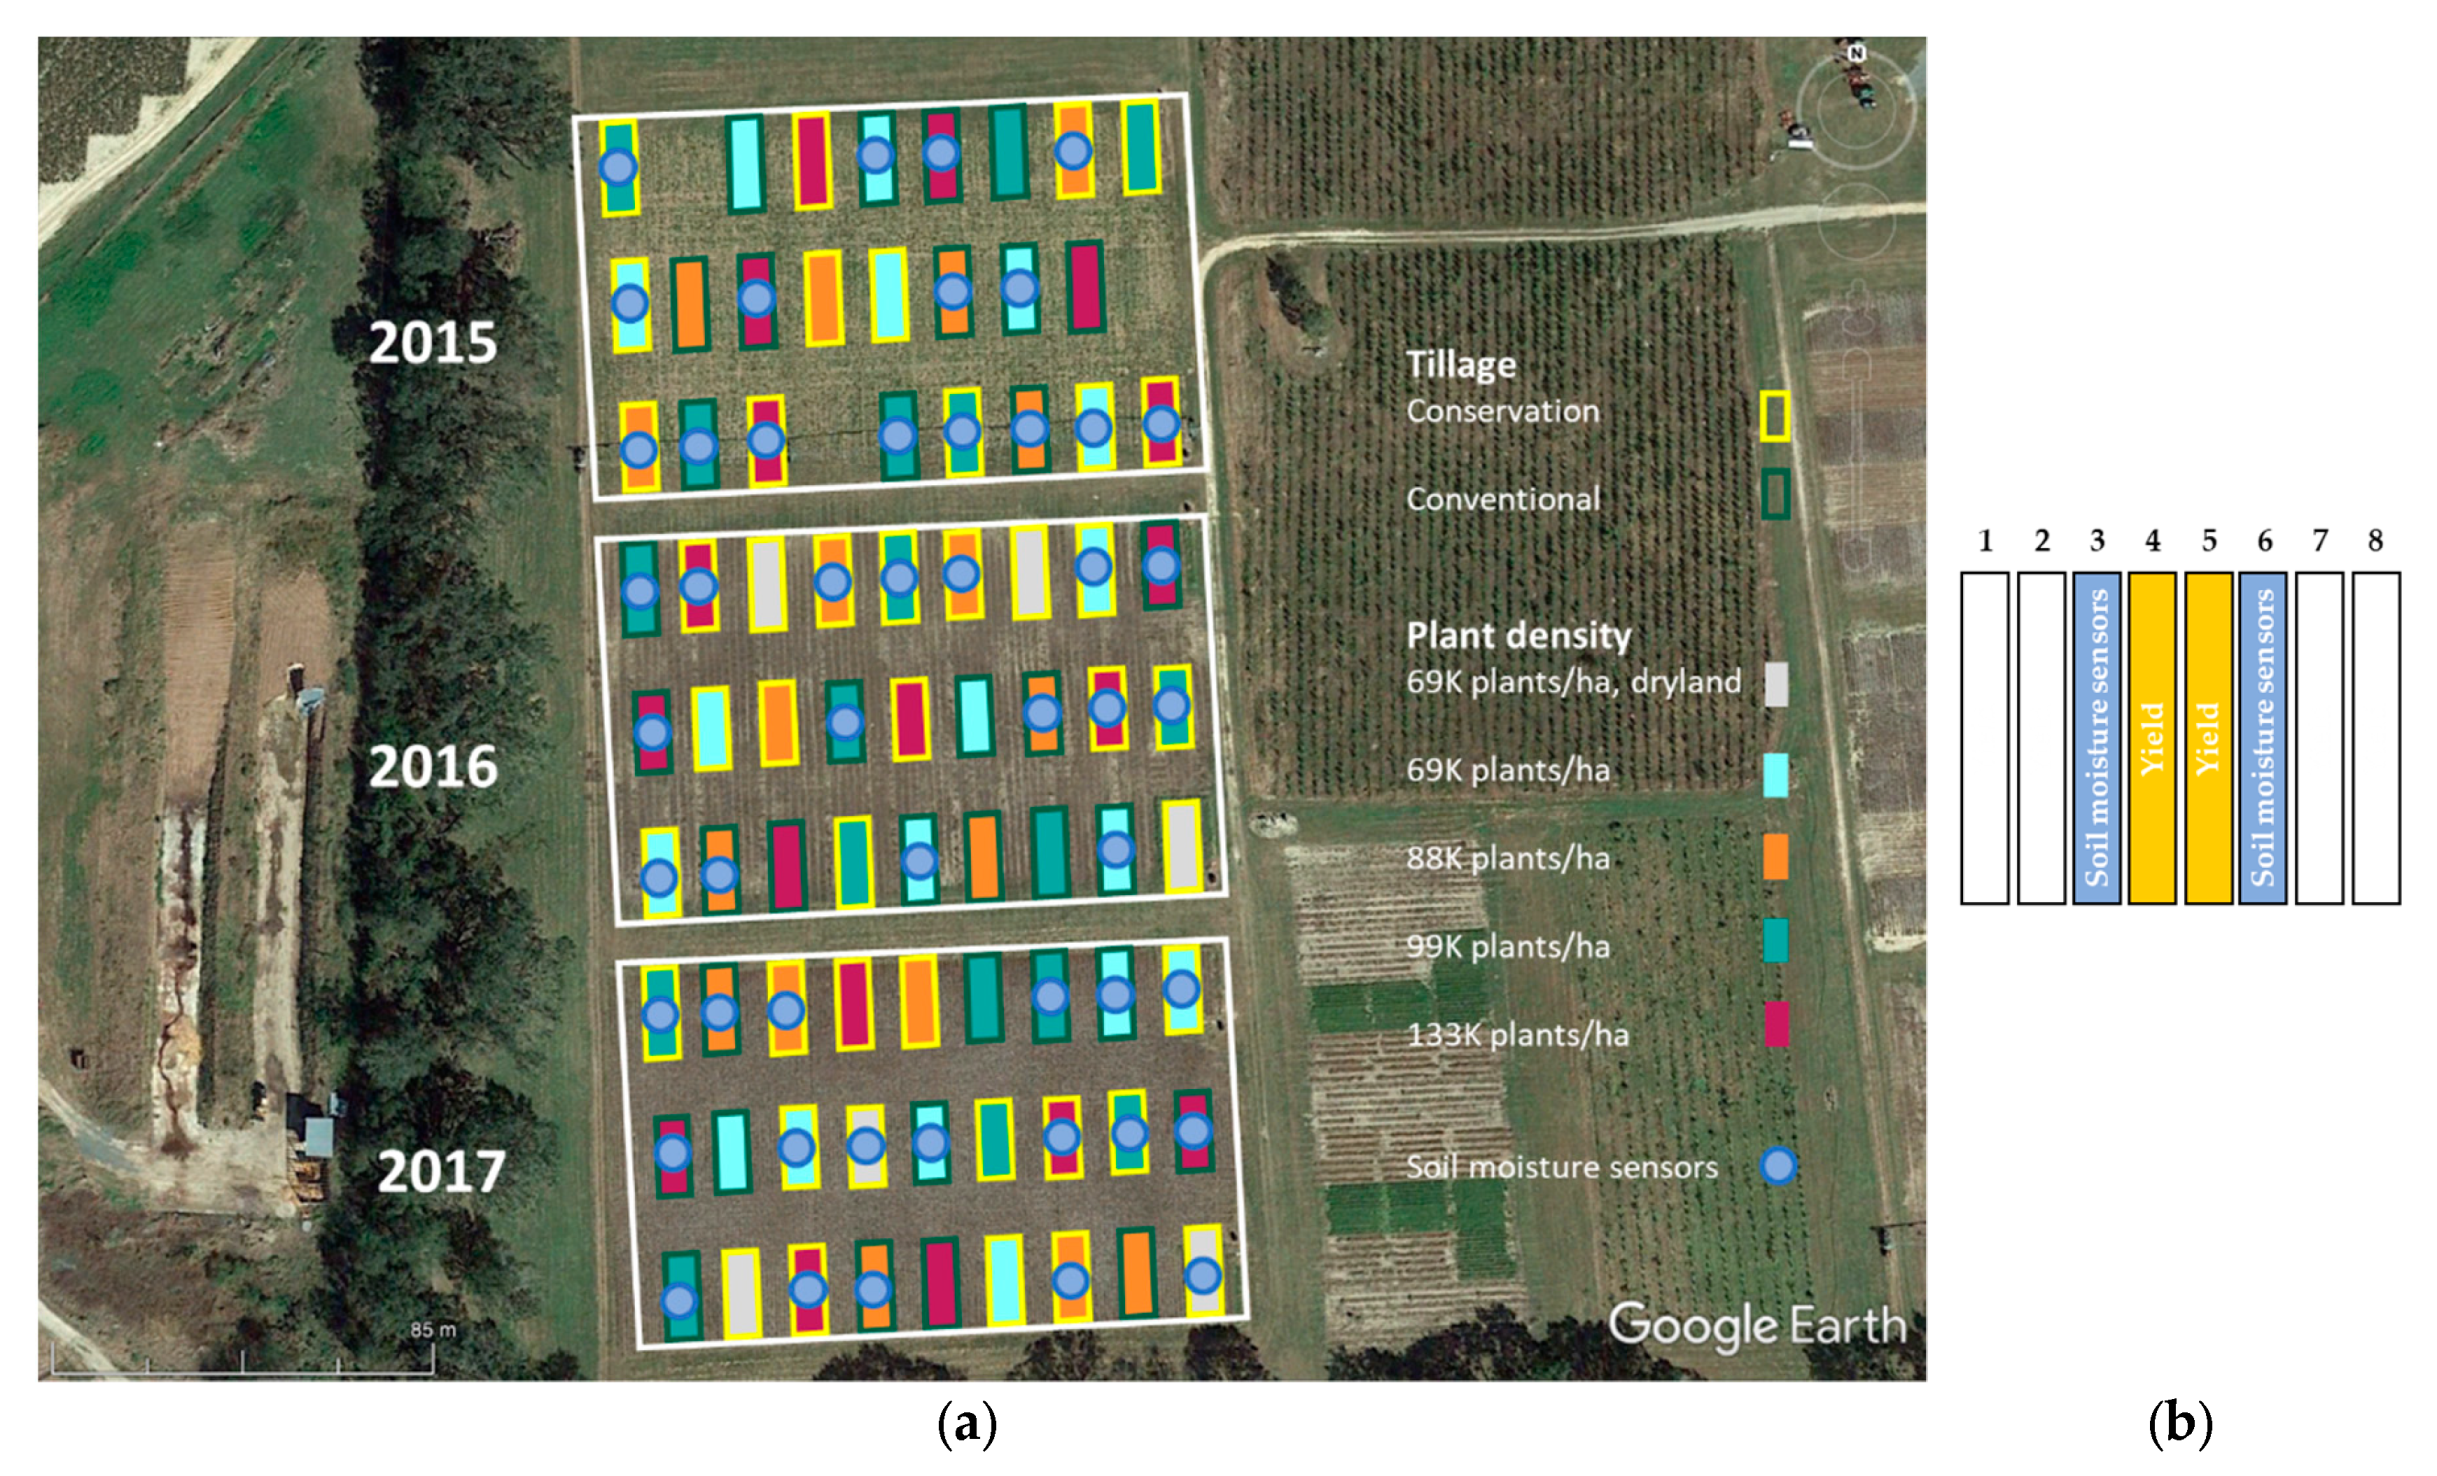
The SIRP field was 4 ha and was separated into three blocks, shown with white borders in
Figure 3a, for proper crop rotation between cotton, peanuts and maize between the years. Similar to the RDC field, maize followed peanuts. The location of the maize for each year of the project is indicated in
Figure 3 with the corresponding year (2015, 2016, and 2017) written next to it.
The blocks were separated into smaller plots of 8 m wide (eight rows) and 15 m long and the treatments of tillage method (conservation and conventional) and plant density (69K, 88K, 99K, and 133K plants/ha) were assigned to them using a complete randomized design. The border color of each plot represents the tillage method (yellow for conventional and green for conservation), while the color used to fill each plot represents the plant density (light blue for 69K plants/ha, orange for 88K plants/ha, green for 99K plants/ha and red for 133K plants/ha).
Twenty-four plots were chosen in order to have three replications of each treatment. Three more plots were selected during 2016 and 2017 growing seasons and treated as control treatments, shown with grey color, in which conservation tillage, plant density of 69K and no irrigation were applied. The middle two rows of each plot were used for collecting yield data, while either row 3 or 6 were used for installing soil moisture sensors (
Figure 3b).
All the treatments of plant density, tillage and irrigation are listed in
Table 1 for both fields. The name of the treatment consists of a number that represents the plant density in thousands per ha. The letters S and V refer to conservation and conventional tillage respectively and the letter I is added to irrigated treatments.
Two different methods of irrigation scheduling were implemented based on the geographical location of the field, the UGA maize checkbook method at the RDC field and a sensor-based method at the SIRP field.
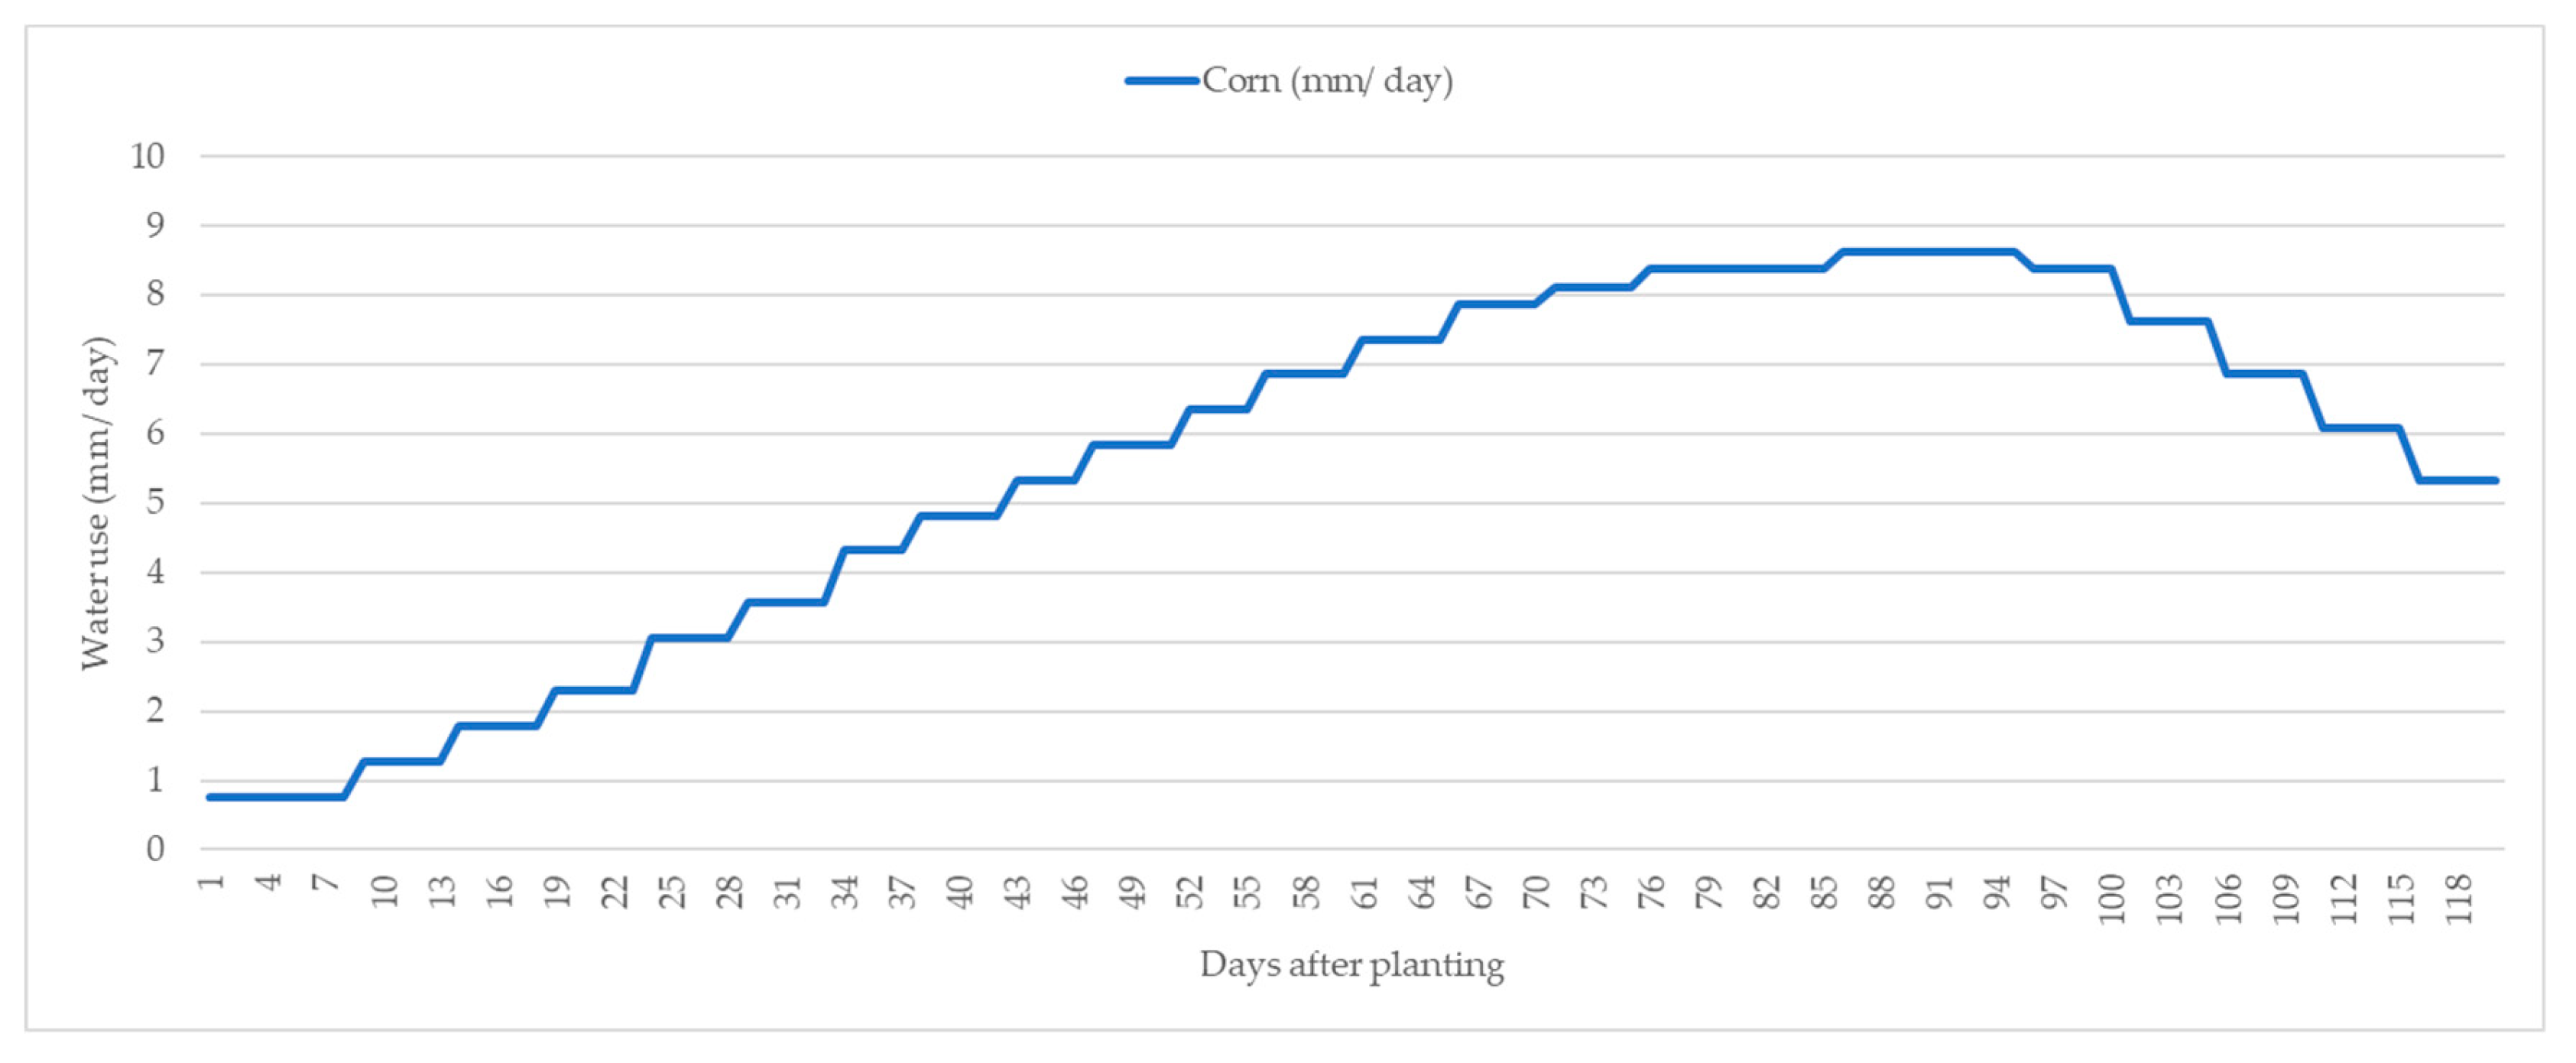
The UGA checkbook method (moisture balance method) is the simplest way of scheduling maize irrigation. It was developed by multiplying the FAO-56 crop coefficient (Kc) value by the historical average evapotranspiration (ET) data from the southern portion of Georgia. The checkbook method requires basic information such as soil type, soil water holding capacity, expected daily water use of maize, and rainfall information in order to be used. An example of a checkbook method showing the daily water use (mm) of maize in Georgia, USA, is presented in
Figure 4 [
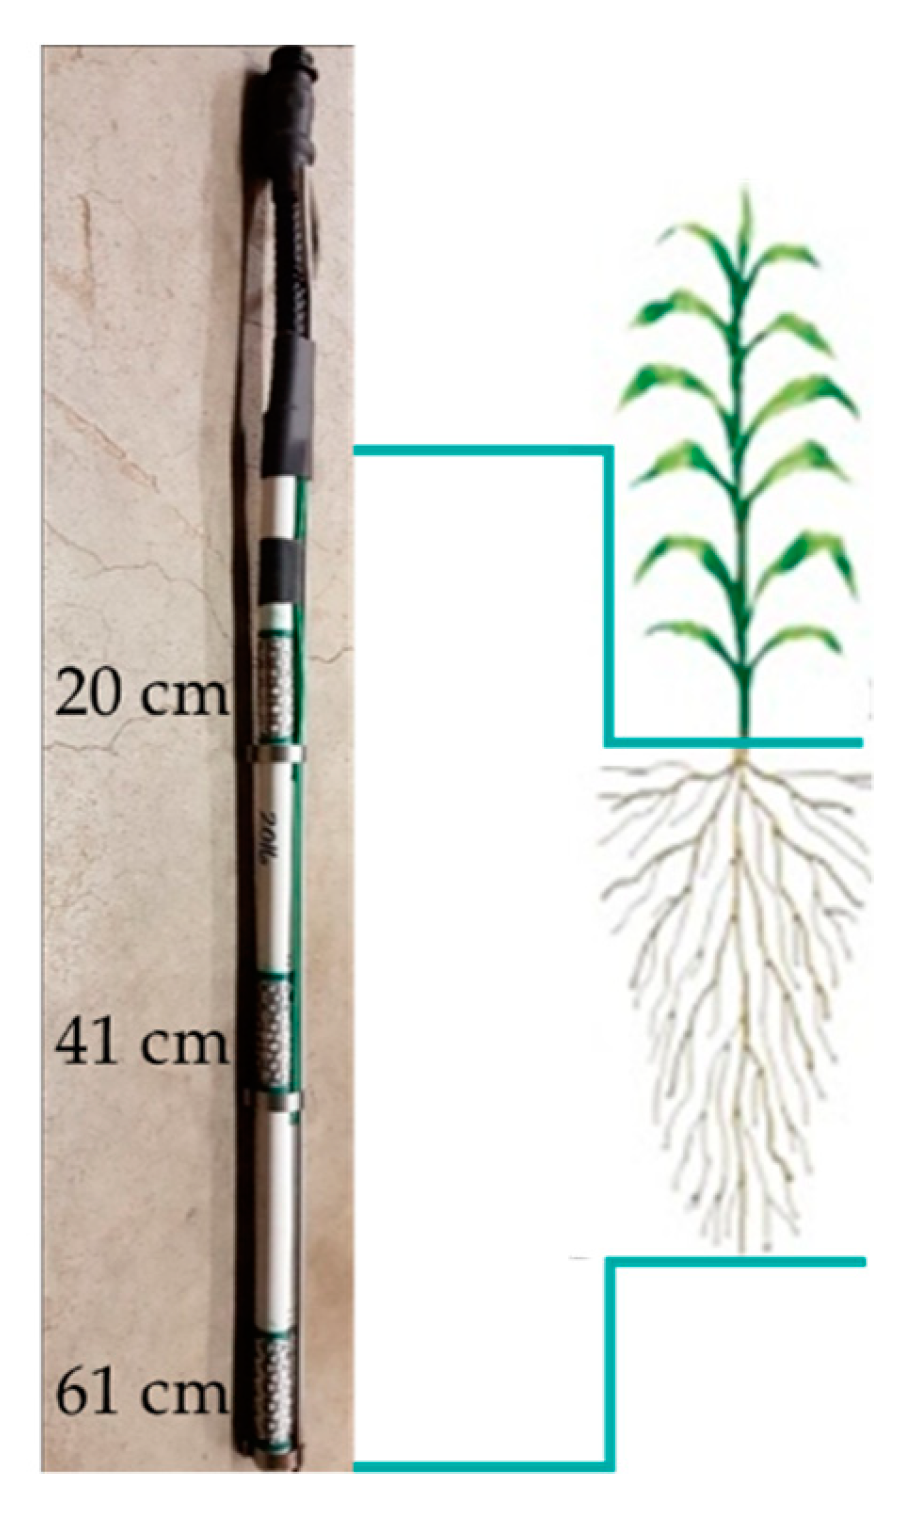
29]. Rainfall and irrigation data were tracked throughout each week. Irrigation per week was divided by the number of days that is feasible to irrigate during a given week. For instance, if a system needed three days to make a full irrigation application across the entire field, irrigation could take place only twice per week. Moreover, if the required amount of water per week was 50 mm, then 25 mm of water was applied in each application by the system. A center pivot was used for irrigating, and the irrigation was uniform across the entire RDC field. Soil moisture was recorded by three watermark sensors at depths of 20 cm, 41 cm, and 61 cm, constituting one node (
Figure 5). Two nodes were installed per treatment for collecting Soil Water Tension (SWT), and their location is shown with blue circles in
Figure 2. However, the soil moisture data were used only for data logging at RDC and not for irrigation scheduling.
The availability of the 7000 VRI from Advance Ag Systems at the SIRP field allowed the application of different irrigation requirements to individual treatments. Thus, a sensor-based irrigation scheduling method was implemented at the SIRP field where a lateral irrigation system was used, and VRI treatments were applied such that each treatment was irrigated independently based on treatment average SWT data. This means that the VRI was used as an “on” and “off” system depending on the soil moisture sensor indications. The VRI system could control nine zones. The zones 1–5 and 8–9 had seven sprinklers, while the zones 6 and 7 had eight sprinklers. The lateral irrigation system was travelling with a speed 18% for applying 19.05 mm of water while irrigating.
The sensor-based method was used for collecting soil moisture data from the different depths (20 cm, 41 cm, and 61 cm). Two nodes were installed in each treatment, as shown with the blue circles in
Figure 3, and hourly readings were collected every day. The readings at 7:00 a.m., close to a pre-dawn optimal threshold, were used for irrigation scheduling decisions. A weighted depth average was calculated by applying the SWT readings from the three depths to Equation (1). The total average of the SWT value of each sensor was determined by the weighted percentage (α, β, γ) that it was multiplied by (
Table 2). These percentages were based on the plants’ rooting depth, which was correlated to accumulated Growing Degree Days (GDDs) based on previous research [
30,
31,
32]. For instance, at the beginning of the growing season, there was a focus on the SWT values of the two soil moisture sensors located at 20 cm and 41 cm because the plants’ roots had not grown deeper than 41 cm into the soil profile. However, as shown in
Table 2, the percentages of the three soil moisture sensors at the different depths were changed throughout the maize growing season depending on the growth and development of the plants and their rooting system. A weighted average threshold of 30 kPa–35 kPa was set as the trigger point for scheduling the irrigation events to each treatment [
33].
where α, β, and γ are the weighted percentages used throughout the season based on the growth stage of the maize (
Table 2).
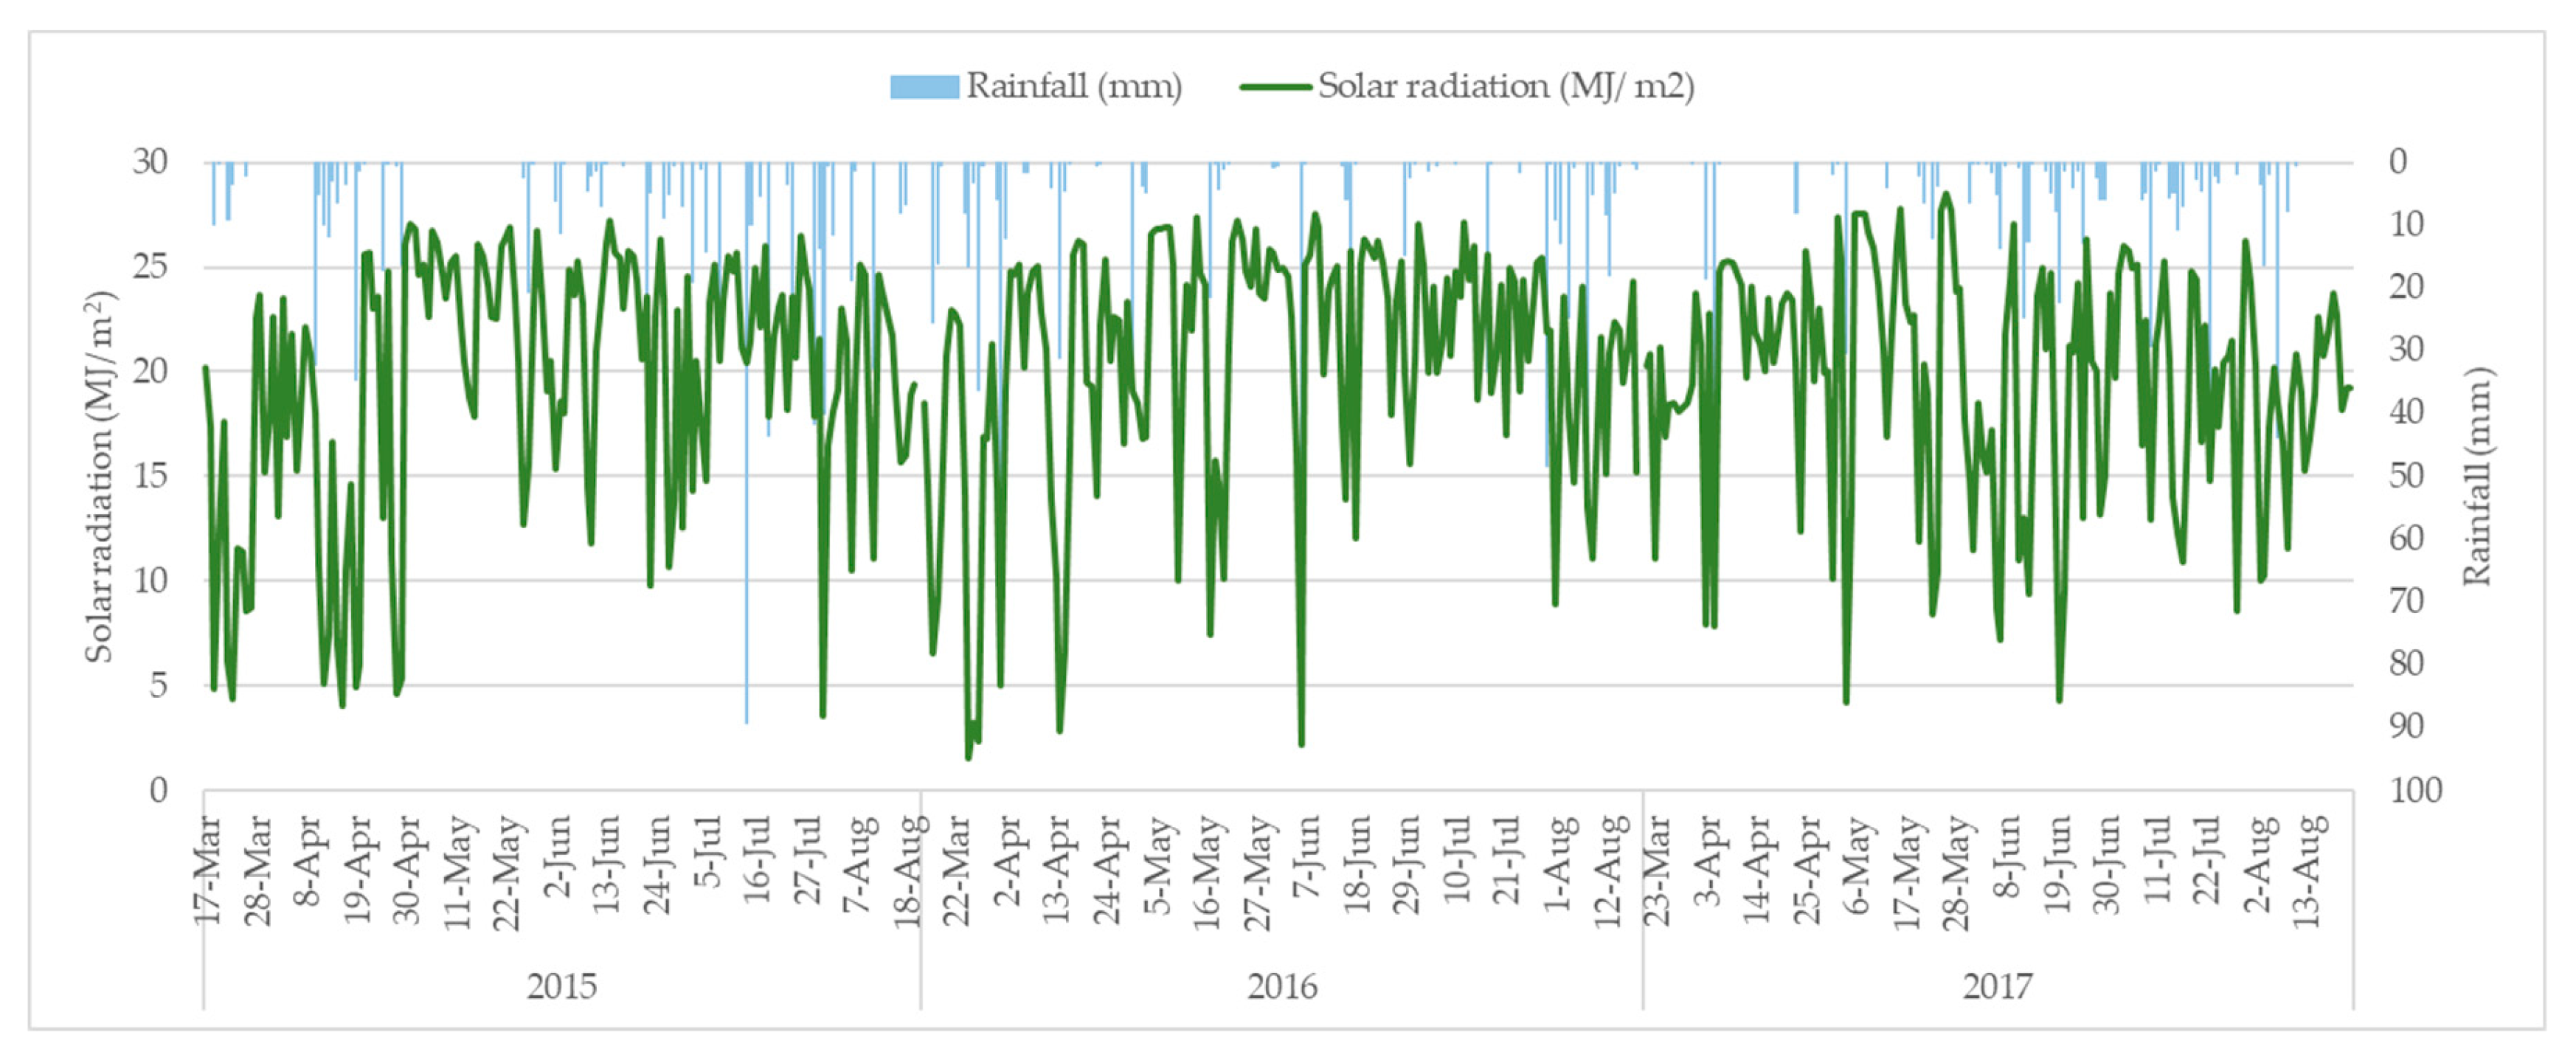
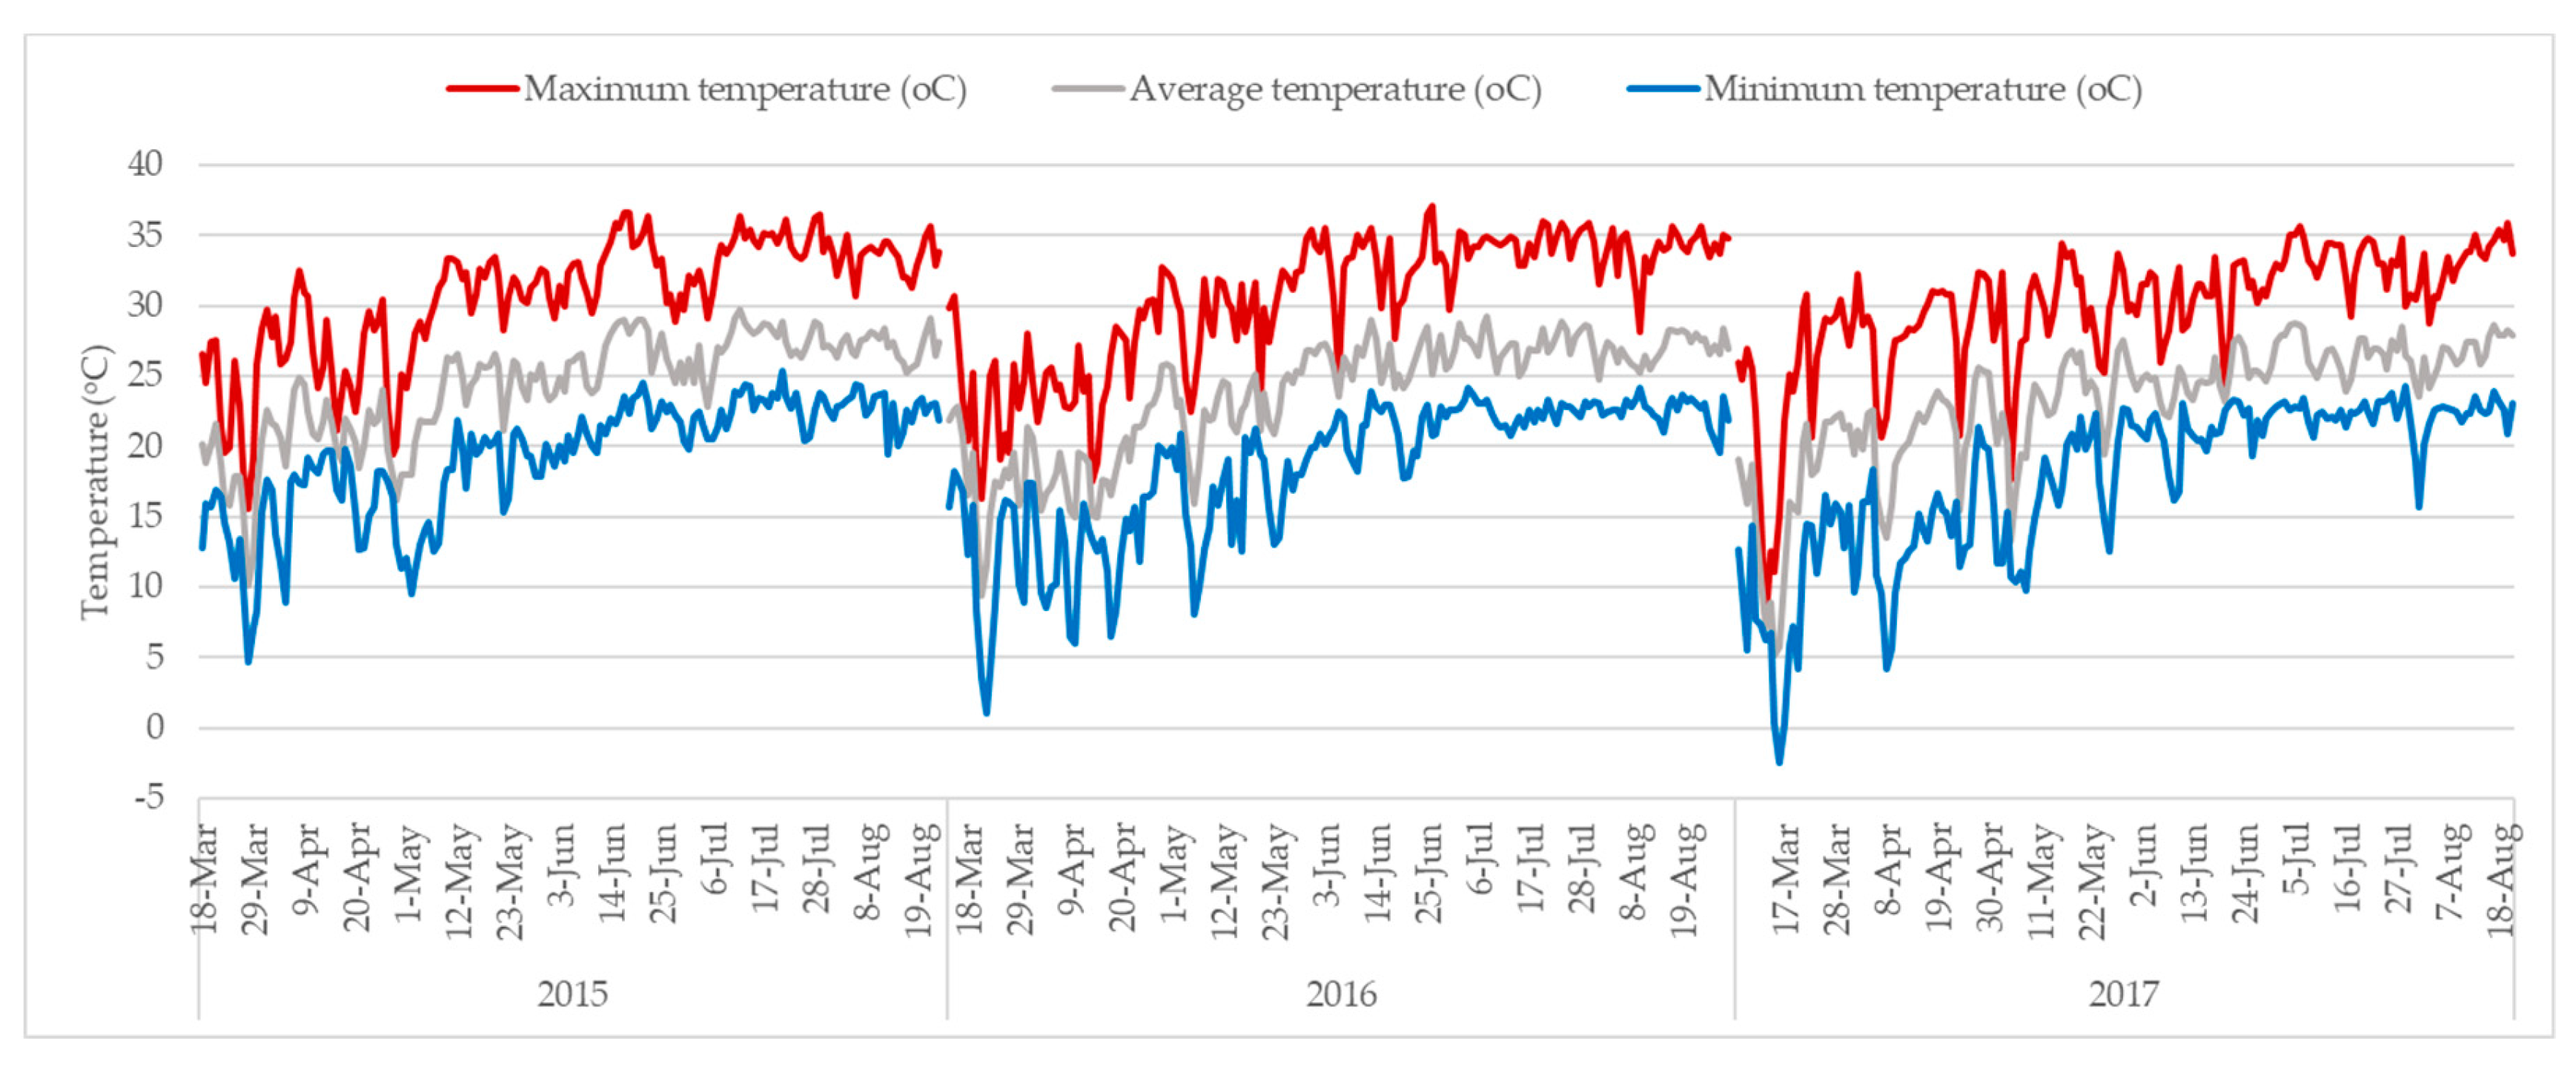
Weather data such as rainfall, solar radiation, and temperature were downloaded daily from the University of Georgia weather network [
34]. Rainfall data was used for irrigation scheduling while the temperature data was used for estimating the GDDs by using Equation (2) [
35]. In the case that the daily maximum and/or minimum temperature was less than 10 °C, then it was set equal to 10 °C. If the daily maximum temperature was higher than 30 °C, then it was set equal to 30 °C.
A statistical analysis was performed for each field independently with JMP® Pro 14.1.0 to determine significant differences on the response variables between the treatments during each year of the project separately and by combining the three years of the experiment together. The comparison of means was done by using Tukey–Kramer HSD test. In the RDC field the response variable was yield, while in the SIRP field the response variables were yield and irrigation. Factors such as calendar year (meaning the location of maize plots in the fields due to the rotation protocol and the different weather conditions that occurred throughout each growing season), tillage method, plant density, and irrigation were checked on how they affected the response variables with the factorial to two-degree model.
4. Discussion
Maize yield response to different management practices has created an intense research effort around the world. Practices such as irrigation scheduling methods, tillage systems, and plant densities have been put to a test in order to reach greater understanding on how to achieve high yields while increasing water use efficiency.
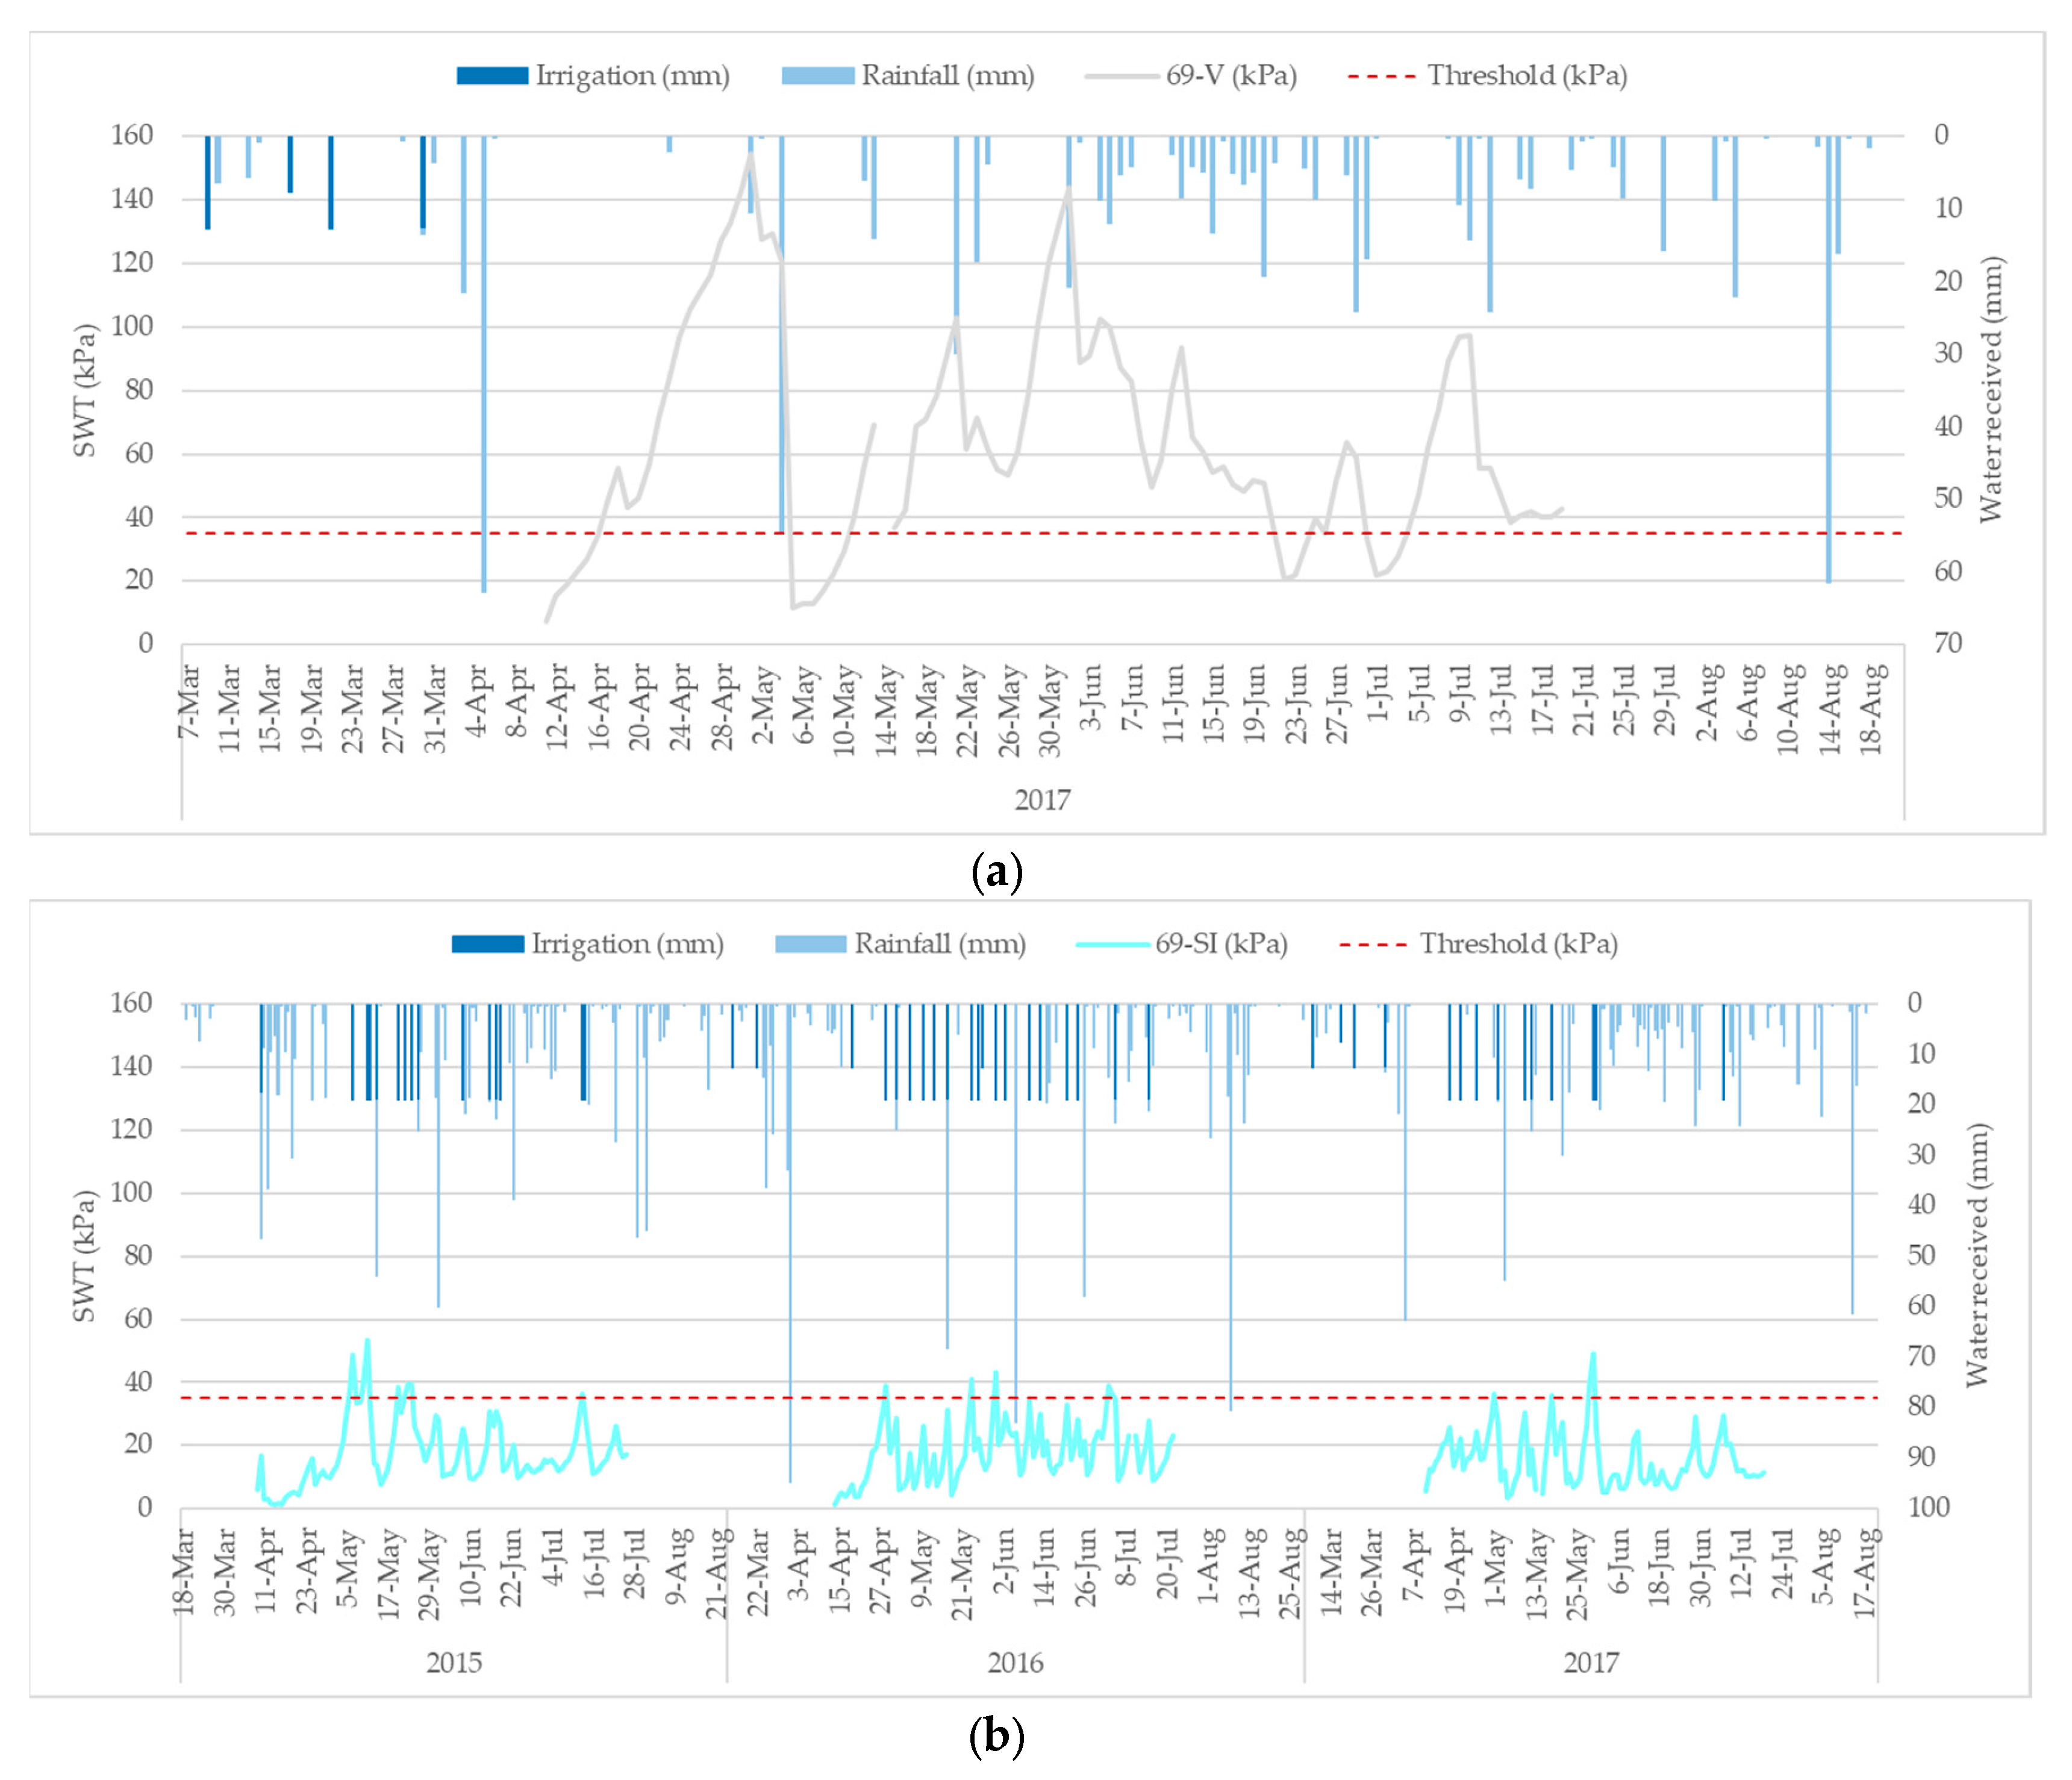
Irrigation is crucial in maize production. As this study showed, the non-irrigated treatment produced significantly less yield than the irrigated ones. The soil moisture sensors installed in the non-irrigated treatment, showed that the SWT remained above the irrigation threshold because adequate rainfall was not received. When there was a rain event, it was observed that the SWT was decreased in the treatment, however, the water received through rainfall was not adequate to lower the SWT below the threshold of 35 kPa. Due to the lack of adequate moisture, this treatment produced the lowest yields when compared to the irrigated treatments in the SIRP field. Previous studies have shown that irrigation increased crop yields not only in arid and semi-arid areas [
36,
37,
38,
39], but also in humid areas because of precipitation variability [
40,
41]. According to the University of Nebraska, irrigated maize yield averaged 12,547 kg/ha and non-irrigated averaged 11,084 kg/ha in Nebraska during 2017 [
42]. Also, a study conducted in Missouri, which evaluated the effects of five plant densities and irrigation on maize yield, showed that irrigated treatments had higher yield results [
43]. Drought stress reduces canopy absorption of incident photosynthetically active radiation (PAR), radiation use efficiency (RUE), and harvest index (HI), which results to reduced yield of maize [
44]. As a conclusion, irrigation is important in maize production because the lack of water affects the physiology of corn which results in yield reduction [
45] and the adoption of an irrigation scheduling method and new technologies such as VRI system could assist producers to improve water use efficiency (WUE) [
46].
Checkbook method and sensor-based method were chosen for irrigation scheduling in this study. However, a direct comparison in terms of irrigation applied and grain yield between the two methods cannot be done in this study because they were not applied in the same location, which means differences in weather conditions, soil, planting and harvesting dates. A previous study conducted in Southeastern North Dakota showed that the irrigation scheduling methods had similar seasonal irrigation amounts, but the water balance method had better yield results [
47]. According to Kebede et al. [
48] soil moisture sensors are recommended as a primary tool for irrigation scheduling.
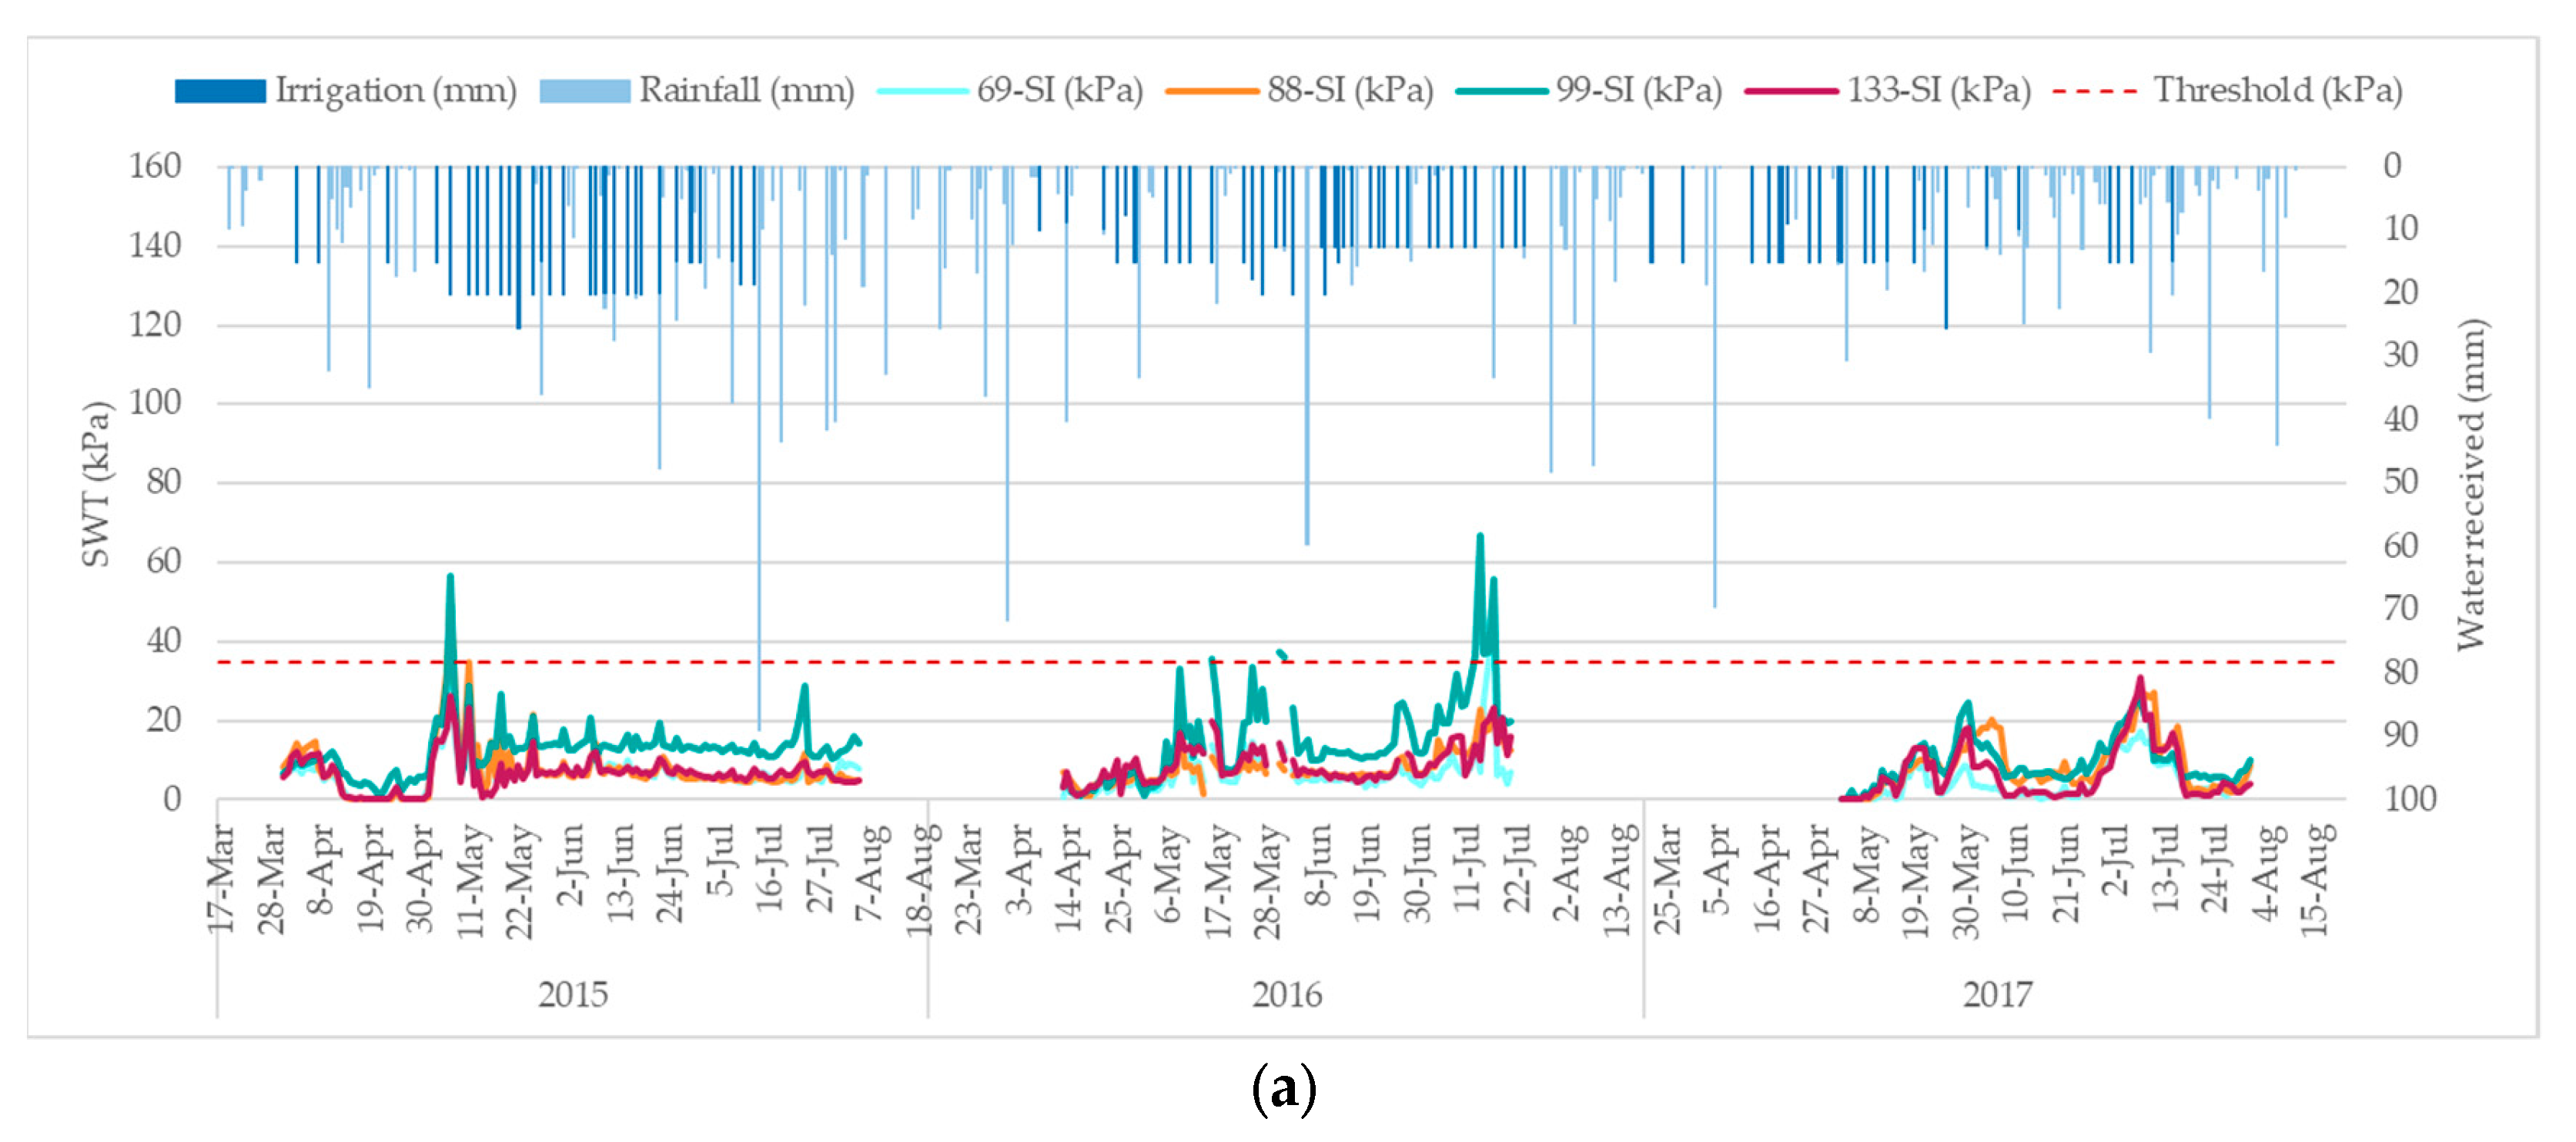
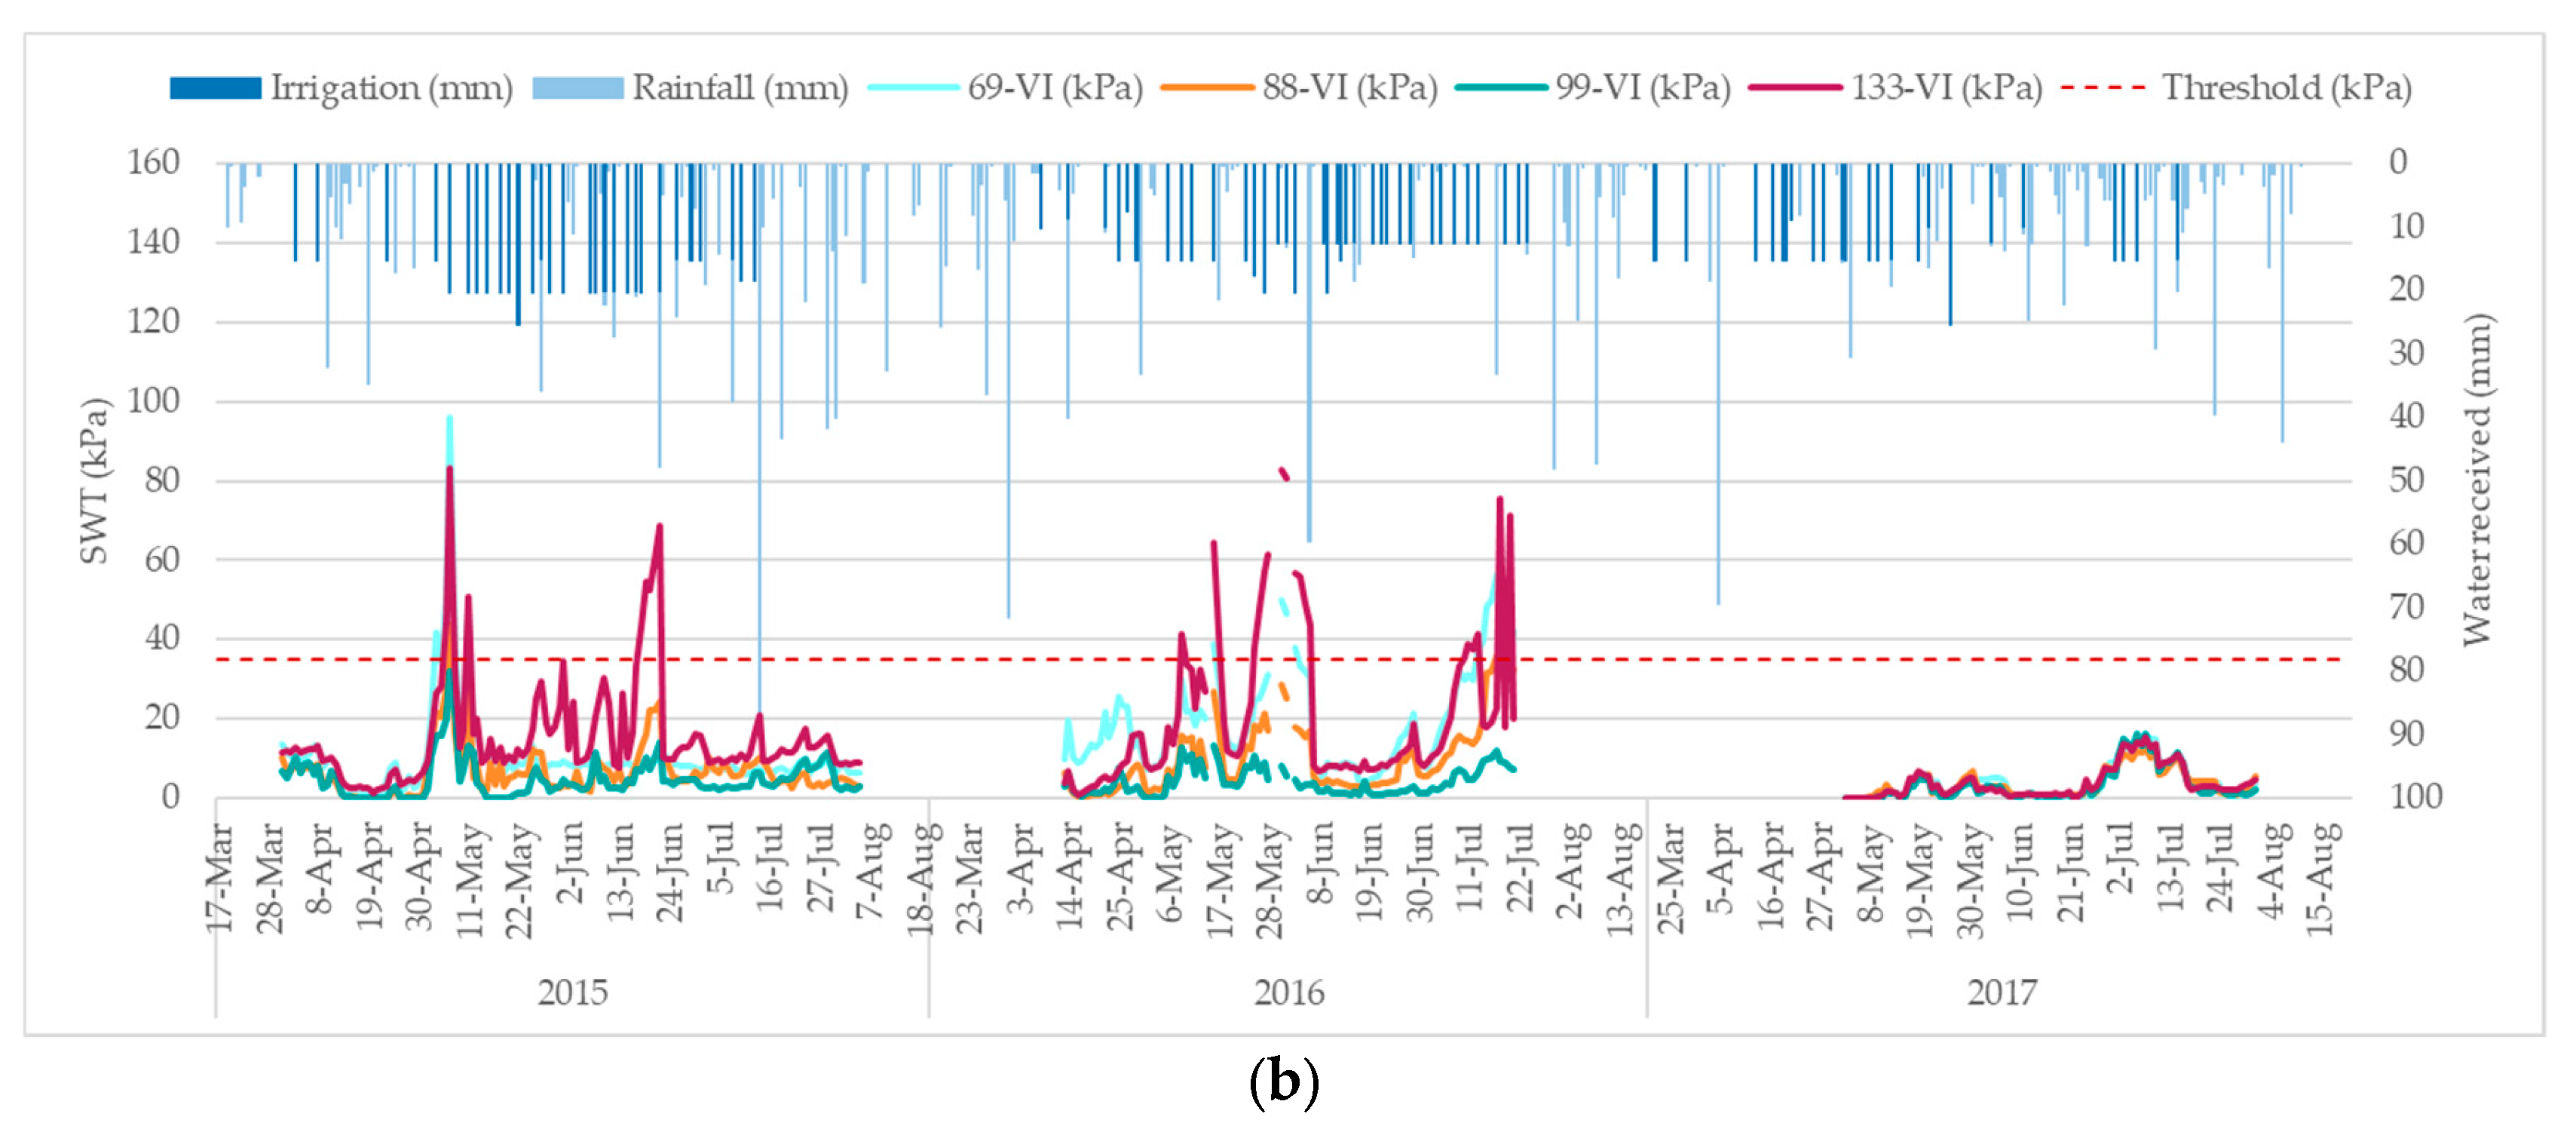
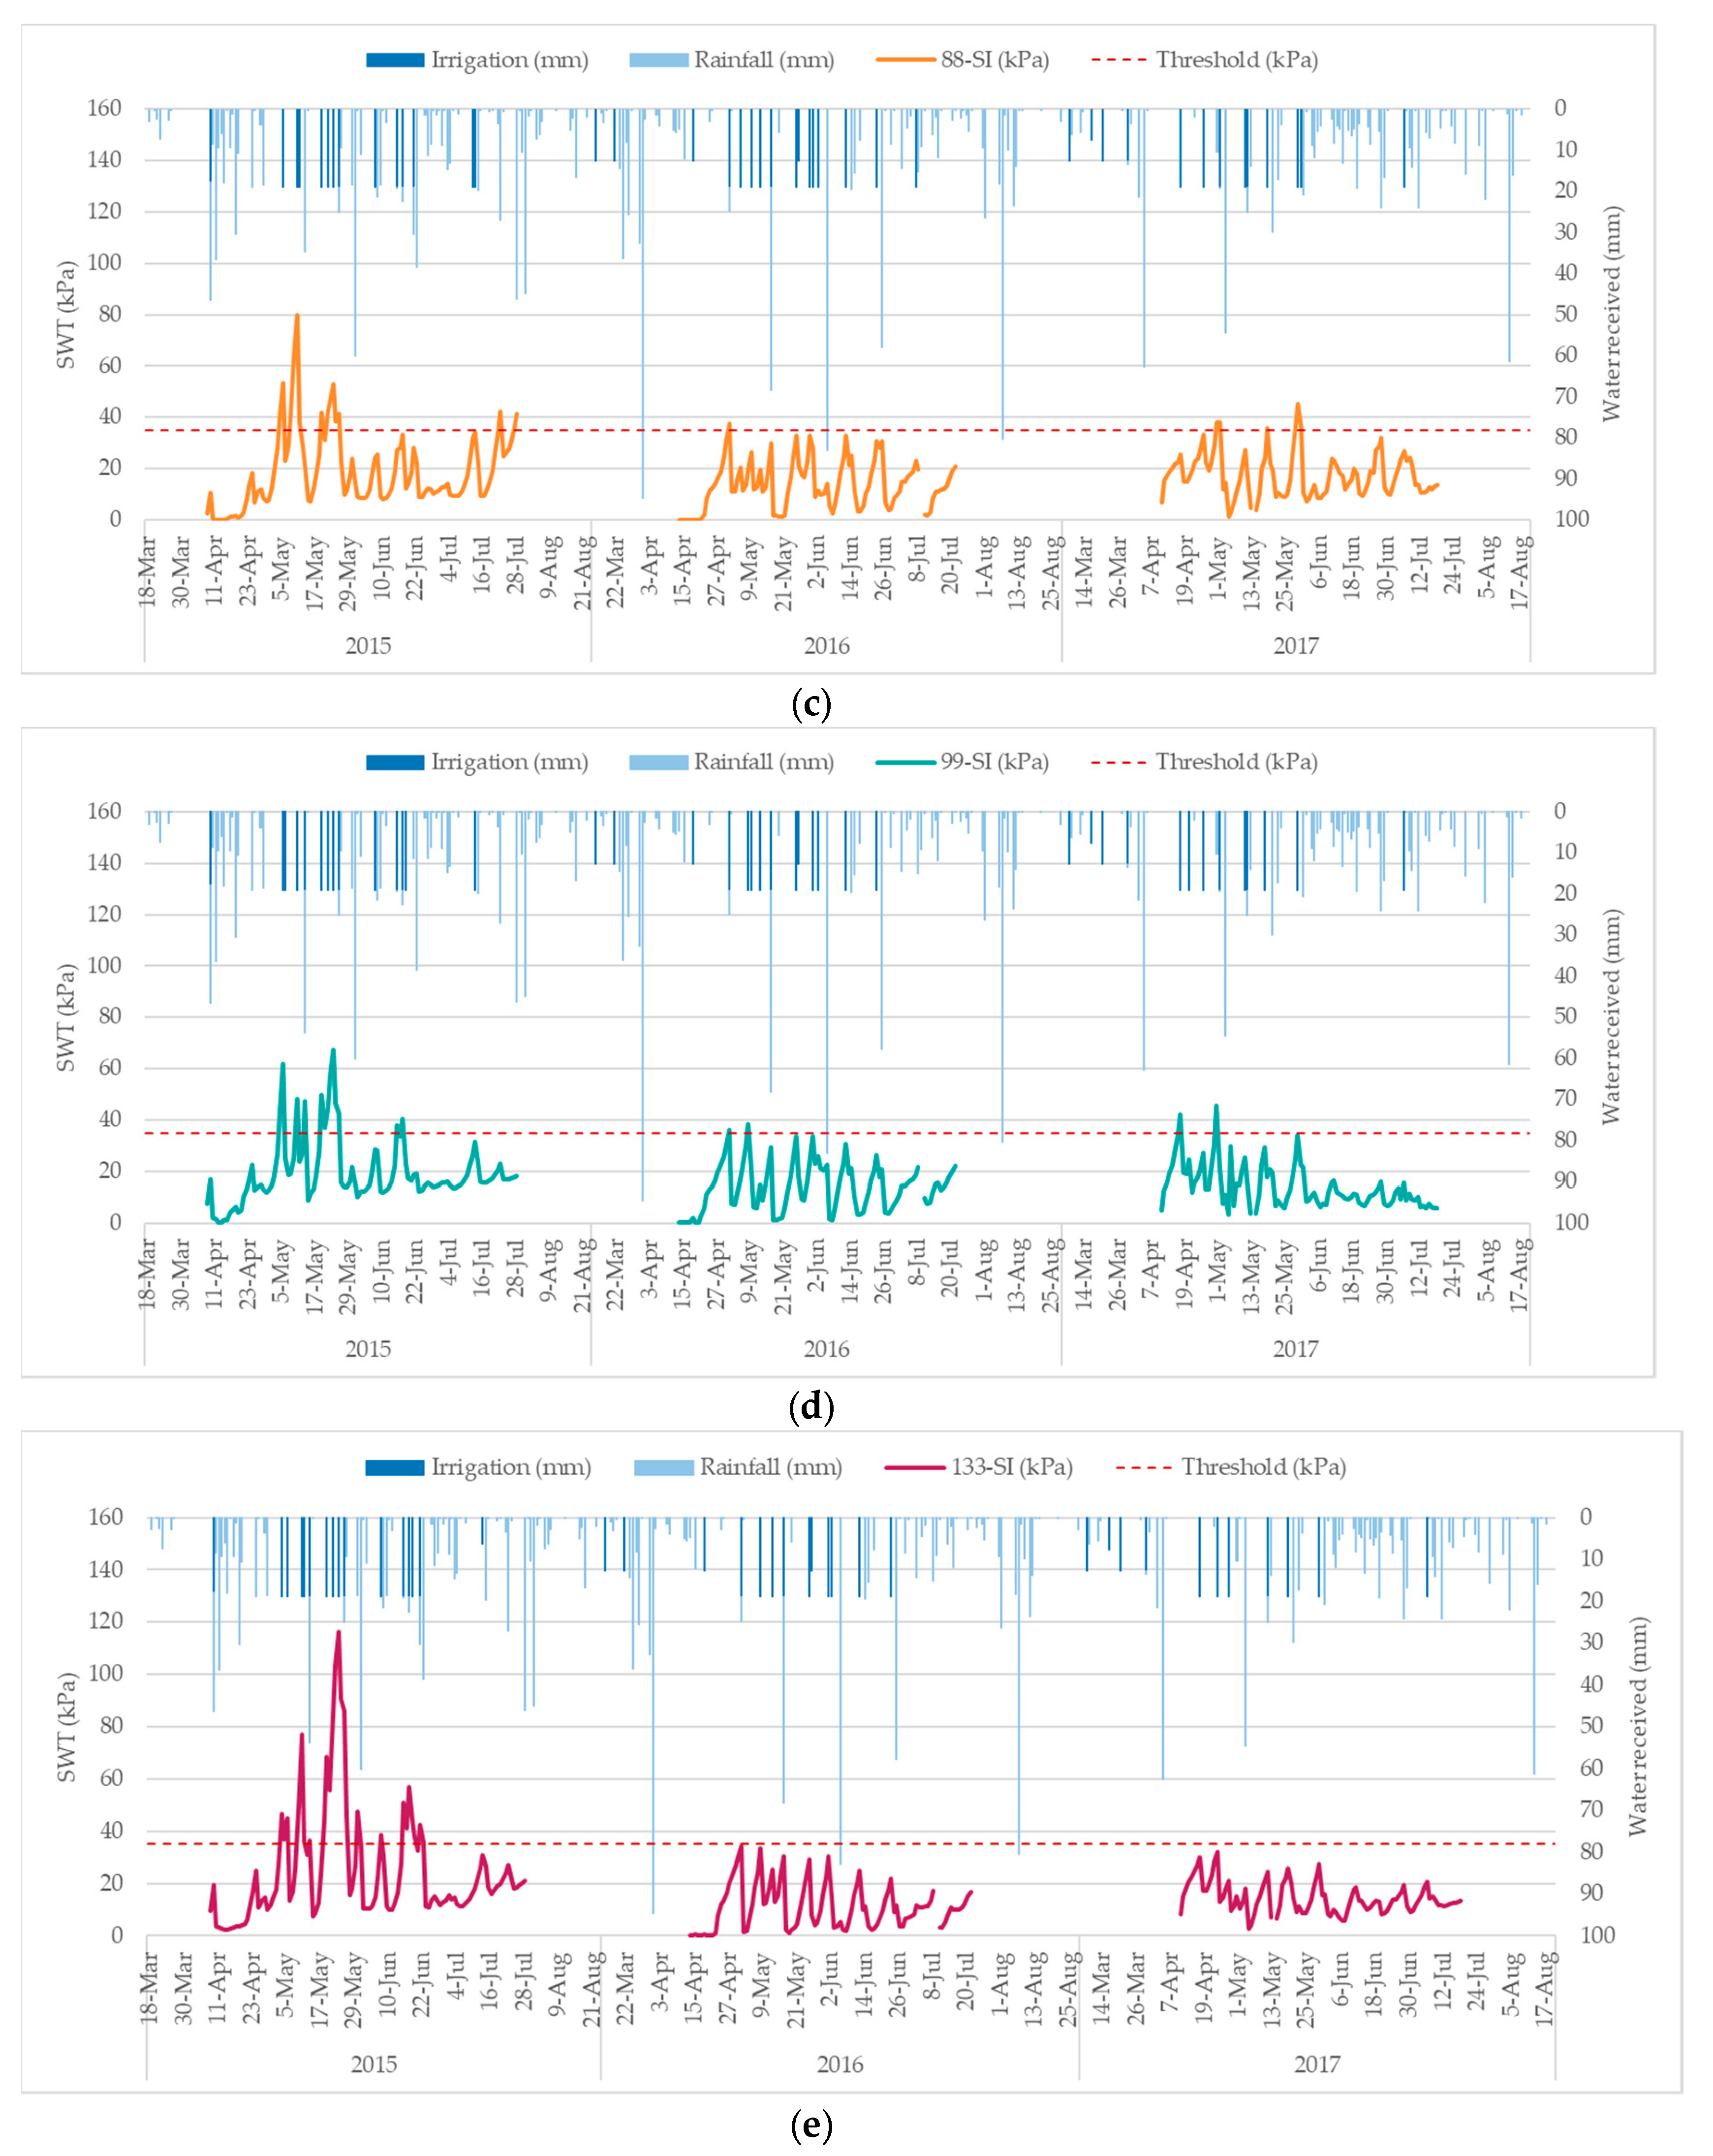
In order to evaluate how the two methods of irrigation scheduling affected soil moisture, SWT data were recorded hourly. It was observed that during the growing seasons, there were some periods that the SWT was above an acceptable threshold for the soil type and maize production [
33]. However, the SWT was kept between 0 kPa to 20 kPa at the RDC field, where the checkbook method was applied, for most of the entirety of the growing seasons. Alternatively, the SWT was kept between 0 kPa to 35 kPa at SIRP field. The SWT was lower in the RDC field because the checkbook method is typically considered very conservative and usually over-applies irrigation, beyond what the plant uses to ensure that irrigation is not the yield limiting factor. Due to this fact, the soil in the RDC field was wetter during all three growing seasons than the soil in the SIRP field. The rainfall received at the RDC field during 2015 was 34 mm less than the amount received at the SIRP field, but the amount of applied irrigation at the RDC field was on average 305 mm more than the amount applied to the SIRP field. Although similar results were observed during the next two years, the differences were not as drastic. These results come in agreement to Filho (2016) study, which was conducted in Alabama and it was observed that 29% more water was applied on average using the checkbook method in comparison to sensor-based method [
49]. These differences suggest that less irrigation could have been applied to the RDC field by following a sensor-based method instead of a checkbook method.
Factors, such as the timing and amount of rainfall, soil texture and water holding capacity, could affect the need for irrigation and therefore the crop biomass and yield [
50,
51]. The fact that there was more rainfall received at SIRP compared to at RDC could have influenced the yield results as well, since there were more periods of clouds covering the sky affecting the solar radiation that plants were receiving. Plants can use only a small part (43%–50%) of the solar radiation spectrum which is reduced proportionally to cloud cover [
4]. However, it is not possible to make a direct comparison between the two fields due to different planting and harvesting dates, but this is something that should be explored in future work.
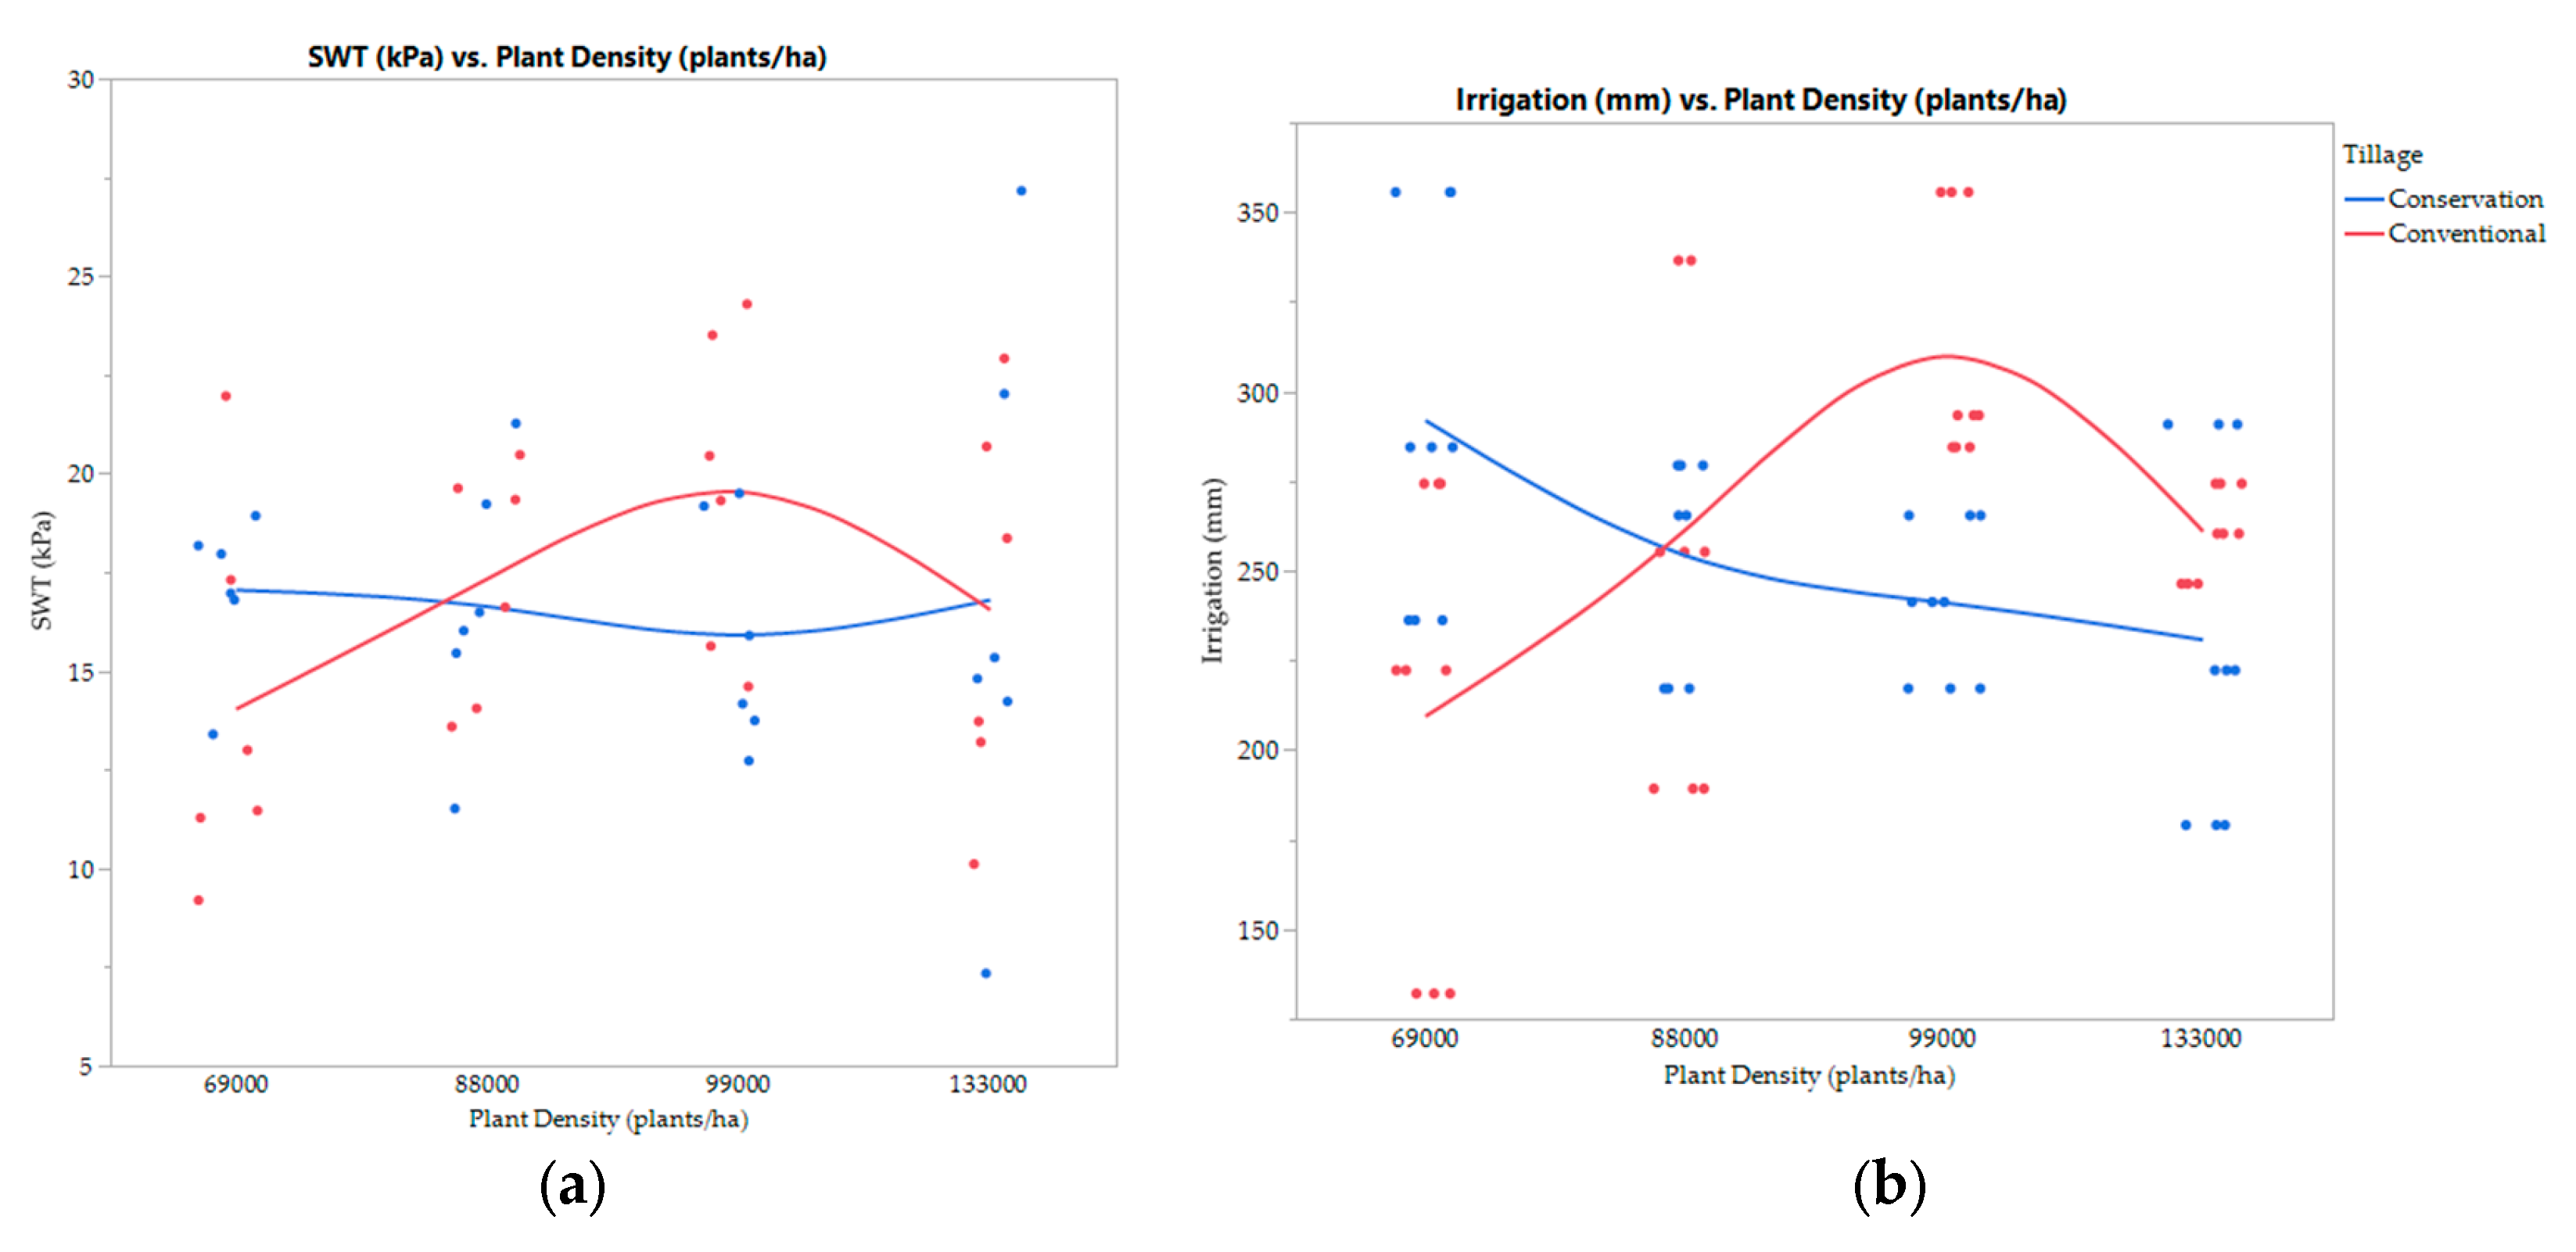
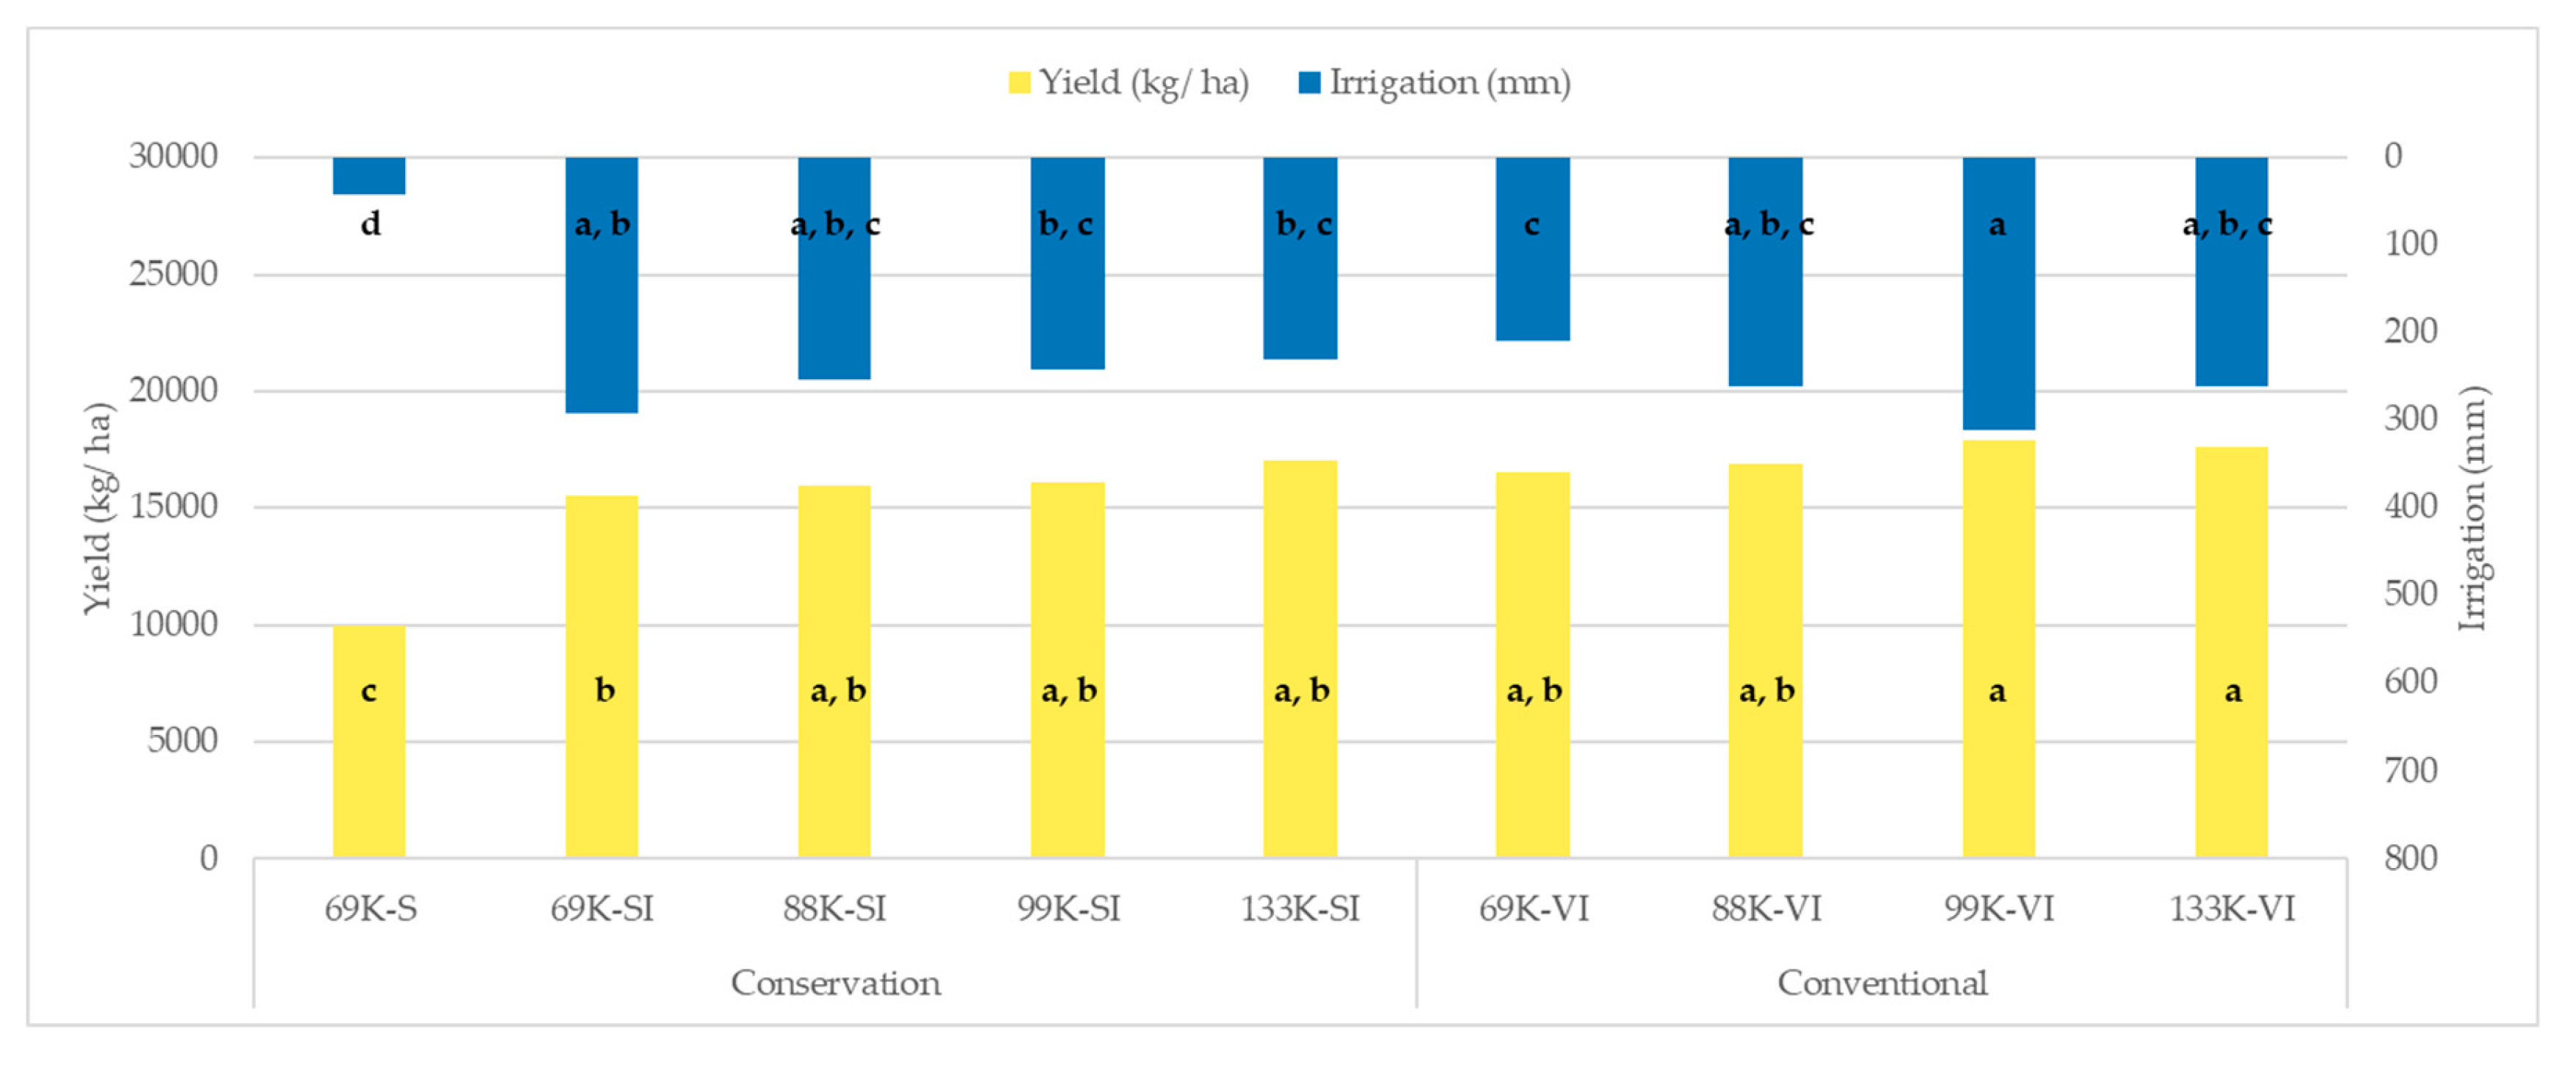
When conservation tillage was utilized, the irrigation requirement was higher in lower plant densities and was reduced as the plant density increased. Contrary to conservation tillage, the conventional tillage treatment required lower irrigation rates at lower densities and had an increasing irrigation requirement for densities up to 99K plants/ha but was reduced for densities higher than 99K plants/ha. Even if each plant density of the conventionally tilled plots produced higher yields than the corresponding treatment within conservation tillage, the differences were not significant in either fields. A study conducted in Kansas from 2004 to 2007 showed that conservation tillage had greater yield results, slightly greater crop water use and retained more soil water during grain filling than conventional tillage [
28]. The benefits of conservation tillage were even greater in terms of grain yield in years when irrigation requirements were greatest [
28]. In south Kansas, a study showed that no-tillage increased grain yield by 0.5 Mg/ha and water productivity by 0.00096 Mg/ha under dryland and deficit-irrigated production [
52]. A study in Iowa showed similar results between conservation and conventional tillage in terms of grain yield and water productivity [
53].
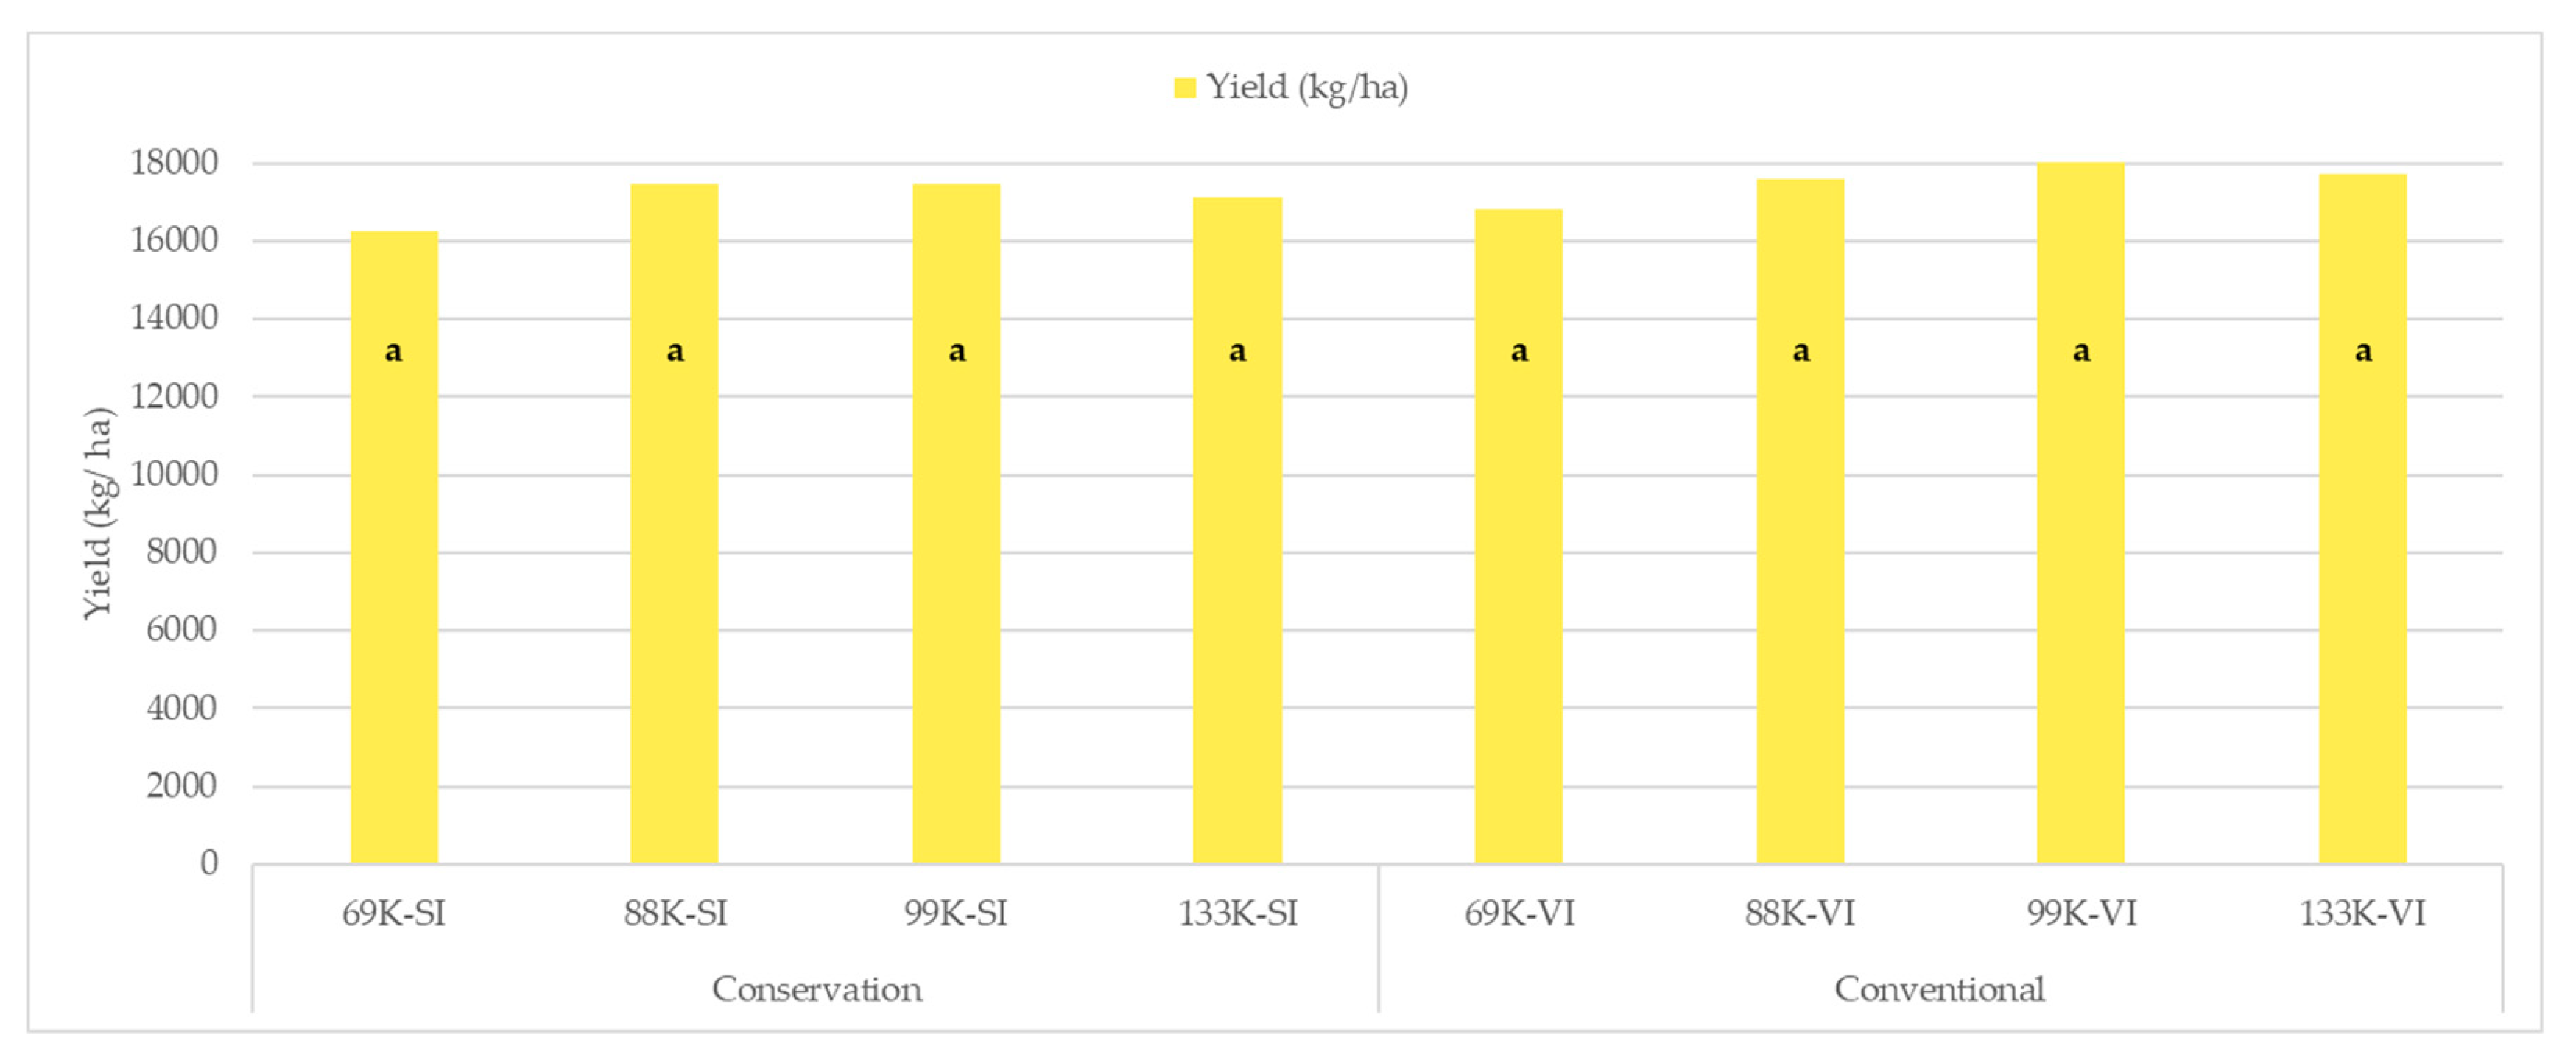
Furthermore, it was observed that lower plant densities were able to have higher yield results in comparison to higher plant densities, which was observed in both fields by comparing the treatments individually within the years and the average yield of the three years together. Based on these results, higher plant densities, i.e., more plants per hectares, does not necessarily favor higher maize yields for the row configuration applied in this project. Maize was planted in wide rows (~1 m) and when the plant density was increased, the space between plants in the same row was decreased (intra-row competition). When high plant densities are utilized, plant distribution can be a limiting factor in wide rows minimizing yield potential [
54]. Narrow rows would help to achieve equidistance space between maize plants [
55] which would result to more efficient use of light and less soil evaporation [
56]. Additionally, higher plant densities do not always require more water as the results from the SIRP field showed, which comes in contradiction to Tetio-Kagho and Gardner (1988) who stated that higher plant densities could increase water consumption because leaf area index is increased [
57]. However, the results of Lamm et al. [
28] showed that by increasing the plant density from 66K to 82K plant/ha had favorable results in grain yield but it did not increase seasonal water use while it increased water productivity.
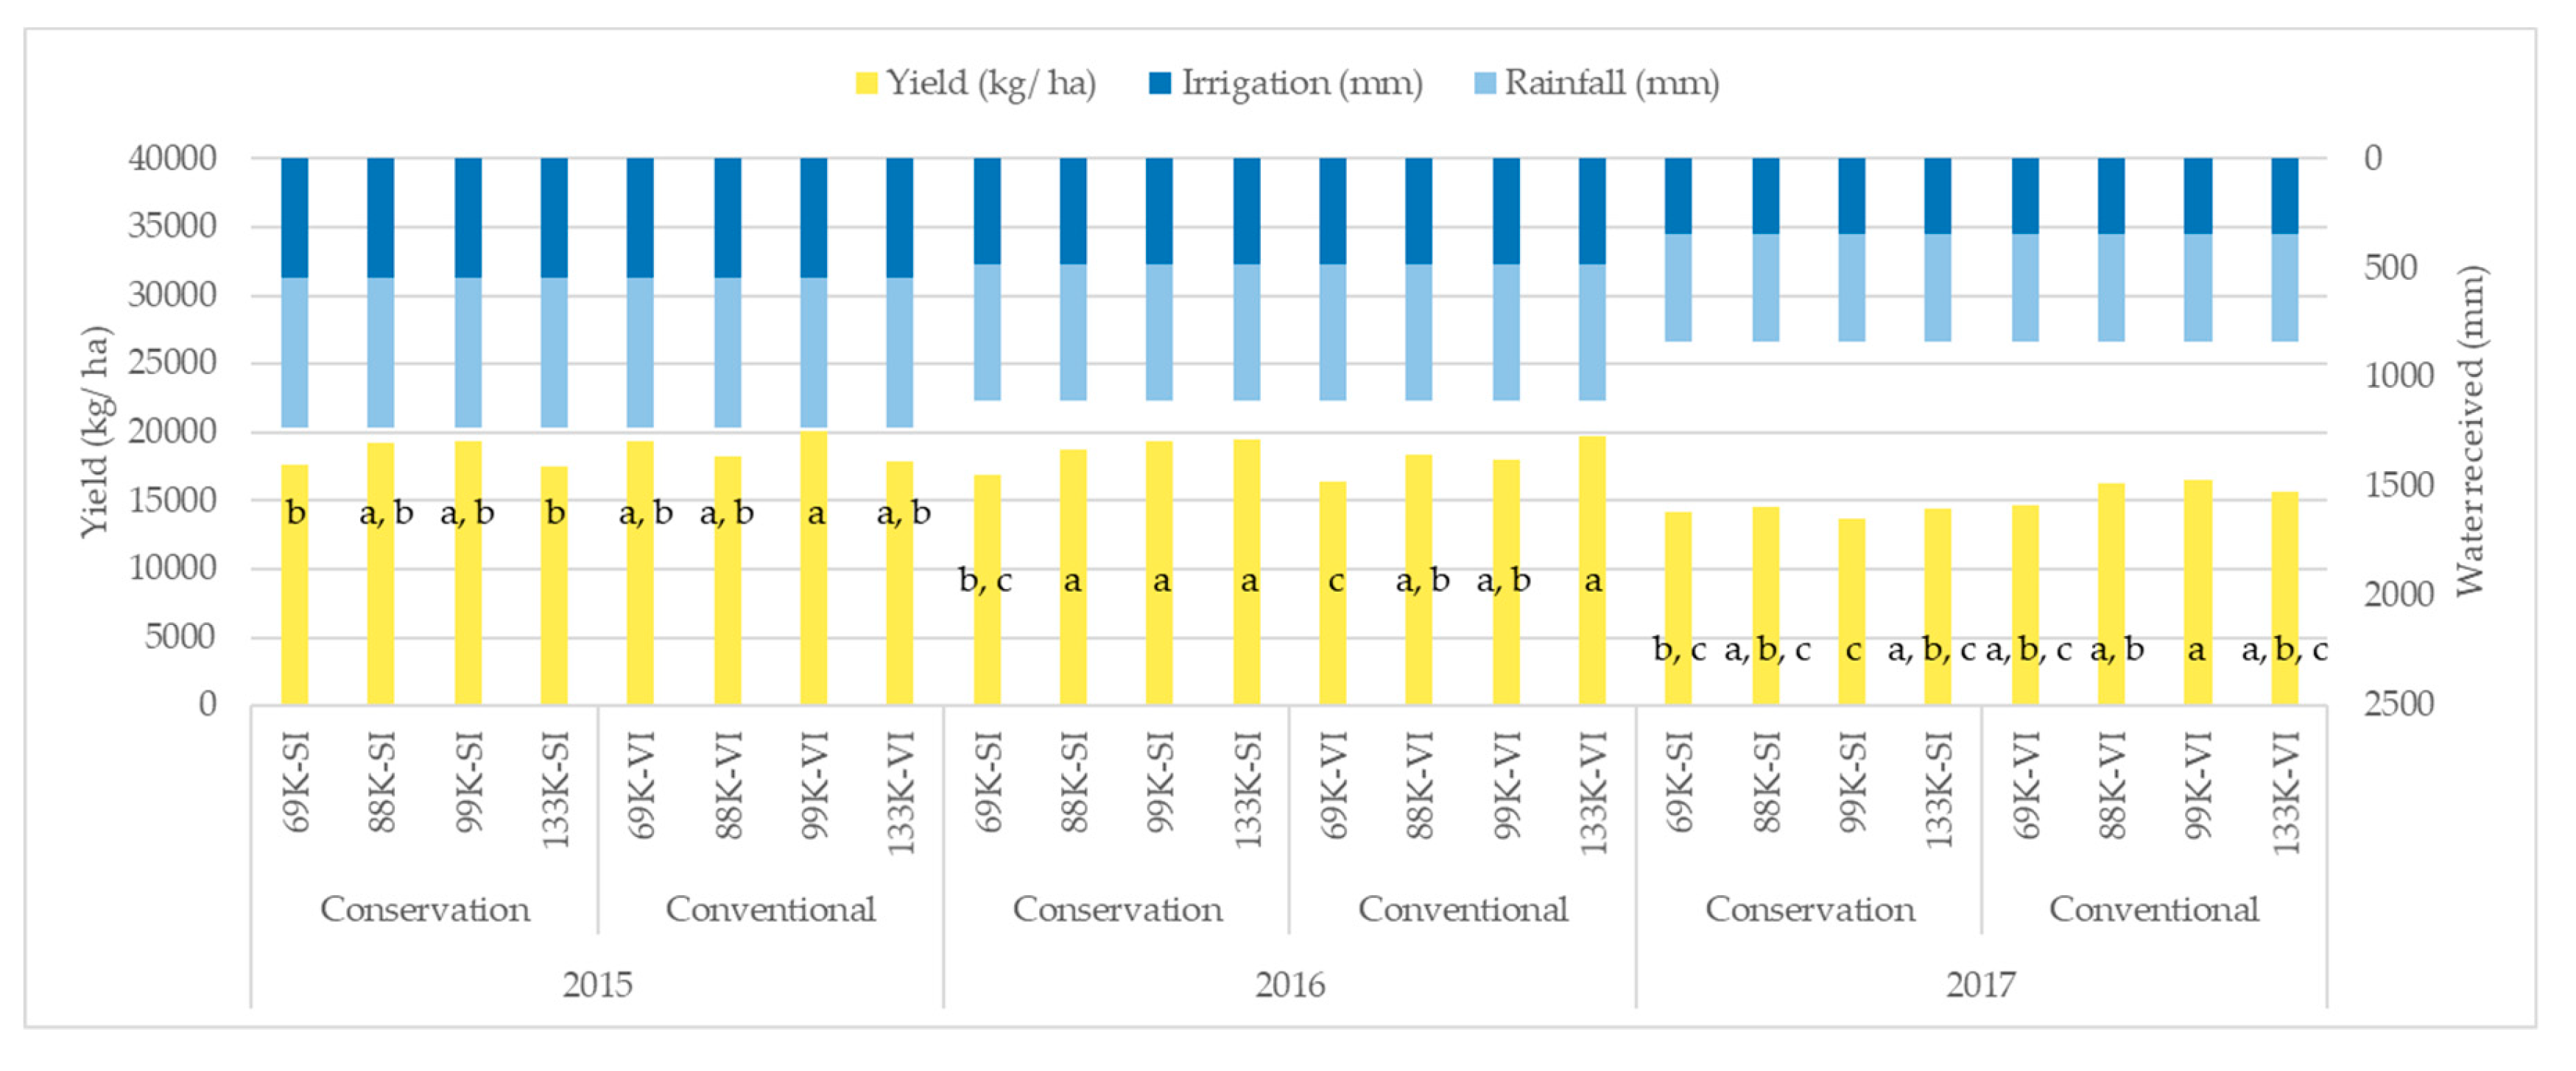
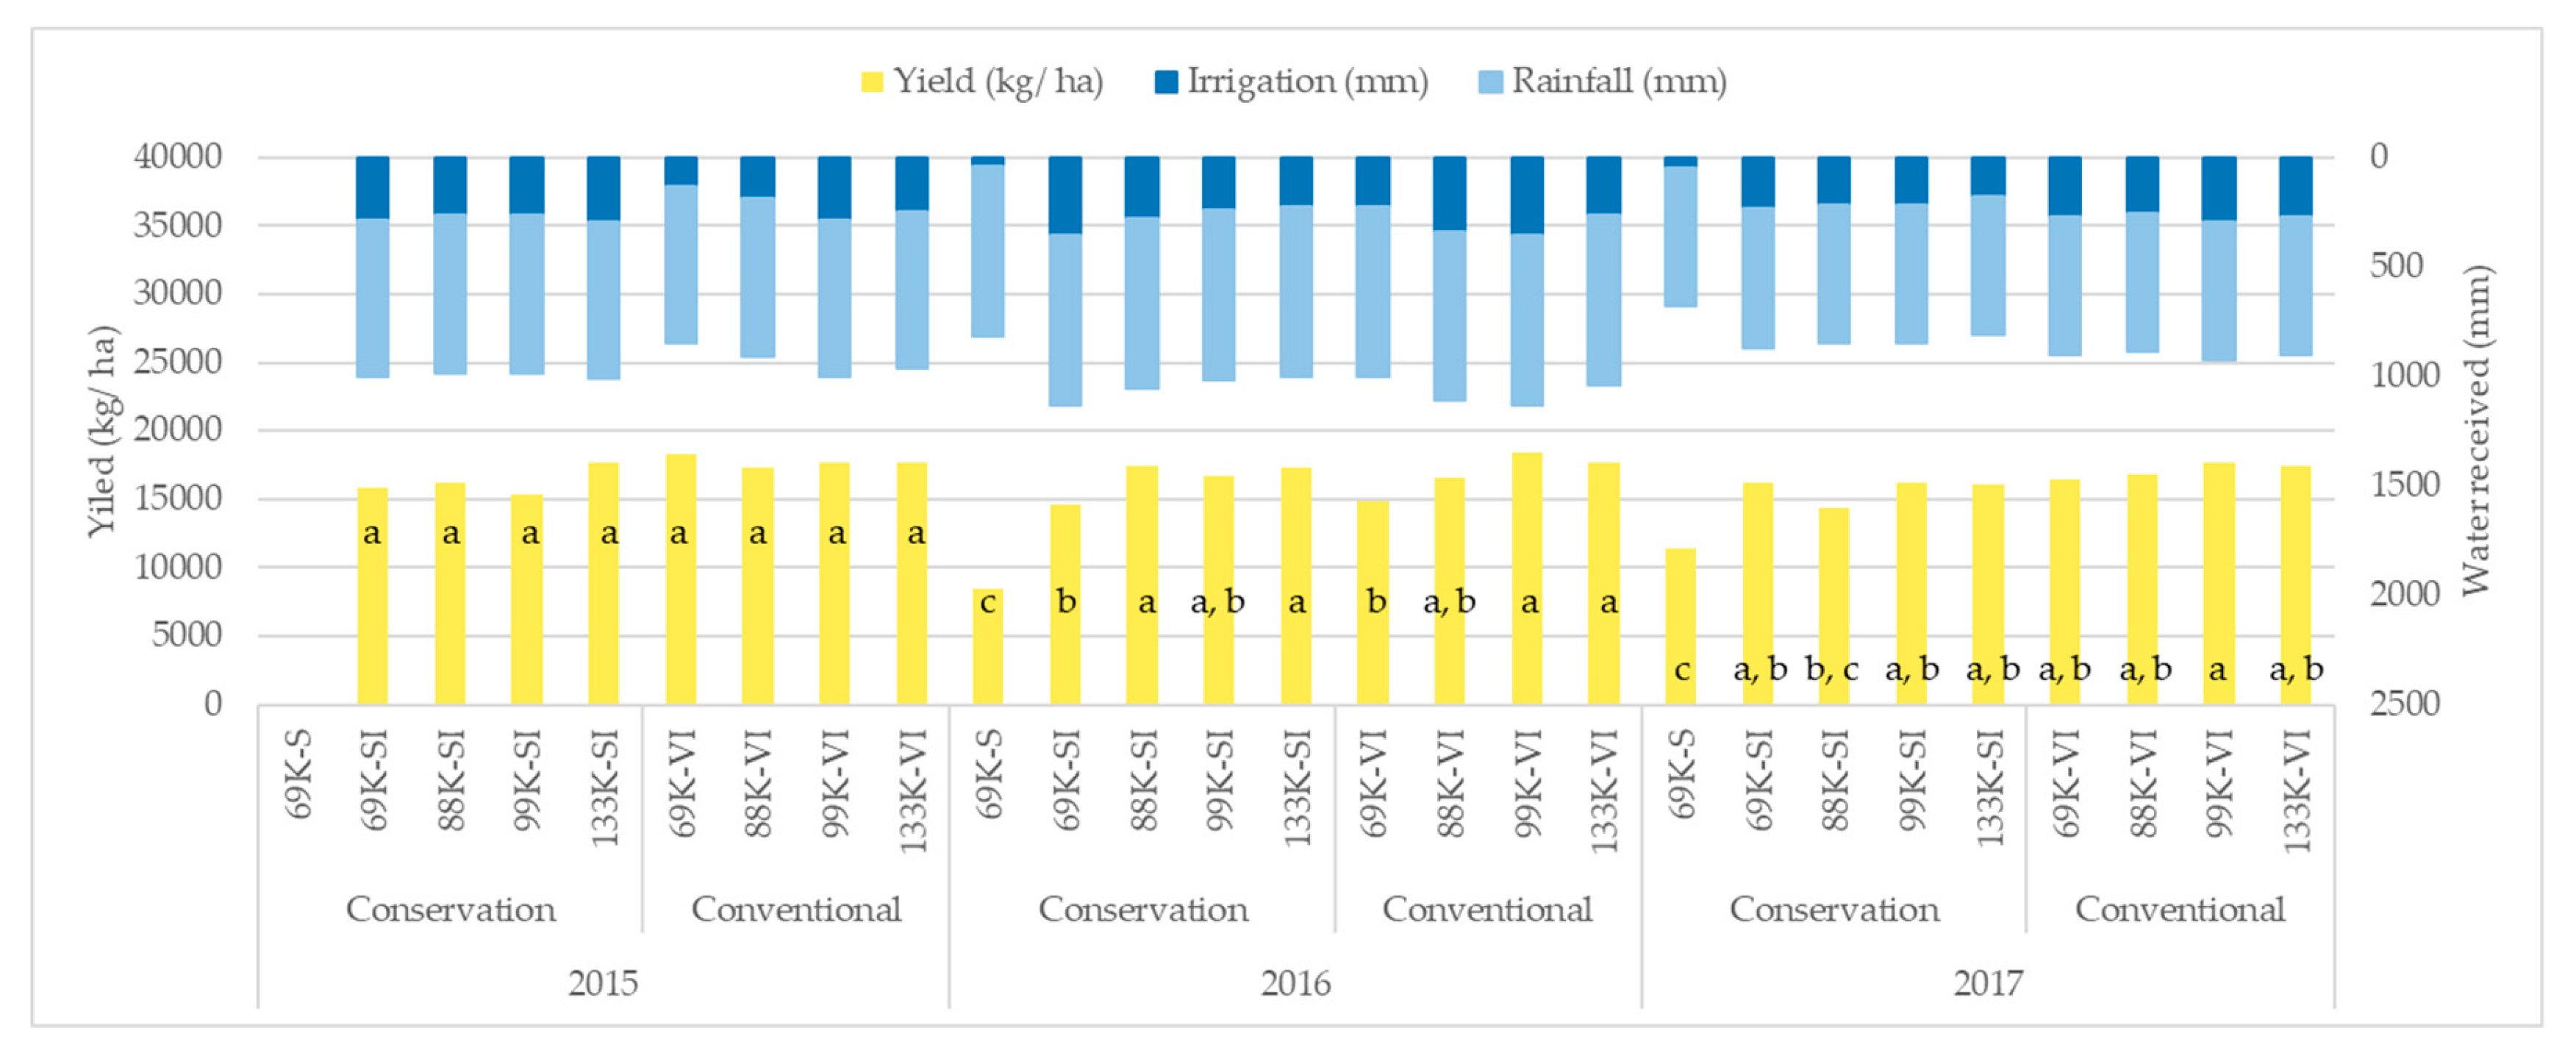
The amount of irrigation applied can have significant effects on the final yield as it has already been mentioned about the non-irrigated treatment producing significantly lower yields compared to the irrigated treatments. A general conclusion from the RDC field is that more irrigation can produce higher yield results. More water was received during the 2015 and 2016 growing seasons, either through irrigation or rainfall, when compared to the 2017 growing season, and the treatments produced higher maize yields during the first two years than the third. This agrees with the results of Fang and Su (2019), which showed that plots received the highest irrigation achieved higher yields in comparison to other treatments that less irrigation was applied [
58]. However, by comparing the same treatments between the years it was observed that more water did not necessarily mean higher yields. For example, in the conservation tillage the 133K plants/ha treatment produced more yield in 2016 than in 2015 when it received more water. This pattern can be seen easier in the SIRP field where treatment-based irrigation scheduling was applied based on the SWT data received from soil moisture sensors. Either by comparing the treatments within the years or the year average yields and irrigation, it is obvious that more water does not always lead to higher yields. Moreover, the statistical analysis shows that most of the yield results are not significantly different between each other in contradiction to the irrigation results. For instance, between the conventionally tilled treatments the 99K plant/ha produced the highest yield in comparison to the 69K plants/ha, which produced the lowest yield, but those results are not statistically different. However, the amount of applied irrigation to these two treatments is statistically different, with the 69K plants/ha treatment receiving less than the 99K plants/ha treatment. This is another indication that it is possible to achieve good yield results without applying large amounts of water through irrigation.
5. Conclusions
A three-year project between 2015 and 2017 was conducted at two sites in Georgia, U.S.A. in order to examine how different tillage methods and plant densities affect the final yield results based on to the method chosen for scheduling irrigation. The RDC and SIRP fields were the two sites located in Tifton and Camilla, GA, USA respectively. The maize hybrid P1916YHR (Pioneer, Johnston, IA, USA) was chosen and planted into conservation and conventional tilled plots at plant densities of 69K, 88K, 99K, and 133 plants/ha. The UGA checkbook method, which is based on historical evapotranspiration data and current rainfall, was utilized for making irrigation scheduling decisions at the RDC field and a SWT sensor-based method, which obtained data by soil moisture sensors located at 20 cm, 41 cm, and 61 cm deep in the soil, was utilized for making irrigation scheduling decisions at the SIRP field.
Both the checkbook and sensor-based methods had similar yield results. However, in the case of the checkbook method more irrigation is usually applied in wet years and less in dry years, because it is based on historical evapotranspiration data. Alternatively, the sensor-based method measured the SWT of the soil in real time and provided valuable insights to better match the irrigation applications to the crop requirements. Even if irrigation is important for increasing maize yield production, as it was shown by comparing the dryland treatment to the irrigated ones, it was observed that there was not a linear relationship between the amount of water applied through irrigation and yield. Thus, increasing the amount of irrigation does not necessarily mean higher yields.
Furthermore, it was observed that higher populations do not necessarily require higher irrigation amounts and they do not always have favorable results in terms of yield. In both fields, the plant density of 99K plants/ha produced the highest yield in comparison to the other treatments. However, this difference was not statistically significant, which means that by choosing another treatment, such as the 88K plants/ha which required less water than the 99K plants/ha, may be a more profitable option.
In most cases the conventional tillage plots produced higher yield in comparison to conservation plots. However, the differences between them were not statistically significant, which leads to the conclusion that conservation tillage could be a good solution for farmers, not only for preserving water, but also for achieving acceptable yield results.


