

Research on Temporal and Spatial Differentiation and Impact Paths of Agricultural Grey Water Footprints in the Yellow River Basin


Abstract
:1. Introduction
2. Research Methods and Data Sources
2.1. Research Methods
2.1.1. Agricultural Grey Water Footprint
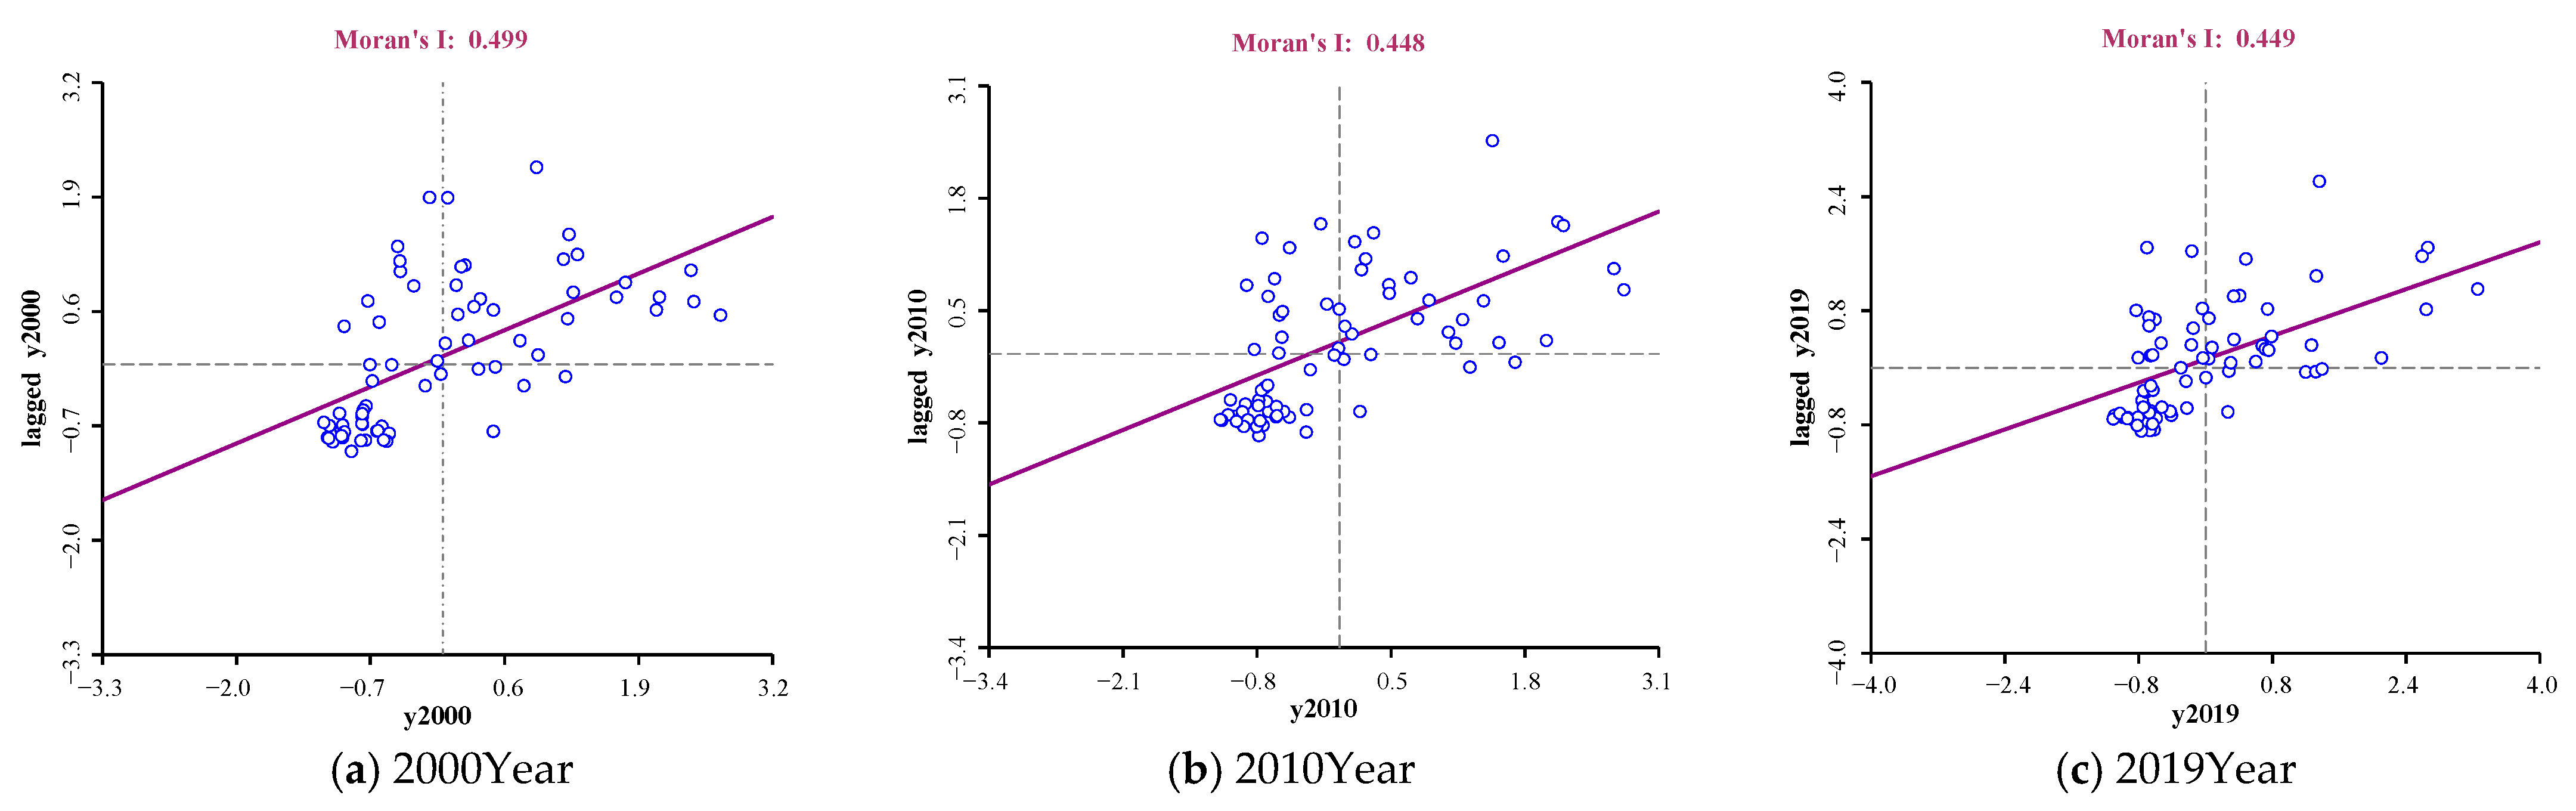
2.1.2. Spatial Autocorrelation Analysis Method
- (1)
- Global spatial autocorrelation (global Moran’s I)
- (2)
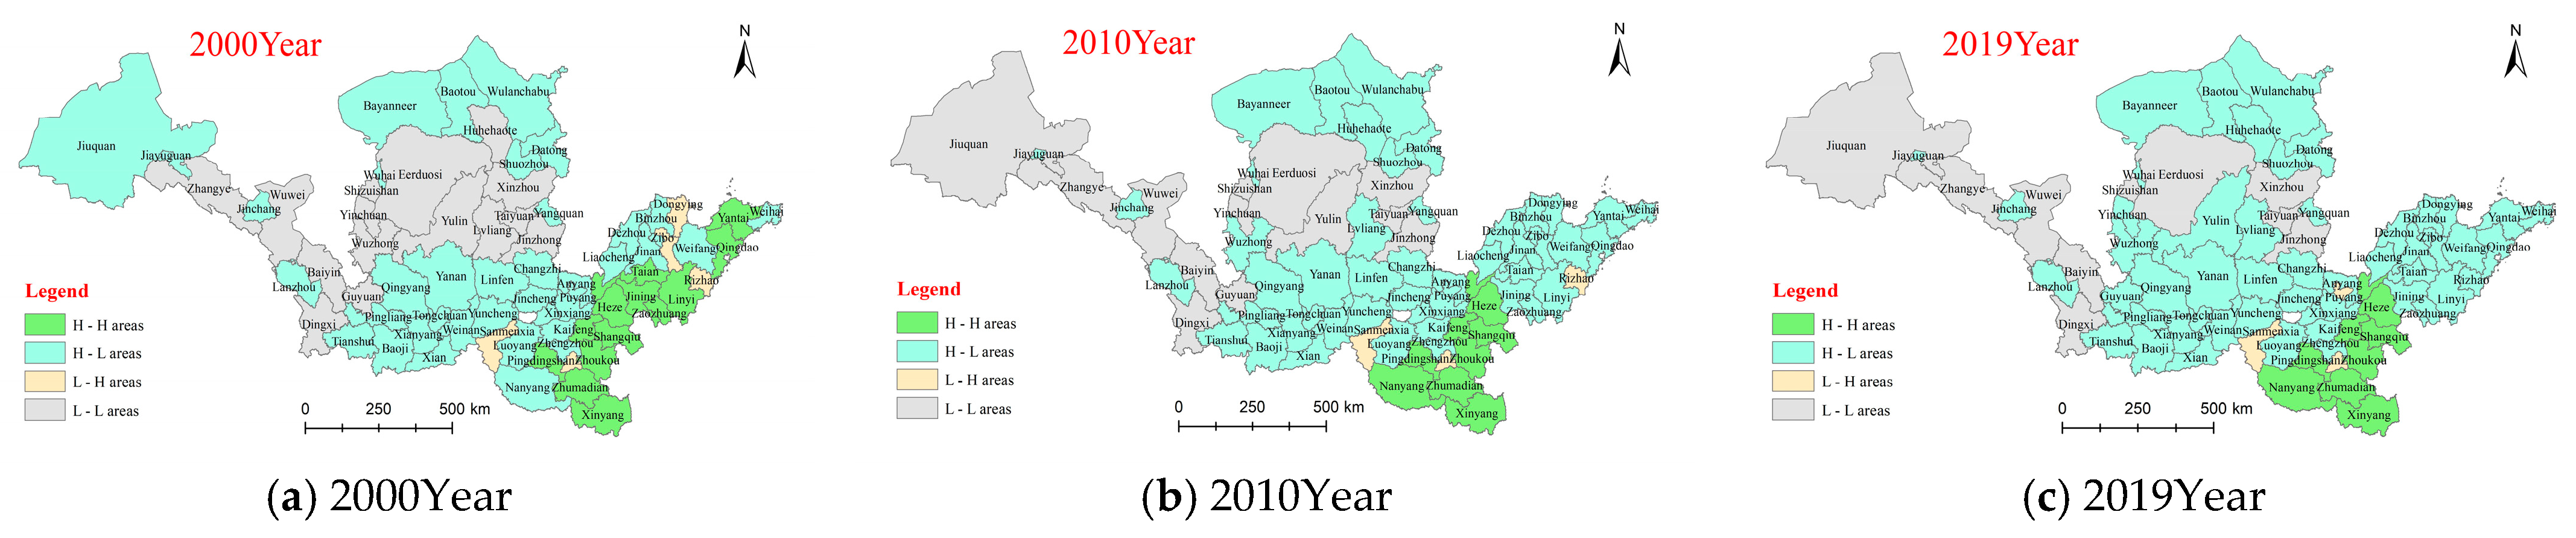
- Local spatial autocorrelation (local Moran’s I)
2.1.3. Spatial Transition Method
2.1.4. Path Analysis
2.2. Data Sources
3. Results Analysis
3.1. Calculation Results of
3.2. Spatial and Temporal Characteristics of the in the Yellow River Basin
3.3. Analysis of Influencing Factors of the
4. Conclusions and Suggestions
4.1. Conclusions
- (1)
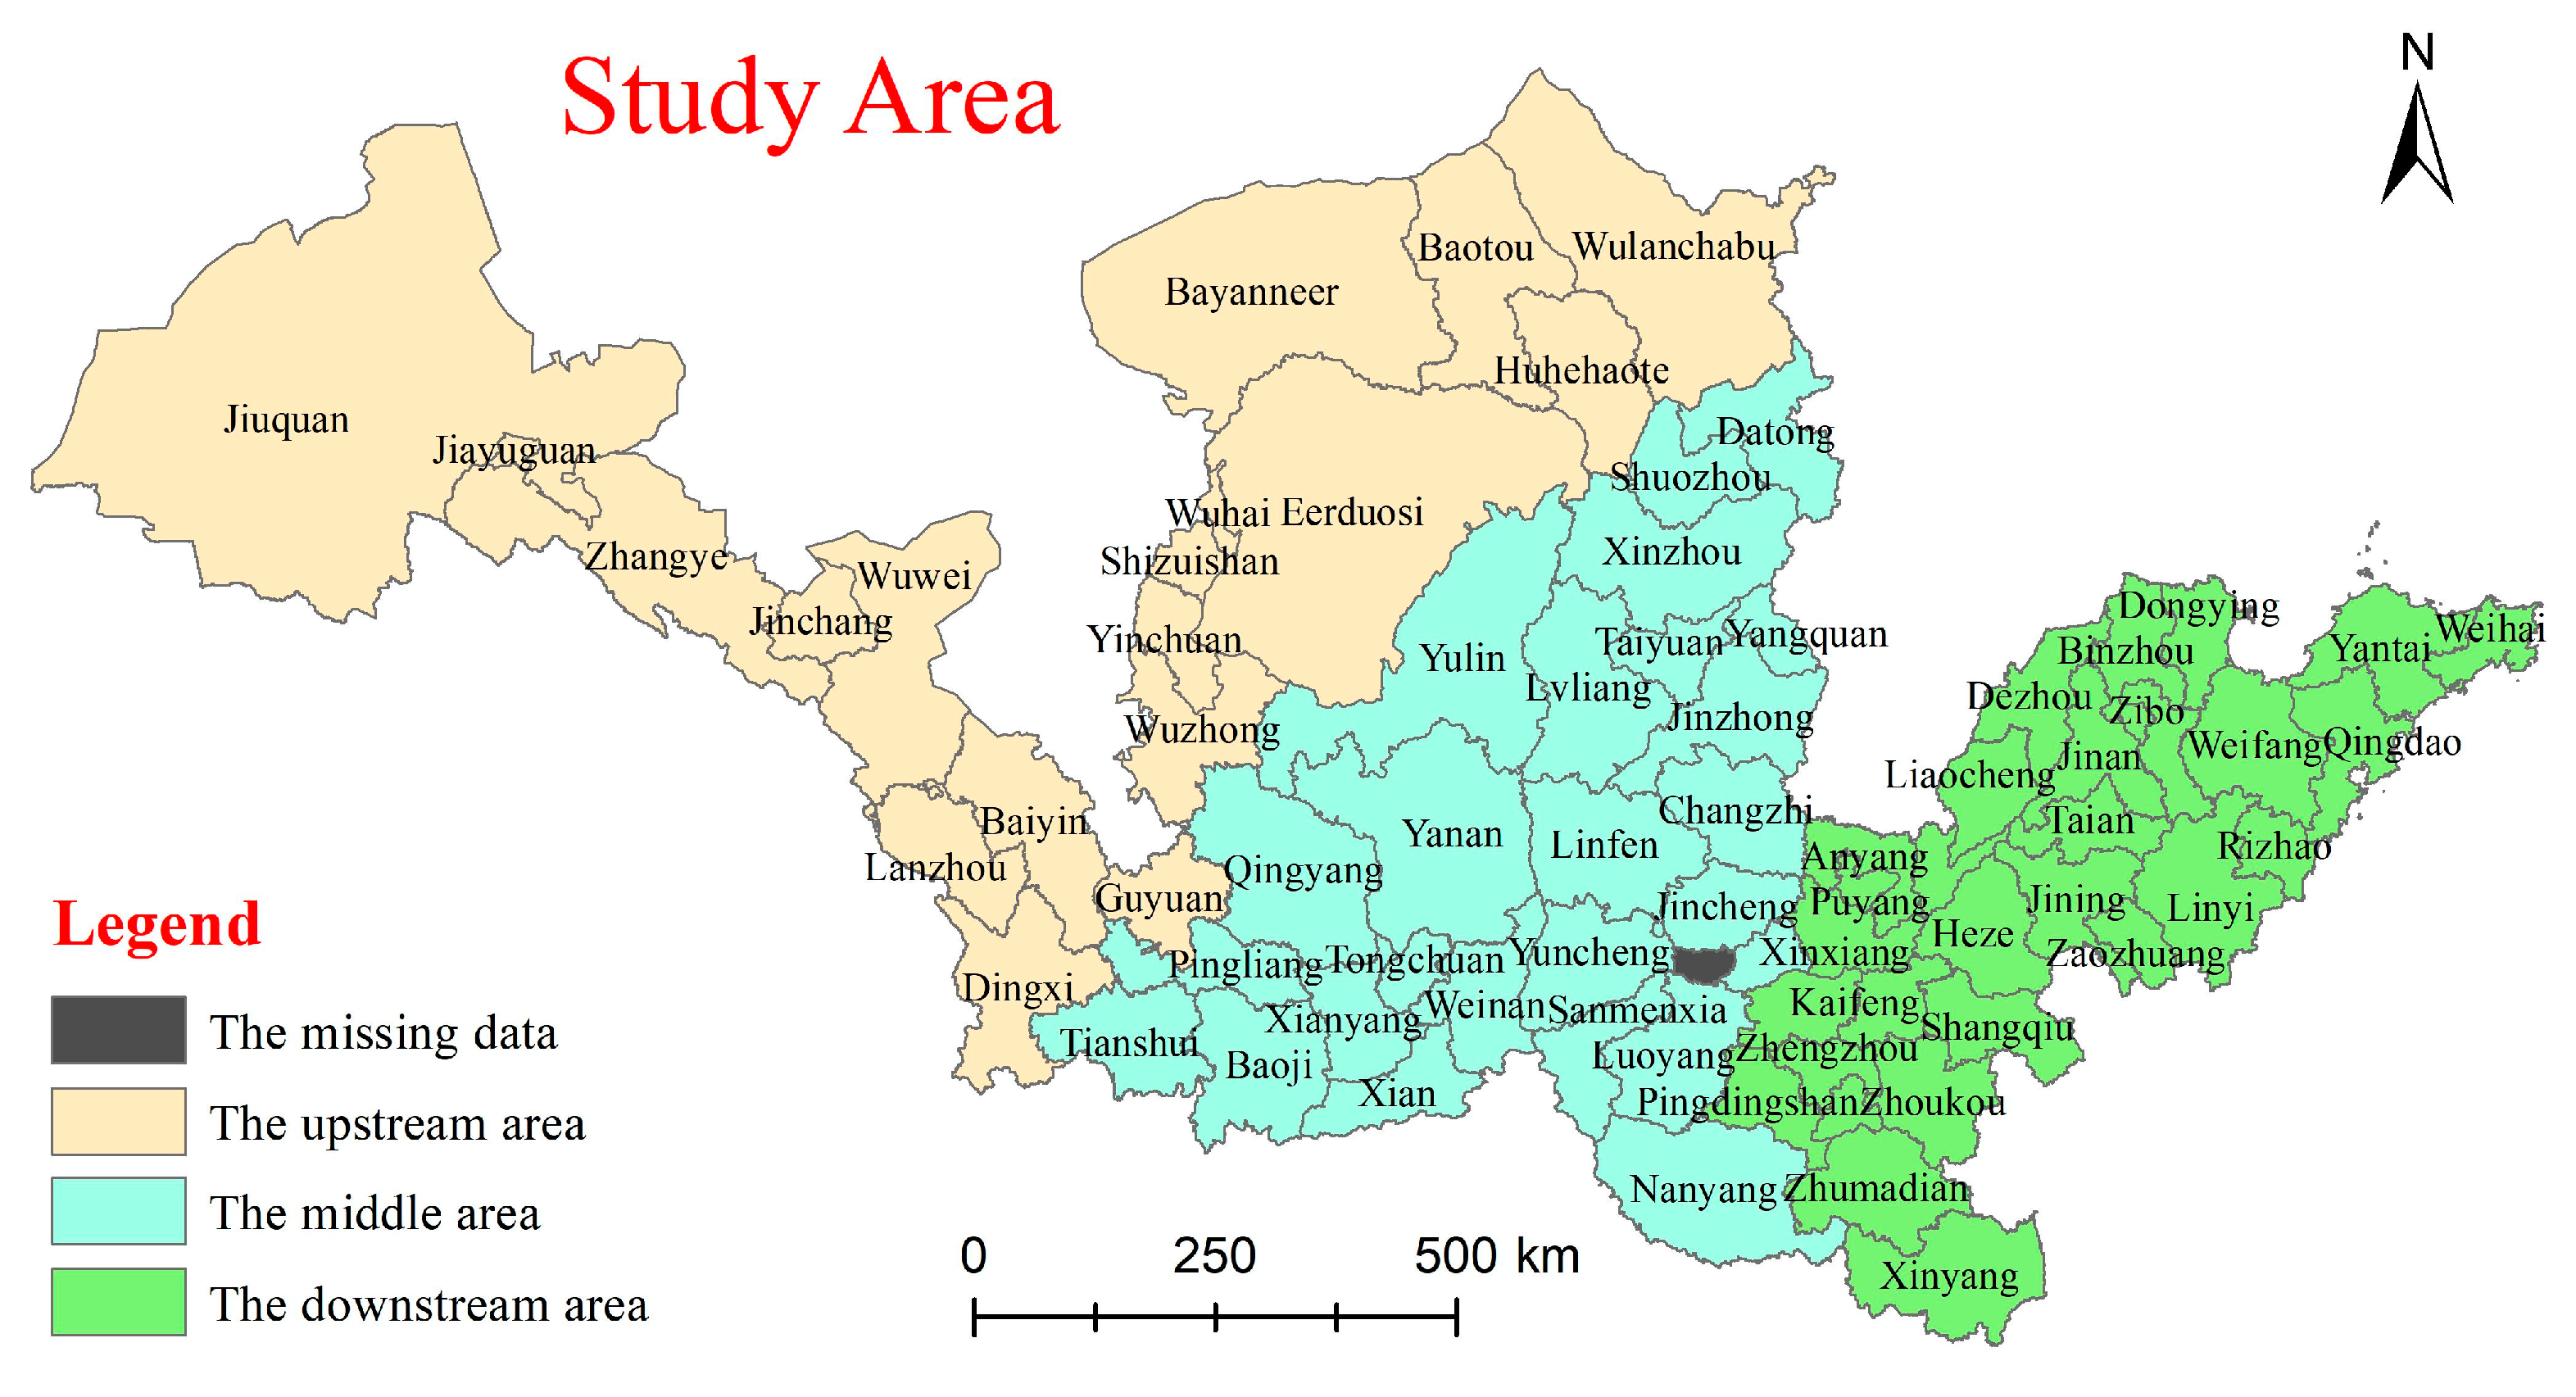
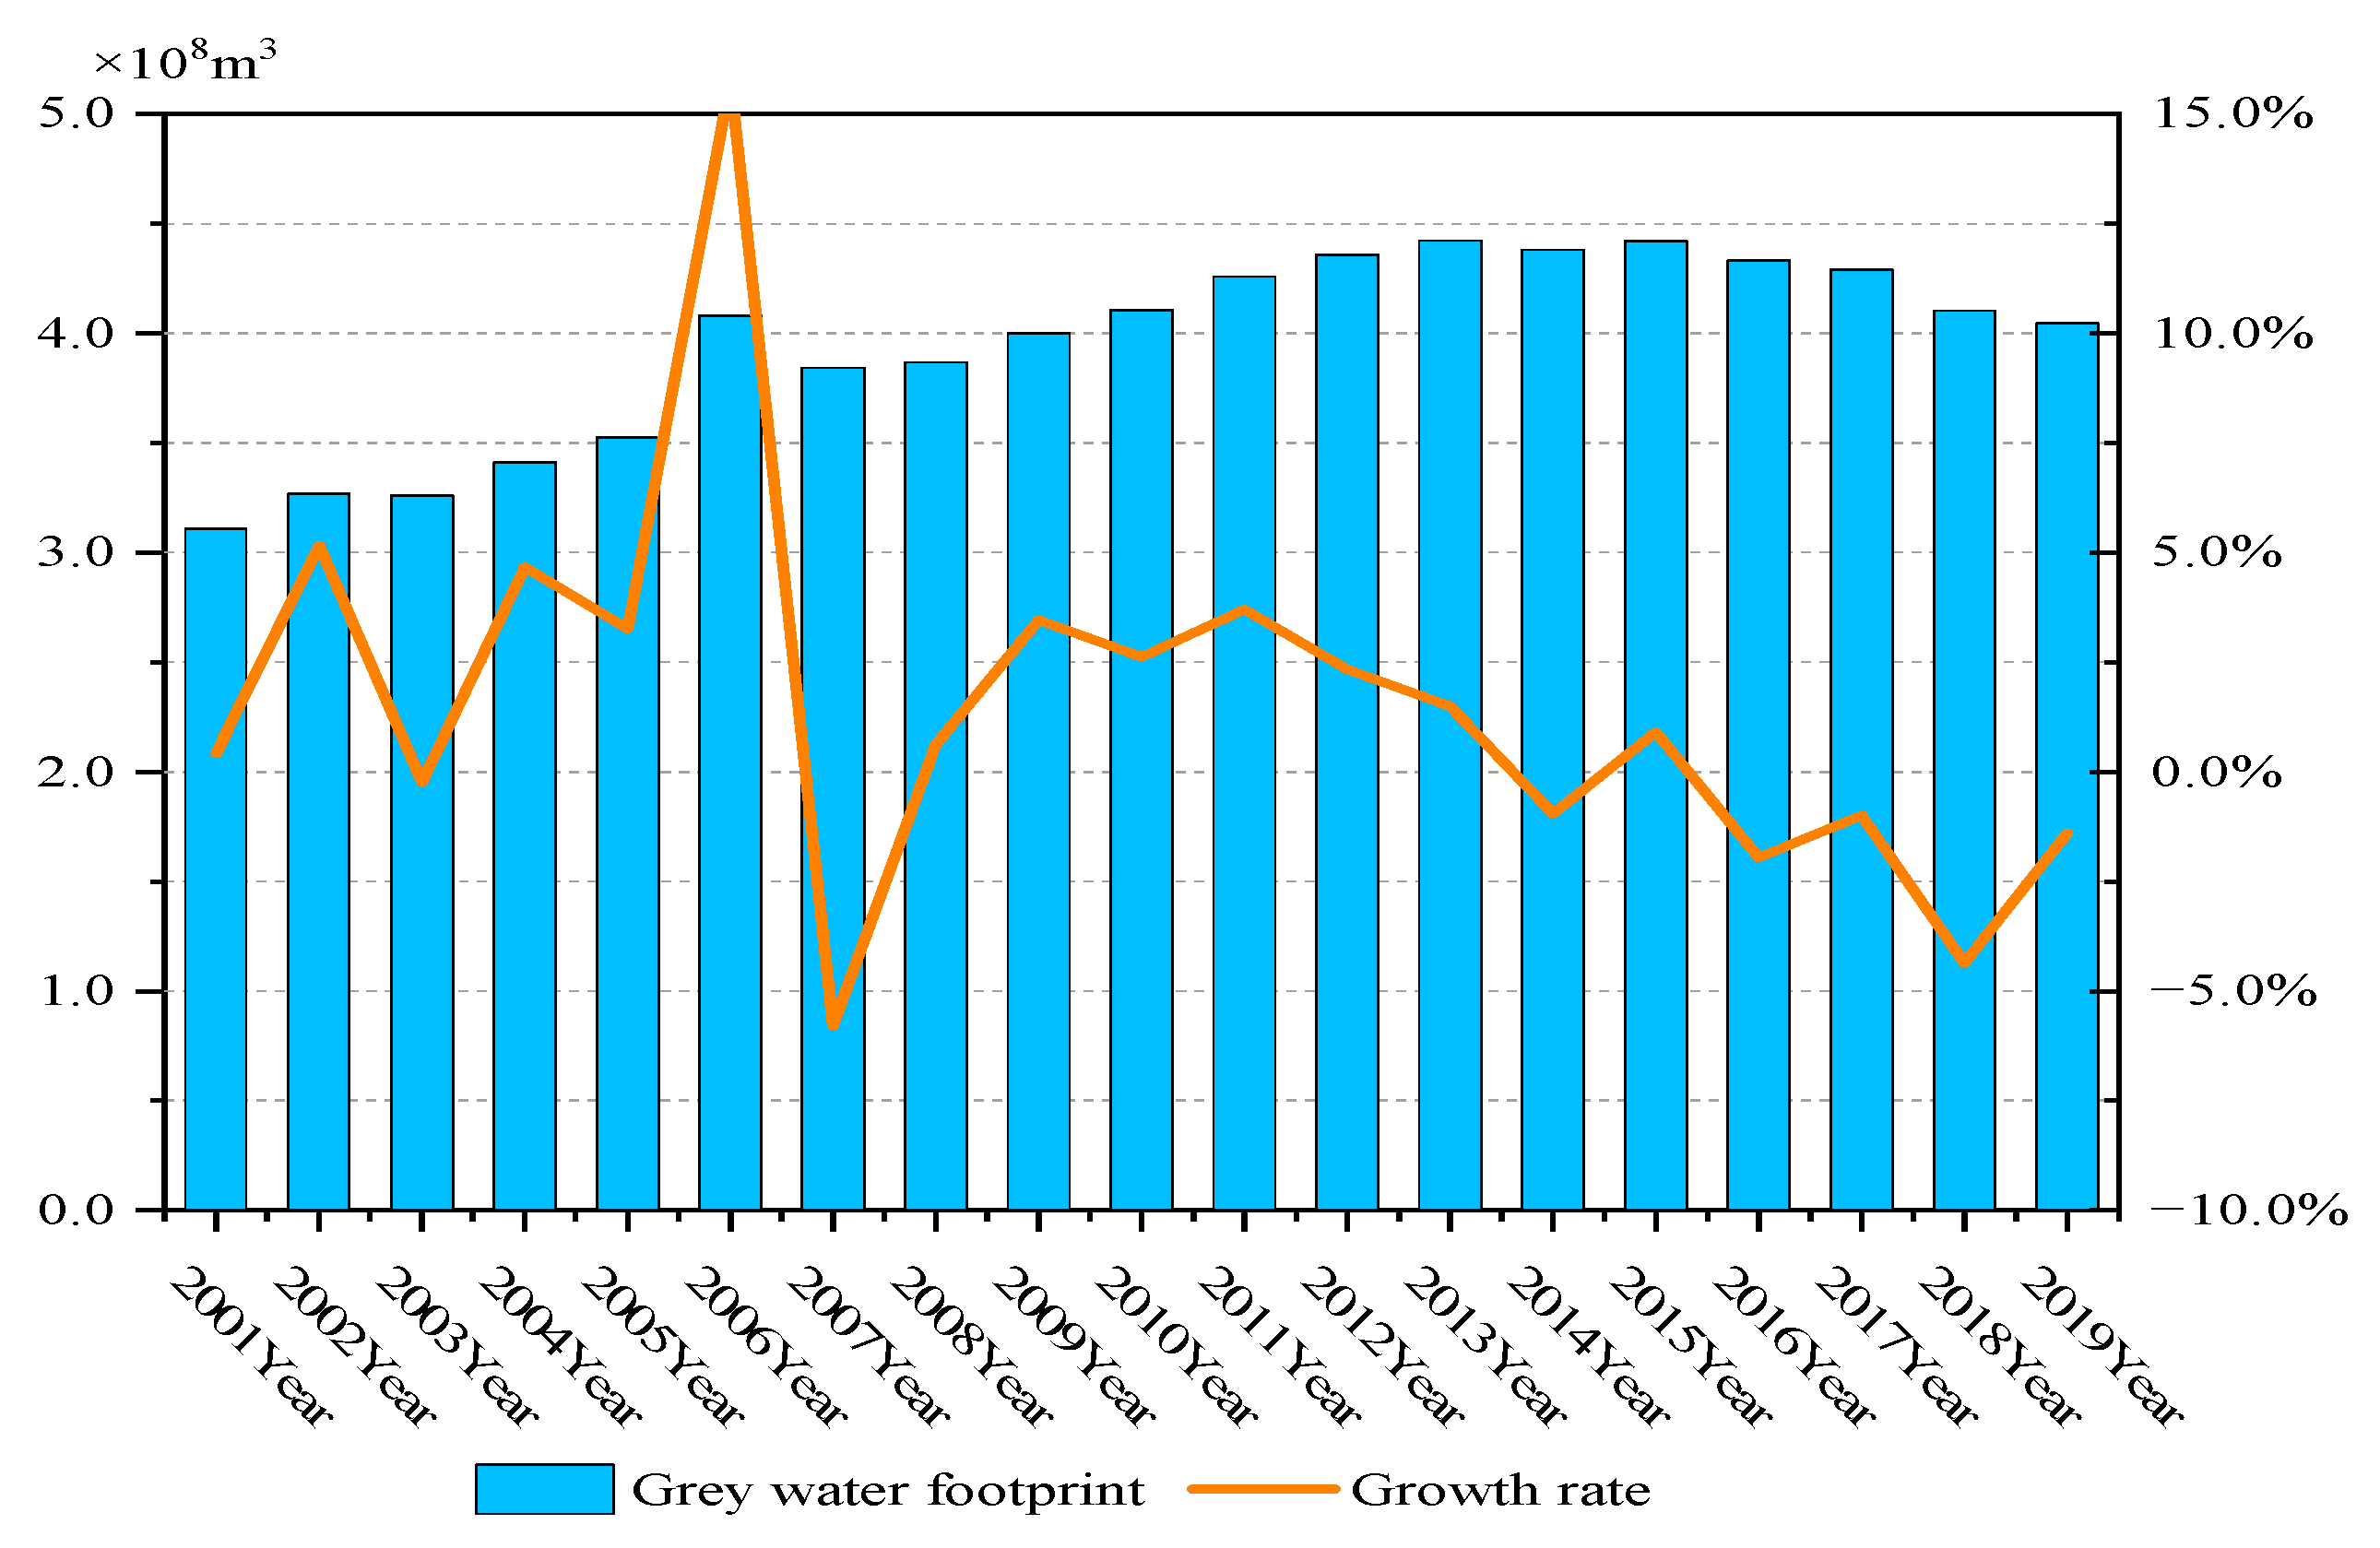
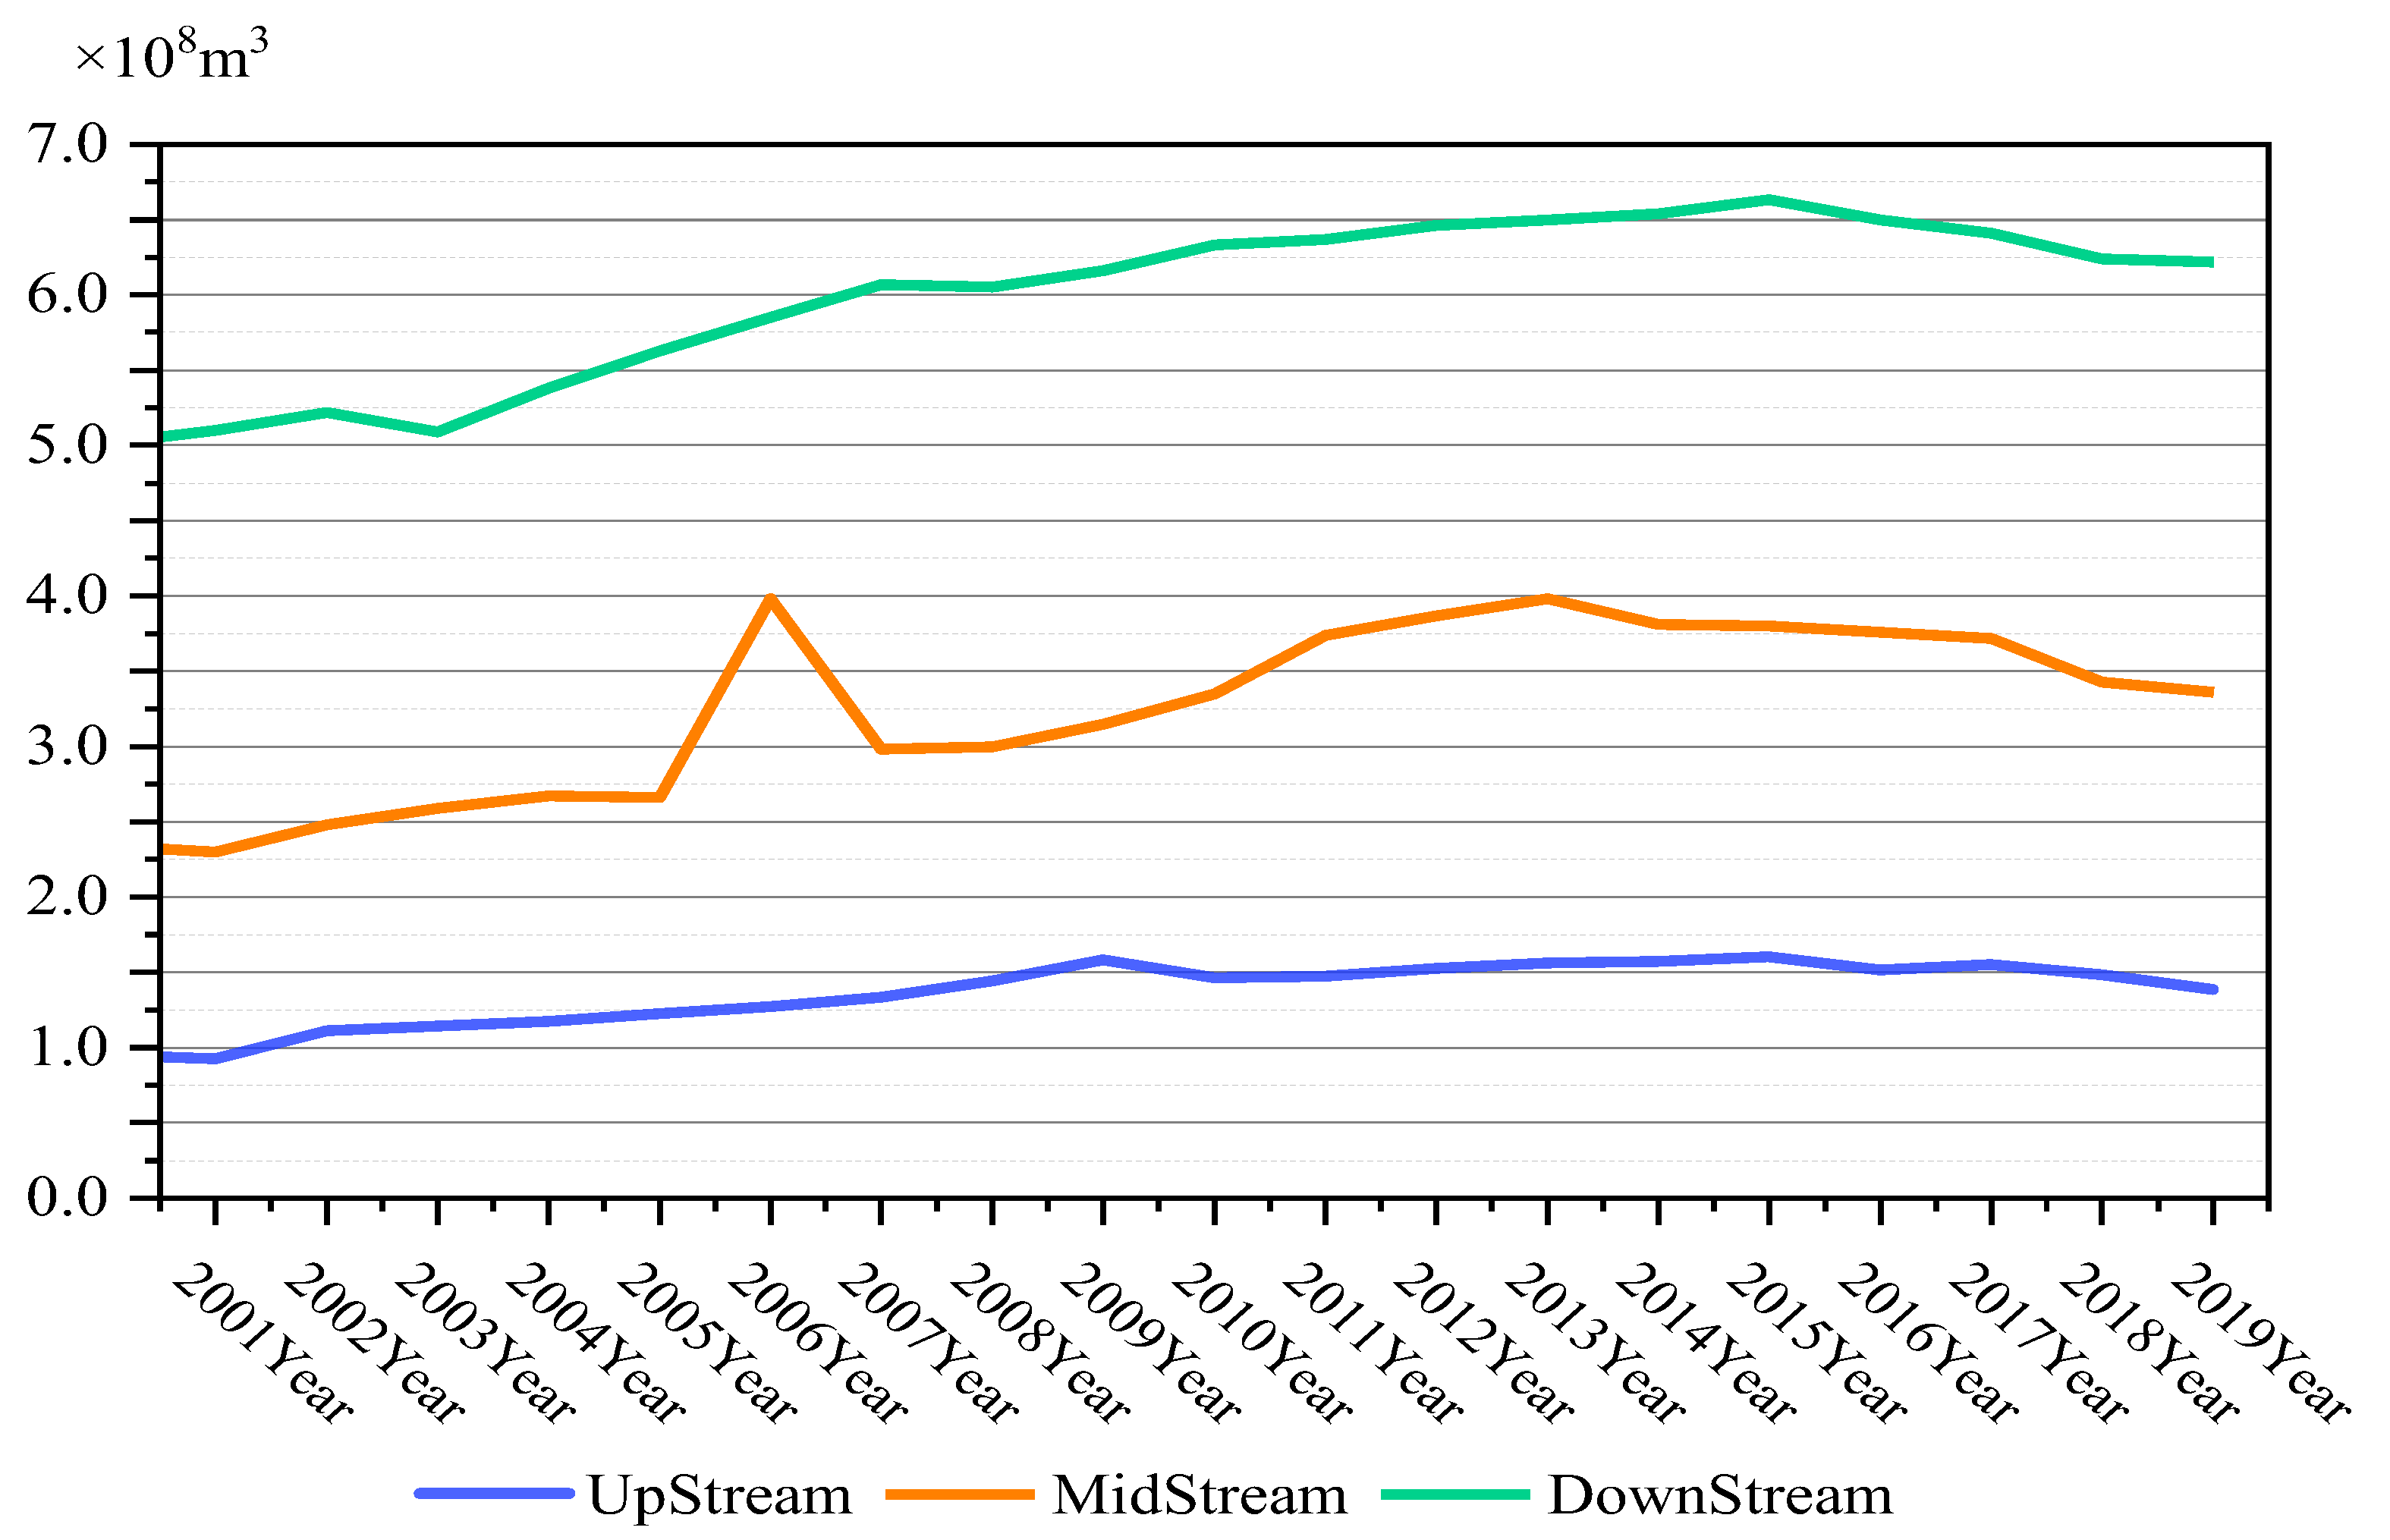
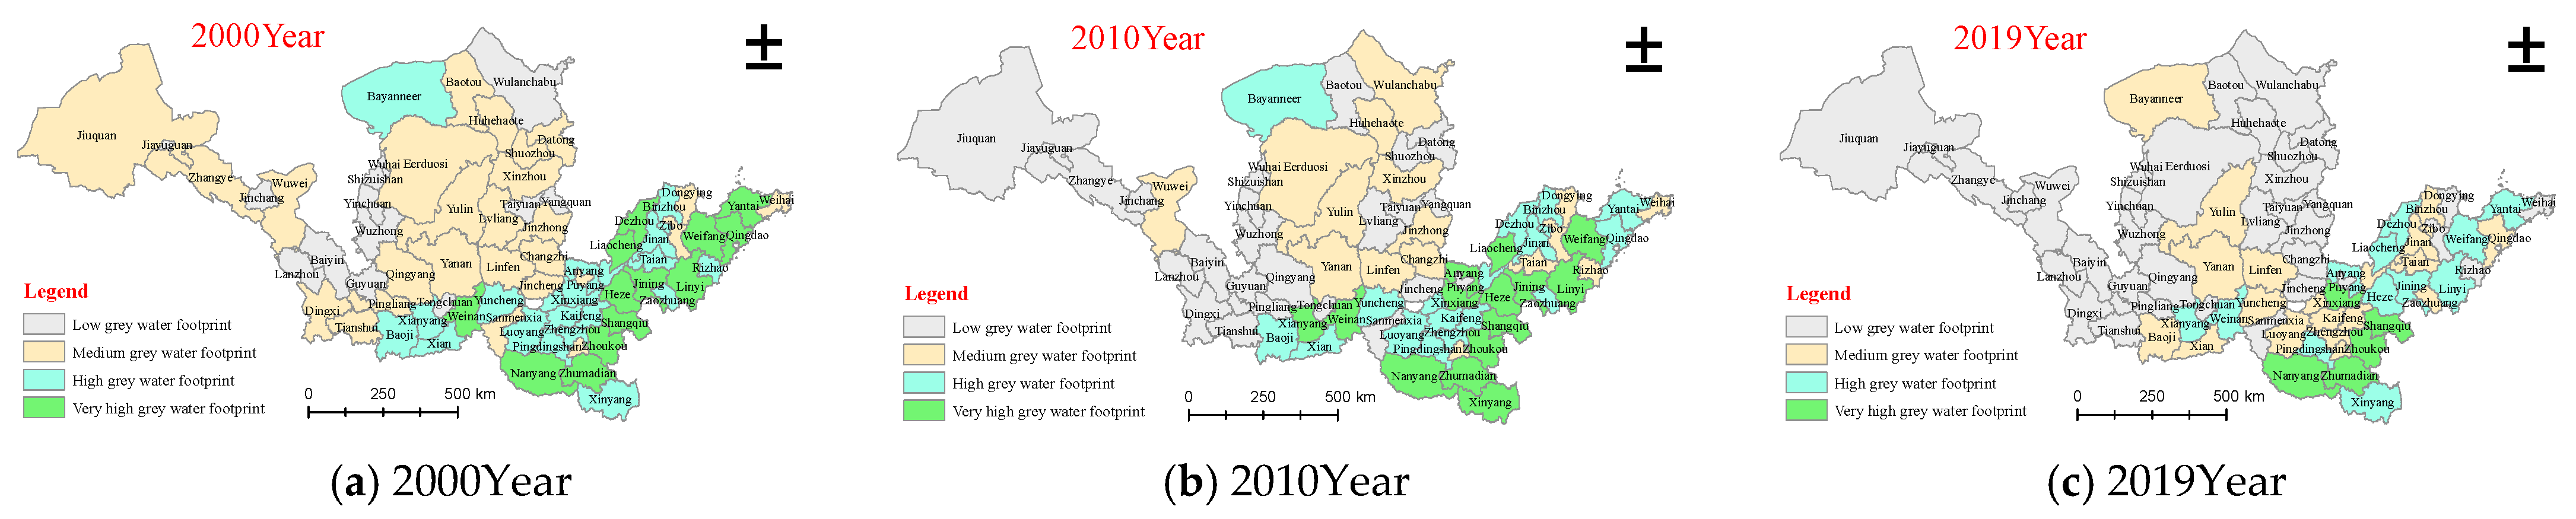
- Based on the water footprint theory, the of the Yellow River Basin from 2000 to 2019 was calculated. Taking 2015 as the study period, the results showed that the of the Yellow River Basin had a trend of rising first and then falling. The values and growth rates of the in different regions were quite different. The downstream value was much higher than that of the middle and upper reaches, but the growth rate was lower than that of the middle and upper reaches. In terms of temporal variation, the thresholds of the low, medium, high, and very-high groups increased, while the proportion of prefecture-level cities in the high and very-high groups decreased. In terms of spatial distribution, the low- group was mainly concentrated in the upper and middle reaches, the middle- group was mainly concentrated in the middle and lower reaches, and the high- and very-high- groups were mainly concentrated in the lower reaches and gradually decreased over time.
- (2)
- Based on the LISA agglomeration map, the spatial correlation characteristics of the of the cities in the Yellow River Basin were analyzed. The results showed that the distribution of the in the Yellow River Basin not only had continuity in time, but also had obvious spatial agglomeration, and this difference gradually decreased. Generally, the “High–Low” agglomeration and the “Low–Low” agglomeration were dominant. From 2000 to 2019, most prefecture-level cities maintained the same transition changes as the neighboring regions. In the two time periods, spatial cohesion increased from 81.94% to 93.06%, indicating that the spatial structure change of the in the Yellow River Basin had obvious path-dependent characteristics, and this characteristic was gradually strengthened.
- (3)
- Based on the path analysis method, the influencing factors of spatial and temporal variation in the Yellow River Basin were analyzed. The results showed that crop yield, economic scale, and urban and rural structure were the main driving factors affecting the temporal variation of the in the Yellow River Basin, and their direct path coefficients were 1.712, −0.537, and −0.310, respectively. Technological innovation, population size, and crop yield were the main influencing factors affecting the spatial distribution pattern, and their direct path coefficients were 0.369, 0.355, and 0.284, respectively. Crop yield was the only common factor influencing the spatio-temporal evolution of the in the Yellow River Basin. Chen’s research holds that economic development and technological effects are the main negative and positive factors behind the decline in the grey water footprint, respectively [67]. In this study, economic scale was the main negative factor that leads to the increase in the agricultural grey water footprint. For the temporal change of the agricultural grey water footprint, scientific and technological innovation was the main negative factor that leads to the increase in the agricultural grey water footprint. Kong found that, according to the intensity and grey water footprint of Chinese provincial agriculture and the agricultural GDP, there was a growth inhibitory effect of the grey water footprint, and the driving role was determined [68]. In this study, we found the opposite conclusion in that economies of scale affected the main negative factors driving the temporal changes of the agricultural grey water footprint of the Yellow River. This may be caused by the study of the regional difference taking cities as the research object, so the scale was smaller and the results were more targeted.
4.2. Suggestions
- (1)
- Appropriately control the population and the scale of agricultural economic development in the areas along the Yellow River Basin, and achieve balanced development between urban and rural areas. On the one hand, for the regions with a large population, the government should issue corresponding subsidy policies for out-migrating workers based on the actual situation of the city, and encourage a large number of young people to work and do business in the eastern region. On the other hand, for the regions with a small population, the government should strengthen the construction of living facilities for the residents, improve the level of education and medical care, reduce the cost of living, and attract people from other provinces to settle in this area, in order to realize the overall development of urban and rural areas in the Yellow River Basin.
- (2)
- Based on regional resource endowments, the layout of agricultural production should be optimized and the agricultural planting structure should be rationally adjusted to maximize the efficiency of grain output. Each region should build important agricultural production bases with distinctive advantages according to their regional resource endowments. Furthermore, the layout of agricultural production should be optimized and the agricultural planting structure should be rationally adjusted to maximize the scale efficiency of grain production, thereby reducing the agricultural grey water footprint, and accelerating the high-quality development of various agricultural regions.
- (3)
- Rely on the progress of agricultural science and technology to develop environment-friendly agriculture. Specifically, it is necessary to call on all municipal agricultural technology centers to hold online training courses on chemical fertilizer and pesticide reduction and efficiency enhancement technologies to guide farmers on how to popularize and apply “soil testing and formula fertilization technology” according to the fertilizer requirements of different crops. In addition, the National Agricultural Technology Center can also conduct training courses in various cities to demonstrate the relevant techniques to farmers and encourage them to observe and communicate, so as to explore new technologies for reducing chemical fertilizers and pesticides.
Author Contributions
Funding
Institutional Review Board Statement
Informed Consent Statement
Data Availability Statement
Acknowledgments
Conflicts of Interest
Disclosure Statement
References
- Fan, G.Q.; Zhang, D.Z.; Zhang, J.M.; Li, Z.; Sang, W.; Zhao, L.; Xu, M. Ecological environmental effects of Yellow River irrigation revealed by isotope and ion hydrochemistry in the Yinchuan Plain, Northwest China. Ecol. Indic. 2022, 135, 108574. [Google Scholar] [CrossRef]
- Fang, L.N.; Yin, C.B.; Fang, Z.; Zhang, Y. The promotion path of high-quality development of agriculture in the Yellow River Basin. Chin. J. Agric. Resour. Reg. Plan. 2021, 42, 16–22. [Google Scholar]
- Lu, C.P.; Ji, W.; Hou, M.C.; Ma, T.; Mao, J. Evaluation of efficiency and resilience of agricultural water resources system in the Yellow River Basin, China. Agric. Water Manag. 2022, 266, 107605. [Google Scholar] [CrossRef]
- Zhang, N.N.; Su, X.L.; Zhou, Y.Z.; Niu, J.-P. Water resources carrying capacity evaluation of the Yellow River Basin based on EFAST weight algorithm. J. Nat. Resour. 2019, 34, 1759–1770. [Google Scholar] [CrossRef]
- Tao, Y.; Xu, J.; Ren, H.J.; Guan, X.; You, L.; Wang, S. Spatiotemporal evolution of agricultural non-point source pollution and its influencing factors in the Yellow River Basin. Trans. Chin. Soc. Agric. Eng. 2021, 37, 257–264. [Google Scholar]
- Ercin, A.E.; Aldaya, M.M.; Hoekstra, A.Y. Corporate Water Footprint Accounting and Impact Assessment: The Case of the Water Footprint of a Sugar-Containing Carbonated Beverage. Water Resour. Manag. 2011, 25, 721–741. [Google Scholar] [CrossRef]
- Hoekstra, A.Y.; Chapagain, A.K.; Aldaya, M.M.; Mekonnen, M.M. The Water Footprint Assessment Manual; Science Press: Beijing, China, 2012. [Google Scholar]
- Ren, Z.A.; Rong, J.R. Decoupling Relationship Between Utilization of Water Resource and Economic Growth in Anhui. J. Heilonjiang Univ. Technol. 2017, 17, 58–63. [Google Scholar]
- Wickramasinghe, W.M.S.; Navaratne, C.M.; Dias, S.V. Building resilience on water quality management through grey water footprint approach: A case study from Sri Lanka. Procedia Eng. 2018, 212, 752–759. [Google Scholar] [CrossRef]
- Hong, C.C.; Liu, M.C.; Zhang, Y.J.; Wu, L.Q. Analysis on the intensity and efficiency of agricultural grey water footprint in Beijing-Tianjin-Hebei Region under the perspective of spatial-temporal patten. J. Hebei Agric. Univ. 2021, 44, 128–135. [Google Scholar]
- Muratoglu, A. Grey water footprint of agricultural production: An assessment based on nitrogen surplus and high-resolution leaching runoff fractions in Turkey. Sci. Total Environ. 2020, 742, 140553. [Google Scholar] [CrossRef] [PubMed]
- Wu, M.Y.; Li, Y.Y.; Xiao, J.F.; Guo, X.; Cao, X. Blue, green, and grey water footprints assessment for paddy irrigation-drainage system. J. Environ. Manag. 2022, 302, 114116. [Google Scholar] [CrossRef] [PubMed]
- Feng, H.Y.; Sun, F.Y.; Liu, Y.Y.; Zeng, P.; Deng, L.; Che, Y. Mapping multiple water pollutants across China using the grey water footprint. Sci. Total Environ. 2021, 785, 147255. [Google Scholar] [CrossRef]
- Xie, D.; Zhuo, L.; Xie, P.X.; Liu, Y.; Feng, B.; Wu, P. Spatiotemporal variations and developments of water footprints of pig feeding and pork production in China (2004–2013). Agric. Ecosyst. Environ. 2020, 297, 106932. [Google Scholar] [CrossRef]
- Lin, J.W.; Weng, L.Y.; Dai, Y.H. Study on spatial and temporal pattern of grey water footprint and its decoupling relationship in China. Water Conserv. Sci. Technol. Econ. 2019, 25, 14–21. [Google Scholar]
- Li, C.H.; Xu, M.; Wang, X.; Tan, Q. Spatial analysis of dual-scale water stresses based on water footprint accounting in the Haihe River Basin, China. Ecol. Indic. 2018, 92, 254–267. [Google Scholar] [CrossRef]
- Ma, W.J.; Meng, L.H.; Wei, F.L.; Opp, C.; Yang, D. Spatiotemporal variations of agricultural water footprint and socioeconomic matching evaluation from the perspective of ecological function zone. Agric. Water Manag. 2021, 249, 106803. [Google Scholar] [CrossRef]
- Zhang, Y.; Tan, Q.; Zhang, T.Y.; Zhang, T.; Zhang, S. Sustainable agricultural water management incorporating inexact programming and salinization-related grey water footprint. J. Contam. Hydrol. 2022, 247, 103961. [Google Scholar] [CrossRef]
- Jamshidi, S.; Imani, S.; Delavar, M. An approach to quantifying the grey water footprint of agricultural productions in basins with impaired environment. J. Hydrol. 2022, 606, 127458. [Google Scholar] [CrossRef]
- Yang, Z.W.; Li, B.; Xia, R.; Ma, S.; Jia, R.; Ma, C.; Wang, L.; Chen, Y.; Bin, L. Understanding China’s industrialization driven water pollution stress in 2002–2015—A multi-pollutant based net gray water footprint analysis. J. Environ. Manag. 2022, 310, 114735. [Google Scholar] [CrossRef]
- He, Z.W.; Xiang, P.A. An Analysis of the Variations and Driving Factors of Grey Water Footprint in Hunan Province. China Rural Water Hydropower 2018, 10, 19–26. [Google Scholar]
- Li, H.; Liang, S.; Liang, Y.H.; Li, K.; Qi, J.; Yang, X.; Feng, C.; Cai, Y.; Yang, Z. Multi-pollutant based grey water footprint of Chinese regions. Resour. Conserv. Recycl. 2021, 164, 105202. [Google Scholar] [CrossRef]
- Li, X.C.; Chen, D.; Cao, X.; Luo, Z.; Webber, M. Assessing the components of, and factors influencing, paddy rice water footprint in China. Agric. Water Manag. 2020, 229, 105939. [Google Scholar] [CrossRef]
- Wang, Z.Y.; Xu, D.Y.; Peng, D.L.; Zhang, Y. Quantifying the influences of natural and human factors on the water footprint of afforestation in desert regions of northern China. Sci. Total Environ. 2021, 780, 146577. [Google Scholar] [CrossRef] [PubMed]
- Feng, B.B.; Liu, X.F.; Zhao, Y.G.; Li, K. Estimate of blue and green water footprint of crop production and analysis of its influencing factors in Shanxi province. Res. Soil Water Conserv. 2018, 25, 200–205, 214. [Google Scholar]
- Cai, J.P.; Xie, R.; Wang, S.J.; Deng, Y.; Sun, D. Patterns and driving forces of the agricultural water footprint of Chinese cities. Sci. Total Environ. 2022, 843, 156725. [Google Scholar] [CrossRef] [PubMed]
- Zhang, L.; Dong, H.J.; Geng, Y.; Francisco, M.J. China’s provincial grey water footprint characteristic and driving forces. Sci. Total Environ. 2019, 677, 427–435. [Google Scholar] [CrossRef]
- Hu, Y.; Huang, Y.; Tang, J.; Gao, B.; Yang, M.; Meng, F.; Cui, S. Evaluating agricultural grey water footprint with modeled nitrogen emission data. Resour. Conserv. Recycl. 2018, 138, 64–73. [Google Scholar] [CrossRef]
- Corredor, J.A.G.; González, G.L.V.; Granados, M.V.; Gutiérrez, L.; Pérez, E.H. Use of the gray water footprint as an indicator of contamination caused by artisanal mining in Colombia. Resour. Policy 2021, 73, 102197. [Google Scholar] [CrossRef]
- Liu, J.X.; Li, Y.; Zheng, Y.M.; Tong, S.; Zhang, X.; Zhao, Y.; Zheng, W.; Zhai, B.; Wang, Z.; Li, Z.; et al. The spatial and temporal distribution of nitrogen flow in the agricultural system and green development assessment of the Yellow River Basin. Agric. Water Manag. 2022, 263, 107425. [Google Scholar] [CrossRef]
- Tsaboula, A.; Papadakis, E.N.; Vryzas, Z.; Kotopoulou, A.; Kintzikoglou, K.; Papadopoulou-Mourkidou, E. Assessment and management of pesticide pollution at a river basin level part I: Aquatic ecotoxicological quality indices. Sci. Total Environ. 2019, 653, 1597–1611. [Google Scholar] [CrossRef]
- Chukalla, A.D.; Krol, M.S.; Hoekstra, A.Y. Grey water footprint reduction in irrigated crop production: Effect of nitrogen application rate, nitrogen form, tillage practice and irrigation strategy. Hydrol. Earth Syst 2018, 20, 3245–3259. [Google Scholar] [CrossRef]
- Wang, S.Y.; Lin, Y.J. Spatial Evolution and its Drivers of Regional Agro-ecological Efficiency in China’s from the Perspective of Water Footprint and Grey Water Footprint. Sci. Geogr. Sin. 2021, 41, 291–301. [Google Scholar]
- Han, Q.; Sun, C.Z.; Zou, W. Grey water footprint efficiency measure and its driving pattern analysis on provincial scale in China from 1998 to 2012. Resour. Sci. 2016, 38, 1179–1191. [Google Scholar]
- Wang, Y.Q.; Xian, C.F.; Ouyang, Z.Y. Integrated assessment of sustainability in urban water resources utilization in China based on grey water footprint. Acta Ecol. Sin. 2021, 41, 2983–2995. [Google Scholar]
- Ju, X.T.; Xing, G.X.; Chen, X.P.; Zhang, S.L.; Zhang, L.J.; Liu, X.J.; Cui, Z.L.; Yin, B.; Christie, P.; Zhu, Z.L.; et al. Reducing environmental risk by improving N management in intensive Chinese agricultural systems. Proc. Natl. Acad. Sci. USA 2009, 106, 3041–3046. [Google Scholar] [CrossRef] [PubMed]
- Mekonnen, M.M.; Hoekstra, A.Y. The green, blue and grey water footprint of crops and derived crop products. Hydrol. Earth Syst. 2011, 15, 1577–1600. [Google Scholar] [CrossRef]
- De Girolamo, A.M.; Miscioscia, P.; Politi, T.; Barca, E. Improving grey water footprint assessment: Accounting for uncertainty. Ecol. Indic. 2019, 102, 822–833. [Google Scholar] [CrossRef]
- Ma, F.C.; Liu, Q.N. Spatial Correlation Pattern and Influencing Factors of “Water Footprint Intensity of Grain Crops” in Heilongjiang Province. Ecol. Econ. 2021, 37, 121–127, 144. [Google Scholar]
- Sun, L. Spatial Empirical Study on Regional Differences and Influencing Factors of Water Footprint Intensity in China; South China University of Technology: Guangzhou, China, 2017. [Google Scholar]
- Kumari, M.; Sarma, K.; Sharma, R. Using Moran’s I and GIS to study the spatial pattern of land surface temperature in relation to land use/cover around a thermal power plant in Singrauli district, Madhya Pradesh, India. Remote Sens. Appl. Soc. Environ. 2019, 15, 100239. [Google Scholar] [CrossRef]
- Tepanosyan, G.; Sahakyan, L.; Zhang, C.S.; Saghatelyan, A. The application of Local Moran’s I to identify spatial clusters and hot spots of Pb, Mo and Ti in urban soils of Yerevan. Appl. Geochem. 2019, 104, 116–123. [Google Scholar] [CrossRef]
- Zhang, Y.Q.; Rashid, A.; Guo, S.S.; Jing, Y.; Zeng, Q.; Li, Y.; Adyari, B.; Yang, J.; Tang, L.; Yu, C.-P.; et al. Spatial autocorrelation and temporal variation of contaminants of emerging concern in a typical urbanizing river. Water Res. 2022, 212, 118120. [Google Scholar] [CrossRef] [PubMed]
- Melecky, L. Spatial Autocorrelation Method for Local Analysis of the EU. Procedia Econ. Financ. 2015, 23, 1102–1109. [Google Scholar] [CrossRef]
- Xiao, Y.X.; Gong, P. Removing spatial autocorrelation in urban scaling analysis. Cities 2022, 124, 103600. [Google Scholar] [CrossRef]
- Hou, M.Y.; Yao, S.B. Convergence and differentiation characteristics on agro-ecological efficiency in China from a spatial perspective. China Popul. Resour. Environ. 2019, 29, 116–126. [Google Scholar]
- Zhu, J.J.; Shi, X.Y. Analysis of Spatial Autocorrelation Patterns of Land Use and Influence Factors in Loess Hilly Region—A Case Study of Changhe Basin of Jincheng City. Res. Soil Water Conserv. 2018, 25, 234–241. [Google Scholar]
- Meng, B.; Wang, J.F.; Zhang, W.Z. Evaluation of Regional Disparity in China Based on Spatial Analysis. Sci. Geogr. Sin. 2005, 4, 11–18. [Google Scholar]
- Rey, S.J.; Janikas, M.V. Space-time analysis of regional systems. Geogr. Anal. 2006, 38, 67–86. [Google Scholar] [CrossRef]
- Song, W.; Chen, Y. Selection of observed variables and measuring indicators for the land use spatial autocorrelation analysis. J. Arid Land Resour. Environ. 2015, 29, 37–42. [Google Scholar]
- Ghalhari, G.F.; Roudbari, A.D. An investigation on thermal patterns in Iran based on spatial autocorrelation. Theor. Appl. Clim. 2018, 131, 865–876. [Google Scholar] [CrossRef]
- Ren, H.R.; Shang, Y.J.; Zhang, S. Measuring the spatiotemporal variations of vegetation net primary productivity in Inner Mongolia using spatial autocorrelation. Ecol. Indic. 2020, 112, 106108. [Google Scholar] [CrossRef]
- Lin, Z.; Chao, L.; Wu, C.Z.; Hong, W.; Hong, T.; Hu, X. Spatial analysis of carbon storage density of mid-subtropical forests using geostatistics: A case study in Jiangle County, southeast China. Acta Geochim. 2018, 37, 90–101. [Google Scholar] [CrossRef]
- Cao, X.C.; Shao, G.C.; Wang, X.J.; Wang, Z.; He, X.; Yang, C. Generalized water efficiency and strategic implications for food security and water management: A case study of grain production in China. Adv. Water Sci. 2017, 28, 14–21. [Google Scholar]
- Bi, D.D.; Wang, K.; Wang, L.J.; Fang, Y. Research on Industrial Eco-Efficiency and Spatio-Temporal Transition Characteristics of the Yangtze River Delta. Econ. Geogr. 2018, 38, 166–173. [Google Scholar]
- Zhao, G.M.; Zhao, G.Q.; Chen, L.Z. Research on spatial and temporal evolution of carbon emission intensity and its transition mechanism in China. China Popul. Resour. Environ. 2017, 27, 84–93. [Google Scholar]
- Tao, R.; Zhang, Q.Q.; Li, R.; Liu, T.; Chu, G.X. Response of roil N2O emission to partial chemical fertilizer substituted by organic fertilizer in mulch-drip irrigated cotton field. Trans. Chin. Soc. Agric. Mach. 2015, 46, 204–211. [Google Scholar]
- Cheng, W.T. Economic Decoupling and Water Use Efficiency Analysis Based on Water Footprint of Farming in Liaoning Province; Shenyang Agricultural University: Shenyang, China, 2020. [Google Scholar]
- Zong, R.; Wang, Z.H.; Zhang, J.Z.; Li, W. The response of photosynthetic capacity and yield of cotton to various mulching practices under drip irrigation in Northwest China. Agric. Water Manag. 2021, 249, 106814. [Google Scholar] [CrossRef]
- Yu, S.W.; Zhu, K.J.; Zhang, X. Energy demand projection of China using a path-coefficient analysis and PSO–GA approach. Energy Convers. Manag. 2012, 53, 142–153. [Google Scholar] [CrossRef]
- Jia, L.J.; Fan, D.C.; Wu, Y.J. Research on industrial structural adjustment under the background of low carbon economy. Inq. Into Econ. Issues 2013, 2, 87–92. [Google Scholar]
- Song, C.M.; Li, C.G.; Xiang, Y.L. Study on energy consumption’s determinants based on path analysis. J. Arid Land Resour. Environ. 2012, 26, 174–179. [Google Scholar]
- Li, Y.P.; Wu, W.N.; Yang, J.X.; Cheng, K.; Smith, P.; Sun, J.; Xu, X.; Yue, Q.; Pan, G. Exploring the environmental impact of crop production in China using a comprehensive footprint approach. Sci. Total Environ. 2022, 824, 153898. [Google Scholar] [CrossRef]
- Zhao, J.C.; Han, T.; Wang, C.; Shi, X.; Wang, K.; Zhao, M.; Chen, F.; Chu, Q. Assessing variation and driving factors of the county-scale water footprint for soybean production in China. Agric. Water Manag. 2022, 263, 107469. [Google Scholar] [CrossRef]
- Wang, Y.; Zhang, Y.H.; Sun, W.X.; Zhu, L. The impact of new urbanization and industrial structural changes on regional water stress based on water footprints. Sustain. Cities Soc. 2022, 79, 103686. [Google Scholar] [CrossRef]
- Valis, D.; Hasilova, K.; Forbelska, M.; Pietrucha-Urbanik, K. Modelling water distribution network failures and deterioration. In Proceedings of the 2017 IEEE International Conference on Industrial Engineering and Engineering Management, Singapore, 10–13 December 2017; pp. 924–928. [Google Scholar] [CrossRef]
- Chen, J.; Gao, Y.Y.; Qian, H.; Jia, H.; Zhang, Q. Insights into water sustainability from a grey water footprint perspective in an irrigated region of the Yellow River Basin. J. Clean. Prod. 2021, 316, 128329. [Google Scholar] [CrossRef]
- Kong, Y.; He, W.J.; Zhang, Z.F.; Shen, J.; Yuan, L.; Gao, X.; An, M.; Ramsey, T.S. Spatial-temporal variation and driving factors decomposition of agricultural grey water footprint in China. J. Environ. Manag. 2022, 318, 115601. [Google Scholar] [CrossRef] [PubMed]


| Transition Type | Description | Transition Form | Transition Type | Description | Transition Form |
|---|---|---|---|---|---|
| Type Ⅰ | The displacement of this region when there is no jump in the neighboring property values | HHt→LHt+1 | Type Ⅲ | Neighboring attribute values and local area attribute values leap simultaneously | HHt→LLt+1 |
| HLt→LLt+1 | HLt→LHt+1 | ||||
| LHt→HHt+1 | LLt→HHt+1 | ||||
| LLt→HLt+1 | LHt→HLt+1 | ||||
| Type Ⅱ | Leap of related space adjacent to the prefecture-level city | HHt→HLt+1 | Type Ⅳ | The same level is maintained for both adjacent and local | HHt→HHt+1 |
| HLt→HHt+1 | HLt→HLt+1 | ||||
| LHt→LLt+1 | LHt→LHt+1 | ||||
| LLt→LHt+1 | LLt→LLt+1 |
| Groups | 2000 | 2010 | 2019 |
|---|---|---|---|
| Low group | [2.2, 74.3] | [3.0, 169.9] | [0.63, 252.3] |
| Medium group | [74.3, 267.1] | [169.9, 371.8] | [252.3, 574.8] |
| High group | [267.1, 562.0] | [371.8, 725.7] | [574.8, 905.2] |
| Very high group | [562.0, 1038.9] | [725.7, 1399.9] | [905.2, 1579.0] |
| Transition Type | Time Division | |
|---|---|---|
| 2000–2010 | 2010–2019 | |
| Type Ⅰ | HLt→LLt+1: Jiuquan | — |
| LLt→HLt+1: Lvliang, Huhehaote, Wuzhong | LLt→HLt+1: Yulin, Yinchuan, Guyuan | |
| Type Ⅱ | HHt→HLt+1: Qingdao, Zaozhuang, Yantai, Jining, Taian, Linyi | — |
| HLt→HHt+1: Nanyang | — | |
| Type Ⅲ | — | HLt→LHt+1: Hebi |
| LHt→HLt+1: Zibo, Dongying | LHt→HLt+1: Rizhao | |
| Type Ⅳ | The remaining 59 prefecture-level cities | The remaining 67 prefecture-level cities |
| Influencing Factors | Direct Path Factor | Indirect Path Factor | Total Influence Factor | |||||||||||
|---|---|---|---|---|---|---|---|---|---|---|---|---|---|---|
| X1 | X2 | X3 | X4 | X5 | X6 | X7 | X8 | X9 | X10 | X11 | X12 | |||
| X1 | −0.191 | −0.521 | −0.302 | −0.281 | 0.074 | −0.008 | 1.625 | −0.033 | −0.029 | −0.002 | −0.005 | −0.001 | 0.325 | |
| X2 | −0.537 | −0.185 | −0.307 | −0.271 | 0.071 | −0.007 | 1.583 | −0.032 | −0.028 | −0.003 | −0.006 | −0.002 | 0.275 | |
| X3 | 0.310 | 0.186 | 0.532 | 0.273 | −0.074 | 0.007 | −1.641 | 0.032 | 0.028 | 0.004 | 0.006 | 0.002 | −0.335 | |
| X4 | −0.294 | −0.183 | −0.496 | −0.288 | 0.072 | −0.006 | 1.568 | −0.032 | −0.028 | −0.001 | −0.004 | 0.000 | 0.307 | |
| X5 | −0.079 | 0.178 | 0.485 | 0.292 | 0.267 | 0.006 | −1.694 | 0.031 | 0.027 | 0.004 | 0.007 | 0.003 | −0.473 | |
| X6 | 0.021 | 0.076 | 0.175 | 0.106 | 0.089 | −0.024 | −0.663 | 0.016 | 0.015 | −0.007 | −0.006 | −0.006 | −0.207 | |
| X7 | 1.712 | −0.181 | −0.497 | −0.297 | −0.269 | 0.078 | −0.008 | −0.032 | −0.028 | −0.003 | −0.006 | −0.002 | 0.468 | |
| X8 | −0.035 | −0.181 | −0.494 | −0.284 | −0.269 | 0.069 | −0.010 | 1.544 | −0.031 | −0.003 | −0.005 | −0.002 | 0.299 | |
| X9 | −0.033 | −0.168 | −0.457 | −0.261 | −0.250 | 0.064 | −0.010 | 1.430 | −0.033 | −0.003 | −0.005 | −0.002 | 0.271 | |
| X10 | 0.023 | 0.020 | 0.077 | 0.047 | 0.014 | −0.014 | −0.007 | −0.222 | 0.005 | 0.005 | 0.021 | 0.017 | −0.012 | |
| X11 | 0.022 | 0.042 | 0.137 | 0.084 | 0.049 | −0.024 | −0.006 | −0.431 | 0.008 | 0.008 | 0.022 | 0.018 | −0.068 | |
| X12 | 0.018 | 0.014 | 0.055 | 0.037 | 0.007 | −0.014 | −0.007 | −0.194 | 0.003 | 0.004 | 0.022 | 0.022 | −0.032 | |
| Influencing Factors | Direct Path Factor | Indirect Path Factor | Total Influence Factor | |||||||||||
|---|---|---|---|---|---|---|---|---|---|---|---|---|---|---|
| X1 | X2 | X3 | X4 | X5 | X6 | X7 | X8 | X9 | X10 | X11 | X12 | |||
| X1 | 0.355 | 0.004 | 0.019 | 0.275 | −0.018 | 0.054 | 0.245 | 0.007 | −0.001 | 0.000 | 0.004 | 0.001 | 0.947 | |
| X2 | −0.026 | −0.054 | −0.029 | 0.041 | 0.003 | −0.004 | 0.010 | 0.024 | 0.034 | 0.011 | 0.014 | 0.036 | 0.060 | |
| X3 | 0.077 | 0.087 | 0.010 | 0.114 | −0.046 | 0.025 | 0.089 | 0.002 | −0.005 | −0.014 | −0.004 | −0.011 | 0.323 | |
| X4 | 0.369 | 0.265 | −0.003 | 0.024 | −0.035 | 0.041 | 0.247 | 0.015 | 0.009 | 0.004 | 0.003 | 0.010 | 0.949 | |
| X5 | −0.071 | 0.091 | 0.001 | 0.050 | 0.181 | 0.030 | 0.117 | 0.012 | 0.011 | −0.012 | −0.003 | 0.003 | 0.411 | |
| X6 | 0.081 | 0.239 | 0.001 | 0.023 | 0.186 | −0.026 | 0.151 | 0.009 | 0.007 | −0.006 | 0.003 | 0.001 | 0.668 | |
| X7 | 0.284 | 0.307 | −0.001 | 0.024 | 0.321 | −0.029 | 0.043 | 0.017 | 0.014 | 0.006 | 0.007 | 0.018 | 1.010 | |
| X8 | −0.057 | −0.045 | 0.011 | −0.003 | −0.097 | 0.015 | −0.012 | −0.085 | −0.061 | −0.010 | −0.011 | −0.040 | −0.395 | |
| X9 | −0.074 | 0.004 | 0.012 | 0.005 | −0.046 | 0.011 | −0.007 | −0.055 | −0.047 | −0.007 | −0.016 | −0.049 | −0.267 | |
| X10 | 0.066 | 0.000 | −0.004 | −0.017 | 0.024 | 0.012 | −0.007 | 0.024 | 0.009 | 0.007 | 0.006 | 0.007 | 0.128 | |
| X11 | 0.033 | 0.048 | −0.011 | −0.010 | 0.030 | 0.007 | 0.006 | 0.057 | 0.020 | 0.035 | 0.013 | 0.055 | 0.284 | |
| X12 | 0.103 | 0.005 | −0.009 | −0.008 | 0.035 | −0.002 | 0.001 | 0.049 | 0.022 | 0.035 | 0.005 | 0.018 | 0.252 | |
Publisher’s Note: MDPI stays neutral with regard to jurisdictional claims in published maps and institutional affiliations. |
© 2022 by the authors. Licensee MDPI, Basel, Switzerland. This article is an open access article distributed under the terms and conditions of the Creative Commons Attribution (CC BY) license (https://creativecommons.org/licenses/by/4.0/).
Share and Cite
Xu, R.; Shi, J.; Hao, D.; Ding, Y.; Gao, J. Research on Temporal and Spatial Differentiation and Impact Paths of Agricultural Grey Water Footprints in the Yellow River Basin. Water 2022, 14, 2759. https://doi.org/10.3390/w14172759
Xu R, Shi J, Hao D, Ding Y, Gao J. Research on Temporal and Spatial Differentiation and Impact Paths of Agricultural Grey Water Footprints in the Yellow River Basin. Water. 2022; 14(17):2759. https://doi.org/10.3390/w14172759
Chicago/Turabian StyleXu, Ruifan, Jianwen Shi, Dequan Hao, Yun Ding, and Jianzhong Gao. 2022. "Research on Temporal and Spatial Differentiation and Impact Paths of Agricultural Grey Water Footprints in the Yellow River Basin" Water 14, no. 17: 2759. https://doi.org/10.3390/w14172759
APA StyleXu, R., Shi, J., Hao, D., Ding, Y., & Gao, J. (2022). Research on Temporal and Spatial Differentiation and Impact Paths of Agricultural Grey Water Footprints in the Yellow River Basin. Water, 14(17), 2759. https://doi.org/10.3390/w14172759