
Assessment of Variation in Marginal Productivity Value of Water in Paddy Farming Systems in Times of Water Stress


Abstract
:1. Introduction
1.1. Background and Concepts
- (a)
- Because the rainfed system is applied at the wettest time (soil water saturation at its maximum), water applied is at the lowest. Hence, these systems will have higher physical water productivity (Kg/m3).
- (b)
- Since SRI is labor intensive, it will attract more operational costs and hence attracts lower economic water productivity USD/m3 attributable to low SRI adaptability.
- (c)
- Irrigation augmentation has a significant leap in harvests and hence better AWP for all systems of paddy farming.
1.2. General Climate of Kilombero River Catchment
1.3. Social Economic Profile of Kilombero River Catchment
2. Materials and Methods
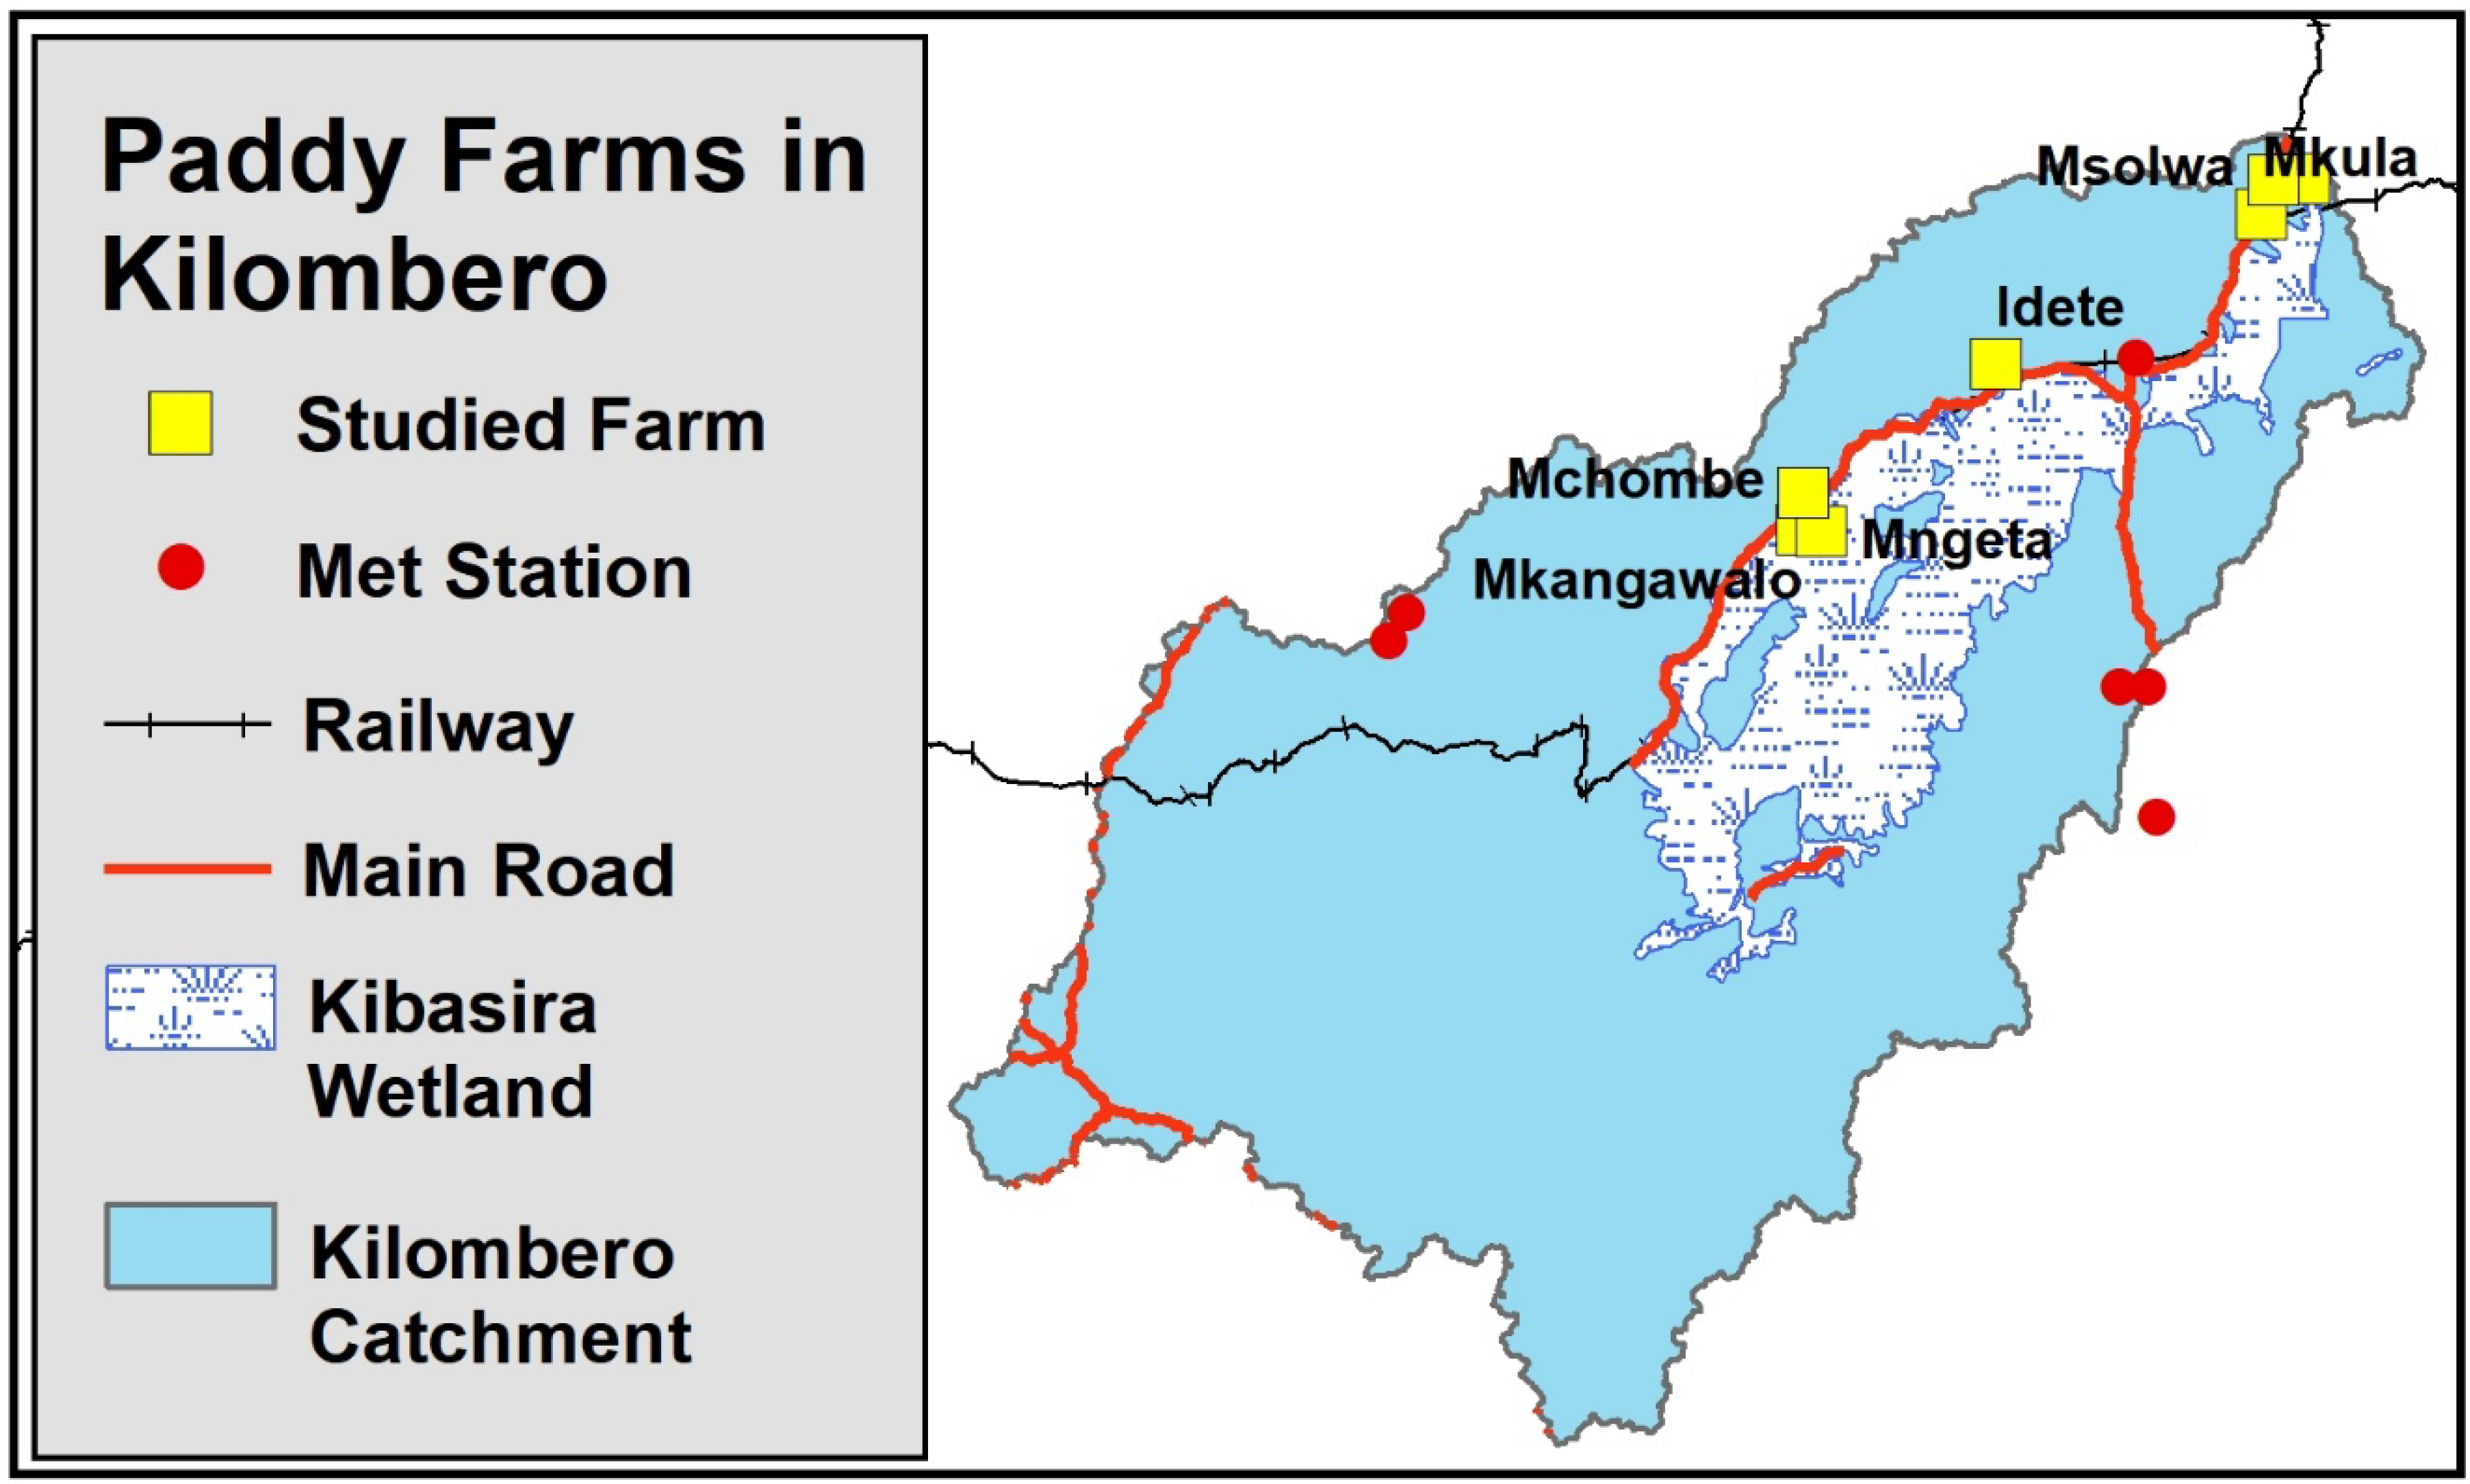
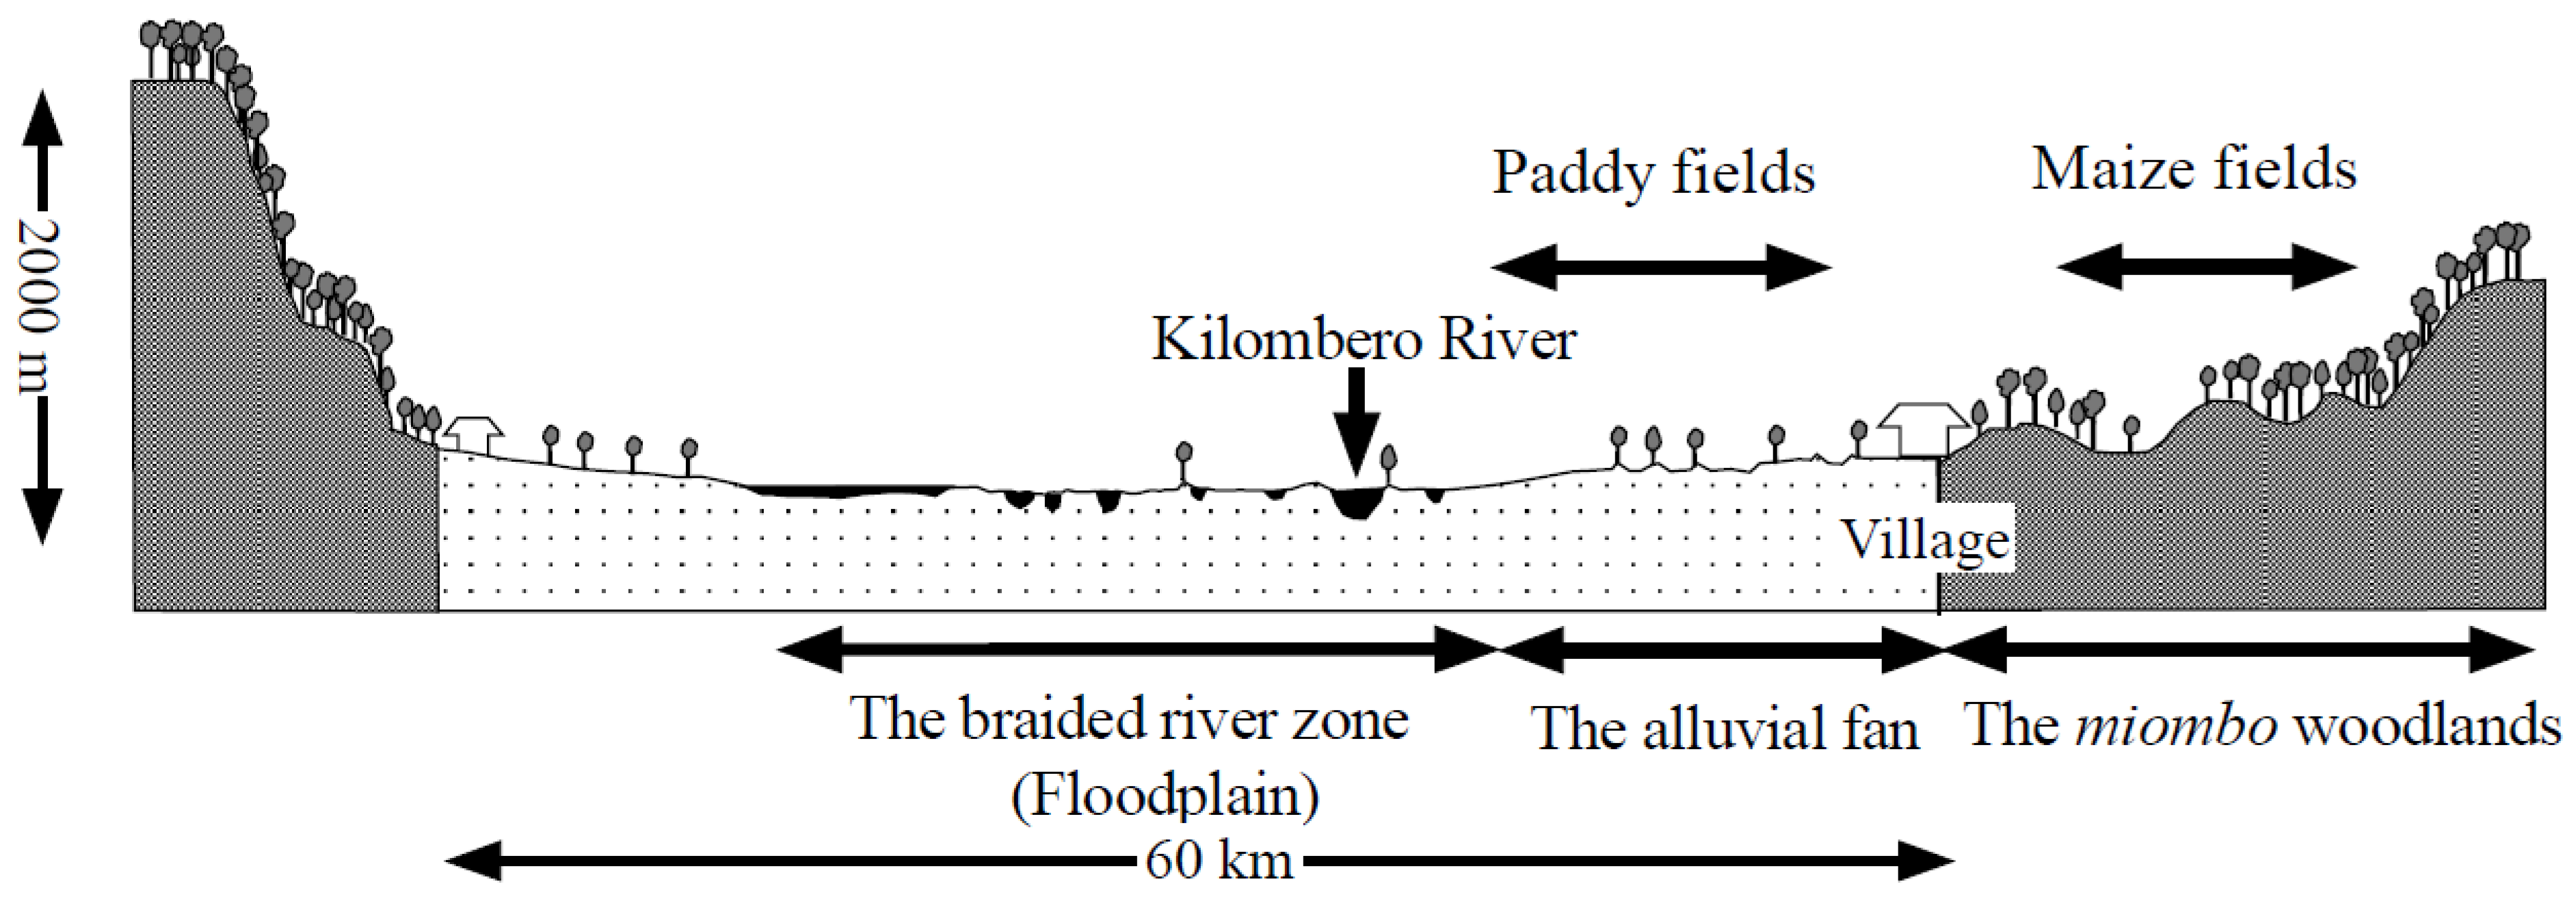
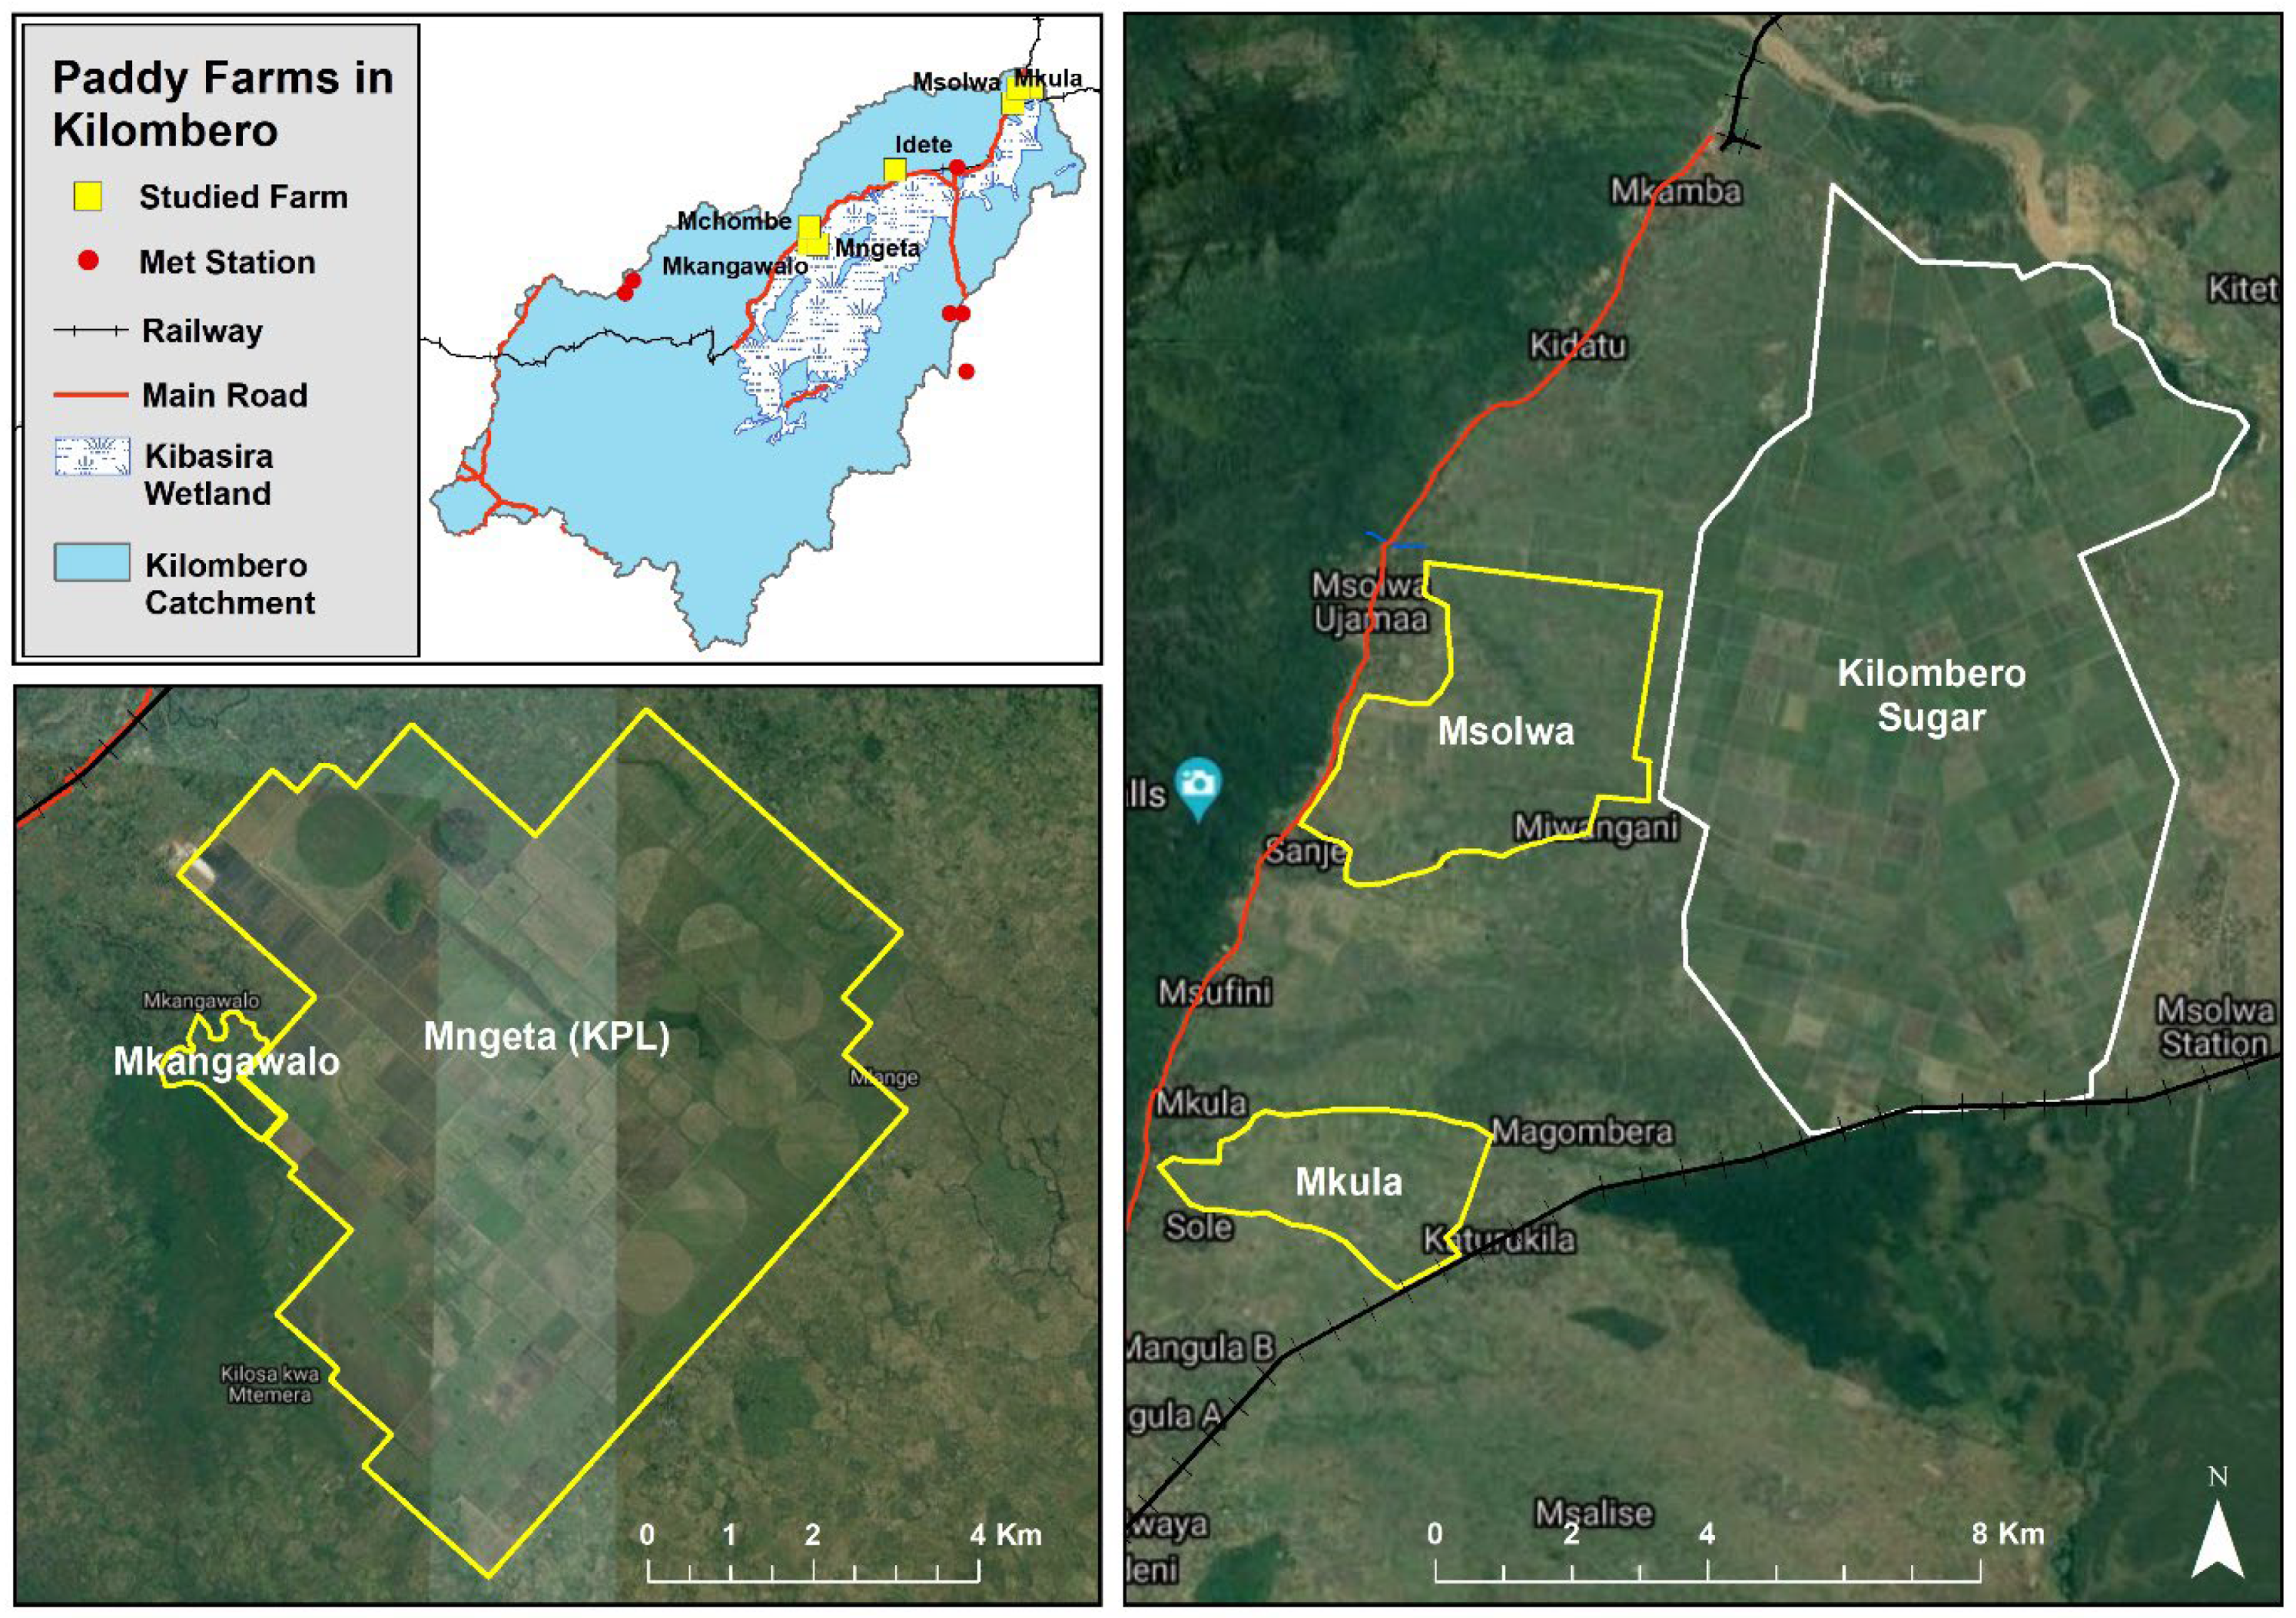
2.1. Description of the Study Area

| No. | Sub Basins | Catchment Area | % of Drainage Area | % of Annual Runoff |
|---|---|---|---|---|
| 1 | Great Ruaha | 85,554 | 47 | 15 |
| 2 | Kilombero | 40,430 | 23 | 62 |
| 3 | Luwegu | 26,300 | 15 | 18 |
| 4 | Rufiji | 27,160 | 15 | 5 |
| 5 | Total | 183,791 | 100 | 100 |
2.2. Data Collection and Analysis Methods
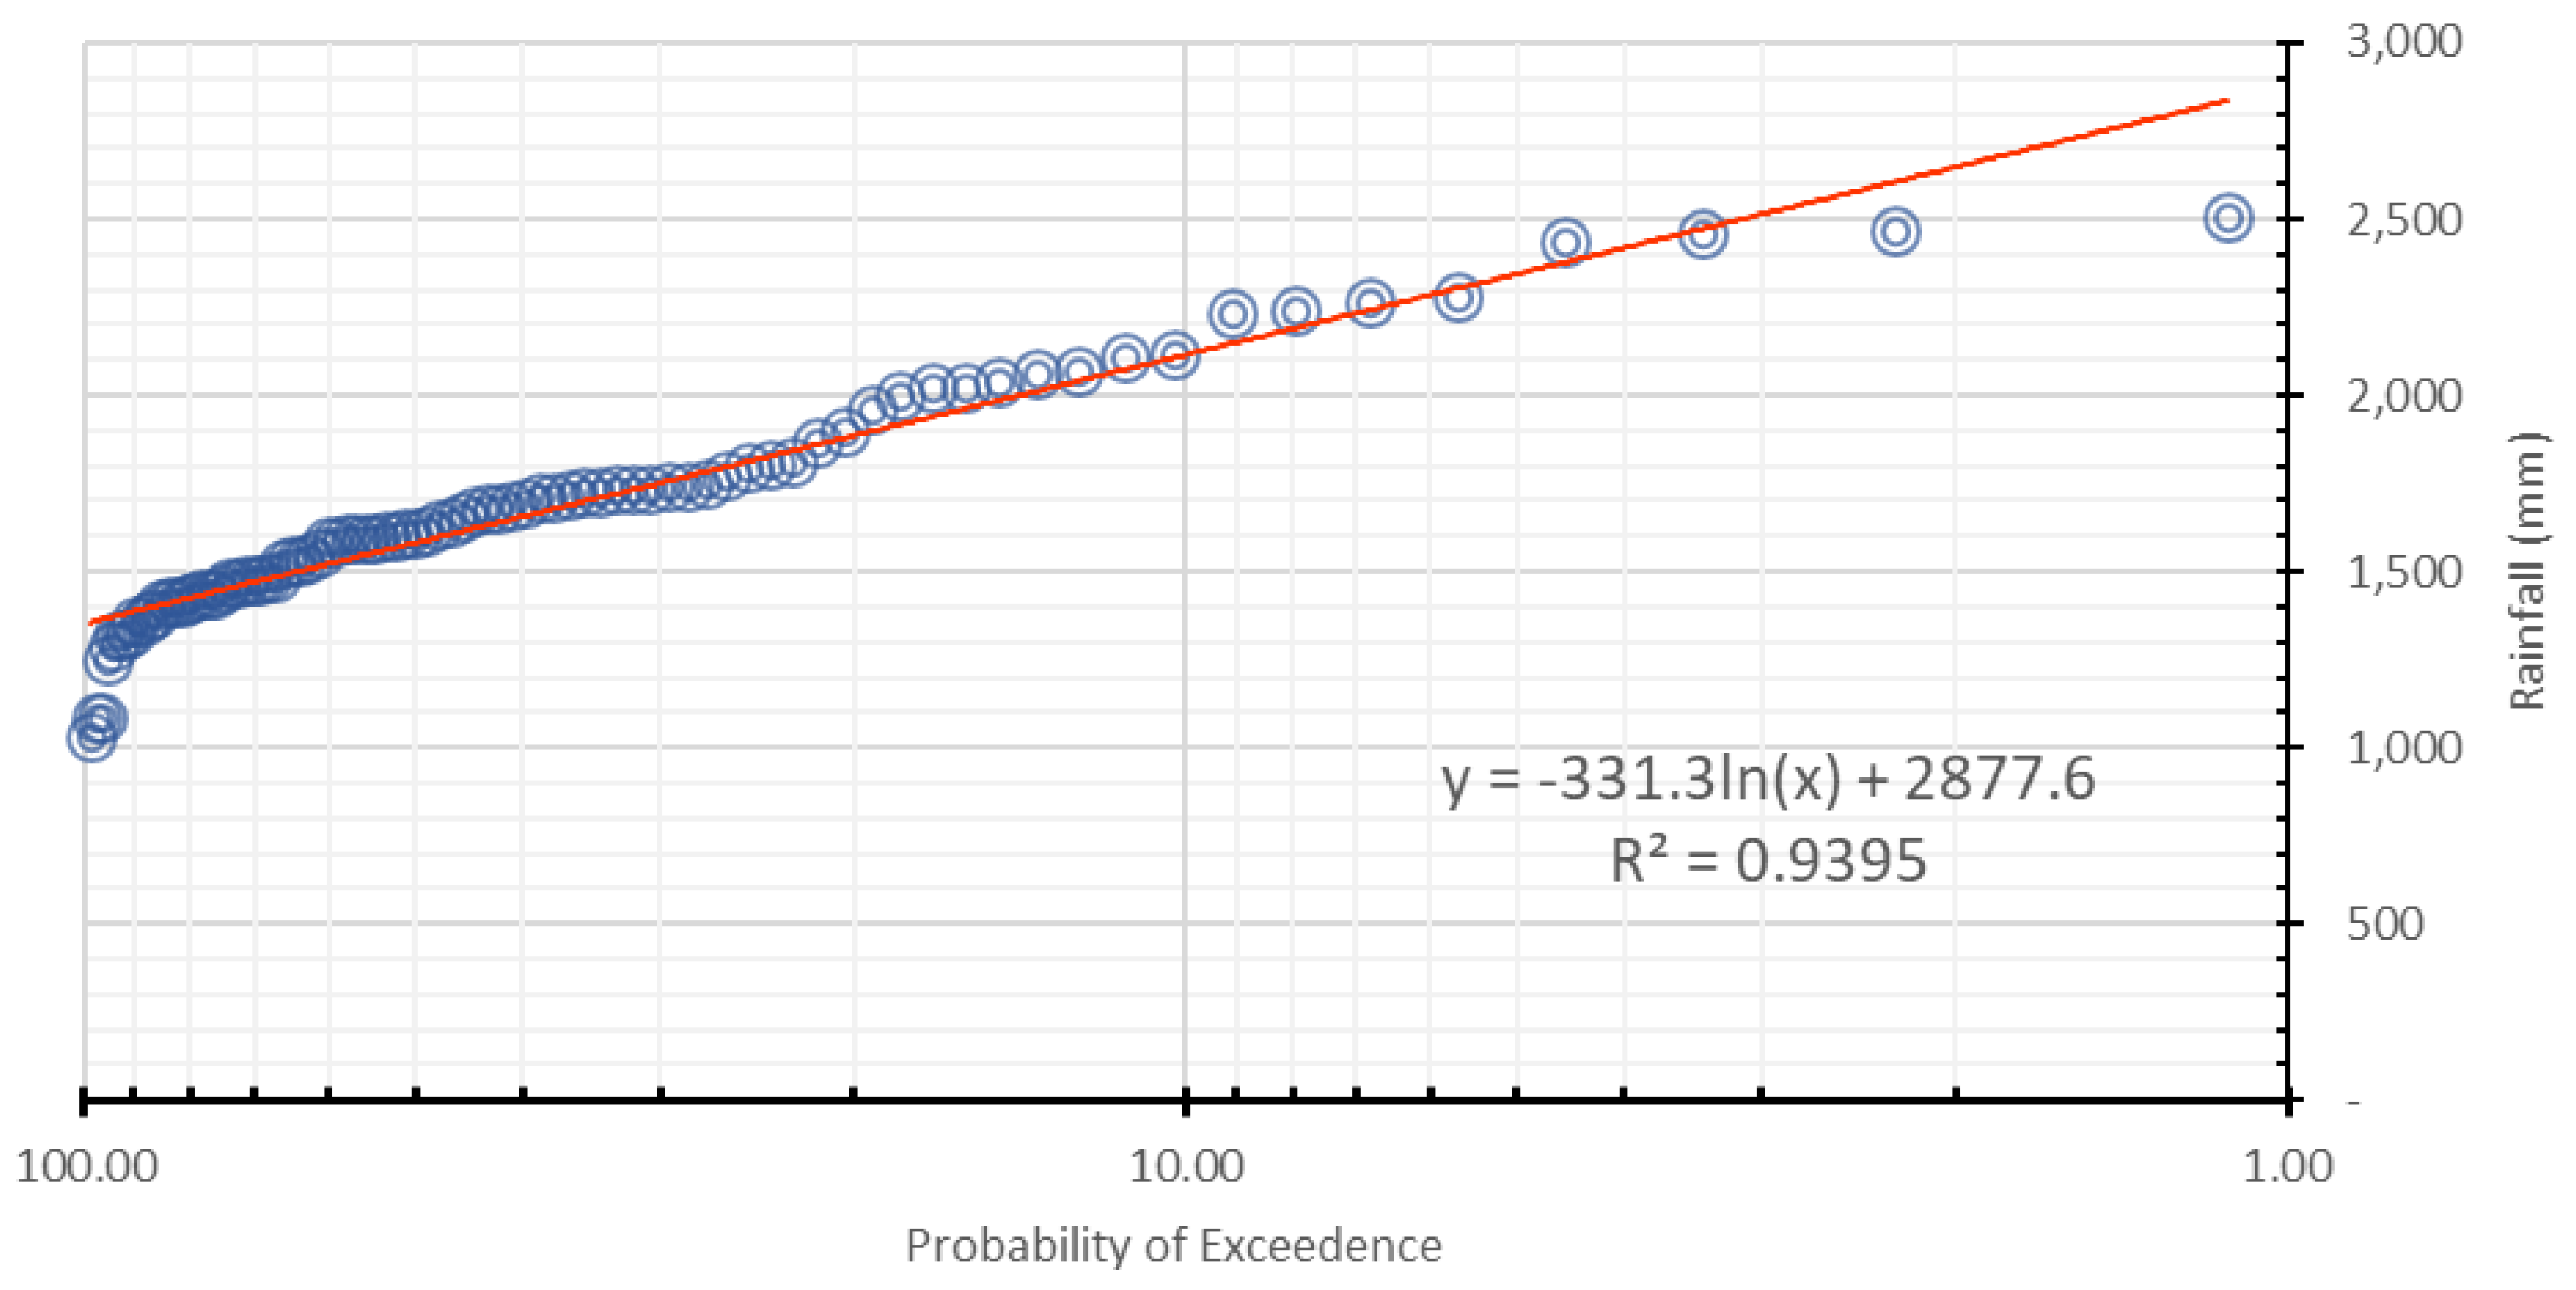
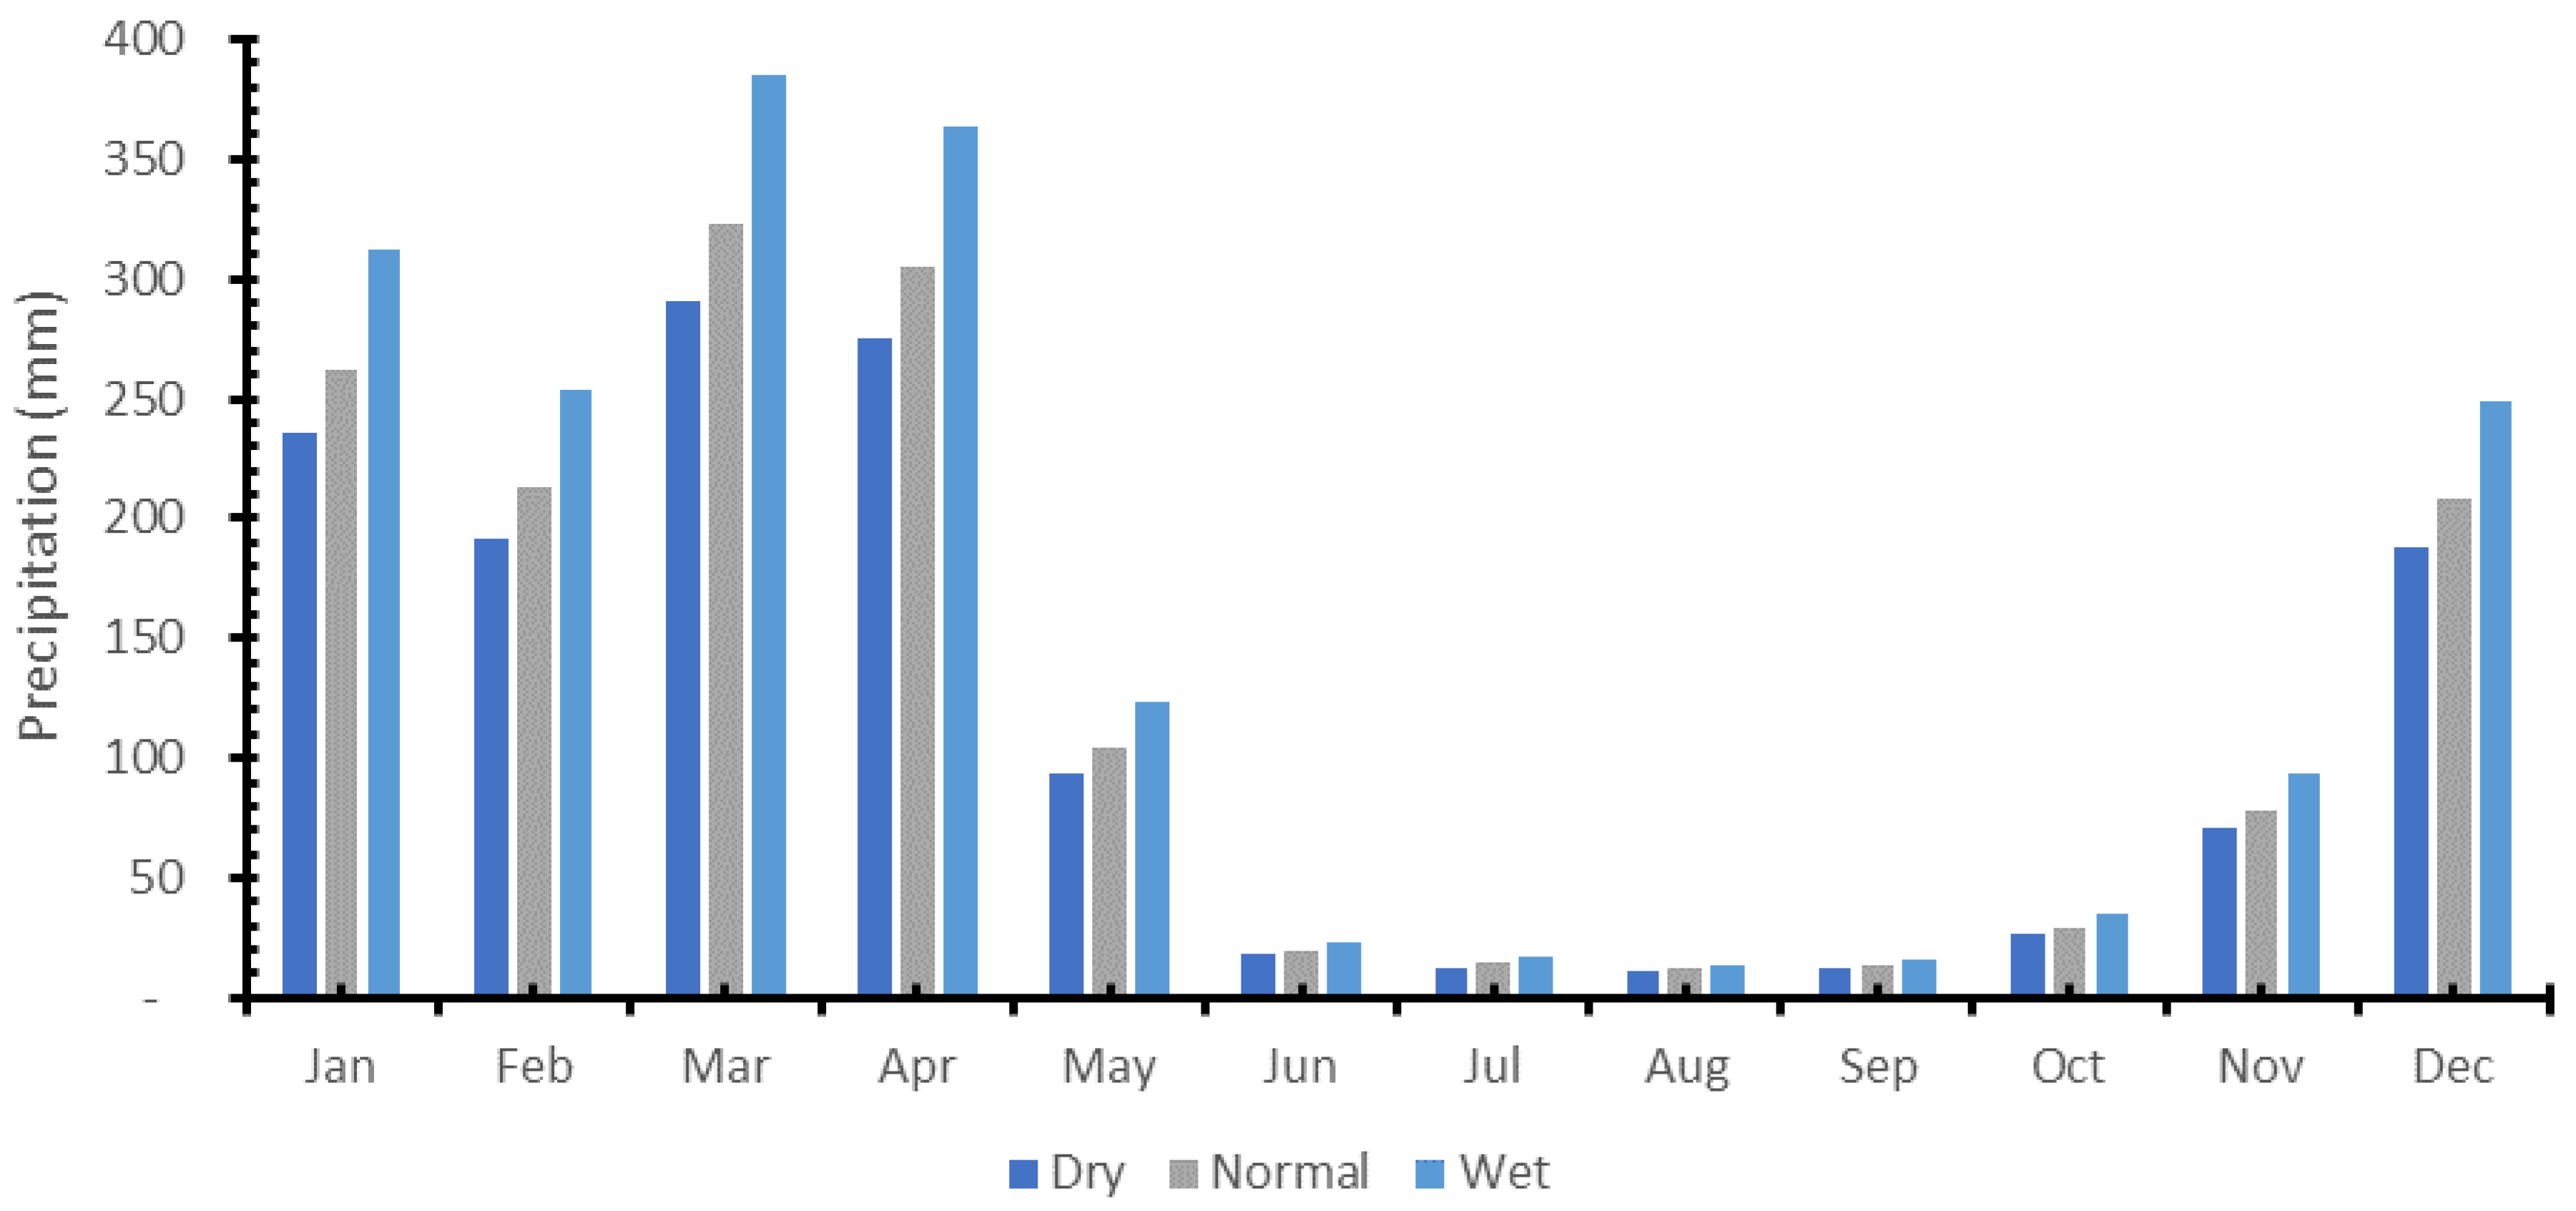
2.2.1. Determination of Stressed/Drier Years
| Year | Jan | Feb | Mar | Apr | May | Jun | Jul | Aug | Sep | Oct | Nov | Dec |
|---|---|---|---|---|---|---|---|---|---|---|---|---|
| Dry | 235.74 | 191.90 | 291.10 | 274.90 | 93.68 | 17.83 | 12.94 | 10.69 | 12.14 | 26.41 | 70.44 | 188.03 |
| Normal | 261.48 | 212.85 | 322.89 | 304.92 | 103.91 | 19.78 | 14.36 | 11.86 | 13.46 | 29.29 | 78.14 | 208.56 |
| Wet | 311.67 | 253.72 | 384.88 | 363.45 | 123.85 | 23.58 | 17.11 | 14.13 | 16.05 | 34.92 | 93.14 | 248.60 |
2.2.2. Productivity Value of Water
- (a)
- Physical Water Productivity
- (b) Economic Value of Water
- Competitive Equilibrium: This requires that the prices of all resources be equated to returns at the margin. “Profit-maximizing” producers are assumed to add productive inputs up until the point when the value marginal products (VMPs) are equal to opportunity costs or “value” of the inputs.
- The total value of product (TVP) can be divided into shares so that each resource is paid according to its value marginal product (VMP), and the TVP is thereby completely exhausted.
3. Results
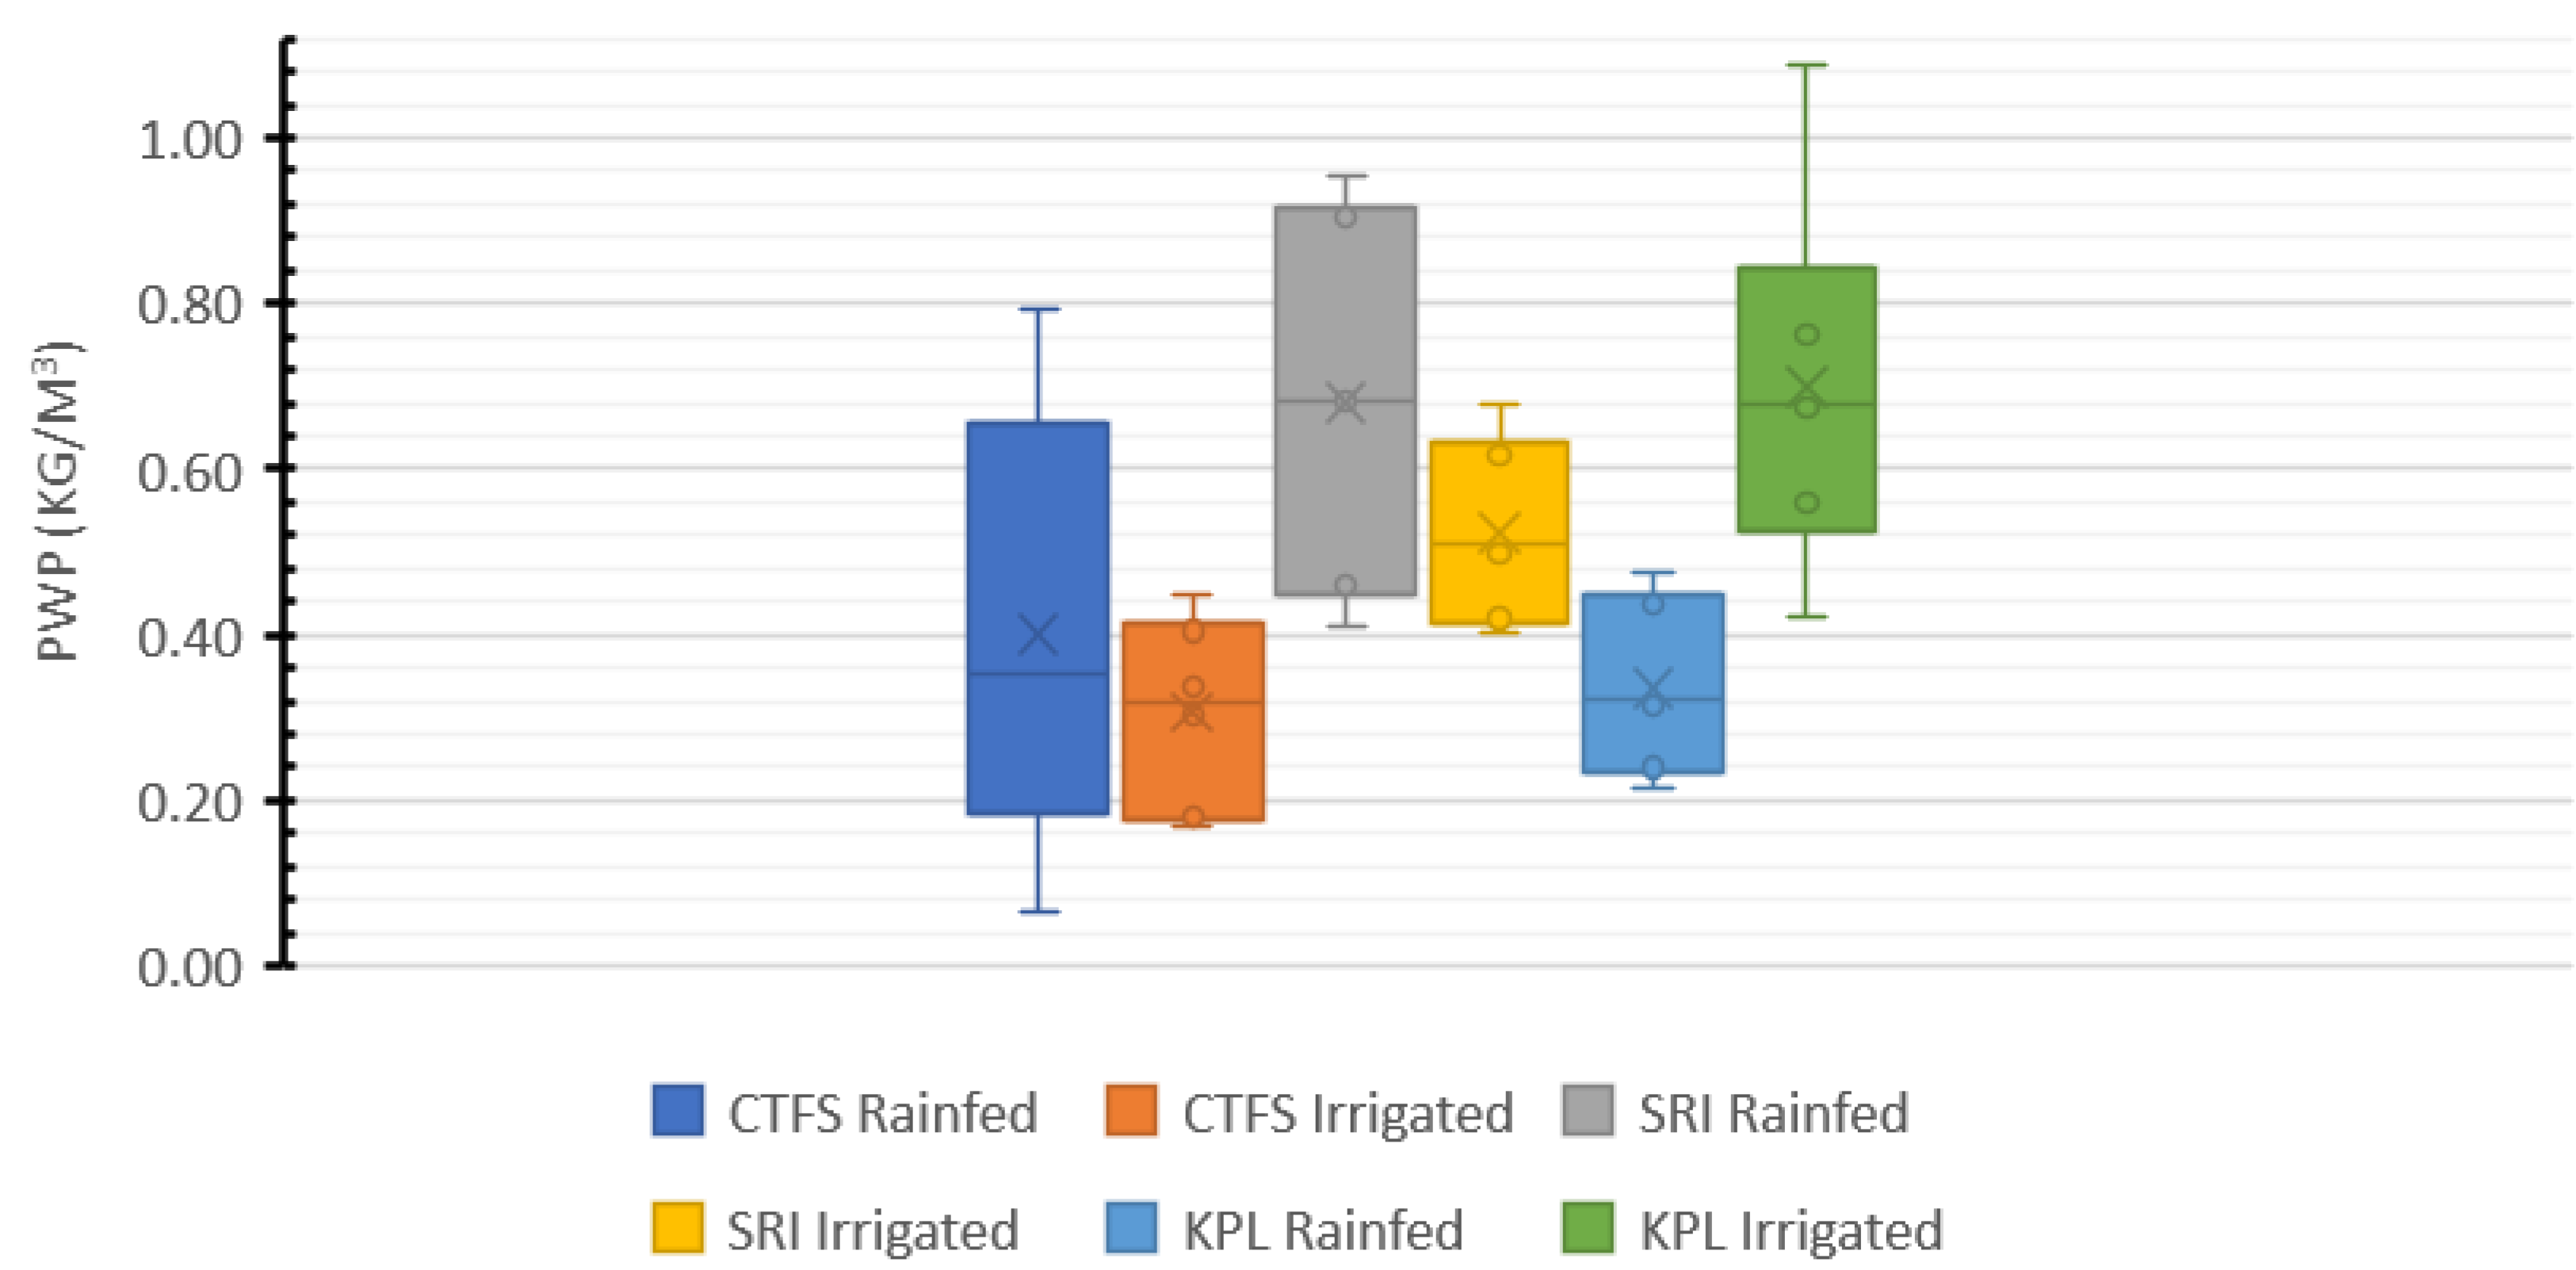
3.1. Physical Water Productivity
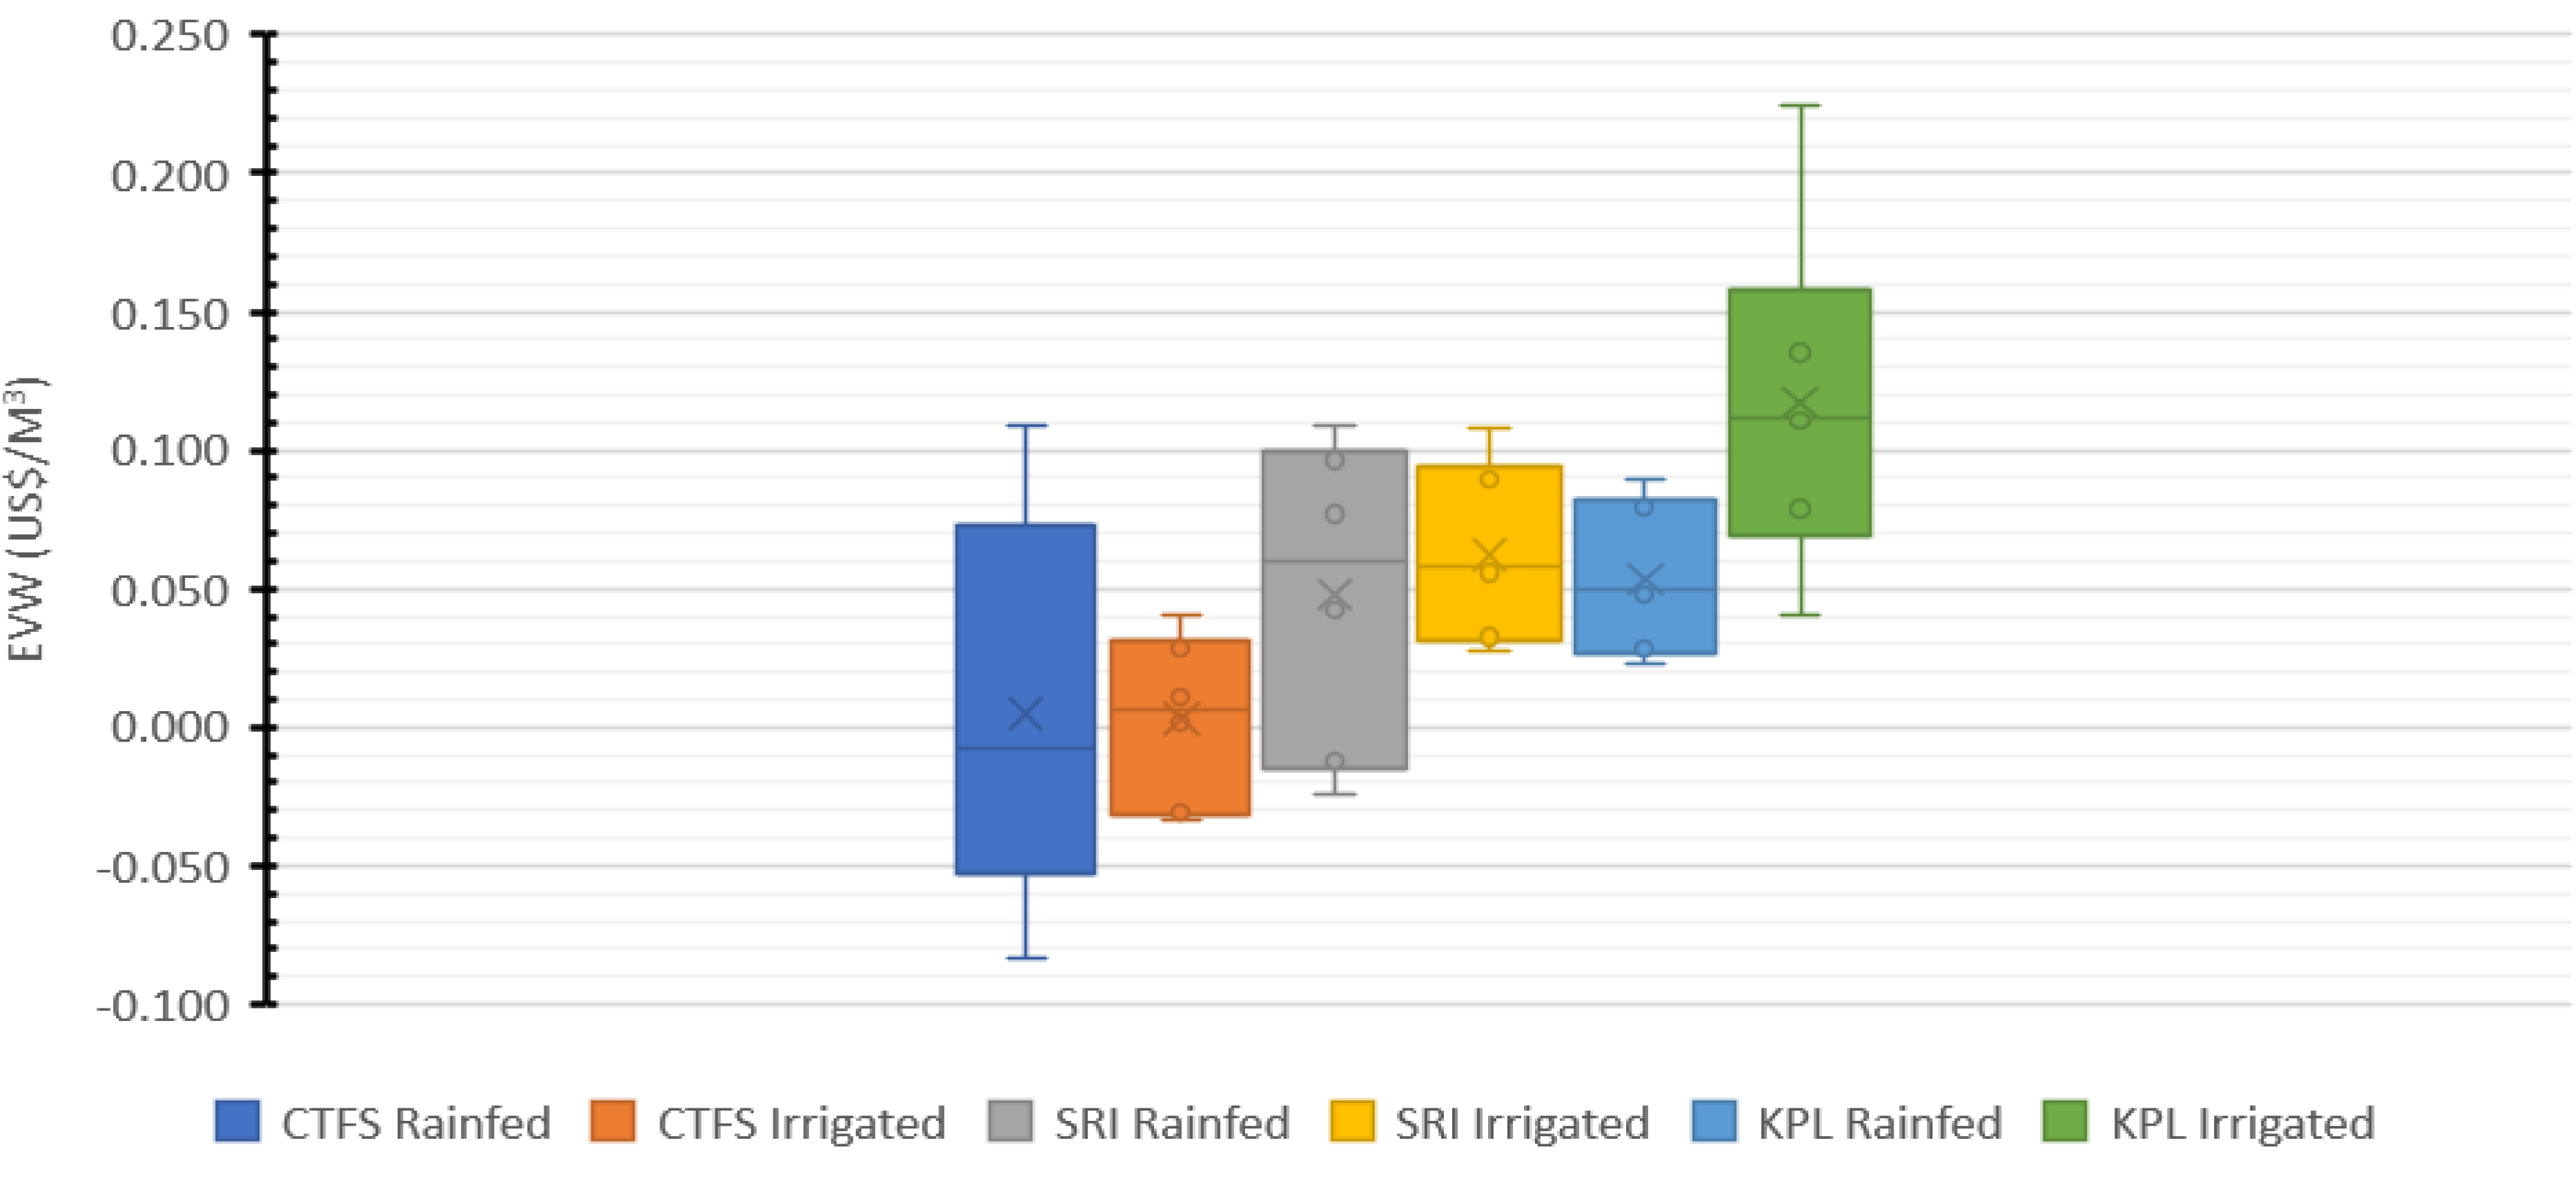
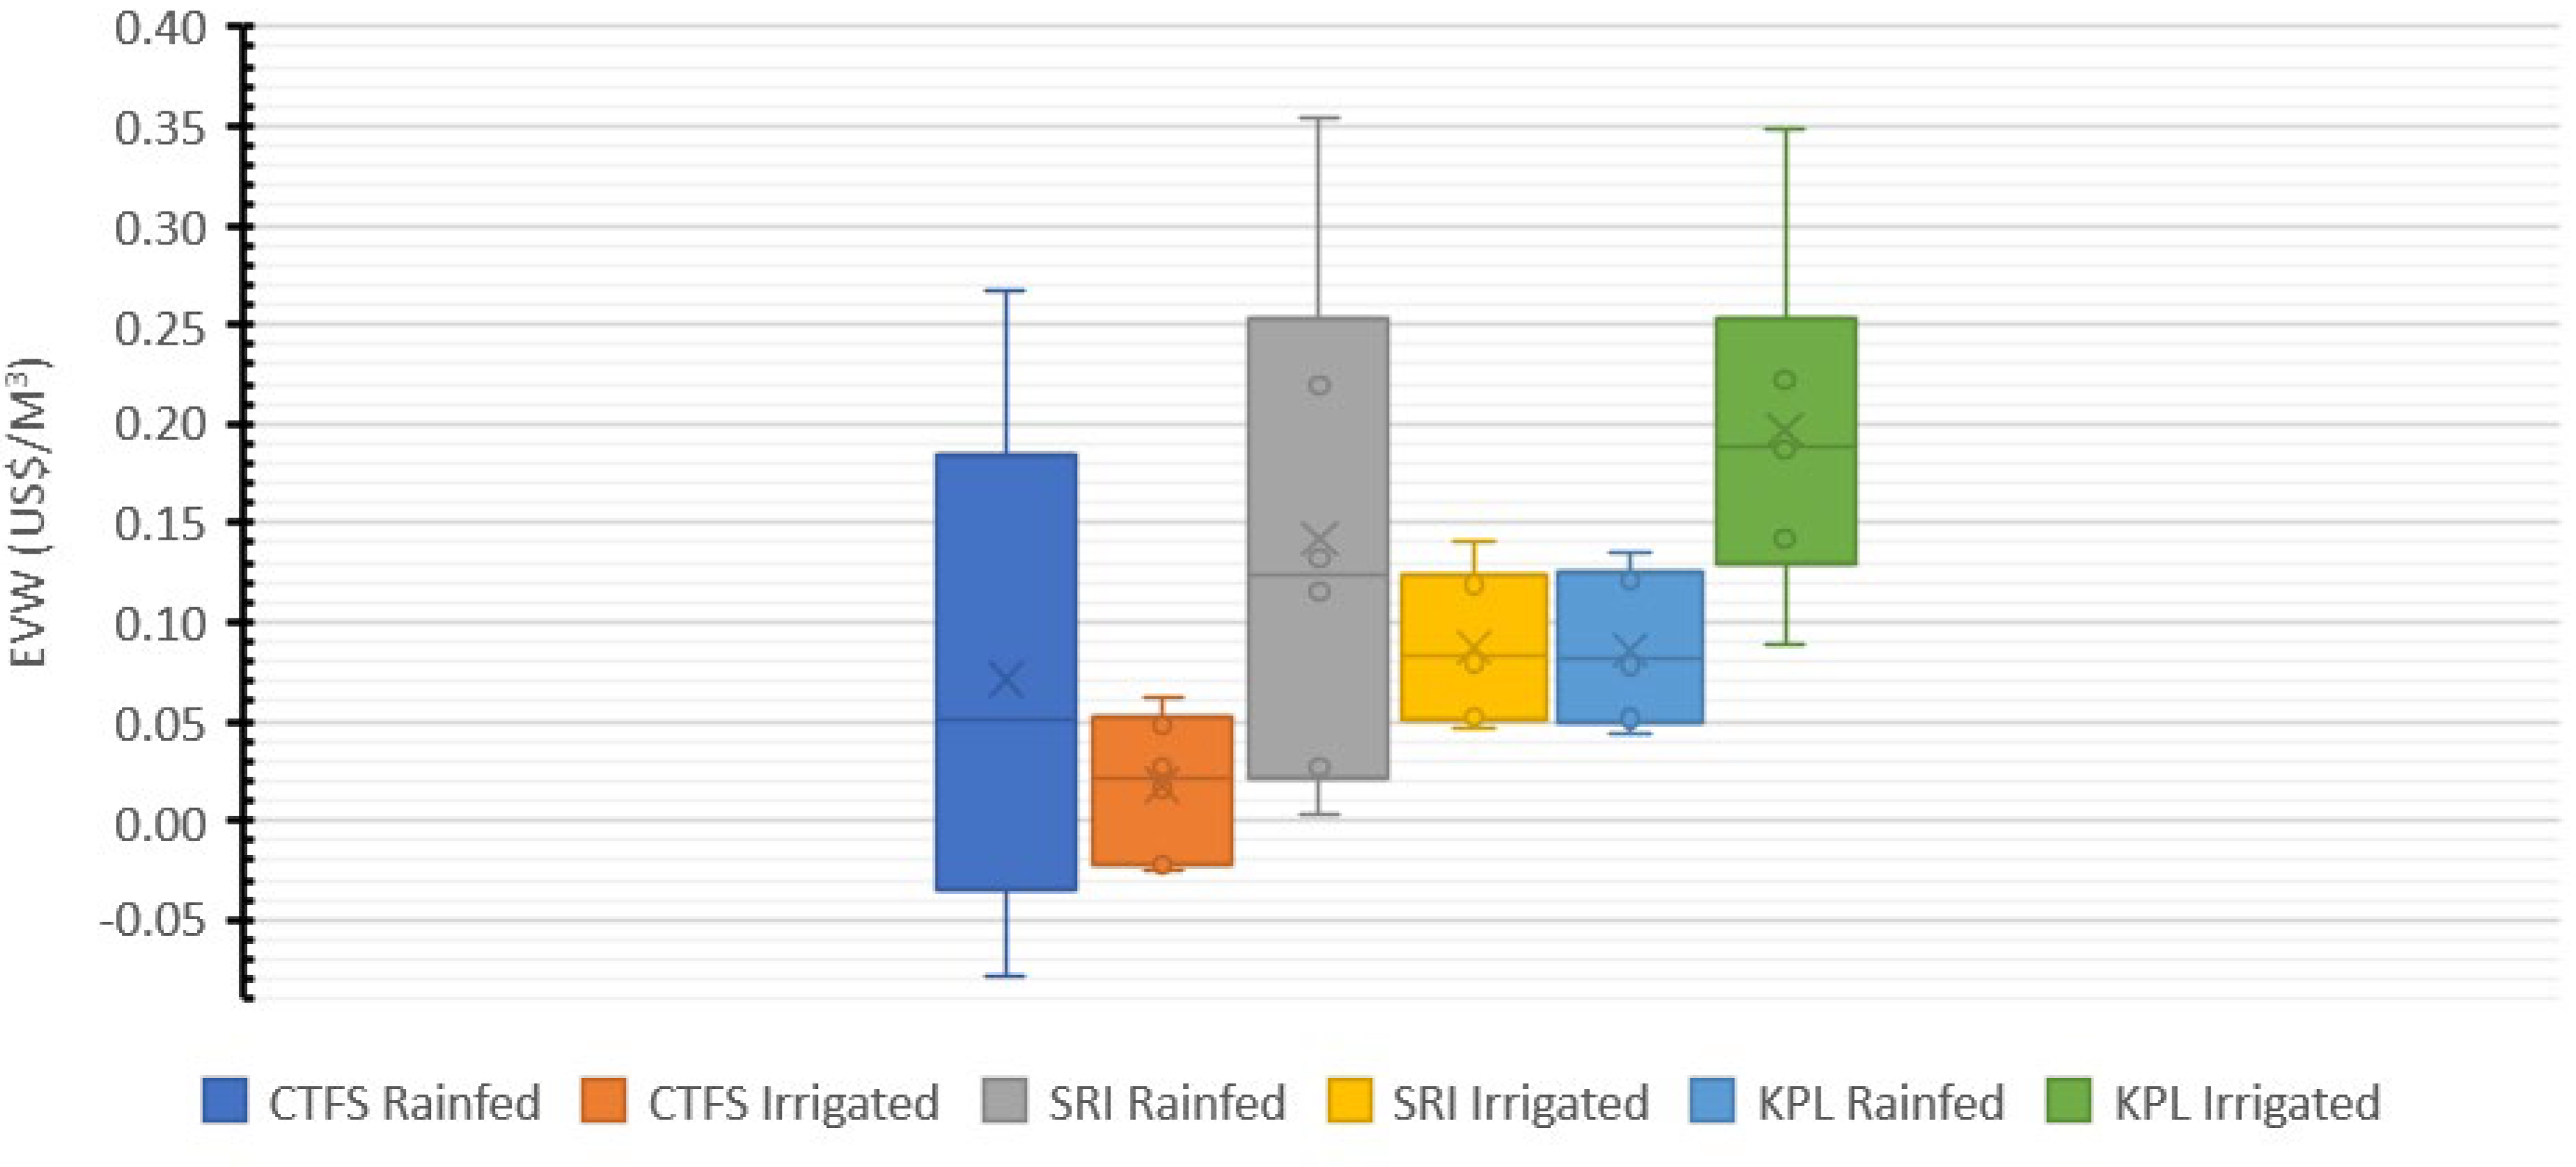
3.2. Economic Value of Water
3.3. Comparison of Study Water Productivity with Other Parts
4. Discussion
4.1. Climate Characteristics
4.2. Productivity Value of Water
5. Conclusions
- Farmers should be trained and encouraged to practice SRI (especially rainfed ones), which secures better AWP and serves more for downstream uses, reducing water use conflicts and sustaining the ecosystem. Since self-adoption has been too slow, policymakers need to allocate enough budget for an adequate time of demonstration and design rewarding schemes for efficient systems while also exercising law enforcement for inefficient ones. In addition, large-scale offtakes such as KPL present a good mechanism to anchor a PPP model with a caveat for efficient systems only.
- Government interventions are strongly recommended to support value addition from paddy to rice. This will not only secure higher EWP but also add multiplier effects on employment, branding of products, and statutory revenue through taxes and levies.
- Although KPL harvest less even in comparison with the poorest small-holder practice (i.e., CTFS), they fetch better and stable markets, which means better EWP. Corporative authorities through the district council should facilitate appropriate groupings of the disintegrated small-holder farmers. This will help them to have better price bargaining power and market influence.
- Since rainfed systems fetched better AWP even closer to the ideal one, it is recommended to reassess the mushrooming investments in irrigation infrastructure. This is especially meaningful in the face of big downstream flagship projects, e.g., Nyerere Hydro-Power Plant (HEP) and other needs further downstream, including the Rufiji River Delta ecosystem. Similar rivers, e.g., Great Ruaha, are seriously impaired due to these misaligned interventions to the detriment of the ecosystem in Ruaha National Park, HEP in Mtera and Kidatu, and others further downstream.
- In order to further finetune the AWP, it is also recommended to carry out long-term physical measurements of water flows to different farming systems and calculate the investment cost, including the depreciating/appreciating value of long-term assets such as land, equipment, etc.
Author Contributions
Funding
Institutional Review Board Statement
Informed Consent Statement
Data Availability Statement
Acknowledgments
Conflicts of Interest
References
- Siebert, S.; Burke, J.; Faures, J.-M.; Frenken, K.; Hoogeveen, J.; Döll, P.; Portmann, F.T. Groundwater use for irrigation—A global inventory. Hydrol. Earth Syst. Sci. 2010, 14, 1863–1880. [Google Scholar] [CrossRef] [Green Version]
- Rosegrant, M.W.; Ringler, C.; Zhu, T. Water for agriculture: Maintaining food security under growing scarcity. Annu. Rev. Environ. Resour. 2009, 34, 205–222. [Google Scholar] [CrossRef]
- Jägermeyr, J.; Gerten, D.; Heinke, J.; Schaphoff, S.; Kummu, M.; Lucht, W. Water savings potentials of irrigation systems: Global simulation of processes and linkages. Hydrol. Earth Syst. Sci. 2015, 19, 3073–3091. [Google Scholar] [CrossRef] [Green Version]
- Valipour, M. Future of agricultural water management in Africa. Arch. Agron. Soil Sci. 2015, 61, 907–927. [Google Scholar] [CrossRef]
- United Republic of Tanzania (URT). Tanzania Water Resources Atlas as of 2018. Available online: https://www.maji.go.tz/pages/publication (accessed on 12 December 2020).
- Kimaro, J. A review on managing agroecosystems for improved water use efficiency in the face of changing climate in Tanzania. Adv. Meteorol. 2019, 2019, 9178136. [Google Scholar] [CrossRef] [Green Version]
- Ngula, D.E.P. Pangani River Basin: Power generation and the environment. In Proceedings of the The Pangani River Basin: Options for management. Report of a Workshop held at the Kilimanjaro Crane Hotel, Moshi, Tanzania, 8–10 May 2002; pp. 8–10. [Google Scholar]
- Molden, D.; Sakthivadivel, R.; Habib, Z. Basin-Level Use and Productivity of Water: Examples from South Asia; IWMI: Colombo, Sri Lanka, 2001; Volume 49. [Google Scholar]
- Watkins, K. Human Development Report 2006-Beyond scarcity: Power, poverty and the global water crisis. UNDP Hum. Dev. Rep. 2006. Available online: https://ssrn.com/abstract=2294691 (accessed on 1 October 2022).
- Molden, D.; Murray-Rust, H.; Sakthivadivel, R.; Makin, I. A water-productivity framework for understanding and action. In Water Productivity in Agriculture: Limits and Opportunities for Improvement; CABI: Wallingford, UK, 2003; pp. 1–18. [Google Scholar]
- Tropp, H. Water governance challenges: Managing competition and scarcity for hunger and poverty reduction and environmental sustainability. In Human Development Report; (No. HDOCPA-2006-13); Human Development Report Office (HDRO), United Nations Development Programme (UNDP): New York, NY, USA, 2006; pp. 1–47. [Google Scholar]
- Rijsberman, F.R.; Molden, D. Balancing water uses: Water for food and water for nature. In Proceedings of the Thematic Background Paper to the International Conference on Freshwater, Bonn, Germany, 3–7 December 2001; pp. 43–56. [Google Scholar]
- Cook, S.; Gichuki, F.; Turral, H. Agricultural Water Productivity: Issues, Concepts and Approaches; Working Report No. 618-2016-41183; CGIAR Challenge Program on Water and Food: Montpellier, France, 2006. [Google Scholar]
- Rosegrant, M.W.; Cai, X.; Cline, S.A. World Water and Food to 2025: Dealing with Scarcity; International Food Policy Research Institute: Washington, DC, USA, 2002. [Google Scholar]
- Kijne, J.W.; Tuong, T.P.; Bennett, J.; Bouman, B.; Oweis, T. Ensuring food security via improvement in crop water productivity. Chall. Progr. Water Food Backgr. Pap. 2003, 1, 20–26. [Google Scholar]
- Upboff, N. The System of Rice Intensification (SRI) as a system of agricultural innovation. J. Ilmu Tanah dan Lingkung. 2008, 10, 27–40. [Google Scholar] [CrossRef]
- Kahimba, F.C.; Kombe, E.E.; Mahoo, H.F. The potential of system of rice intensification (SRI) to increase rice water productivity: A case of Mkindo irrigation scheme in Morogoro region, Tanzania. Tanzania J. Agric. Sci. 2013, 12. [Google Scholar]
- Kadigi, R.M.J.; Kashaigili, J.J.; Mdoe, N.S. The economics of irrigated paddy in Usangu Basin in Tanzania: Water utilization, productivity, income and livelihood implications. Phys. Chem. Earth Parts A/B/C 2004, 29, 1091–1100. [Google Scholar] [CrossRef]
- Kavishe, R.E.; Kahimba, F.C.; Komakech, H.C. Farmer’s appropriation of system of rice intensification practices in water-scarce irrigation schemes in Northern Tanzania. Paddy Water Environ. 2021, 19, 367–381. [Google Scholar] [CrossRef]
- Mdemu, M.V.; Francis, T.; Wurbs, R. Productivity of water in large rice (paddy) irrigation schemes in the upper catchment of the Great Ruaha River Basin, Tanzania. In Water Resources Planning, Development and Management; IntechOpen: London, UK, 2013; pp. 117–142. [Google Scholar]
- Musamba, E.B.; Ngaga, Y.M.; Boon, E.K.; Giliba, R.A.; Sirima, A.; Chirenje, L.I. The economics of water in paddy and non-paddy crop production around the Kilombero Valley Ramsar Site, Tanzania: Productivity, costs, returns and implication to poverty reduction. J. Agric. Sci. 2011, 2, 17–27. [Google Scholar] [CrossRef]
- Chiang, A.C. Fundamental Methods of Mathematical Economics, 4th ed.; Wainwright, K., Ed.; McGraw-Hill Education: New York, NY, USA, 2005; ISBN 9780070109100. [Google Scholar]
- Young, R.A. Measuring Economic Benefits for Water Investments and Policies; World Bank: Washington, DC, USA, 1996; ISBN 978-0-8213-3745-5. [Google Scholar]
- Allen, R.G.; Pereira, L.S.; Raes, D.; Smith, M. FAO Irrigation and Drainage Paper No. 56; Rome Food and Agriculture Organization, United Nations: Rome, Italy, 1998; Volume 56, p. e156. [Google Scholar]
- Sachan, S.; Chandola, V.K.; Lohani, A.K. Probability analysis of annual rainfall and identification of deficit rainfall in left bank canal command of upper Bhima basin of Maharashtra. Curr. Adv. Agric. Sci. 2019, 11, 42–46. [Google Scholar] [CrossRef]
- Wilson, E.; McInnes, R.; Mbaga, D.P.; Ouedaogo, P. Ramsar Advisory Mission Report: United Republic of Tanzania, Kilombero Valley. Gland Switz. 2017. Working Report. [Google Scholar]
- Koutsouris, A.J.; Chen, D.; Lyon, S.W. Comparing global precipitation data sets in eastern Africa: A case study of Kilombero Valley, Tanzania. Int. J. Climatol. 2016, 36, 2000–2014. [Google Scholar] [CrossRef]
- Näschen, K.; Diekkrüger, B.; Leemhuis, C.; Steinbach, S.; Seregina, L.S.; Thonfeld, F.; der Linden, R. Hydrological modeling in data-scarce catchments: The Kilombero floodplain in Tanzania. Water 2018, 10, 599. [Google Scholar] [CrossRef] [Green Version]
- Nicholson, S.E. The nature of rainfall variability over Africa on time scales of decades to millenia. Glob. Planet. Chang. 2000, 26, 137–158. [Google Scholar] [CrossRef]
- NBS. National Population and Housing Census in Tanzania by December 2012; National Bureau of Statistics: Dar es Salaam, Tanzania, 2013. [Google Scholar]
- WREM & RBWB Rufiji Basin Integrated Water Resources Management and Development Plan Draft Final Report; Volume 1: Rufiji Basin Plan. Report Prepared for the United Republic of Tanzania; Ministry of Water, by WREM International Inc.: Atlanta, GA, USA; Iringa, Tanzania, 2013; p. xi.
- Sulle, E. Bureaucrats, investors and smallholders: Contesting land rights and agro-commercialisation in the Southern agricultural growth corridor of Tanzania. J. East. African Stud. 2020, 14, 332–353. [Google Scholar] [CrossRef] [Green Version]
- Kadigi, R.M.J.; Kashaigili, J.J.; Sirima, A.; Kamau, F.; Sikira, A.; Mbungu, W. Land Fragmentation, Agricultural Productivity and Implications for Agricultural Investments in the Southern Agricultural Growth Corridor of Tanzania (SAGCOT) Region, Tanzania; Sokoine University of Agriculture: Morogoro, Tanzania, 2017. [Google Scholar]
- Kangalawe, R.Y.M.; Liwenga, E.T. Livelihoods in the wetlands of Kilombero Valley in Tanzania: Opportunities and challenges to integrated water resource management. Phys. Chem. Earth, Parts A/B/C 2005, 30, 968–975. [Google Scholar] [CrossRef]
- Mtega, B. Agriculture and Wildlife Conservation Udzungwa-Selous Corridor: A Case Study of Kilombero District, Morogoro; The University of Dodoma: Dodoma, Tanzania, 2017. [Google Scholar]
- Seki, H.A.; Shirima, D.D.; Courtney Mustaphi, C.J.; Marchant, R.; Munishi, P.K.T. The impact of land use and land cover change on biodiversity within and adjacent to Kibasira Swamp in Kilombero Valley, Tanzania. Afr. J. Ecol. 2018, 56, 518–527. [Google Scholar] [CrossRef]
- Mkonda, M.Y.; He, X. Production Trends of Food Crops: Opportunities, Challenges and Prospects to Improve Tanzanian Rural Livelihoods; Sokoine University of Agriculture: Morogoro, Tanzania, 2016. [Google Scholar]
- Theunissen, K.; Klerkx, J.; Melnikov, A.; Mruma, A. Mechanisms of inheritance of rift faulting in the western branch of the East African Rift, Tanzania. Tectonics 1996, 15, 776–790. [Google Scholar] [CrossRef]
- WREM & RBWB Rufiji IWRMD Plan Draft Final Report; Volume 1: Climate and Hydrologic Modeling and Assessments. Report Prepared for the United Republic of Tanzania; Ministry of Water, by WREM International Inc.: Atlanta, GA, USA; Iringa, Tanzania, 2013.
- Kato, F. Development of a major rice cultivation area in the Kilombero Valley, Tanzania. Afr. Study Monogr. Suppl. Issue 2007, 36, 3–18. [Google Scholar]
- RBWB Monitoring of Parmited and Illegal Water Uses in Rufiji River Basin; Rufiji Basin Water Board: Iringa, Tanzania, 2015.
- Sigalla, O.Z.; Kadigi, R.M.J.; Komakech, H.C. Profitability Analysis of Paddy Farming Systems in Wetland Areas: An Additional Layer in Water Allocation Decisions. Curr. Res. Environ. Sustain. 2022. Submitted for publication – Elsevier, CRSUST-D-21-00528. [Google Scholar]
- Bokke, A.S.; Shoro, K.E. Impact of effective rainfall on net irrigation water requirement: The case of Ethiopia. Water Sci. 2020, 34, 155–163. [Google Scholar] [CrossRef]
- Nagy, A.; Tamás, J.; Fórián, T.; Nyéki, J.; Soltész, M.; Szabó, Z. Irrigation modeling in a pear orchard. Int. J. Hortic. Sci. 2010, 16, 75–79. [Google Scholar] [CrossRef] [Green Version]
- Kadigi, R.M.J.; Mdoe, N.S.Y.; Ashimogo, G.C.; Morardet, S. Water for irrigation or hydropower generation? — Complex questions regarding water allocation in Tanzania. Agric. Water Manag. 2008, 95, 984–992. [Google Scholar] [CrossRef]
- Hussain, I.; Raschid, L.; Hanjra, M.A.; Marikar, F.; van der Hoek, W. A Framework for Analyzing Socioeconomic, Health and Environmental Impacts of Wastewater Use in Agriculture in Developing Countries; IWMI: Colombo, Sri Lanka, 2001; Volume 26. [Google Scholar]
- Najmuddin, O.; Rasul, G.; Hussain, A.; Molden, D.; Wahid, S.; Debnath, B. Low water productivity for Rice in Bihar, India—A critical analysis. Water 2018, 10, 1082. [Google Scholar] [CrossRef] [Green Version]
- Wilson, R.T.; Lewis, I. The RICE Value Chain in Tanzania: A report from the Southern Highlands Food Systems Programme; FAO: Rome, Italy, 2015. [Google Scholar]
- United Republic of Tanzania. National Irrigation Masterplan—Tanzania; Ministry of Water and Irrigation: Dodoma, Tanzania, 2018; pp. 1–479.
- Xie, H.; You, L.; Wielgosz, B.; Ringler, C. Estimating the potential for expanding smallholder irrigation in Sub-Saharan Africa. Agric. Water Manag. 2014, 131, 183–193. [Google Scholar] [CrossRef]


| N | Farming Systems | ETc (mm) | Water Use (m3/ha) | MIN | Q1 | Q2 | Q3 | MAX | Mean | Ideal PWP |
|---|---|---|---|---|---|---|---|---|---|---|
| PWP (Kg/m3) | ||||||||||
| 1 | CTFS Rainfed | 687.7 | 10,313 | 0.07 | 0.22 | 0.31 | 0.61 | 0.79 | 0.39 | 0.59 |
| 2 | CTFS Irrigated | 630.9 | 14,542 | 0.17 | 0.18 | 0.34 | 0.40 | 0.45 | 0.30 | 0.70 |
| 3 | SRI Rainfed | 687.7 | 10,313 | 0.41 | 0.46 | 0.68 | 0.90 | 0.95 | 0.68 | 1.02 |
| 4 | SRI Irrigated | 630.9 | 14,542 | 0.40 | 0.42 | 0.50 | 0.62 | 0.68 | 0.52 | 1.19 |
| 5 | KPL Rainfed | 687.7 | 10,313 | 0.22 | 0.24 | 0.32 | 0.44 | 0.48 | 0.33 | 0.50 |
| 6 | KPL Irrigated | 630.9 | 6495 | 0.42 | 0.56 | 0.67 | 0.76 | 1.09 | 0.68 | 0.70 |
| N | Farming Systems | Avrg. Farm Size (ha) | Mean | MIN | Q1 | Q2 | Q3 | MAX |
|---|---|---|---|---|---|---|---|---|
| All Values Are in Kg/ha | ||||||||
| 1 | CTFS Rainfed | 1.58 | 4058 | 682 | 2302 | 3240 | 6309 | 8184 |
| 2 | CTFS Irrigated | 0.65 | 4410 | 2450 | 2613 | 4900 | 5880 | 6533 |
| 3 | SRI Rainfed | 1.22 | 7025 | 4215 | 4740 | 7020 | 9310 | 9830 |
| 4 | SRI Irrigated | 0.73 | 7516 | 5869 | 6100 | 7259 | 8958 | 9884 |
| 5 | KPL Rainfed | 2003.7 | 3429 | 2230 | 2470 | 3250 | 4520 | 4920 |
| 6 | KPL Irrigated | 1404.3 | 4445 | 2740 | 3640 | 4380 | 4960 | 7060 |
| N | Farming Systems | MIN | Q1 | Q2 | Q3 | MAX | Mean | Water Use m3/ha | Land | Labor | Capital | |
|---|---|---|---|---|---|---|---|---|---|---|---|---|
| All EVW Are in US$/m3 | Input Values in US$/ha | |||||||||||
| 1 | CTFS Rainfed | Paddy | −0.08 | −0.04 | −0.02 | 0.06 | 0.11 | 0.003 | 10,313 | 107.75 | 653.10 | 282.84 |
| Rice | −0.08 | −0.02 | 0.04 | 0.16 | 0.27 | 0.06 | ||||||
| 2 | CTFS Irrigated | Paddy | −0.03 | −0.03 | 0.01 | 0.03 | 0.04 | 0.002 | 14,542 | 111.77 | 769.91 | 253.35 |
| Rice | −0.03 | −0.02 | 0.03 | 0.05 | 0.062 | 0.02 | ||||||
| 3 | SRI Rainfed | Paddy | −0.02 | −0.01 | 0.04 | 0.10 | 0.11 | 0.08 | 10,313 | 161.34 | 838.40 | 285.57 |
| Rice | 0.003 | 0.03 | 0.12 | 0.22 | 0.355 | 0.13 | ||||||
| 4 | SRI Irrigated | Paddy | 0.03 | 0.03 | 0.06 | 0.09 | 0.11 | 0.06 | 14,542 | 188.23 | 830.59 | 274.82 |
| Rice | 0.05 | 0.05 | 0.08 | 0.12 | 0.14 | 0.09 | ||||||
| 5 | KPL Rainfed | Paddy | 0.02 | 0.03 | 0.05 | 0.08 | 0.09 | 0.05 | 10,313 | 334.48 | ||
| Rice | 0.04 | 0.05 | 0.08 | 0.12 | 0.14 | 0.08 | ||||||
| 6 | KPL Irrigated | Paddy | 0.04 | 0.08 | 0.11 | 0.14 | 0.22 | 0.11 | 6495 | 495.28 | ||
| Rice | 0.09 | 0.14 | 0.19 | 0.22 | 0.35 | 0.19 | ||||||
| N | Farming Inputs | Irrigated SRI | Rainfed SRI | Irrigated CTFS | Rainfed CTFS |
|---|---|---|---|---|---|
| A. Land Input | |||||
| 1 | Renting a farm | 188.23 | 161.34 | 111.77 | 107.75 |
| Sub Total A | 188.23 | 161.34 | 111.77 | 107.75 | |
| B. Labor Inputs | |||||
| 2 | Farm Clearing | 53.78 | 43.02 | 35.65 | 32.65 |
| 3 | Ploughing | 64.54 | 64.54 | 56.85 | 59.54 |
| 4 | Blocks preparation | 53.93 | 53.78 | 37.65 | 32.27 |
| 5 | Nursery preparations | 26.89 | 26.86 | 21.51 | 13.44 |
| 6 | Watering the farm | 48.40 | - | 43.02 | - |
| 7 | Field leveling | 80.67 | 72.60 | 63.66 | 64.54 |
| 8 | Uprooting seedlings | 37.65 | 43.02 | 26.39 | 24.20 |
| 9 | Rice transplanting | 86.40 | 86.05 | 58.02 | 59.54 |
| 10 | Weeding with chemicals | 64.54 | 96.80 | 64.43 | 53.35 |
| 11 | 2nd Weeding manual | 59.16 | 75.29 | 59.16 | 48.40 |
| 12 | Bird control | 86.05 | 69.91 | 53.78 | - |
| 13 | Harvesting | 46.25 | 64.54 | 64.54 | 80.67 |
| 14 | Threshing | 89.81 | 93.04 | 103.79 | 127.52 |
| 15 | Winnowing | 32.54 | 48.94 | 81.48 | 57.01 |
| Sub Total B | 830.59 | 838.40 | 769.91 | 653.10 | |
| C. Capital Inputs | |||||
| 16 | Seeds | 16.13 | 13.60 | 19.41 | 14.03 |
| 17 | Initiation fertilizer | 13.44 | 35.33 | 14.68 | 33.40 |
| 18 | Pesticides/Insecticides | 6.45 | 5.92 | 8.07 | 5.38 |
| 19 | Weeding chemicals | 29.58 | 30.65 | 29.58 | 34.96 |
| 20 | Boosting fertilizer | 91.43 | 40.33 | 21.51 | 14.99 |
| 21 | Pesticides/Insecticides | 6.45 | 5.92 | 8.07 | 5.38 |
| 22 | Panicle initiation fertilizer | 5.93 | 5.38 | 27.27 | 14.99 |
| 23 | Transportation costs | 70.99 | 116.16 | 82.82 | 127.46 |
| 24 | Storage | 34.42 | 32.27 | 41.95 | 32.27 |
| Sub Total C | 275 | 286 | 253 | 283 | |
| Grant Total Paddy | 1293.64 | 1285.30 | 1135.02 | 1043.70 | |
| Grant Total Rice | 1387.76 | 1374.04 | 1236.13 | 1232.46 | |
| N | Water Productivity | Area (Region/Catchment) | Research Source | Received Rainfall (mm) |
|---|---|---|---|---|
| 1 | 0.30–0.68 Kg/m3 0.002–0.11 US$/m3 | Study area in Kilombero catchment | current study | 1200–1400 |
| 2 | 0.85 Kg/m3 0.23 US$/ m3 | [21] | ||
| 2 | 0.15–0.51 Kg/m3 | Arusha in Kikuletwa Catchment | [19] | 590–1460 |
| 3 | 0.17–0.22 Kg/m3 0.02–0.8 US$/m3 | Usangu in Great Ruaha catchment | [20] | 669 |
| 4 | 0.126–0.265 Kg/m3 0.01–0.04 US$/m3 | [18] | 669 | |
| 5 | 0.14–0.47 Kg/m3 | Morogoro in Wami Catchment | [17] | 669 |
| N | Practice | Practice Countrywide | KRC Harvest (Tons/ha) | Countrywide Harvest (Tons/ha) |
|---|---|---|---|---|
| 1 | Rainfed CTFS | Rainfed traditional system | 4.058 | 1–1.8 |
| 2 | Irrigated CTFS | Traditionally Irrigated | 4.410 | 1–2 |
| 3 | Rainfed SRI | Improved Traditional | 7.025 | 4 |
| 4 | Irrigated SRI | 7.516 | 6 | |
| 5 | Rainfed KPL | Mechanized/High Inputs/Modern varieties | 3.429 | 2–6 |
| 6 | Irrigated KPL | 4.445 |
Publisher’s Note: MDPI stays neutral with regard to jurisdictional claims in published maps and institutional affiliations. |
© 2022 by the authors. Licensee MDPI, Basel, Switzerland. This article is an open access article distributed under the terms and conditions of the Creative Commons Attribution (CC BY) license (https://creativecommons.org/licenses/by/4.0/).
Share and Cite
Sigalla, O.Z.; Kadigi, R.M.J.; Selemani, J.R. Assessment of Variation in Marginal Productivity Value of Water in Paddy Farming Systems in Times of Water Stress. Water 2022, 14, 3459. https://doi.org/10.3390/w14213459
Sigalla OZ, Kadigi RMJ, Selemani JR. Assessment of Variation in Marginal Productivity Value of Water in Paddy Farming Systems in Times of Water Stress. Water. 2022; 14(21):3459. https://doi.org/10.3390/w14213459
Chicago/Turabian StyleSigalla, Onesmo Zakaria, Reuben Mpuya Joseph Kadigi, and Juma Rajabu Selemani. 2022. "Assessment of Variation in Marginal Productivity Value of Water in Paddy Farming Systems in Times of Water Stress" Water 14, no. 21: 3459. https://doi.org/10.3390/w14213459
APA StyleSigalla, O. Z., Kadigi, R. M. J., & Selemani, J. R. (2022). Assessment of Variation in Marginal Productivity Value of Water in Paddy Farming Systems in Times of Water Stress. Water, 14(21), 3459. https://doi.org/10.3390/w14213459