
Study on Location Decision of Multi-Functional Rainwater Storage Space in High-Density Built-Up Area


Abstract
:1. Introduction
2. Materials and Methods
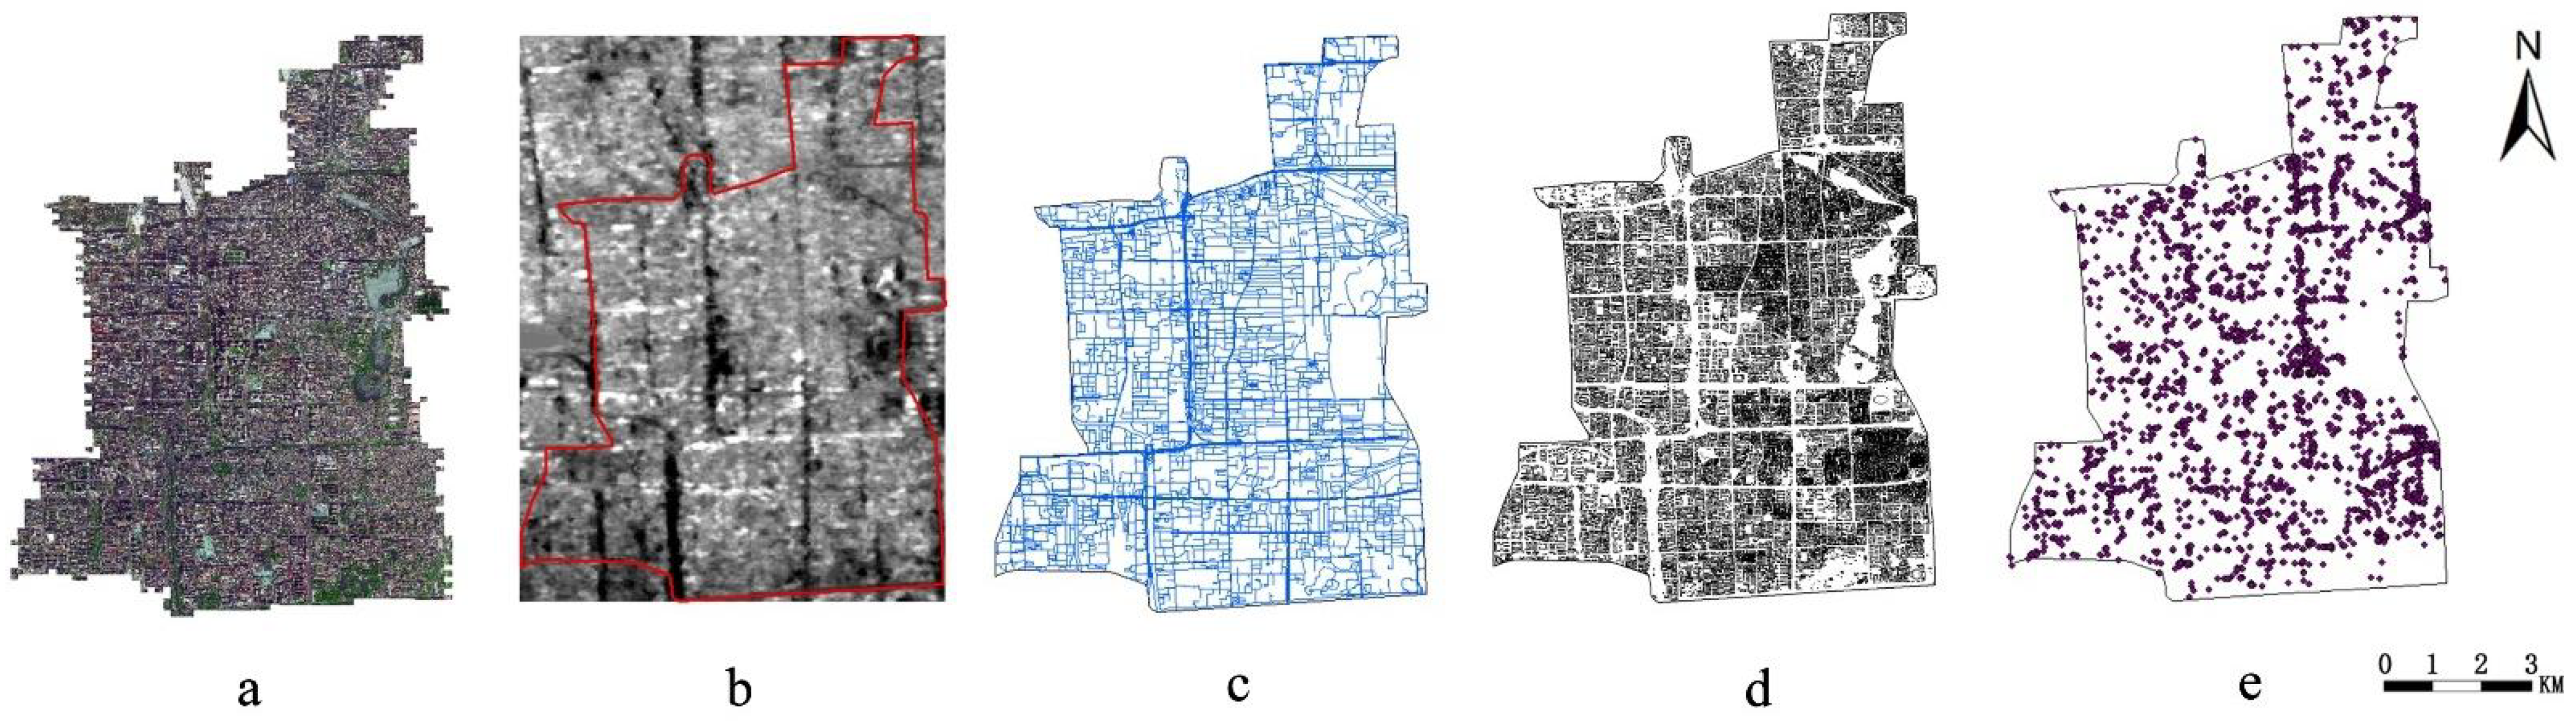
2.1. Study Area and Data
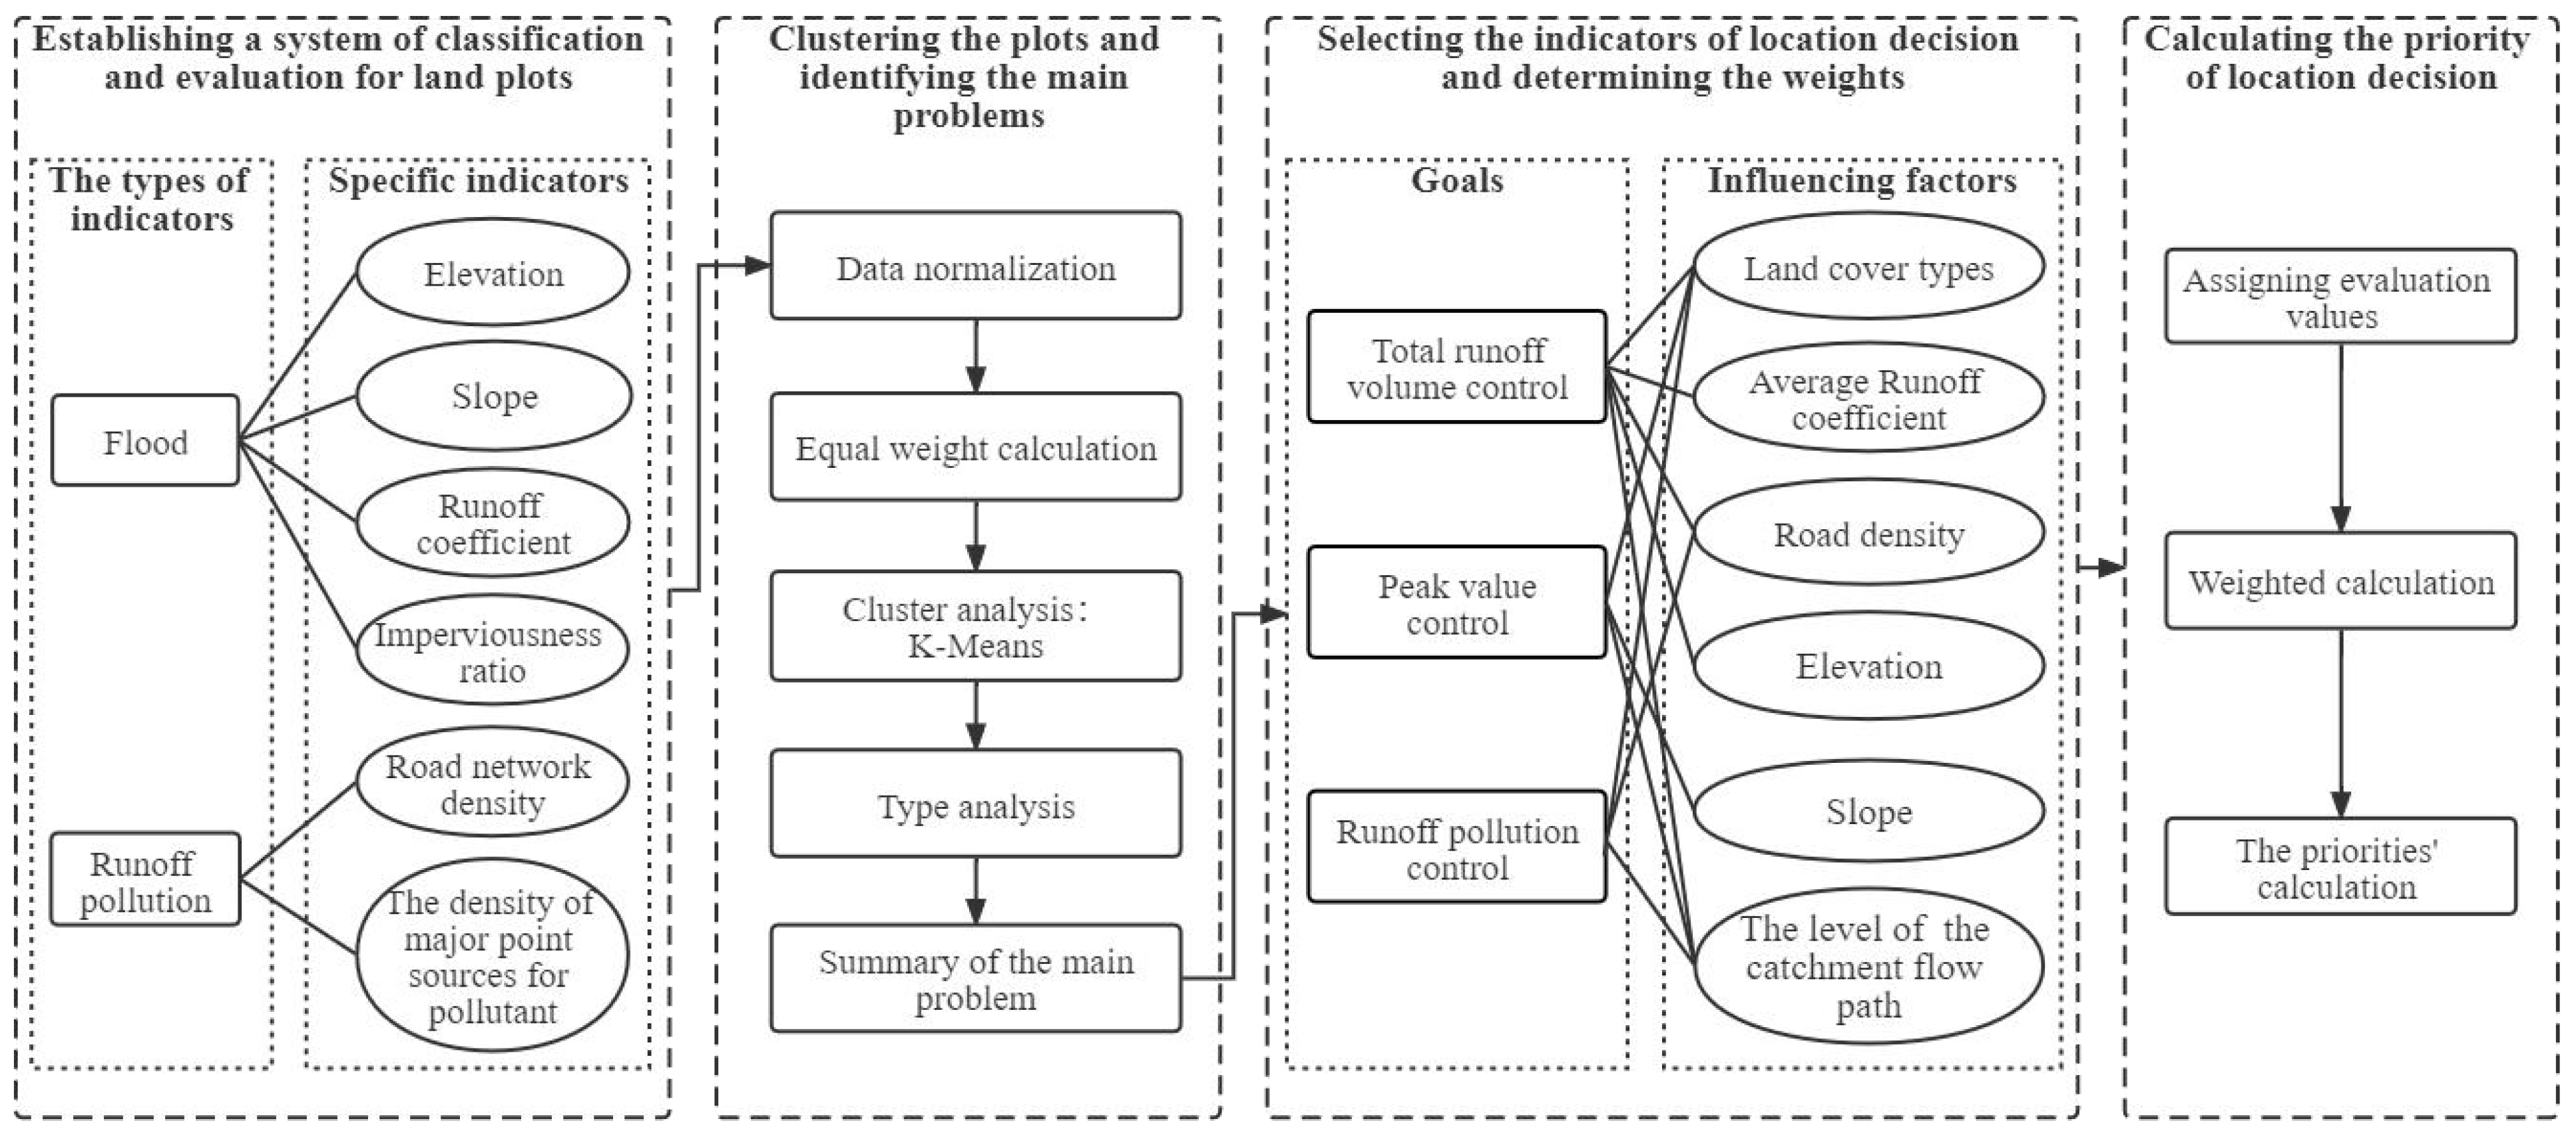
2.2. Methods
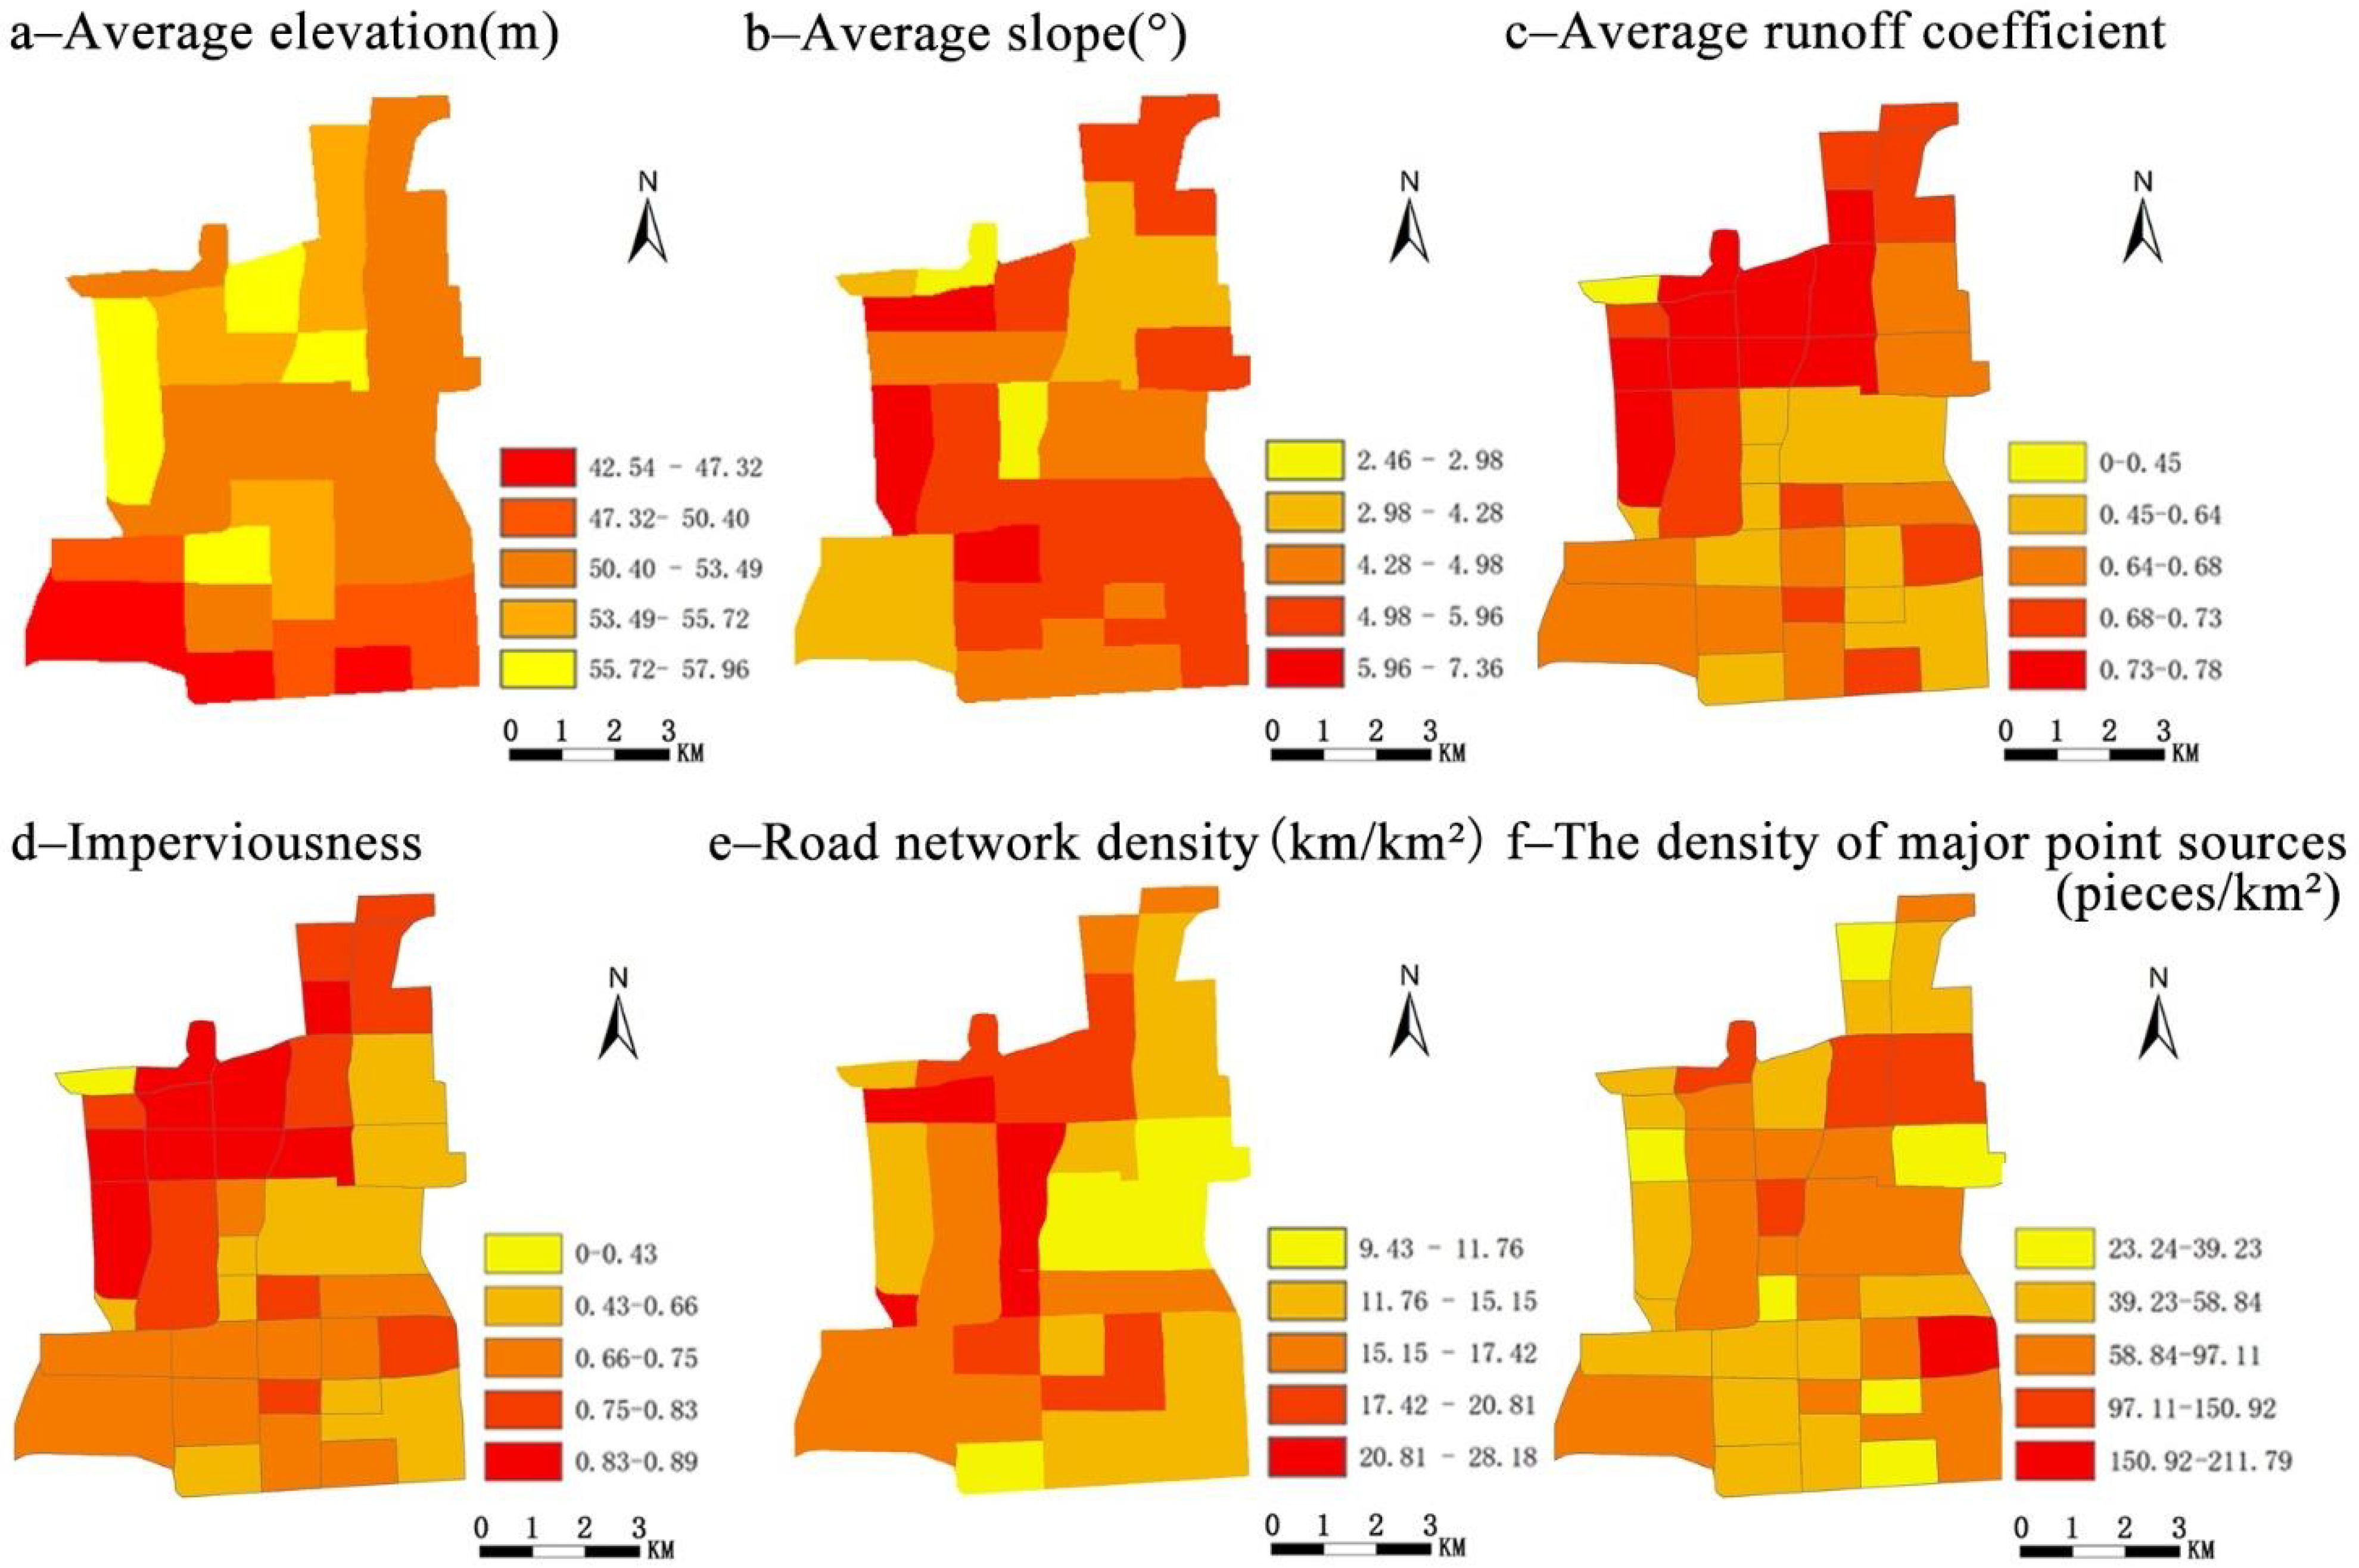
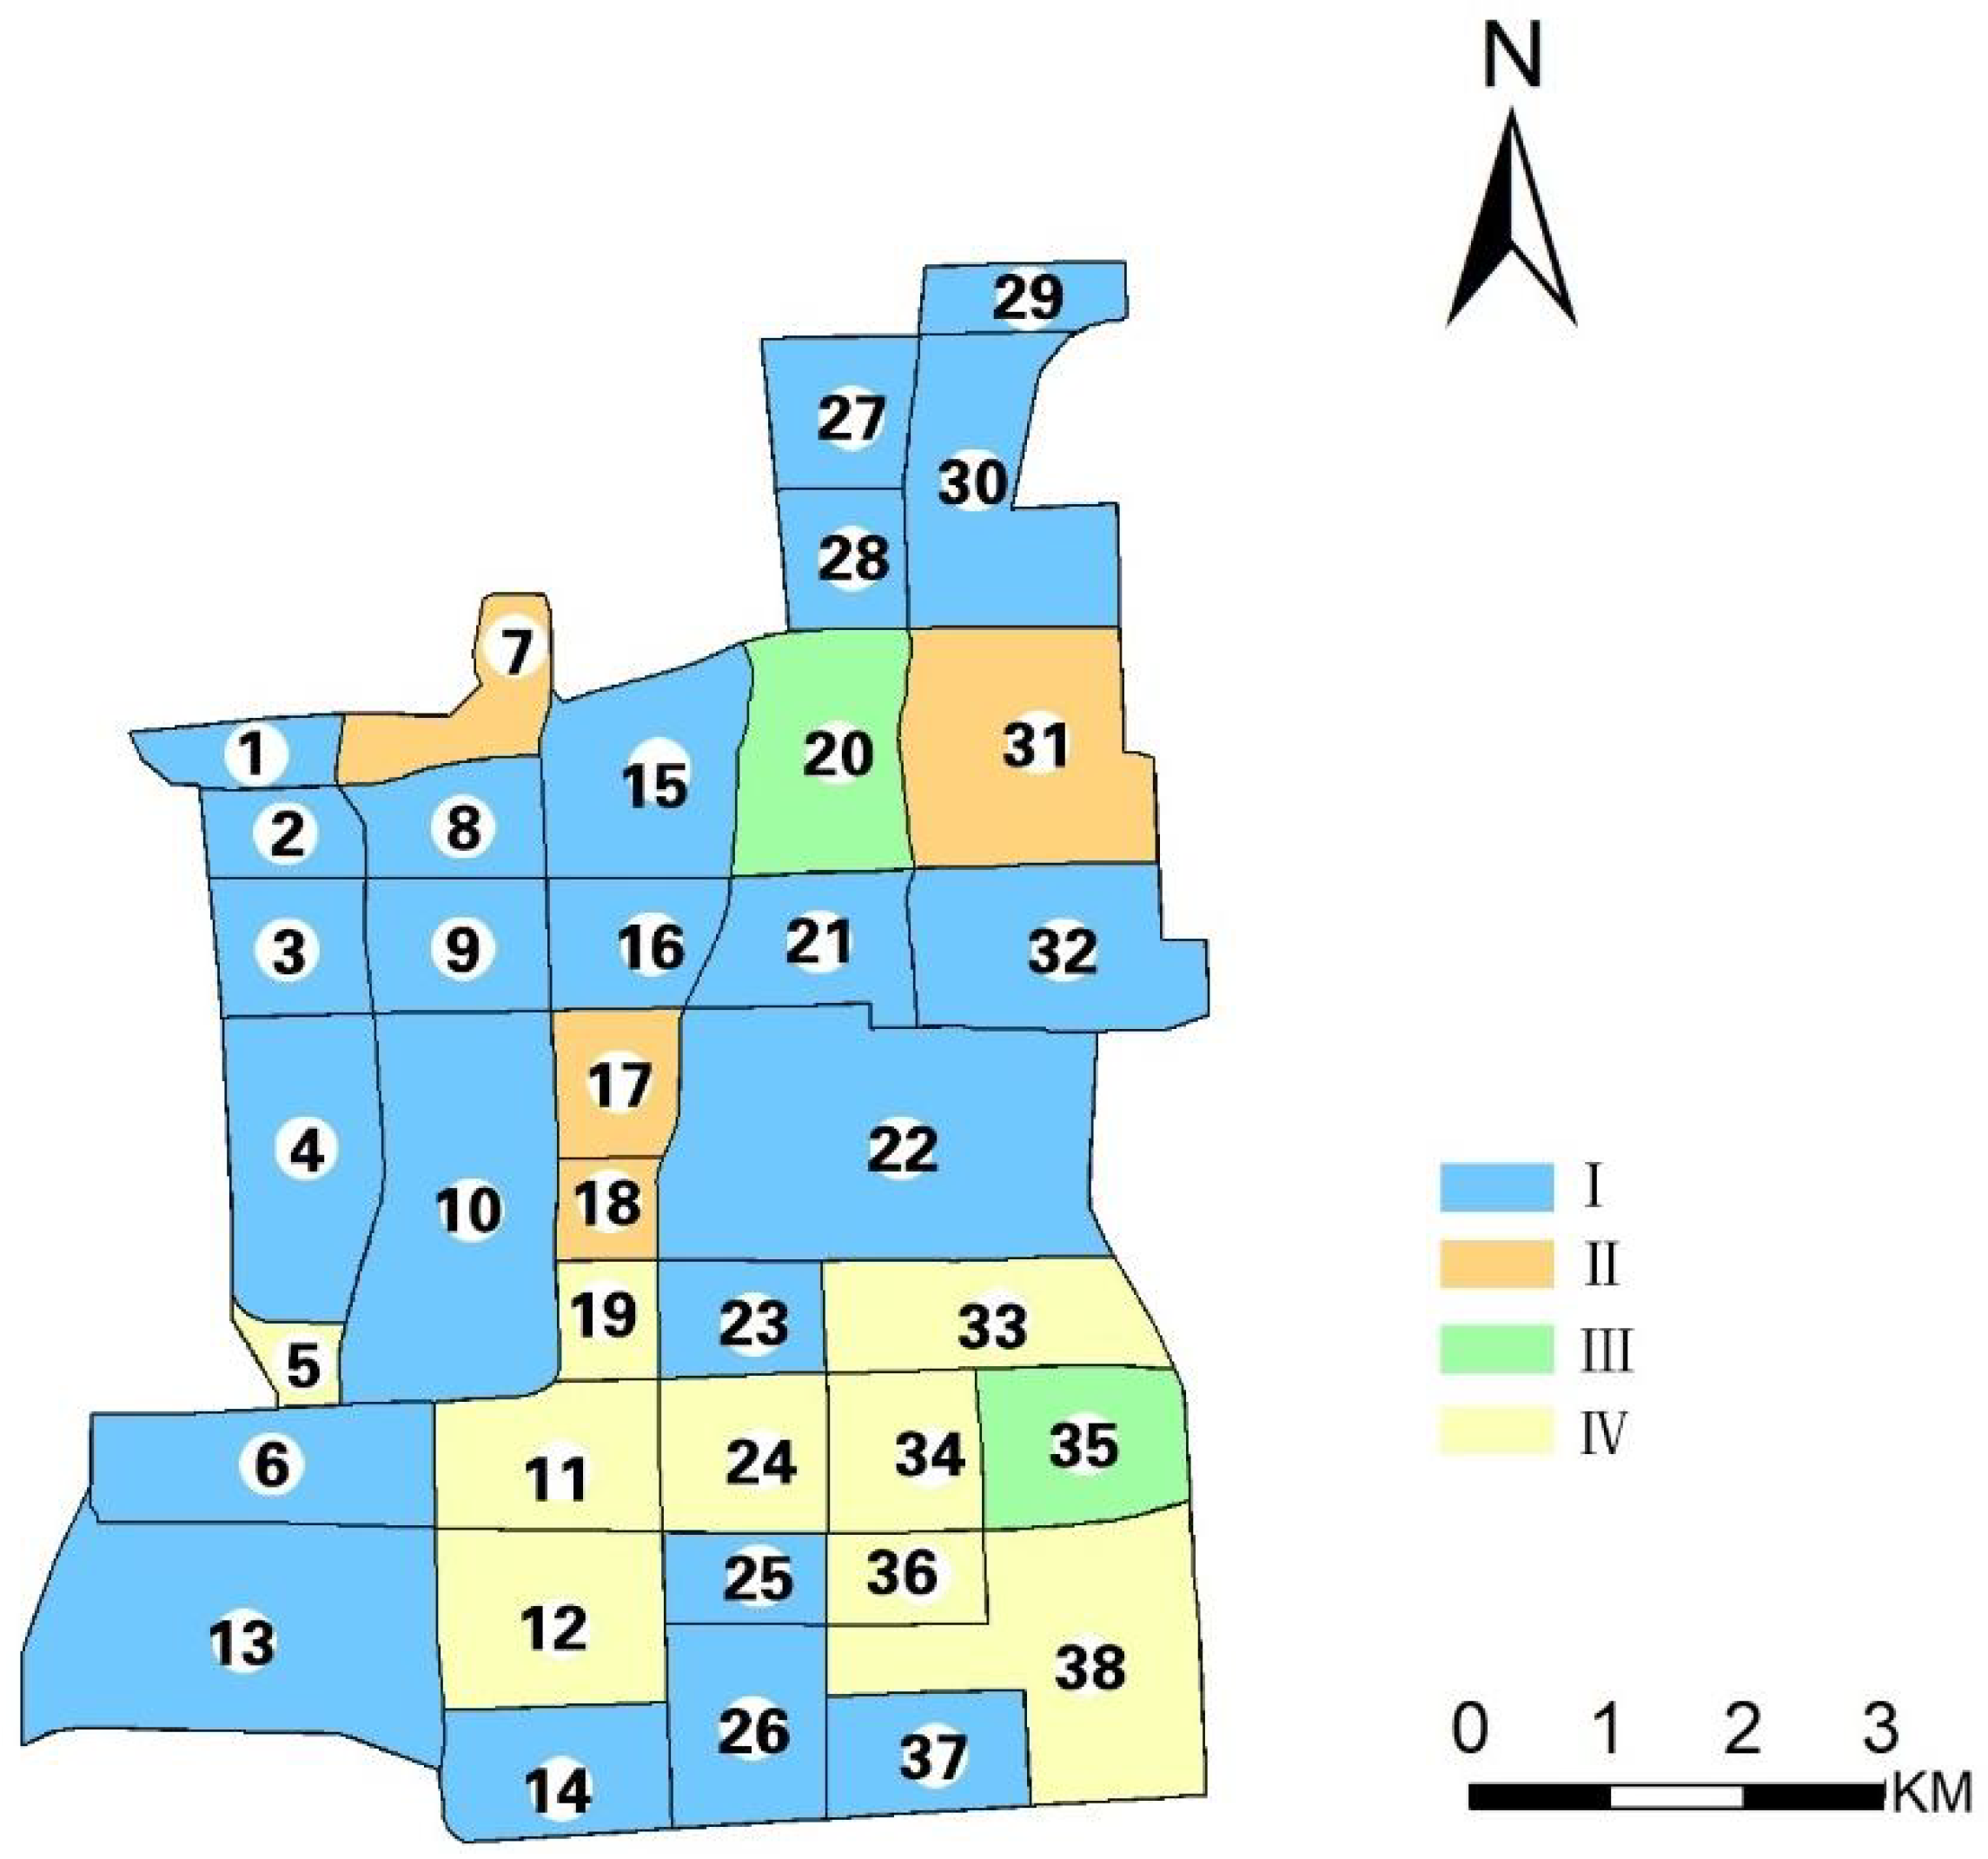
2.2.1. Classification of Plots and Identification of Main Problems
2.2.2. Establishment of the Location Decision Evaluation System and Data Processing
- (1)
- Average runoff coefficient calculation
- (2)
- Road network density calculation
- (3)
- The level of the catchment flow path
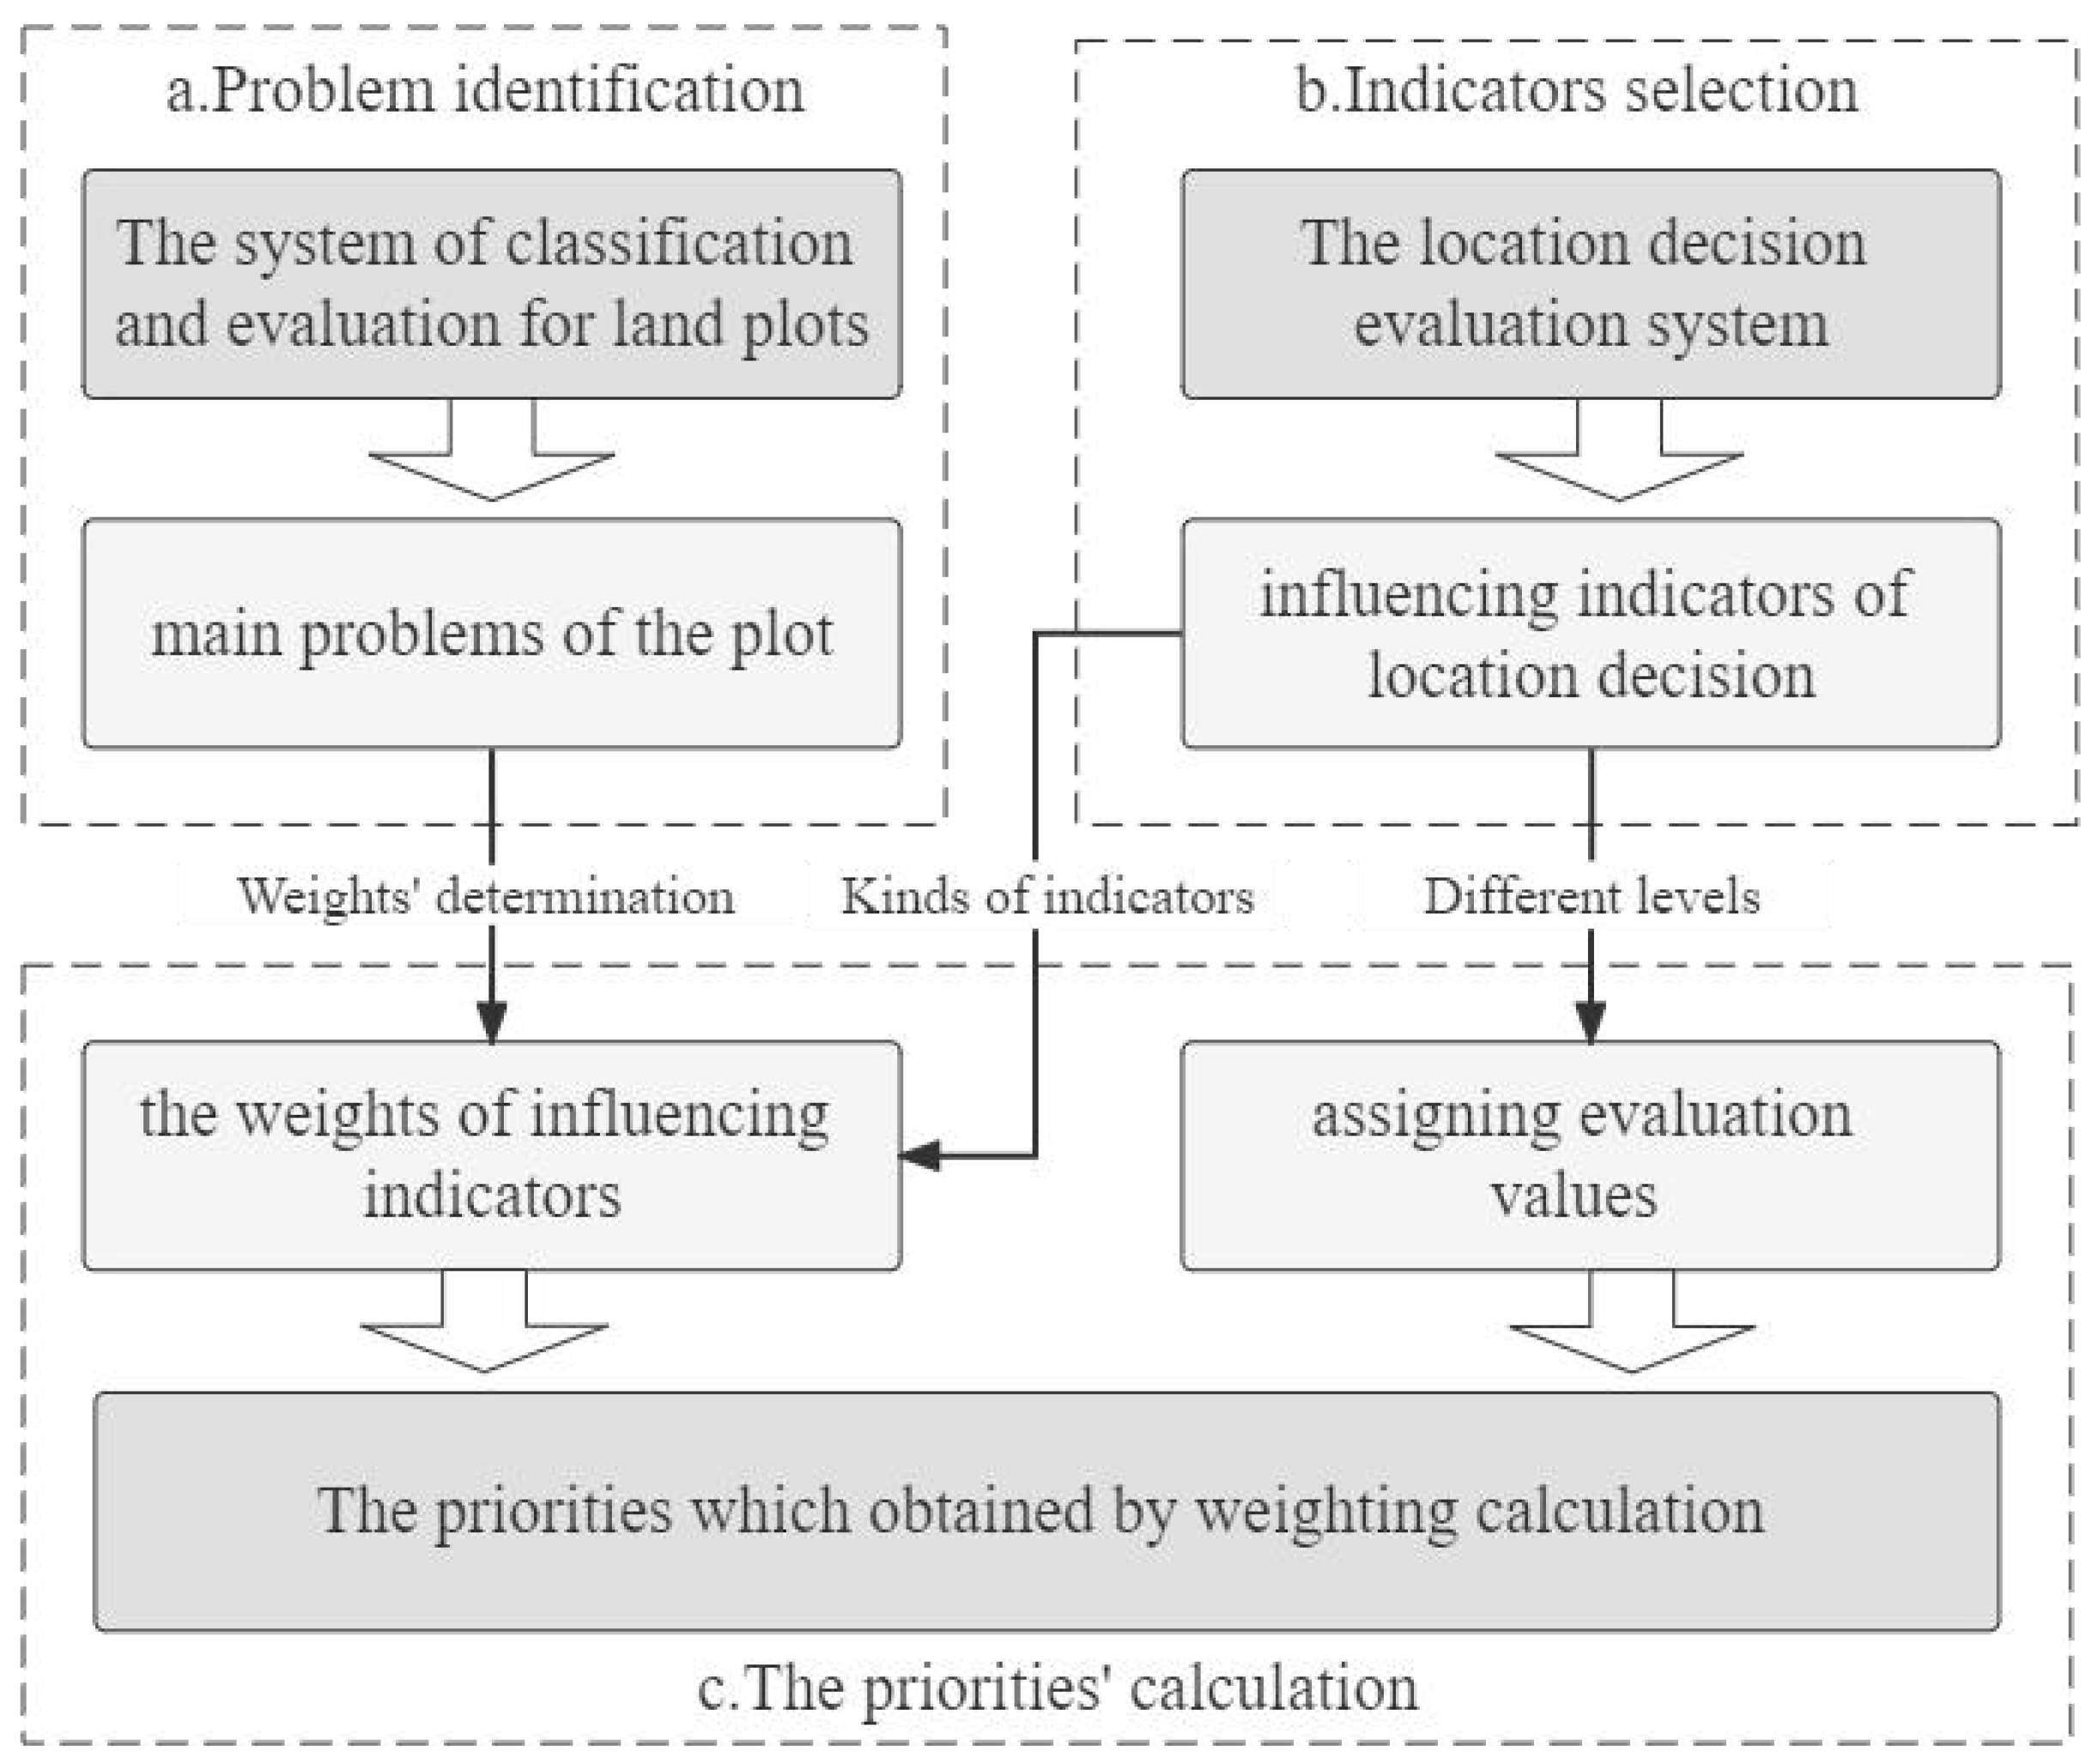
2.2.3. The Priority of Location Decision for Multi-Functional Rainwater Storage Space
3. Results
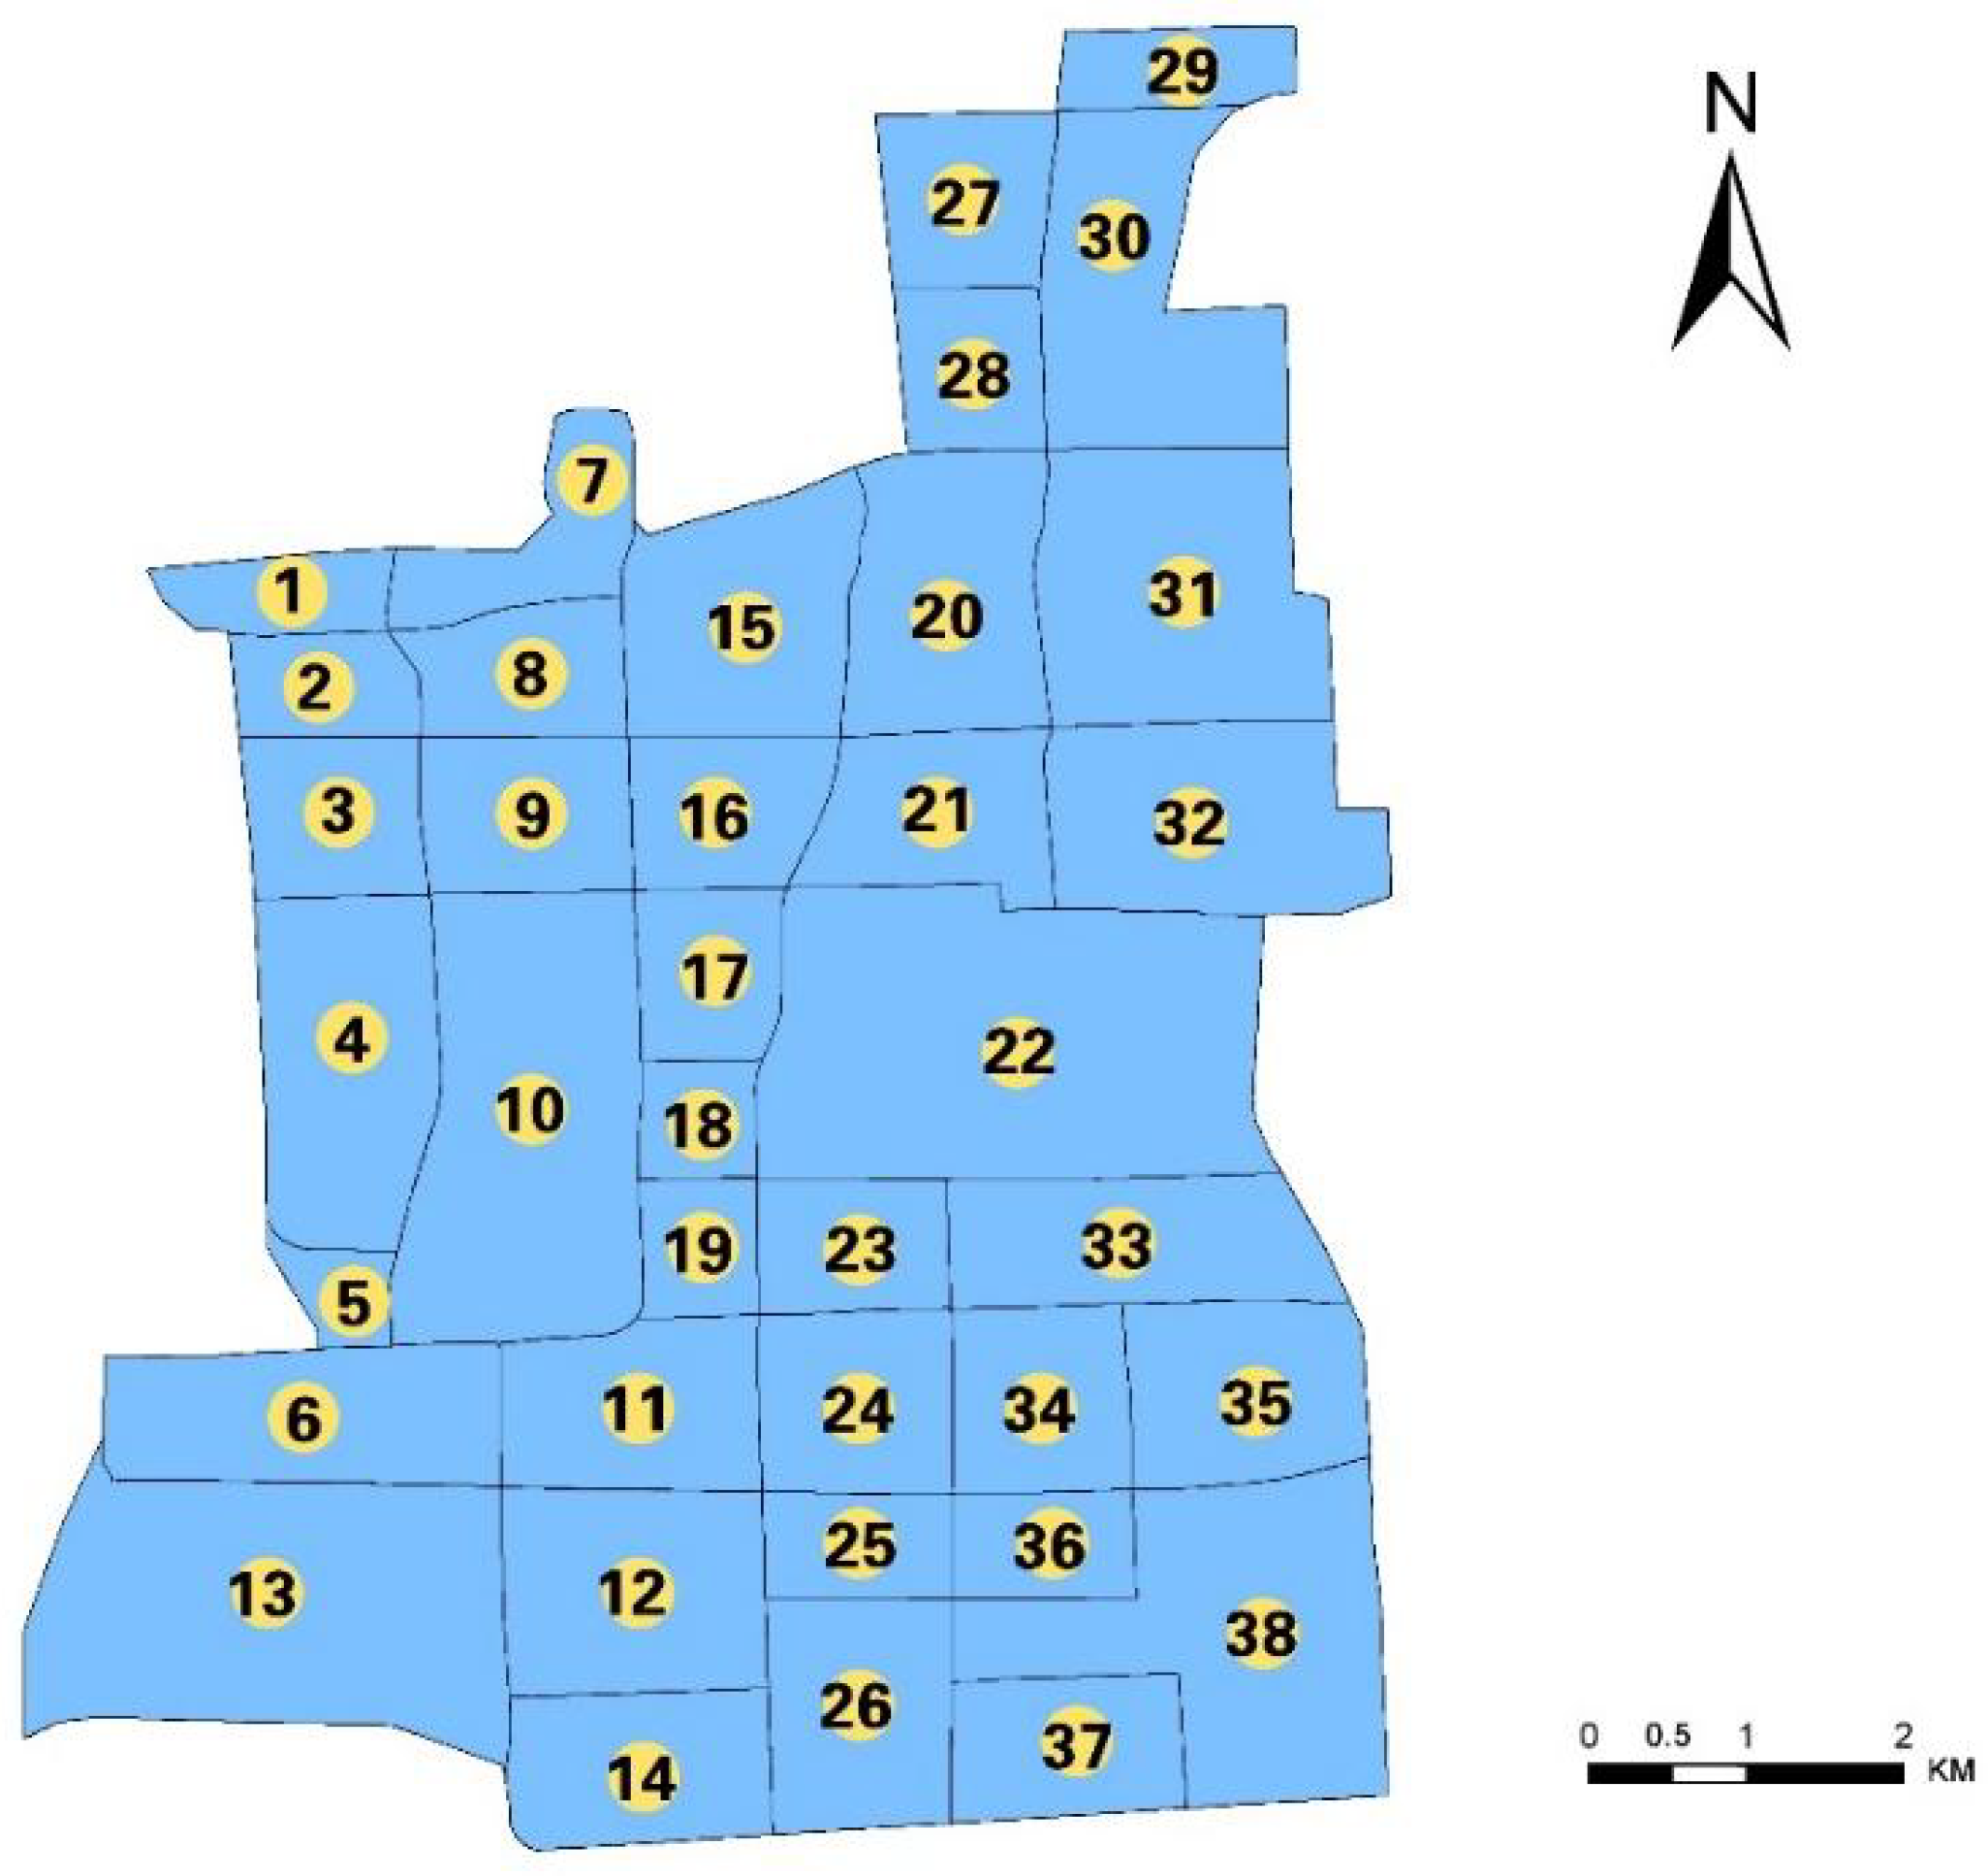
3.1. The Distribution of Land Plot Types
3.2. The Sorting of Goals for Location Decision
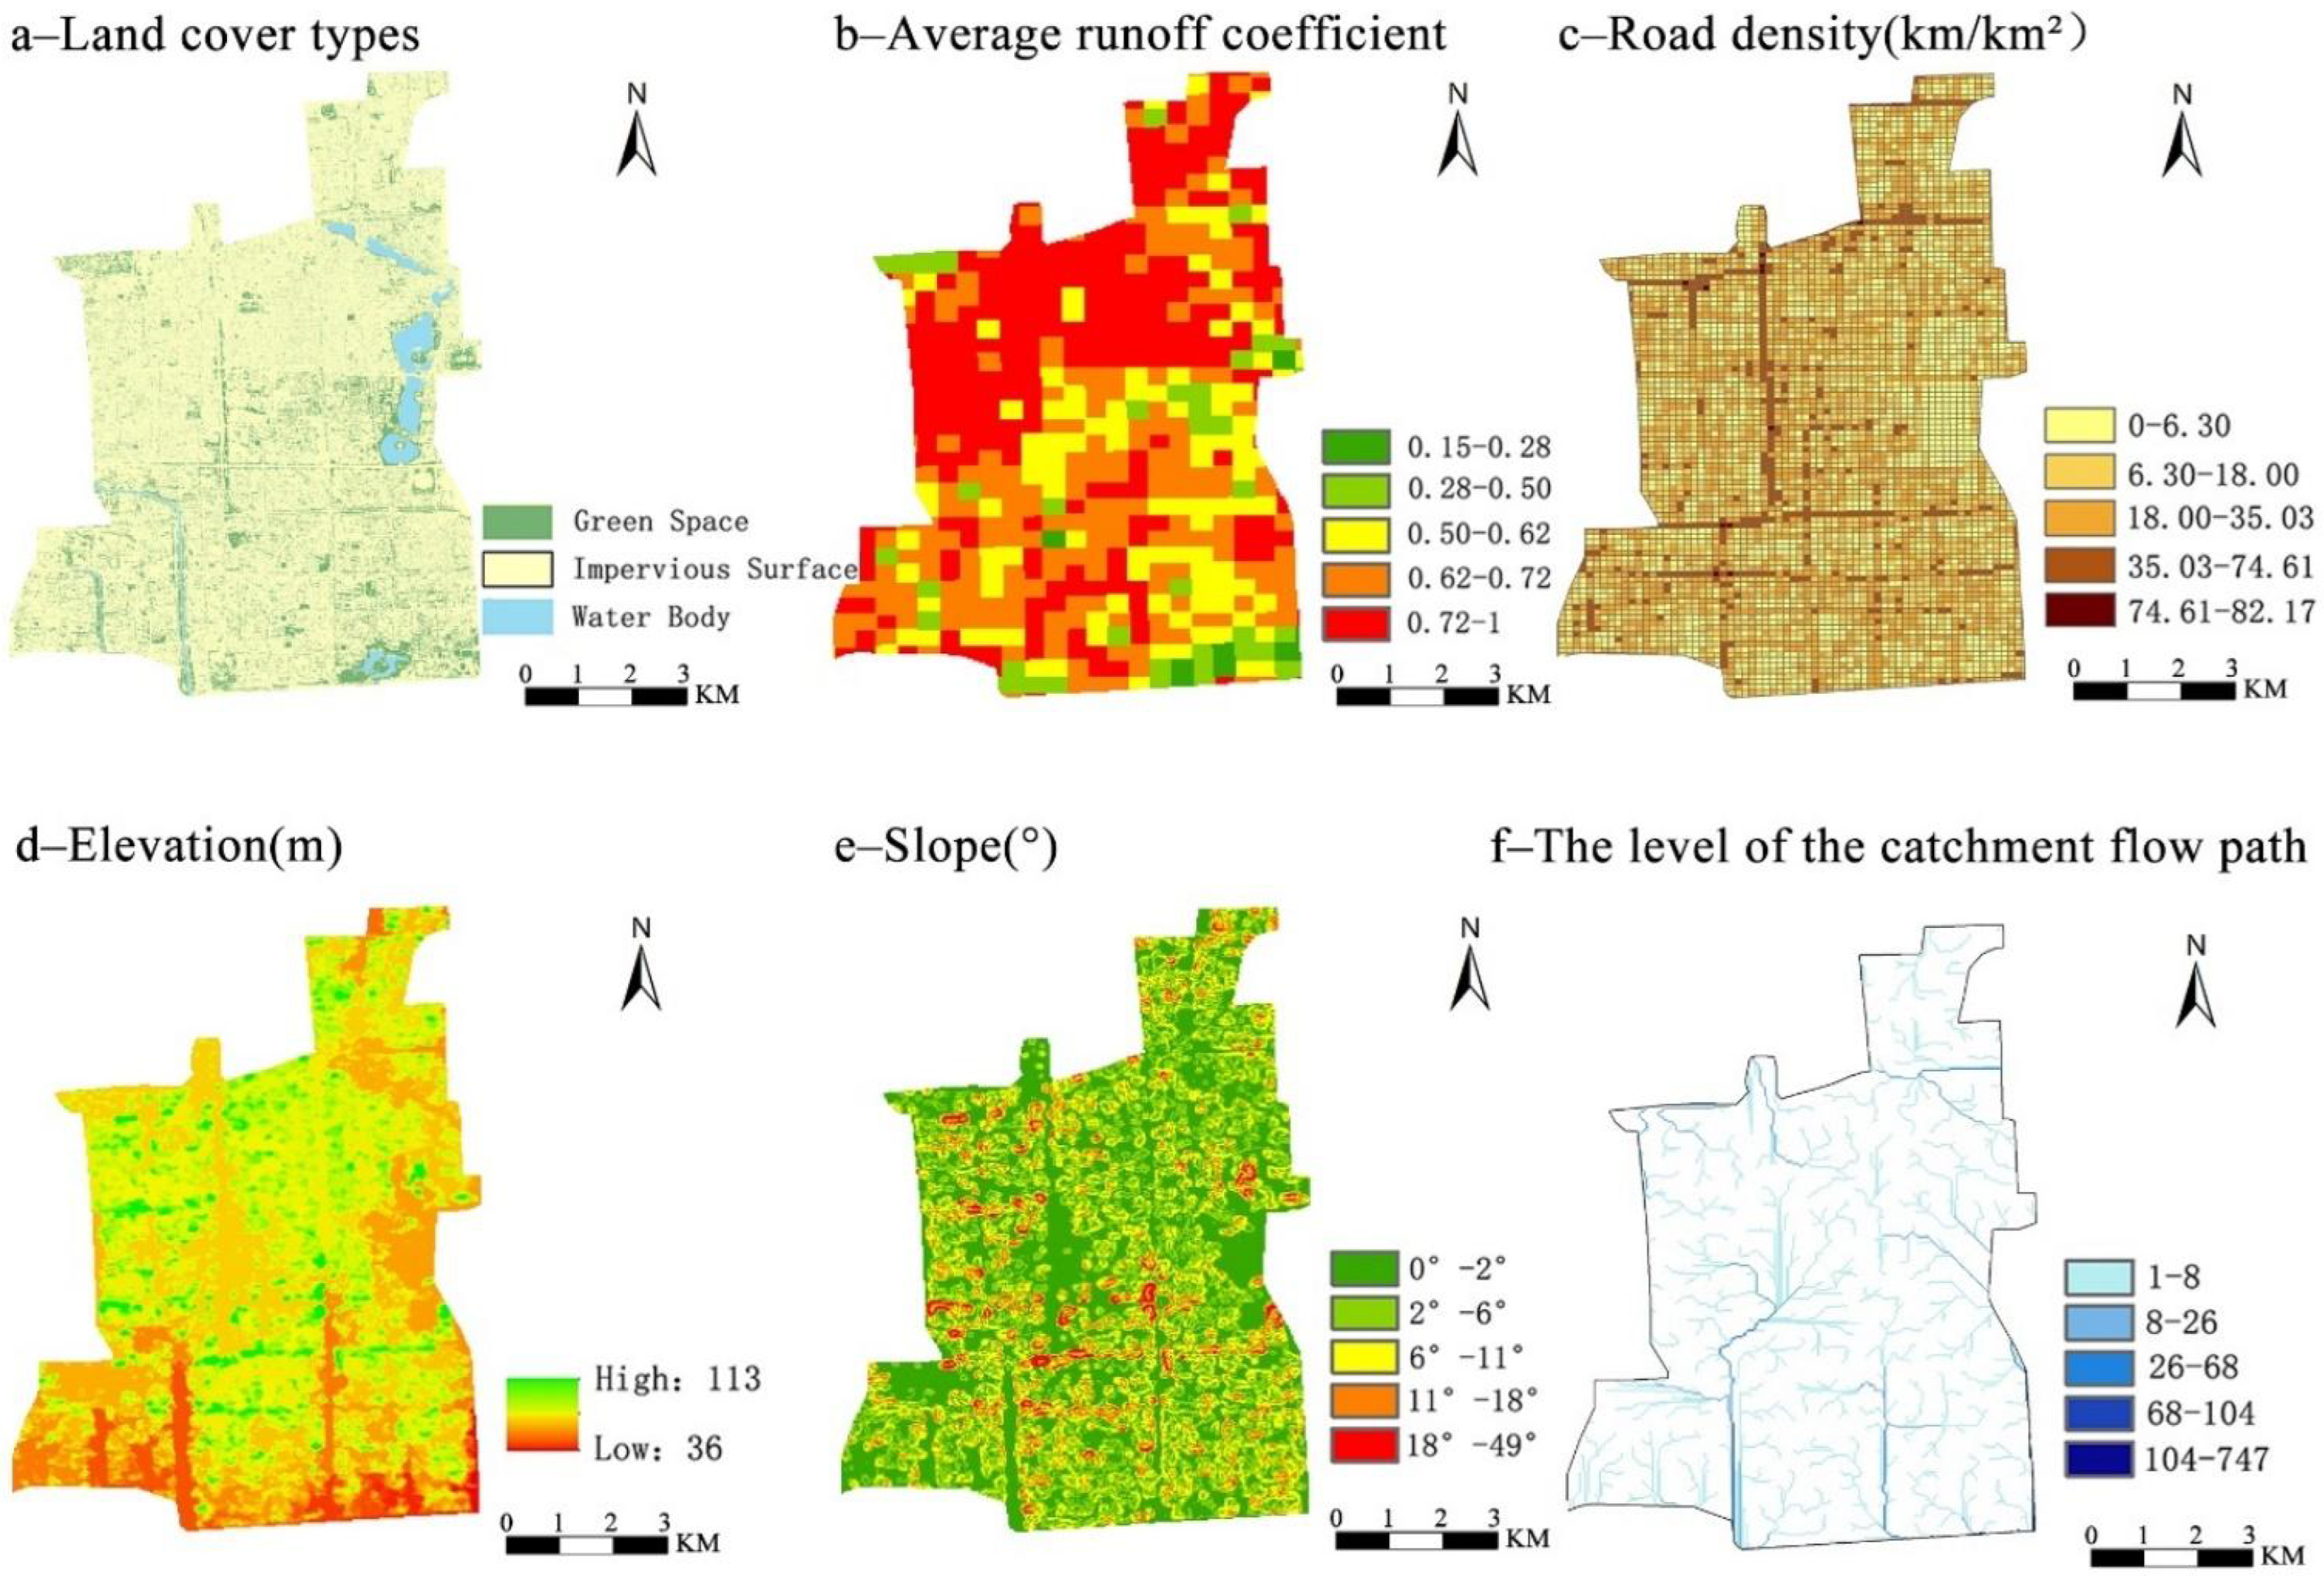
3.3. Influencing Indicators of Location Decision
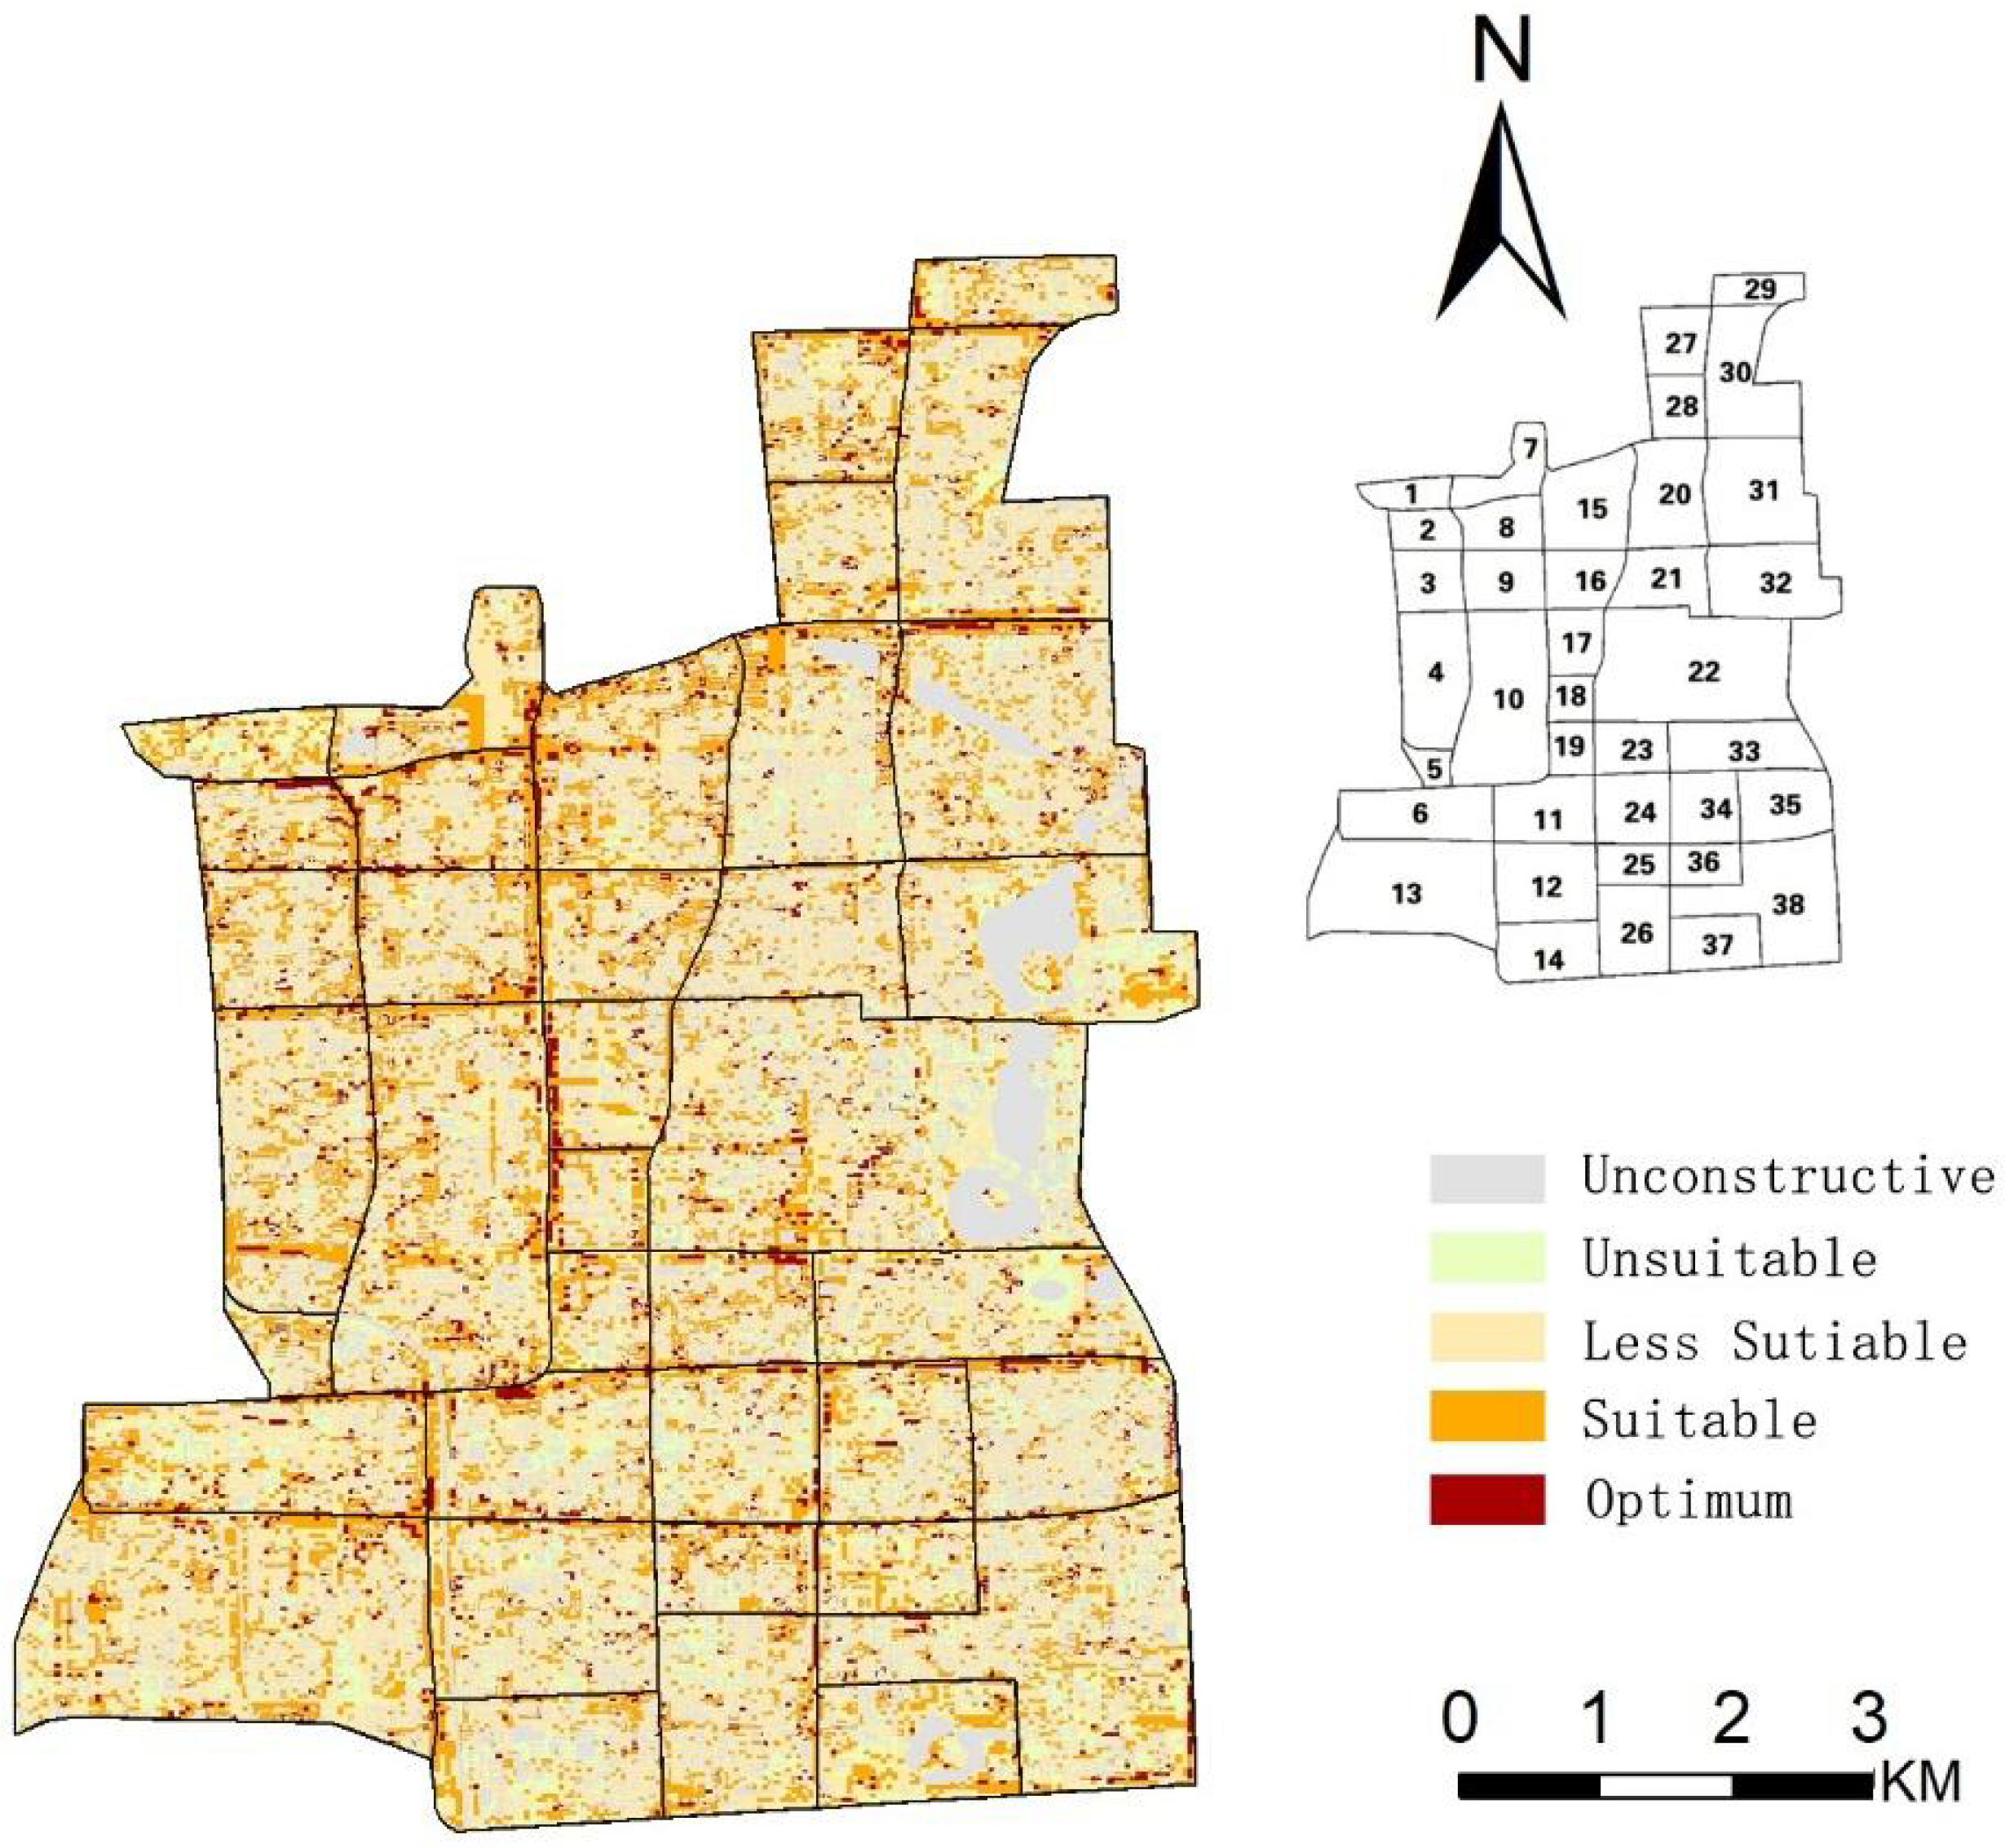
3.4. The Results of Location Decision Priority of Multi-Functional Rainwater Storage Space
4. Discussion
5. Conclusions
- (1)
- The location decision method proposed in this study can quickly, simply, and intuitively screen out the areas that can be used for multi-functional rainwater storage space and evaluate their priorities. This method takes into account the control of total runoff volume, peak runoff, and pollutants in runoff simultaneously. The characteristics of the different plots are taken into account in this method, and the location decision results in a better solution to the city’s problems.
- (2)
- The difference in the weight distribution of influencing indicators for the runoff problem in different plots must be considered. In this case, the building density is high, and the area has a lot of underlying impermeable surfaces. There is no huge industrial pollution source. Many plots in the study area focus on controlling total runoff volume. Among the 38 plots in the study area, two plots focus on controlling pollutants in runoff; nine plots that focus on controlling peak runoff are mainly distributed south of the study area; eleven plots focus on controlling total runoff volume. The weights corresponding to the different plots are not the same.
- (3)
- Different plots have different priorities of location decisions for constructing multi-functional rainwater storage space. The priority is determined by the conditions and urgency of constructing multi-functional rainwater storage spaces. Plot 1 has good conditions for constructing multi-functional rainwater storage space and low urgency, so its priority is low. In a comprehensive comparison, Plot 2, Plot 8, Plot 11, and Plot 25 have higher priority than other plots to build multi-functional rainwater storage space.
- (4)
- In the case of this study, laying multi-functional rainwater storage space along the urban road can get the maximum benefit in a high-density built-up area. It is vital to renovate roads. Transforming roadside green space and road isolation belts into multi-functional green spaces can store runoff and control runoff pollution more efficiently.
Author Contributions
Funding
Data Availability Statement
Conflicts of Interest
References
- Tang, Z.; Engel, B.A.; Pijanowski, B.C.; Lim, K.J. Forecasting land use change and its environmental impact at a watershed scale. J. Environ. Manag. 2005, 76, 35–45. [Google Scholar] [CrossRef] [PubMed]
- Zope, P.E.; Eldho, T.I.; Jothiprakash, V. Impacts of land use–land cover change and urbanization on flooding: A case study of Oshiwara River Basin in Mumbai, India. Catena 2016, 145, 142–154. [Google Scholar] [CrossRef]
- Qin, H.P.; Li, Z.X.; Fu, G. The Effects of Low Impact Development on Urban Flooding Under Different Rainfall Characteristics. J. Environ. Manag. 2013, 129, 577–585. [Google Scholar] [CrossRef] [PubMed] [Green Version]
- Fogarty, J.; Bueren, M.V.; Iftekhar, M.S. Making waves: Creating water sensitive cities in Australia. Water Res. 2021, 202, 117456. [Google Scholar] [CrossRef]
- Zhang, Y.; Li, J.-Q.; Wang, W.L. Analysis of Several Major Puzzles and Countermeasures of Sponge City Construction. China Water Wastewater 2016, 32, 5. [Google Scholar] [CrossRef]
- Coutts, A.M.; Tapper, N.J.; Beringer, J.; Loughnan, M.; Demuzere, M. Watering our cities: The capacity for Water Sensitive Urban Design to support urban cooling and improve human thermal comfort in the Australian context. Prog. Phys. Geogr. 2013, 37, 2–28. [Google Scholar] [CrossRef]
- Ahiablame, L.M.; Engel, B.A.; Chaubey, I. Effectiveness of Low Impact Development Practices: Literature Review and Suggestions for Future Research. Water Air Soil Pollut. 2012, 223, 4253–4273. [Google Scholar] [CrossRef]
- Laura, G.C.; Emily, Z.B.; Louie, R. An integrated approach to place Green Infrastructure strategies in marginalized communities and evaluate stormwater mitigation. J. Hydrol. 2018, 559, 648–660. [Google Scholar] [CrossRef]
- Che, W.; Zhang, Y.; Li, J.Q.; Liu, H.; He, J.P.; Meng, G.H.; Wang, H.L. Multi-functional storage of rainwater in urban area. Water Wastewater Eng. 2005, 31, 25–29. [Google Scholar] [CrossRef]
- Vijayaraghavan, K.; Joshi, U.M. Can green roof act as a sink for contaminants? A methodological study to evaluate runoff quality from green roofs. Environ. Pollut. 2014, 194, 121–129. [Google Scholar] [CrossRef]
- Mutiti, S.; Sadowski, H.; Melvin, C.; Mutiti, C. Effectiveness of Man-Made Wetland Systems in Filtering Contaminants from Urban Runoff in Milledgeville, Georgia. Water Environ. Res. 2015, 87, 358–368. [Google Scholar] [CrossRef] [PubMed]
- Du, S.; Wang, C.; Shen, J.; Wen, J.; Gao, J.; Wu, J.; Lin, W.; Xu, H. Mapping the capacity of concave green land in mitigating urban pluvial floods and its beneficiaries. Sustain. Cities Soc. 2019, 44, 774–782. [Google Scholar] [CrossRef]
- Doick, K.J.; Peace, A.; Hutchings, T.R. The role of one large greenspace in mitigating London’s nocturnal urban heat island. Sci. Total Environ. 2014, 493, 662–671. [Google Scholar] [CrossRef] [PubMed]
- Harrell, L.J.; Ranjithan, S.R. Detention Pond Design and Land Use Planning for Watershed Management. J. Water Resour. Plan. Manag. 2003, 129, 98–106. [Google Scholar] [CrossRef]
- Liaw, C.H.; Tsai, Y.L.; Cheng, M.S. Assessing flood mitigation alternatives in shijr area in metropolitan taipei1. Jawra J. Am. Water Resour. Assoc. 2010, 42, 311–322. [Google Scholar] [CrossRef]
- Zare, S.O.; Saghafian, B.; Shamsai, A. Multi-objective optimization for combined quality–quantity urban runoff control. Hydrol. Earth Syst. Sci. 2012, 16, 4531–4542. [Google Scholar] [CrossRef] [Green Version]
- Xu, T.; Jia, H.; Zheng, W.; Mao, X.; Xu, C. SWMM-based methodology for block-scale LID-BMPs planning based on site-scale multi-objective optimization: A case study in Tianjin. Front. Environ. Sci. Eng. 2017, 11, 1. [Google Scholar] [CrossRef]
- Xu, T.; Engel, B.A.; Shi, X.; Leng, L.; Jia, H.; Yu, S.L.; Liu, Y. Marginal-cost-based greedy strategy (MCGS): Fast and reliable optimization of low impact development (LID) layout. Sci. Total Environ. 2018, 640–641, 570–580. [Google Scholar] [CrossRef]
- Kaykhosravi, S.; Abogadil, K.; Khan, U.T.; Jadidi, M.A. The Low-Impact Development Demand Index: A New Approach to Identifying Locations for LID. Water 2019, 11, 2341. [Google Scholar] [CrossRef] [Green Version]
- Kuller, M.; Bach, P.M.; Roberts, S.; Browne, D.; Deletic, A. A planning-support tool for spatial suitability assessment of green urban stormwater infrastructure. Sci. Total. Environ. 2019, 686, 856–868. [Google Scholar] [CrossRef]
- Tommaso, P.; Simona, C.; Giulio, C.; Elena, B.; Matteo, P.; Tiziana, P.; Enrica, C. Planning Nature Based Solutions against urban pluvial flooding in heritage cities: A spatial multi criteria approach for the city of Florence (Italy). J. Hydrol. 2022, 41, 101081. [Google Scholar] [CrossRef]
- Deletic, A.; Orr, D.W. Pollution Buildup on Road Surfaces. J. Environ. Eng. 2005, 131, 49–59. [Google Scholar] [CrossRef]
- Perdikaki, K.; Mason, C.F. Impact of road runoff on receiving streams in eastern England. Water Res. 1999, 33, 1627–1633. [Google Scholar] [CrossRef]
- Li, J.; Li, H.E.; Dong, W.; Li, Y.; Qin, G. Estimation of non-point source pollution characteristics and loading in Xi’an urban areas. J. Hydroelectr. Eng. 2012, 31, 131–138. [Google Scholar]
- Chang, J.; Liu, M.; Xu, S.Y. Temporal-spatial distribution and first flush effect of urban stormwater runoff pollution in Shanghai City. Geogr. Res. 2006, 25, 9. [Google Scholar] [CrossRef]
- Birant, D.; Kut, A. ST-DBSCAN: An algorithm for clustering spatial–temporal data. Data Knowl. Eng. 2007, 60, 208–221. [Google Scholar] [CrossRef]
- Drapper, D.; Tomlinson, R.; Williams, P. Pollutant concentrations in road runoff: Southeast Queensland case study. J. Environ. Eng. 2000, 126, 313–320. [Google Scholar] [CrossRef]
- Mangani, G.; Berloni, A.; Bellucci, F.; Tatano, F.; Maione, M. Evaluation of the Pollutant Content in Road Runoff First Flush Waters. Water Air Soil Pollut. 2005, 160, 213–228. [Google Scholar] [CrossRef]
- Kang, J.H.; Kayhanian, M.; Stenstrom, M.K. Implications of a kinematic wave model for first flush treatment design. Water Res. 2006, 40, 3820–3830. [Google Scholar] [CrossRef]
- Fan, S.; Han, S. Testing Research on the Effects of Land Surface Slopes Upon Surface Runoff. Bull. Soil Water Conserv. 1991, 11, 5. [Google Scholar] [CrossRef]
- Ashraf, M.S.; Borah, D.K. Modeling pollutant transport in runoff and sediment. Trans. ASAE 1992, 35, 1789–1797. [Google Scholar] [CrossRef]
- Xu, B.; Yang, T.; Zou, S. Scale effect analysis of river network system simulation in arid area based on DEM—A case study of Qaidam basin basin. J. Lanzhou Univ. 2006, 1, 27–32. [Google Scholar] [CrossRef]
- Zhou, H.; Liu, J.; Gao, C.; Ou, S.F. Analysis of Current Situation and Problems of Urban Waterlogging Control in China. J. Catastrophol. 2018, 33, 147–151. [Google Scholar] [CrossRef]
- Lin, J.; Zhang, B.; Hai-Dong, L.I.; Yu-Min, W.U.; Zhuang, J.Y.; Zhang, J.C. The classification of watershed in Chunhua basin based on HEC-GeoHMS and DEM. J. Nanjing For. Univ. 2009, 33, 65–68. [Google Scholar]
- Lin, Q.; Lin, X.S.; Wang, K. Small watershed division in mountainous area based on DEM method: Taking Zhongxian County of Chongqing as an example. J. Chongqing Univ. Educ. 2015, 28, 160–163. [Google Scholar]
- O’Callaghan, J.F.; Mark, D.M. The extraction of drainage networks from digital elevation data. Comput. Vis. Graph. Image Process. 1984, 28, 323–344. [Google Scholar] [CrossRef]
- Jenks, G.F. The Data Model Concept in Statistical Mapping. Int. Yearb. Cartogr. 1967, 7, 186–190. [Google Scholar]
- Zhou, F.; Guo, H.; Liu, Y.; Luo, D. A new approach for water quality assessment based on multivariate statistical analysis and Radial Basis Function Neural Networks. Acta Sci. Circumstantiae 2007, 27, 846–853. [Google Scholar] [CrossRef]
- Kramer, M.; Terheiden, K.; Wieprecht, S. Safety criteria for the trafficability of inundated roads in urban floodings. Int. J. Disaster Risk Reduct. 2016, 17, 77–84. [Google Scholar] [CrossRef]


| The Types of Indicators | Specific Indicators | Quantification Method | Reason for Choice |
|---|---|---|---|
| Flood | Elevation(above sea level) | Calculated by the average elevation of the plot (m). | Runoff is affected by gravity and tends to flow to areas with low elevation, so the risk of flooding in low-lying areas is greater. |
| Slope | Calculated according to the average slope of the plot (°). | The runoff in the area with a large slope cannot be fully stagnant, so it is easy to cause the runoff peak to advance. | |
| Runoff coefficient | Calculate the average runoff coefficient according to the fraction of different underlying surface types. | The larger the runoff coefficient, the more runoff will be generated. | |
| Imperviousness | Calculated according to the proportion of the hard underlying surface to the total area, excluding the water area. | The higher the impermeability, the less chance the runoff will infiltrate. | |
| Runoff Pollution | Road network density | Calculated according to the ratio of the total length of the road to the total area of the plot(km/km2). | A large number of pollutants accumulate on the surface of urban roads with frequent traffic activity [22]. The high impermeability of urban roads leads to the dissolution and scouring of pollutants with stormwater runoff, causing significant damage to the quality of receiving water [23]. |
| The density of major point sources | Calculated according to the proportion of the total number of supermarkets and restaurants in the total area(pieces/km2). | A variety of pollutants show similar distribution trends among different functional areas, which are more easily distributed in commercial areas [24,25]. |
| Influencing Indicators | Goal | Impact on Goal Achievement | Quantitative Method |
|---|---|---|---|
| Land cover types | Total runoff volume control, peak runoff control, runoff pollution control | The green space infiltration capacity is better. Under the same conditions, the runoff produced by green space is less. | Performing supervised classification on remote sensing image in ENVI. |
| Average runoff coefficient | Total runoff volume control | The runoff coefficient indicates how much the precipitation becomes runoff, reflecting the influence of the underlying surface factors in the watershed on the precipitation-runoff relationship. | Setting up grids with a length and width of 300 m and calculating the average runoff coefficient from the fractions of the green space and the impervious surface in a grid. |
| Road network density | Total runoff volume control, runoff pollution control | Urban roads have poor water permeability and are prone to generating runoff. Compared with other underlying surfaces, runoff on urban roads causes more severe water pollution, especially the first flush [27,28,29]. | Creating grids and analyzing the road data in the grids, calculating the road network density. |
| Elevation | Total runoff volume control | Runoff in areas with lower elevations is easy to accumulate. | Filling the original DEM data and calculating the overall elevation distribution of the study area |
| Slope | Peak runoff control | Runoff peak flow increases with slope [30]. | Processing DEM data and calculating slope by the 3D Analyst in ArcGIS |
| The level of the catchment flow path | Total runoff volume control, peak runoff control, runoff pollution control | Along the catchment flow path, the runoff can be controlled more effectively, and pollutants in runoff can be intercepted [31]. | Using the hydrological analysis tool in ArcGIS to extract the catchment flow paths and differentiate their levels according to the Shreve classification method [32] |
| Goals | Weights of Goals | The Weights of the Influencing Indicators | |||||
|---|---|---|---|---|---|---|---|
| Land Cover Types | Average Runoff Coefficient | Road Network Density | Elevation | Slope | The Level of The Catchment Flow Path | ||
| total runoff volume control | a | a/5 | a/5 | a/5 | a/5 | a/5 | |
| runoff peak flow control | b | b/3 | b/3 | b/3 | |||
| runoff pollution control | c | c/3 | c/3 | c/3 | |||
| Total Weight | a/5 + b/3 + c/3 | a/5 | a/5 + c/3 | a/5 | b/3 | a/5 + b/3 + c/3 | |
| Clustering | Error | F | Significance | |||
|---|---|---|---|---|---|---|
| Mean Square | Degrees of Freedom | Mean Square | Degrees of Freedom | |||
| Elevation | 0.209 | 5 | 0.019 | 32 | 11.151 | 0.000 |
| Slope | 0.221 | 5 | 0.023 | 32 | 9.487 | 0.000 |
| Runoff coefficient | 0.217 | 5 | 0.015 | 32 | 14.238 | 0.000 |
| Imperviousness | 0.275 | 5 | 0.015 | 32 | 17.944 | 0.000 |
| Road network density | 0.123 | 5 | 0.041 | 32 | 3.005 | 0.025 |
| The density of major point sources | 0.201 | 5 | 0.013 | 32 | 15.932 | 0.000 |
| Category | Number of Plot Samples | Type Characteristics | Main Problems | Ranking of Desired Goals |
|---|---|---|---|---|
| 1 | 2 | The overall situation is good. The elevation is generally high, the slope is gentle, the imperviousness is low, and the runoff coefficient is small; the density of roads and primary point sources is low. | Compared to other plots, these plots have a low capacity to generate runoff and a low potential to generate pollutants. Among the specific indicators of the classification and evaluation system, the elevation of this plot is quite low, and the risk of flooding is higher than other risks. | Ⅰ |
| 2 | 4 | The runoff coefficient is large, the imperviousness is high, the slope is very gentle, the elevation is generally high, and the road network density is high. However, the primary point source density is low. | It is easy to generate a large amount of runoff, but the velocity of the runoff is low, and the pollutants can be precipitated and adsorbed. | Ⅱ |
| 3 | 2 | The runoff coefficient and imperviousness of these plots are very high, and the density of roads and main point source is also relatively high, but the average slope level is moderate, and the elevation is relatively high. | The level of pollutants in the plot is high and generates a large amount of runoff. The pollutants migrate with the runoff, and the risk of pollution is high. | Ⅲ |
| 4 | 15 | The elevation is low, the average slope is large, the runoff coefficient and imperviousness are high, and the road network density and main point source density are low. | Large amounts of runoff can be generated. The average slope is large, and the runoff velocity is large. But the level of pollutants generated is relatively low. | Ⅰ |
| 5 | 9 | The runoff coefficient and imperviousness are at a medium level, and the average slope is high. The road network density is high, but the main point source density is low. | The runoff velocity is fast, and the production flow is large, which washes away the pollutants brought by vehicles. | Ⅳ |
| 6 | 6 | The overall elevation is low, the slope is slightly large, and the runoff coefficient and imperviousness are high, but the road network density and main point source density are low. | A large amount of runoff can be generated. There is a higher risk of flooding but a lower risk of pollution. | Ⅰ |
| Evaluation Value (E) | Grading Situation of Influencing Indicator | |||||
|---|---|---|---|---|---|---|
| Land Cover Types | Average Runoff Coefficient | Road Network Density (km/km2) | Elevation (m) | Slope (°) | The Level of the Catchment Flow Path | |
| 10 | 0.15–0.29 | 0–6.03 | 65–113 | 0–2 | 1–8 | |
| 30 | Impervious Surface | 0.29–0.50 | 6.03–16.39 | 58–65 | 2–6 | 8–26 |
| 50 | 0.50–0.62 | 16.39–28.60 | 52–58 | 6–10 | 26–68 | |
| 70 | Green Space | 0.62–0.72 | 28.60–74.61 | 46–52 | 10–18 | 68–104 |
| 90 | 0.72–1 | 74.61–82.17 | 36–46 | 18–49 | 104–747 | |
| Types of Priority | Plot Number | ||||||||||||
|---|---|---|---|---|---|---|---|---|---|---|---|---|---|
| 1 | 2 | 3 | 4 | 5 | 6 | 7 | 8 | 9 | 10 | 11 | 12 | 13 | |
| Unconstructive | 13% | 30% | 29% | 29% | 31% | 21% | 20% | 24% | 28% | 26% | 27% | 29% | 24% |
| Unsuitable | 16% | 1% | 1% | 2% | 7% | 9% | 2% | 0% | 2% | 3% | 8% | 5% | 5% |
| Less Suitable | 42% | 31% | 39% | 40% | 32% | 42% | 42% | 37% | 38% | 42% | 35% | 44% | 45% |
| Suitable | 26% | 29% | 27% | 26% | 28% | 23% | 31% | 31% | 27% | 24% | 24% | 19% | 23% |
| Optimum | 3% | 9% | 4% | 4% | 3% | 5% | 5% | 8% | 5% | 4% | 6% | 3% | 3% |
| Types of priority | Plot Number | ||||||||||||
| 14 | 15 | 16 | 17 | 18 | 19 | 20 | 21 | 22 | 23 | 24 | 25 | 26 | |
| Unconstructive | 31% | 29% | 27% | 22% | 22% | 22% | 33% | 35% | 38% | 32% | 25% | 28% | 28% |
| Unsuitable | 10% | 2% | 1% | 3% | 3% | 6% | 7% | 1% | 9% | 3% | 11% | 4% | 8% |
| Less Suitable | 38% | 33% | 36% | 42% | 39% | 38% | 39% | 44% | 34% | 34% | 41% | 34% | 42% |
| Suitable | 19% | 31% | 32% | 26% | 30% | 29% | 18% | 17% | 16% | 25% | 19% | 26% | 19% |
| Optimum | 2% | 6% | 4% | 7% | 7% | 5% | 3% | 3% | 3% | 6% | 4% | 8% | 3% |
| Types of priority | Plot Number | ||||||||||||
| 27 | 28 | 29 | 30 | 31 | 32 | 33 | 34 | 35 | 36 | 37 | 38 | ||
| Unconstructive | 26% | 25% | 24% | 29% | 39% | 40% | 29% | 27% | 35% | 20% | 28% | 29% | |
| Unsuitable | 3% | 1% | 5% | 4% | 3% | 9% | 10% | 8% | 8% | 9% | 11% | 10% | |
| Less Suitable | 35% | 48% | 39% | 44% | 36% | 33% | 41% | 39% | 36% | 44% | 34% | 41% | |
| Suitable | 29% | 23% | 27% | 20% | 18% | 17% | 17% | 21% | 16% | 23% | 25% | 17% | |
| Optimum | 6% | 3% | 4% | 3% | 4% | 2% | 3% | 5% | 5% | 4% | 2% | 4% | |
Publisher’s Note: MDPI stays neutral with regard to jurisdictional claims in published maps and institutional affiliations. |
© 2022 by the authors. Licensee MDPI, Basel, Switzerland. This article is an open access article distributed under the terms and conditions of the Creative Commons Attribution (CC BY) license (https://creativecommons.org/licenses/by/4.0/).
Share and Cite
Jing, J.; Zhang, Z.; Li, J. Study on Location Decision of Multi-Functional Rainwater Storage Space in High-Density Built-Up Area. Water 2022, 14, 3460. https://doi.org/10.3390/w14213460
Jing J, Zhang Z, Li J. Study on Location Decision of Multi-Functional Rainwater Storage Space in High-Density Built-Up Area. Water. 2022; 14(21):3460. https://doi.org/10.3390/w14213460
Chicago/Turabian StyleJing, Jiayue, Zhiming Zhang, and Junqi Li. 2022. "Study on Location Decision of Multi-Functional Rainwater Storage Space in High-Density Built-Up Area" Water 14, no. 21: 3460. https://doi.org/10.3390/w14213460
APA StyleJing, J., Zhang, Z., & Li, J. (2022). Study on Location Decision of Multi-Functional Rainwater Storage Space in High-Density Built-Up Area. Water, 14(21), 3460. https://doi.org/10.3390/w14213460