
Water Footprint of Industrial Tomato Cultivations in the Pinios River Basin: Soil Properties Interactions


Abstract
:1. Introduction
2. Material and Methods
- ■
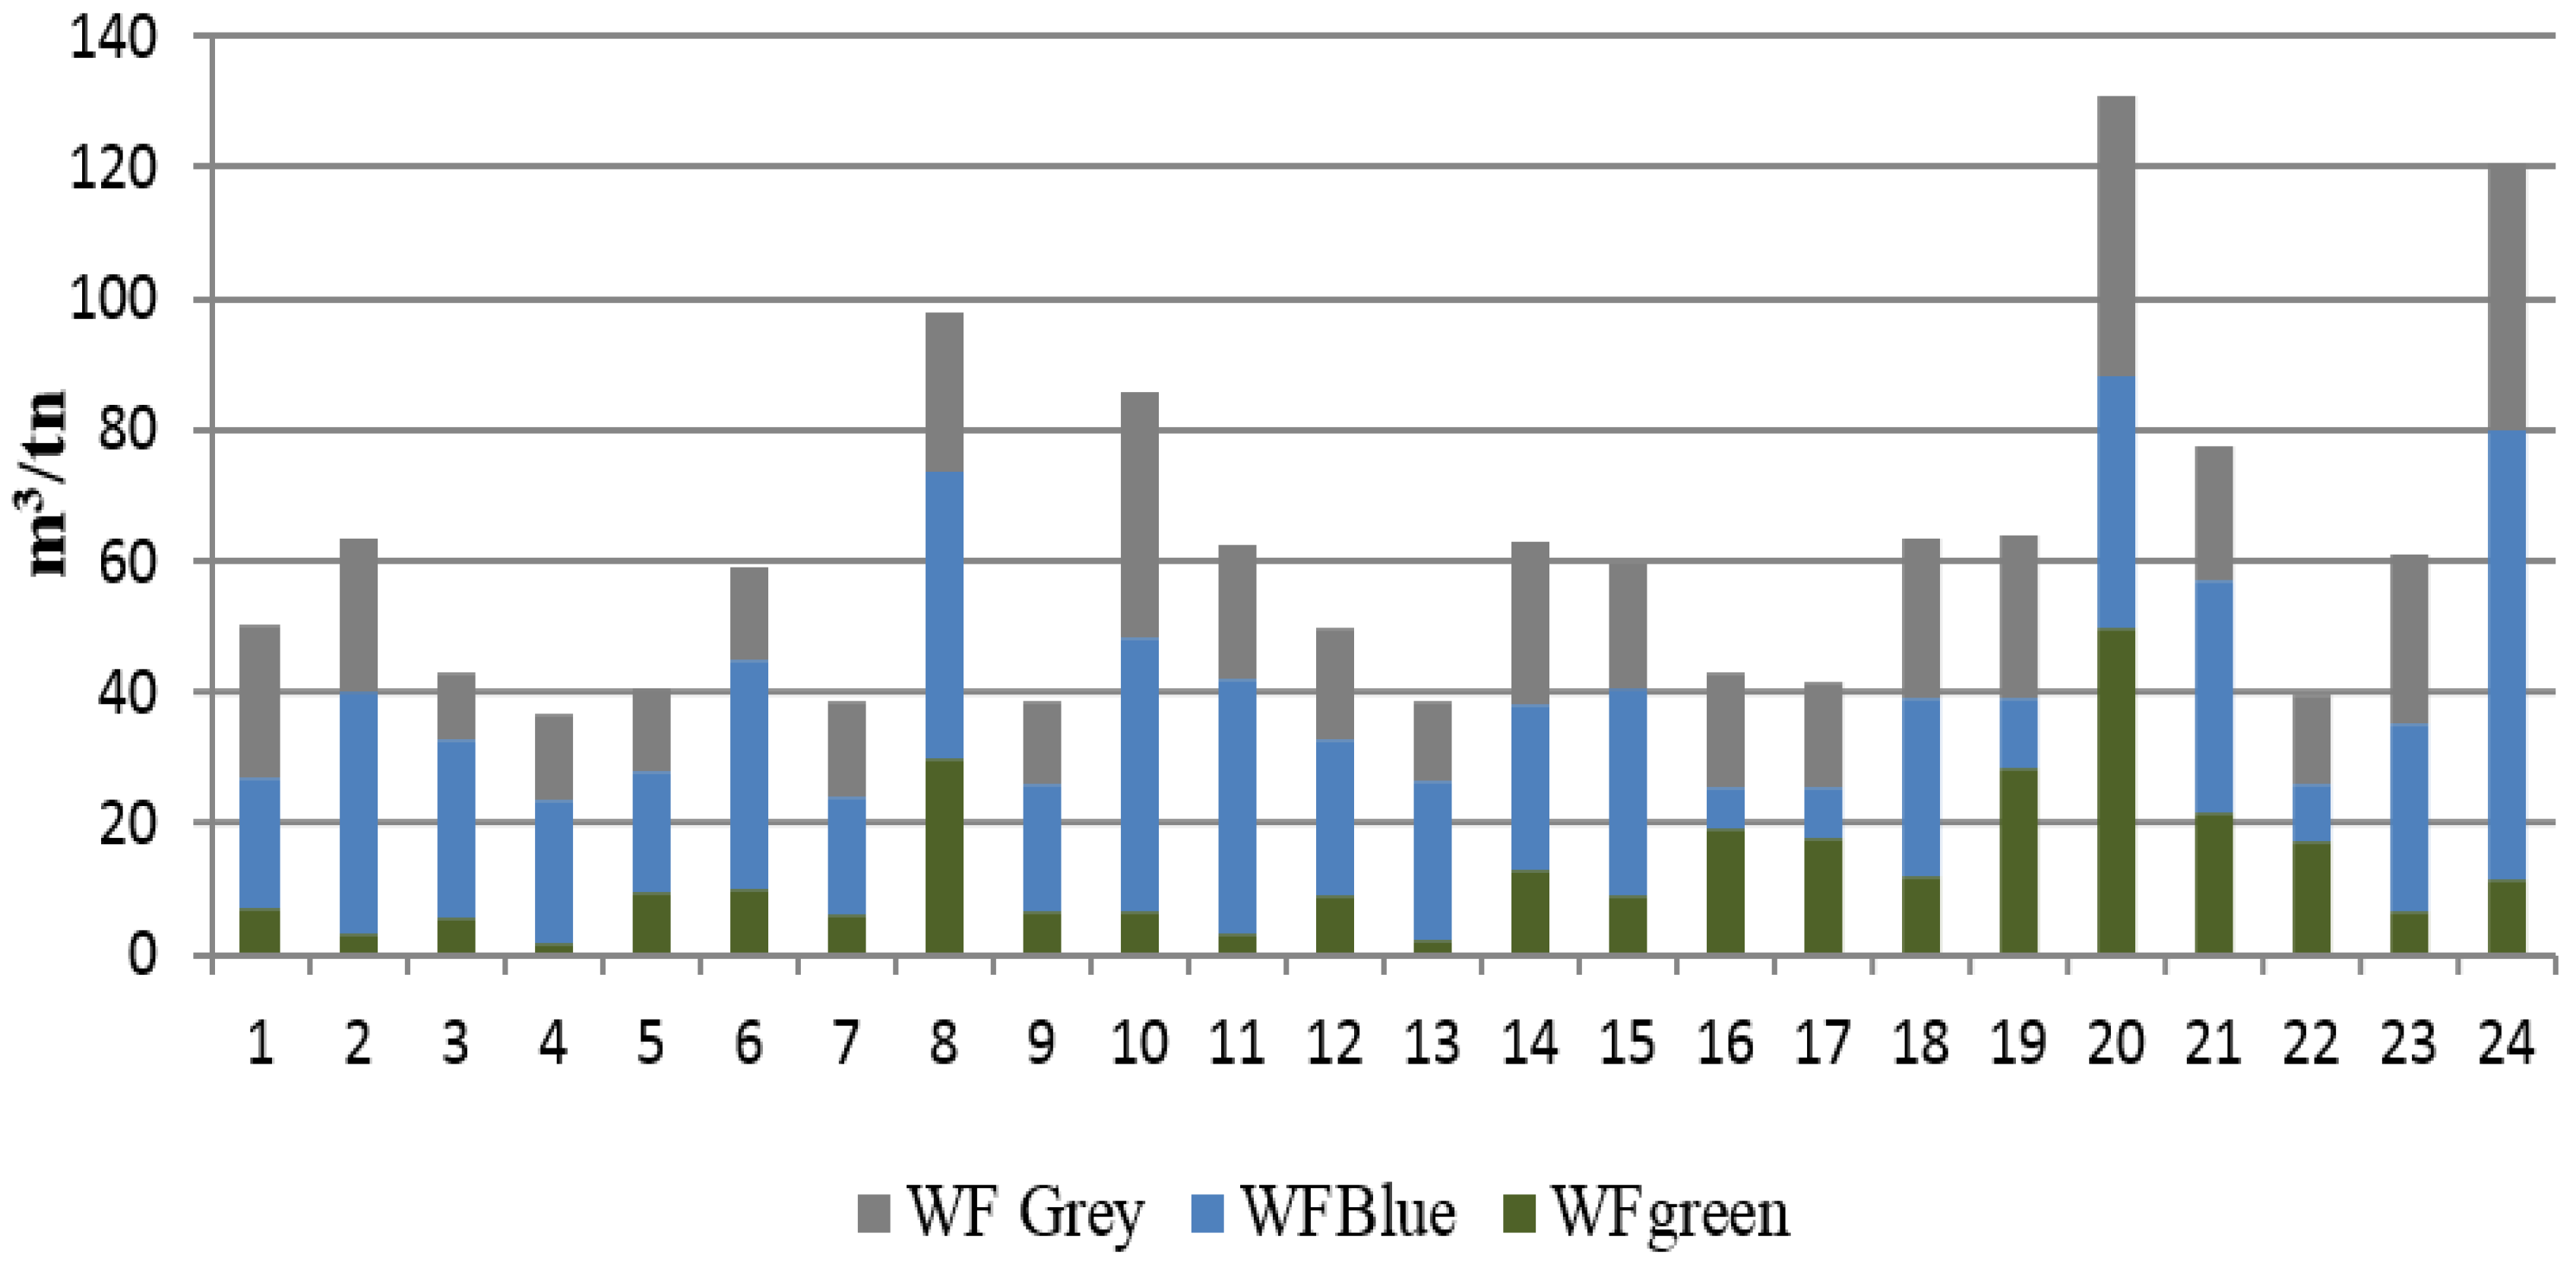
- WFgrey, the grey WF in m3/ton,
- ■
- Excess N, the quantity of N that escapes from the tomato rhizosphere in kg/ha,
- ■
- Cmax, the maximum allowable N concentration,
- ■
- Cnat, the N concentration of the environment in kg/m3 and,
- ■
- Y, the crop yield in ton/ha.
3. Results and Discussion
4. Conclusions
Acknowledgments
Author Contributions
Conflicts of Interest
References
- Wriedt, G.; Vander, V.M.; Aloe, A.; Bouraoui, F. Estimating irrigation water requirements in Europe. J. Hydrol. 2009, 373, 527–544. [Google Scholar] [CrossRef]
- The European Economic Area (EEA). Towards Efficient Use of Water Resources in Europe; EEA Report No. 1/2012; EEA: Copenhagen, Denmark, 2012. [Google Scholar]
- Panagopoulos, Y.; Makropoulosa, C.; Gkiokas, A.; Kossida, M.; Evangelou, L.; Lourmas, G.; Michas, S.; Tsadilas, C.; Papageorgiou, S.; Perleros, V.; et al. Assessing the cost-effectiveness of irrigation water management practices in water stressed agricultural catchments: The case of Pinios. Agric. Water Manag. 2014, 139, 31–42. [Google Scholar] [CrossRef]
- Loukas, A.; Mylopoulos, N.; Vasiliades, L. A modeling system for the evaluation of water resources management strategies in Thessaly, Greece. Water Resour. Manag. 2007, 21, 1673–1702. [Google Scholar] [CrossRef]
- Hoekstra, A.Y.; Chapagain, A.K.; Aldaya, M.M.; Mekonnen, M.M. Water Footprint Manual: State of the Art; Water Footprint Network: Enschede, The Netherlands, 2009. [Google Scholar]
- Boulay, A.M.; Hoekstra, A.Y.; Vionnet, S. Complementarities of water-focused Life Cycle Assessment and Water Footprint Assessment. Environ. Sci. Technol. 2013, 47, 11926–11927. [Google Scholar] [CrossRef]
- Manzardo, A.; Ren, J.; Piantella, A.; Mazzi, A.; Fedele, A.; Scipioni, A. Integration of water footprint accounting and costs for optimal chemical pulp supply mix in paper industry. J. Clean. Prod. 2014, 72, 167–173. [Google Scholar] [CrossRef]
- Hess, T.; Andersson, U.; Mena, C.; Williams, A. The impact of healthier dietary scenarios on the global blue water scarcity footprint of food consumption in the UK. Food Policy 2015, 50, 1–10. [Google Scholar] [CrossRef]
- Morillo, J.G.; Diaz, J.A.R.; Camacho, E.; Montesinos, P. Linking water footprint accounting with irrigation management in high value crops. J. Clean. Prod. 2015, 87, 594–602. [Google Scholar] [CrossRef]
- Page, G.; Ridoutt, B.; Bellotti, B. Fresh tomato production for the Sydney market: An evaluation of options to reduce freshwater scarcity from agricultural water use. Agric. Water Manag. 2011, 100, 18–24. [Google Scholar] [CrossRef]
- Payen, S.; Basset-Mens, C.; Perret, S. LCA of local and imported tomato: An energy and water trade-off. J. Clean. Prod. 2014, 87, 139–148. [Google Scholar] [CrossRef]
- Ridoutt, B.G.; Pfister, S. A revised approach to water footprinting to make transparent the impacts of consumption and production on global freshwater scarcity. Glob. Environ. Chang. 2010, 20, 113–120. [Google Scholar] [CrossRef]
- Aldaya, M.M.; Hoekstra, A.Y. The water needed for Italians to eat pasta and pizza. Agric. Syst. 2010, 103, 351–360. [Google Scholar] [CrossRef]
- Chico, D.G.; Salmoral, M.R.; Llamas, A.; Garridoand, M.; Aldaya, M. The Water Footprint and Virtual Experts of Spanish Tomatos; Papeles de Agua Virtual, No. 8; Botin Foundation: Santander, Spain, 2010. [Google Scholar]
- Bulsink, F.; Hoekstra, A.Y.; Booij, M.J. The water footprint of Indonesian provinces related to the consumption of crop products. Hydrol. Earth Syst. Sci. Discuss. 2010, 6, 5115–5137. [Google Scholar] [CrossRef]
- Galli, A.; Wiedmann, T.; Ercin, E.; Knoblauch, D.; Ewing, B.; Giljum, S. Integrating ecological, carbon and water footprint into a “footprint family” of indicators: Definition and role in tracking human pressure on the planet. Ecol. Indic. 2012, 16, 100–112. [Google Scholar] [CrossRef]
- Hoekstra, A.Y.; Chapagain, A.K. Globalization of Water: Sharing the Planet’s Freshwater Resources; Blackwell Publishing: Oxford, UK, 2008. [Google Scholar]
- Lovarelli, D.; Bacenetti, J.; Fiala, M. Water Footprint of crop productions: A review. Sci. Total Environ. 2016, 1, 236–251. [Google Scholar] [CrossRef]
- Mekonnen, M.M.; Hoekstra, A.Y. The green, blue and grey water footprint of crops and derived crop products. Hydrol. Earth Syst. Sci. 2011, 15, 577–600. [Google Scholar] [CrossRef] [Green Version]
- Chapagain, A.K.; Hoekstra, A.Y. The blue, green and grey water footprint of rice from production and consumption perspectives. Ecol. Econ. 2011, 70, 749–758. [Google Scholar] [CrossRef]
- Manzardo, A.; Mazzi, A.; Loss, A.; Butler, M.; William, A.; Scipioni, A. Lessons learned from the application of different water footprint approaches to compare different food packaging alternatives. J. Clean. Prod. 2016, 112, 4657–4666. [Google Scholar] [CrossRef]
- Araujo, J.S.; Andrade, A.P.; Ramalho, C.I.; Azevedo, C.A.V. Características de frutos de pimentão cultivado emambiente protegido sob doses de nitrogênio via fertirriga ção. Rev. Bras. Eng. Agríc. Ambient. 2009, 13, 152–157. (In Portuguese) [Google Scholar] [CrossRef]
- Amarasinghe, U.A.; Smakhtin, V. Water productivity and water footprint: Misguided concepts or useful tools in water management and policy. Water Int. 2014, 39, 1000–1017. [Google Scholar] [CrossRef]
- Molden, D.; Oweis, T.; Steduto, P.; Bindraban, P.; Hanjra, M.A.; Kijne, J. Improving agricultural water productivity: Between optimism and caution. Agric. Water Manag. 2010, 97, 528–535. [Google Scholar] [CrossRef]
- Evangelou, L.; Vlouchos, C.; Moustaka, K.; Tsadilas, C. DPSIR Study for Desertification in Pinios. In Deliverable for the Task B of the Project I-Adapt: Innovative Approaches to Halt Desertification in Pinios; Final Report; DG Environment, School of Civil Engeneering National Technical University of Athens: Athens, Greece, 2012. [Google Scholar]
- Anonymous. AGRO 2-1 Standard AGROCERT. In Management of Rural Environment—Integrated Management in Agricultural Production. Part 1: Specification; Ministry of Rural Development and Food—Agency Certification and Supervision of Agricultural Products: Athens, Greece, 2008; p. 12. [Google Scholar]
- Hazelton, P.; Murphy, B. Interpreting Soil Test Results: What Do All the Numbers Mean? CSIRO Publishing: Collinwood, Victoria, Australia, 2007; pp. 1–66. [Google Scholar]
- Page, A.L. (Ed.) Methods of Soil Analysis, Agron. 9, Part 2: Chemical and Mineralogical Properties, 2nd ed.; American Society of Agronomy, Soil Science Society of America: Madison, WI, USA, 1982.
- Food and Agriculture Organization (FAO). CROPWAT 8.0 Model; FAO: Rome, Italy, 2010. [Google Scholar]
- Allen, R.G.; Pereira, L.S.; Raes, D.; Smith, M. Crop Evapotranspiration: Guidelines for Computing Crop Water Requirements; FAO Irrigation and Drainage Paper No. 56; FAO: Rome, Italy, 1998. [Google Scholar]
- Environmental Protection Agency. Drinking Water Contaminant Candidate List 2; Final Notice; US Environmental Protection Agency: Washington, DC, USA, 2005.
- Barbee, G.C.; Brown, K.W. Comparison between suction and free-drainage soil solution samplers. Soil Sci. 1986, 141, 149–153. [Google Scholar] [CrossRef]
- Lord, E.I.; Shepherd, M.A. Developments in the use of porous ceramic cups for measuring nitrate leaching. J. Soil Sci. 1993, 44, 435–449. [Google Scholar] [CrossRef]
- Webster, C.P.; Shepherd, M.A.; Goulding, K.W.T.; Lord, E. Comparison between methods for measuring the leaching of mineral nitrogen from arable land. J. Soil Sci. 1993, 44, 49–62. [Google Scholar] [CrossRef]
- Pampolino, M.F.; Urushiyama, T.; Hatano, R. Detection of nitrate leaching through bypass flow using pan lysimeter, suction cup, and resin capsule. Soil Sci. Plant Nutr. 2000, 46, 703–711. [Google Scholar] [CrossRef]
- Zotarelli, L.; Scholberg, J.M.; Dukes, M.D.; Carpen, R.M. Monitoring of Nitrate Leaching in Sandy Soils: Comparison of Three Methods. J. Environ. Qual. 2007, 36, 953–962. [Google Scholar] [CrossRef]
- Chapagain, A.K.; Orr, S. An improved water footprint methodology linking global consumption to local water resources: A case of Spanish tomatoes. J. Environ. Manag. 2009, 90, 1219–1228. [Google Scholar] [CrossRef]
- Aldaya, M.M.; Llamas, M.R. Water Footprint Analysis (Hydrologic and Economic) of the Guadiana River Basin within the NeWater Project; Third Edition of the United Nations World Water Development Report (WWDR-3); NESCO-IHE Institute for Water Education: Delft, The Netherlands; University of Twente: Enschede, The Netherlands; Delft University of Technology: Delft, The Netherlands, 2009. [Google Scholar]
- Aldaya, M.M.; Martinez-Santos, P.; Llamas, M.R. Incorporating the water footprint and virtual water into policy: Reflections from the Mancha Occidental Region, Spain. Water Resour. Manag. 2010, 24, 941–958. [Google Scholar] [CrossRef]
- Salmoral, G.; Chico, D. Lessons learnt from analyses of the water footprint of tomatoes and olive oil in Spain. In Water, Agriculture and the Environment in Spain: Can We Square the Circle? Taylor & Francis Group: London, UK, 2013. [Google Scholar]
- Chukalla, A.D.; Krol, M.S.; Hoekstra, A.Y. Green and blue water footprint reduction in irrigated agriculture: Effect of irrigation techniques, irrigation strategies and mulching. Hydrol. Earth Syst. Sci. 2015, 19, 4877–4891. [Google Scholar] [CrossRef]
- Evangelou, L.; Tsadilas, C. Pilot of a Precision Irrigation Experiment of Cotton in Pinios River Basin. In Deliverable for the Task D of the Project I-Adapt: Innovative Approaches to Halt Desertification in Pinios; Final Report; DG Environment, School of Civil Engeneering National Technical University of Athens: Athens, Greece, 2012. [Google Scholar]
- Castellanos, M.T.; Cartagena, M.C.; Requejo, M.I.; Arce, A.; Cabello, M.J.; Ribas, F.; Tarquis, A.M. Agronomic concepts in water footprint assessment: A case of study in a fertirrigated melon crop under semiarid conditions. Agric. Water Manag. 2016, 170, 81–90. [Google Scholar] [CrossRef]


| Farms | Soil Properties * | |||||||
|---|---|---|---|---|---|---|---|---|
| Sand (%) | Silt (%) | Clay (%) | pH | EC (μS/cm) | CaCO3 (%) | SOM ** (%) | WHC (%) | |
| Growing season 2013 | ||||||||
| 1 | 71 | 16 | 13 | 6.9 | 289 | 0.0 | 2.0 | 48.78 |
| 2 | 39 | 27 | 34 | 8.0 | 437 | 7.7 | 2.4 | 63.92 |
| 3 | 39 | 26 | 35 | 7.9 | 426 | 4.0 | 2.4 | 64.53 |
| 4 | 45 | 36 | 19 | 7.8 | 177 | 0.2 | 0.7 | 45.41 |
| 5 | 12 | 35 | 23 | 8.0 | 328 | 9.0 | 1.0 | 49.51 |
| 6 | 33 | 44 | 23 | 7.6 | 132 | 0.9 | 0.8 | 48.42 |
| 7 | 33 | 40 | 27 | 8.4 | 408 | 3.1 | 1.6 | 55.41 |
| 8 | 33 | 14 | 53 | 8.1 | 388 | 4.0 | 1.7 | 71.83 |
| 9 | 41 | 33 | 26 | 8.0 | 389 | 0.9 | 1.9 | 56.59 |
| Growing season 2014 | ||||||||
| 10 | 40 | 39 | 21 | 7.5 | 130 | 1.8 | 1.0 | 48.28 |
| 11 | 18 | 16 | 66 | 8.1 | 549 | 2.2 | 1.8 | 80.40 |
| 12 | 60 | 23 | 17 | 8.5 | 143 | 7.9 | 1.0 | 45.81 |
| 13 | 43 | 21 | 36 | 8.1 | 209 | 2.2 | 2.2 | 64.06 |
| 14 | 17 | 33 | 50 | 8.1 | 432 | 3.5 | 2.4 | 73.79 |
| 15 | 71 | 16 | 13 | 6.9 | 289 | 0.0 | 2.0 | 48.78 |
| Growing season 2015 | ||||||||
| 16 | 53 | 18 | 29 | 8.4 | 319 | 3.7 | 1.0 | 53.27 |
| 17 | 26 | 32 | 41 | 7.6 | 377 | 0.3 | 1.4 | 62.79 |
| 18 | 46 | 25 | 29 | 8.2 | 310 | 0.9 | 1.2 | 54.30 |
| 19 | 35 | 26 | 39 | 7.4 | 465 | 0.7 | 1.5 | 60.76 |
| 20 | 20 | 44 | 36 | 7.1 | 346 | 0.9 | 1.5 | 60.76 |
| 21 | 18 | 36 | 46 | 8.0 | 397 | 9.7 | 1.6 | 67.48 |
| 22 | 21 | 23 | 56 | 8.3 | 482 | 2.9 | 1.8 | 74.41 |
| 23 | 14 | 26 | 60 | 8.1 | 462 | 1.1 | 1.6 | 75.97 |
| 24 | 22 | 19 | 59 | 8.1 | 585 | 1.9 | 1.6 | 74.99 |
| Fields | Yield (ton/ha) | Irrigation (mm) | WFgreen (m3/ton) | WFblue (m3/ton) | WFgrey (m3/ton) | WF (m3/ton) |
|---|---|---|---|---|---|---|
| 1 | 101.07 | 200.91 | 6.99 | 19.79 | 23.29 | 50.07 |
| 2 | 118.40 | 450.00 | 3.14 | 36.67 | 23.66 | 63.47 |
| 3 | 152.80 | 503.50 | 5.77 | 27.08 | 10.24 | 43.09 |
| 4 | 171.02 | 590.70 | 1.84 | 21.56 | 13.40 | 36.80 |
| 5 | 170.67 | 310.70 | 9.53 | 18.16 | 12.81 | 40.50 |
| 6 | 108.80 | 376.90 | 10.13 | 34.65 | 14.38 | 59.16 |
| 7 | 178.72 | 325.00 | 6.02 | 17.84 | 14.55 | 38.41 |
| 8 | 66.67 | 290.00 | 29.95 | 43.50 | 24.15 | 97.60 |
| 9 | 174.13 | 388.00 | 6.62 | 19.21 | 12.93 | 38.76 |
| 10 | 77.86 | 378.53 | 6.37 | 42.02 | 37.25 | 85.64 |
| 11 | 144.33 | 182.15 | 3.31 | 38.69 | 20.39 | 62.39 |
| 12 | 156.03 | 316.90 | 8.82 | 24.07 | 16.92 | 49.81 |
| 13 | 194.94 | 212.02 | 2.10 | 24.58 | 11.98 | 38.66 |
| 14 | 141.28 | 268.40 | 13.08 | 24.94 | 24.60 | 62.62 |
| 15 | 143.74 | 500.00 | 9.18 | 31.39 | 18.73 | 59.30 |
| 16 | 150.00 | 91.54 | 19.36 | 6.10 | 17.33 | 42.79 |
| 17 | 163.00 | 132.00 | 17.88 | 7.81 | 15.89 | 41.58 |
| 18 | 120.00 | 431.01 | 12.03 | 27.14 | 24.13 | 63.30 |
| 19 | 90.00 | 123.03 | 28.17 | 10.70 | 24.77 | 63.64 |
| 20 | 52.00 | 200.54 | 49.71 | 38.46 | 42.65 | 130.83 |
| 21 | 85.00 | 300.00 | 21.69 | 35.29 | 20.24 | 77.22 |
| 22 | 125.00 | 126.72 | 17.13 | 8.86 | 13.73 | 39.71 |
| 23 | 120.00 | 396.09 | 6.49 | 28.70 | 25.83 | 61.02 |
| 24 | 60.00 | 420.20 | 11.38 | 68.23 | 41.22 | 120.83 |
| Farms | WFgreen %WF | WFblue %WF | WFgrey %WF |
|---|---|---|---|
| 1 | 14.0 | 39.5 | 46.5 |
| 2 | 5.0 | 57.8 | 37.3 |
| 3 | 13.4 | 62.8 | 23.8 |
| 4 | 5.0 | 58.6 | 36.4 |
| 5 | 23.5 | 44.8 | 31.6 |
| 6 | 17.1 | 58.6 | 24.3 |
| 7 | 15.7 | 46.4 | 37.9 |
| 8 | 30.7 | 44.6 | 24.7 |
| 9 | 17.1 | 49.6 | 33.4 |
| 10 | 7.4 | 49.1 | 43.5 |
| 11 | 5.3 | 62.0 | 32.7 |
| 12 | 17.7 | 48.3 | 34.0 |
| 13 | 5.4 | 63.6 | 31.0 |
| 14 | 20.9 | 39.8 | 39.3 |
| 15 | 15.5 | 52.9 | 31.6 |
| 16 | 45.2 | 14.3 | 40.5 |
| 17 | 43.0 | 18.8 | 38.2 |
| 18 | 19.0 | 42.9 | 38.1 |
| 19 | 44.3 | 16.8 | 38.9 |
| 20 | 38.0 | 29.4 | 32.6 |
| 21 | 28.1 | 45.7 | 26.2 |
| 22 | 43.1 | 22.3 | 34.6 |
| 23 | 10.6 | 47.0 | 42.3 |
| 24 | 9.4 | 56.5 | 34.1 |
| Average | 20.6 | 44.6 | 34.7 |
| CV % | 65.41 | 32.93 | 17.34 |
| Variables | Yield | Sand | Silt | Clay | SOM | WHC | Irrigation | WFgreen | WFblue | WFgrey |
|---|---|---|---|---|---|---|---|---|---|---|
| Sand | 0.199 | |||||||||
| Silt | 0.005 | −0.367 | ||||||||
| Clay | −0.280 | −0.734 ** | −0.248 | |||||||
| SOM | 0.047 | −0.021 | −0.343 | 0.327 | ||||||
| WHC | −0.236 | −0.656 ** | −0.308 | 0.971 ** | 0.545 ** | |||||
| Irrigation | 0.076 | 0.215 | 0.186 | −0.294 | −0.032 | −0.269 | ||||
| WFgreen | −0.603 ** | −0.282 | 0.136 | 0.205 | −0.087 | 0.159 | −0.471 * | |||
| WFblue | −0.598 ** | −0.170 | −0.043 | 0.302 | 0.090 | 0.291 | 0.427 * | 0.025 | ||
| WFgrey | −0.815 ** | −0.200 | 0.053 | 0.251 | −0.025 | 0.216 | −0.031 | 0.465 * | 0.645 ** | |
| WFtotal | −0.870 ** | −0.284 | 0.054 | 0.340 | 0.003 | 0.303 | 0.019 | 0.607 ** | 0.780 ** | 0.900 ** |
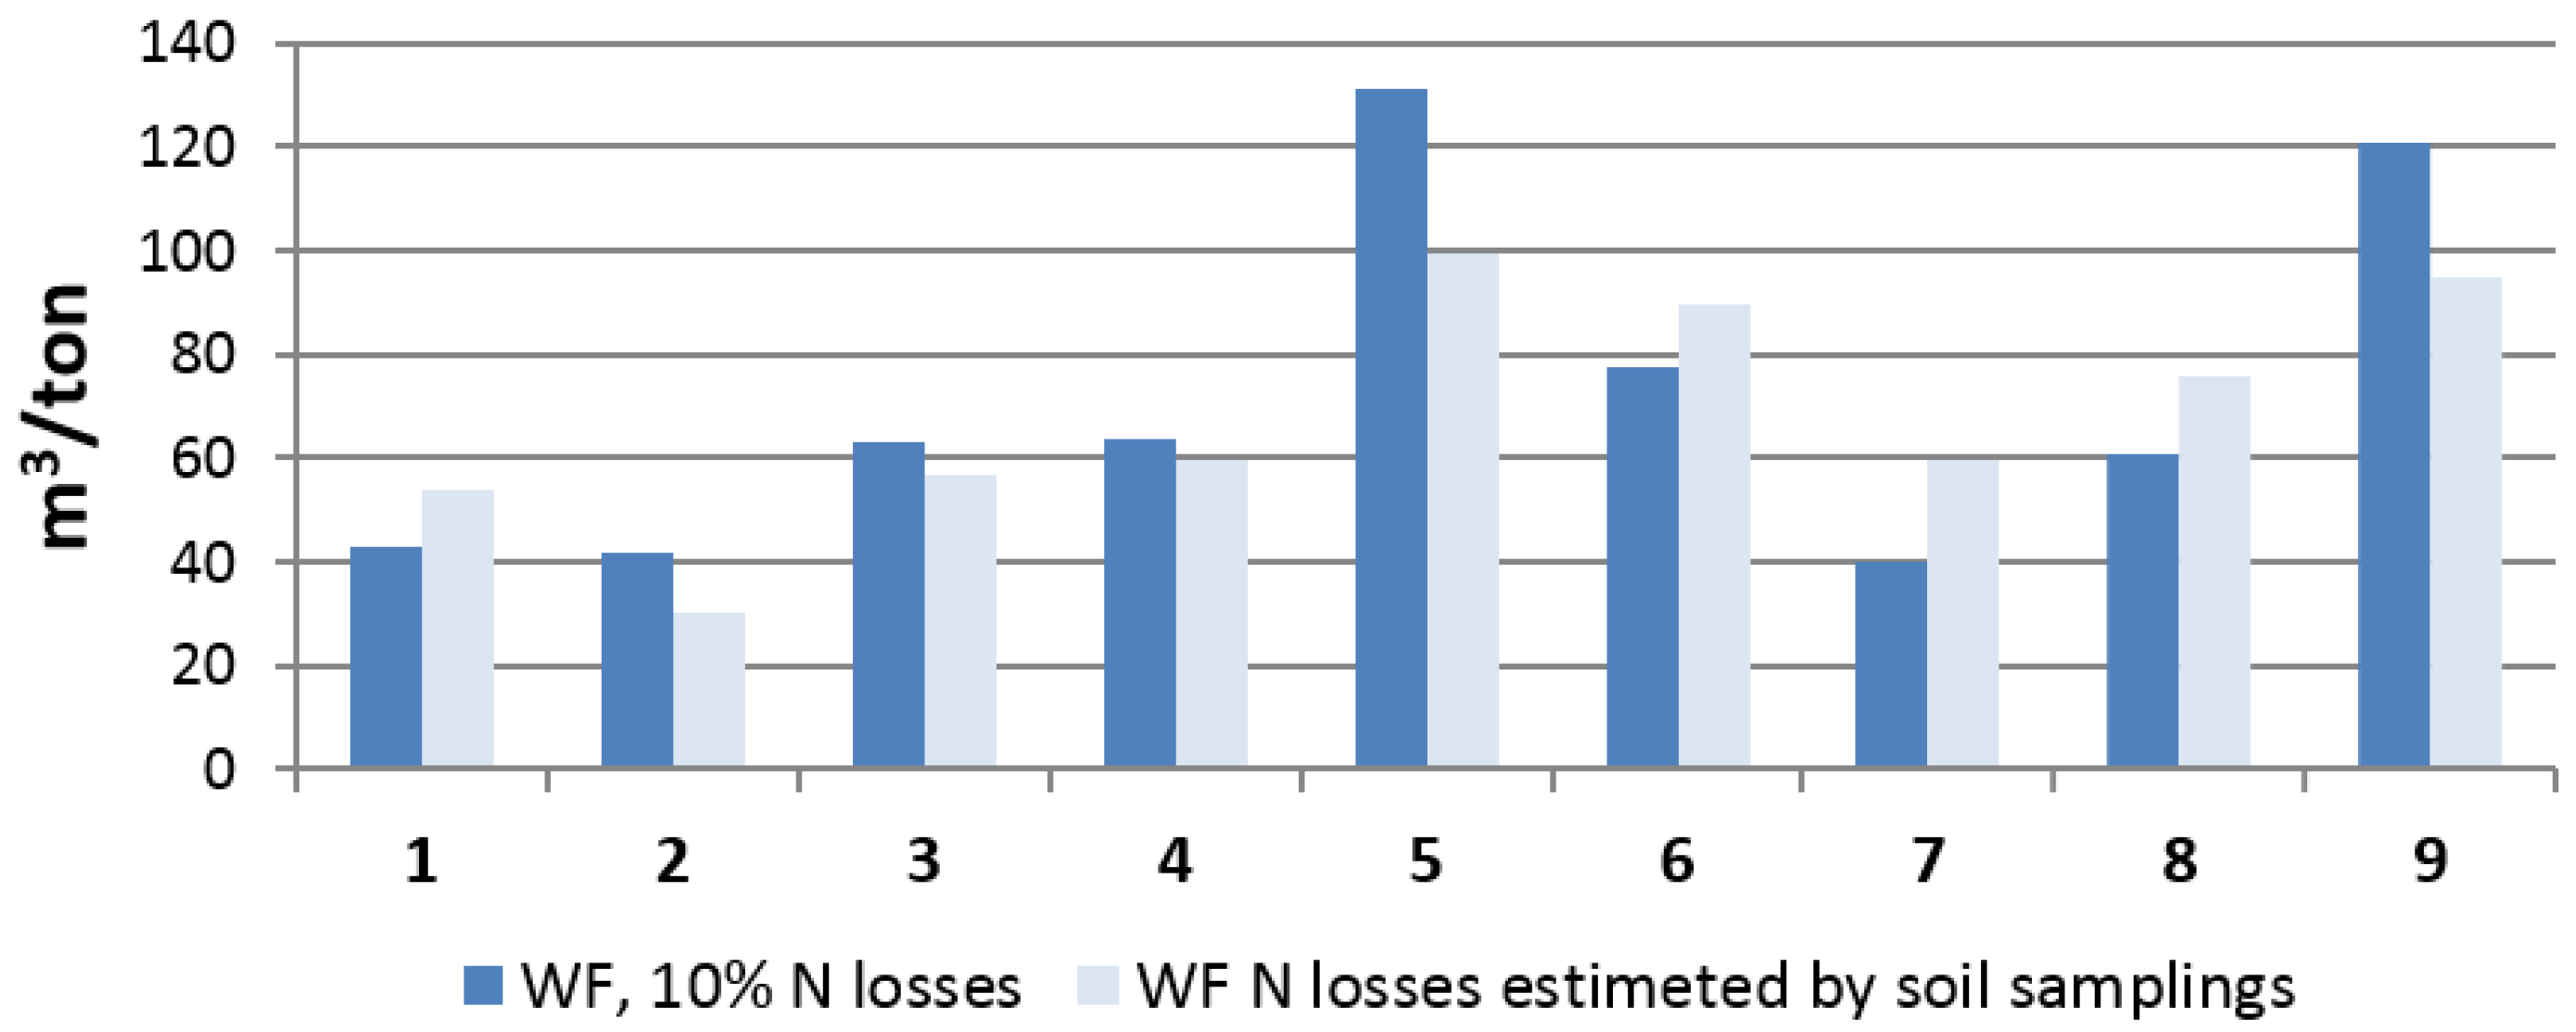
| Farms | N Losses 10% of Applied Fertilizer, kg/ha | N Losses Soil Samplings, kg/ha | WFgrey 10% of Applied Fertilizer, m3/ton | WFgrey Soil Samplings, m3/ton |
|---|---|---|---|---|
| 1 | 26.0 | 21.28 | 17.33 | 28.37 |
| 2 | 25.9 | 27.58 | 15.89 | 4.39 |
| 3 | 28.9 | 48.02 | 24.13 | 17.73 |
| 4 | 22.2 | 1.12 | 24.77 | 21.12 |
| 5 | 22.1 | 7.84 | 42.65 | 11.20 |
| 6 | 17.2 | 7.42 | 20.24 | 32.45 |
| 7 | 17.1 | 9.10 | 13.73 | 33.58 |
| 8 | 31.0 | 42.56 | 25.83 | 40.38 |
| 9 | 24.7 | 55.72 | 41.22 | 15.17 |
| CV % | 18.7 | 77.2 | 39.1 | 48.9 |
© 2016 by the authors; licensee MDPI, Basel, Switzerland. This article is an open access article distributed under the terms and conditions of the Creative Commons Attribution (CC-BY) license (http://creativecommons.org/licenses/by/4.0/).
Share and Cite
Evangelou, E.; Tsadilas, C.; Tserlikakis, N.; Tsitouras, A.; Kyritsis, A. Water Footprint of Industrial Tomato Cultivations in the Pinios River Basin: Soil Properties Interactions. Water 2016, 8, 515. https://doi.org/10.3390/w8110515
Evangelou E, Tsadilas C, Tserlikakis N, Tsitouras A, Kyritsis A. Water Footprint of Industrial Tomato Cultivations in the Pinios River Basin: Soil Properties Interactions. Water. 2016; 8(11):515. https://doi.org/10.3390/w8110515
Chicago/Turabian StyleEvangelou, Eleftherios, Christos Tsadilas, Nikolaos Tserlikakis, Alexandros Tsitouras, and Aristotelis Kyritsis. 2016. "Water Footprint of Industrial Tomato Cultivations in the Pinios River Basin: Soil Properties Interactions" Water 8, no. 11: 515. https://doi.org/10.3390/w8110515
APA StyleEvangelou, E., Tsadilas, C., Tserlikakis, N., Tsitouras, A., & Kyritsis, A. (2016). Water Footprint of Industrial Tomato Cultivations in the Pinios River Basin: Soil Properties Interactions. Water, 8(11), 515. https://doi.org/10.3390/w8110515