
The Natural and Socioeconomic Influences on Land-Use Intensity: Evidence from China


Abstract
:1. Introduction
2. Materials and Methodology
2.1. Materials
2.2. The Indicator System for Assessing Influence on Land-Use Intensity
2.3. Empirical Modeling and Its Major Steps
- Data processing
- Correlation analysis
- Assessment-specific modeling
3. Results
3.1. Overall Influence Assessment
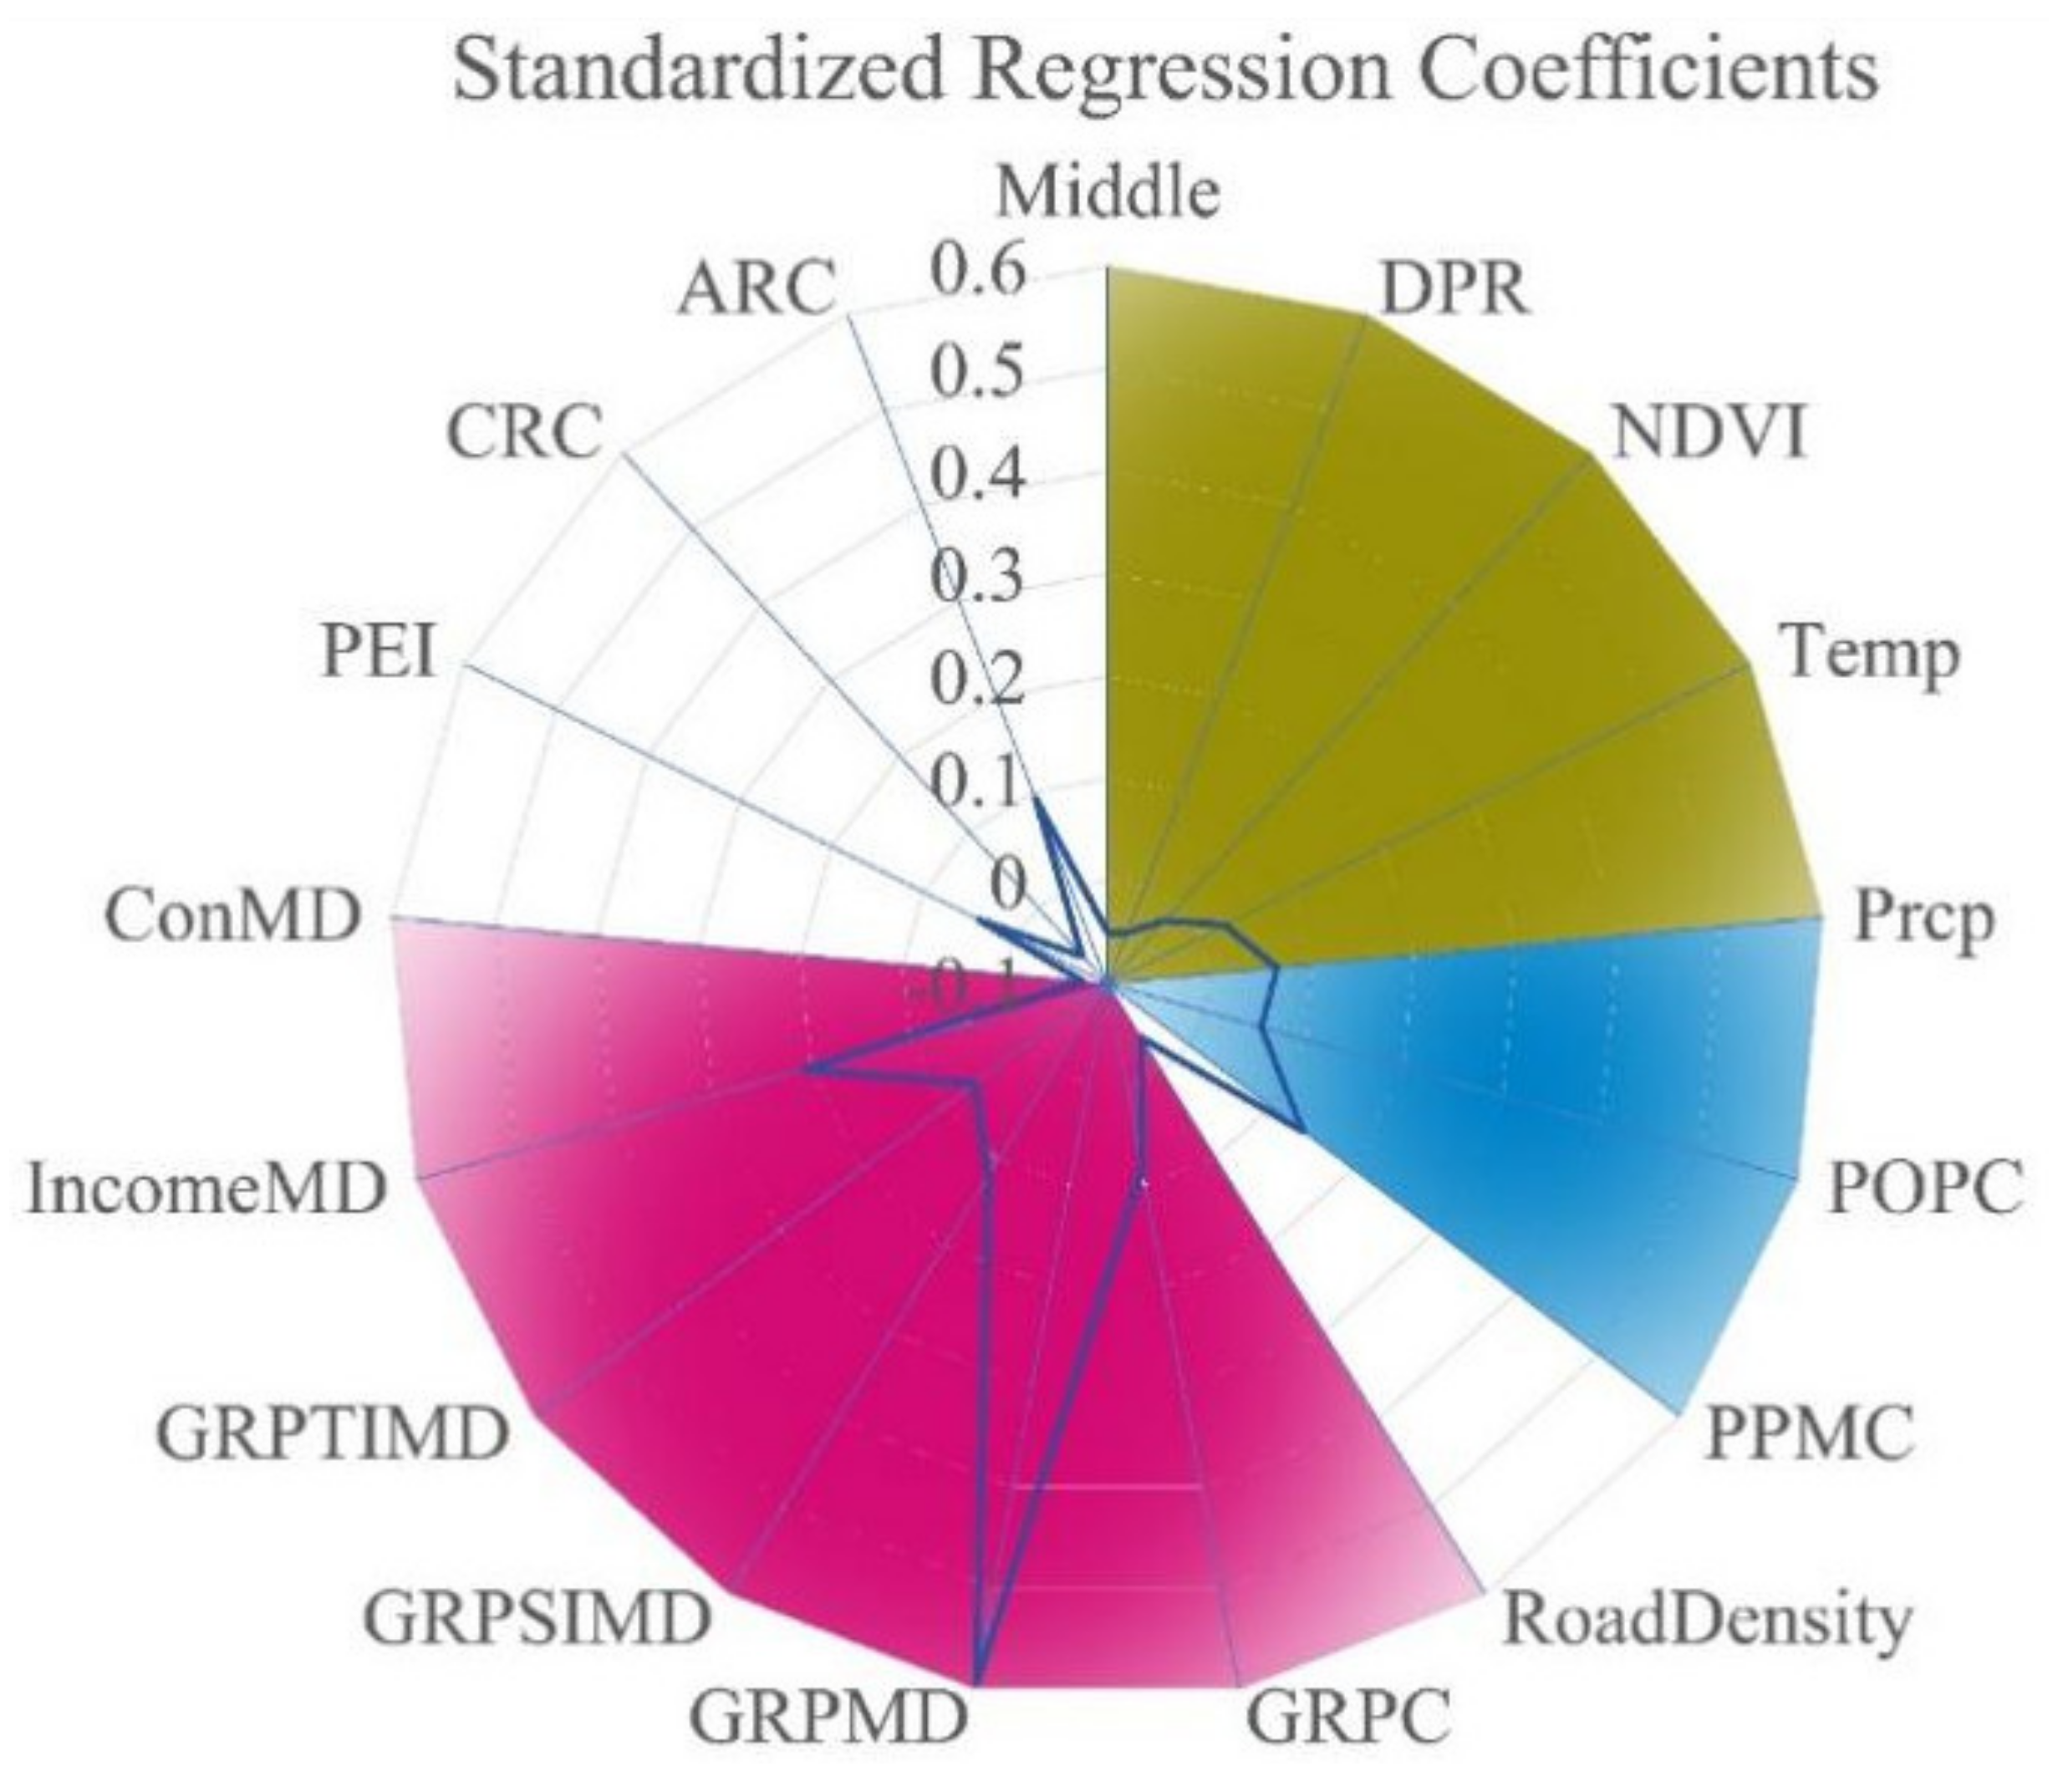
3.2. Region-based Influence Assessment
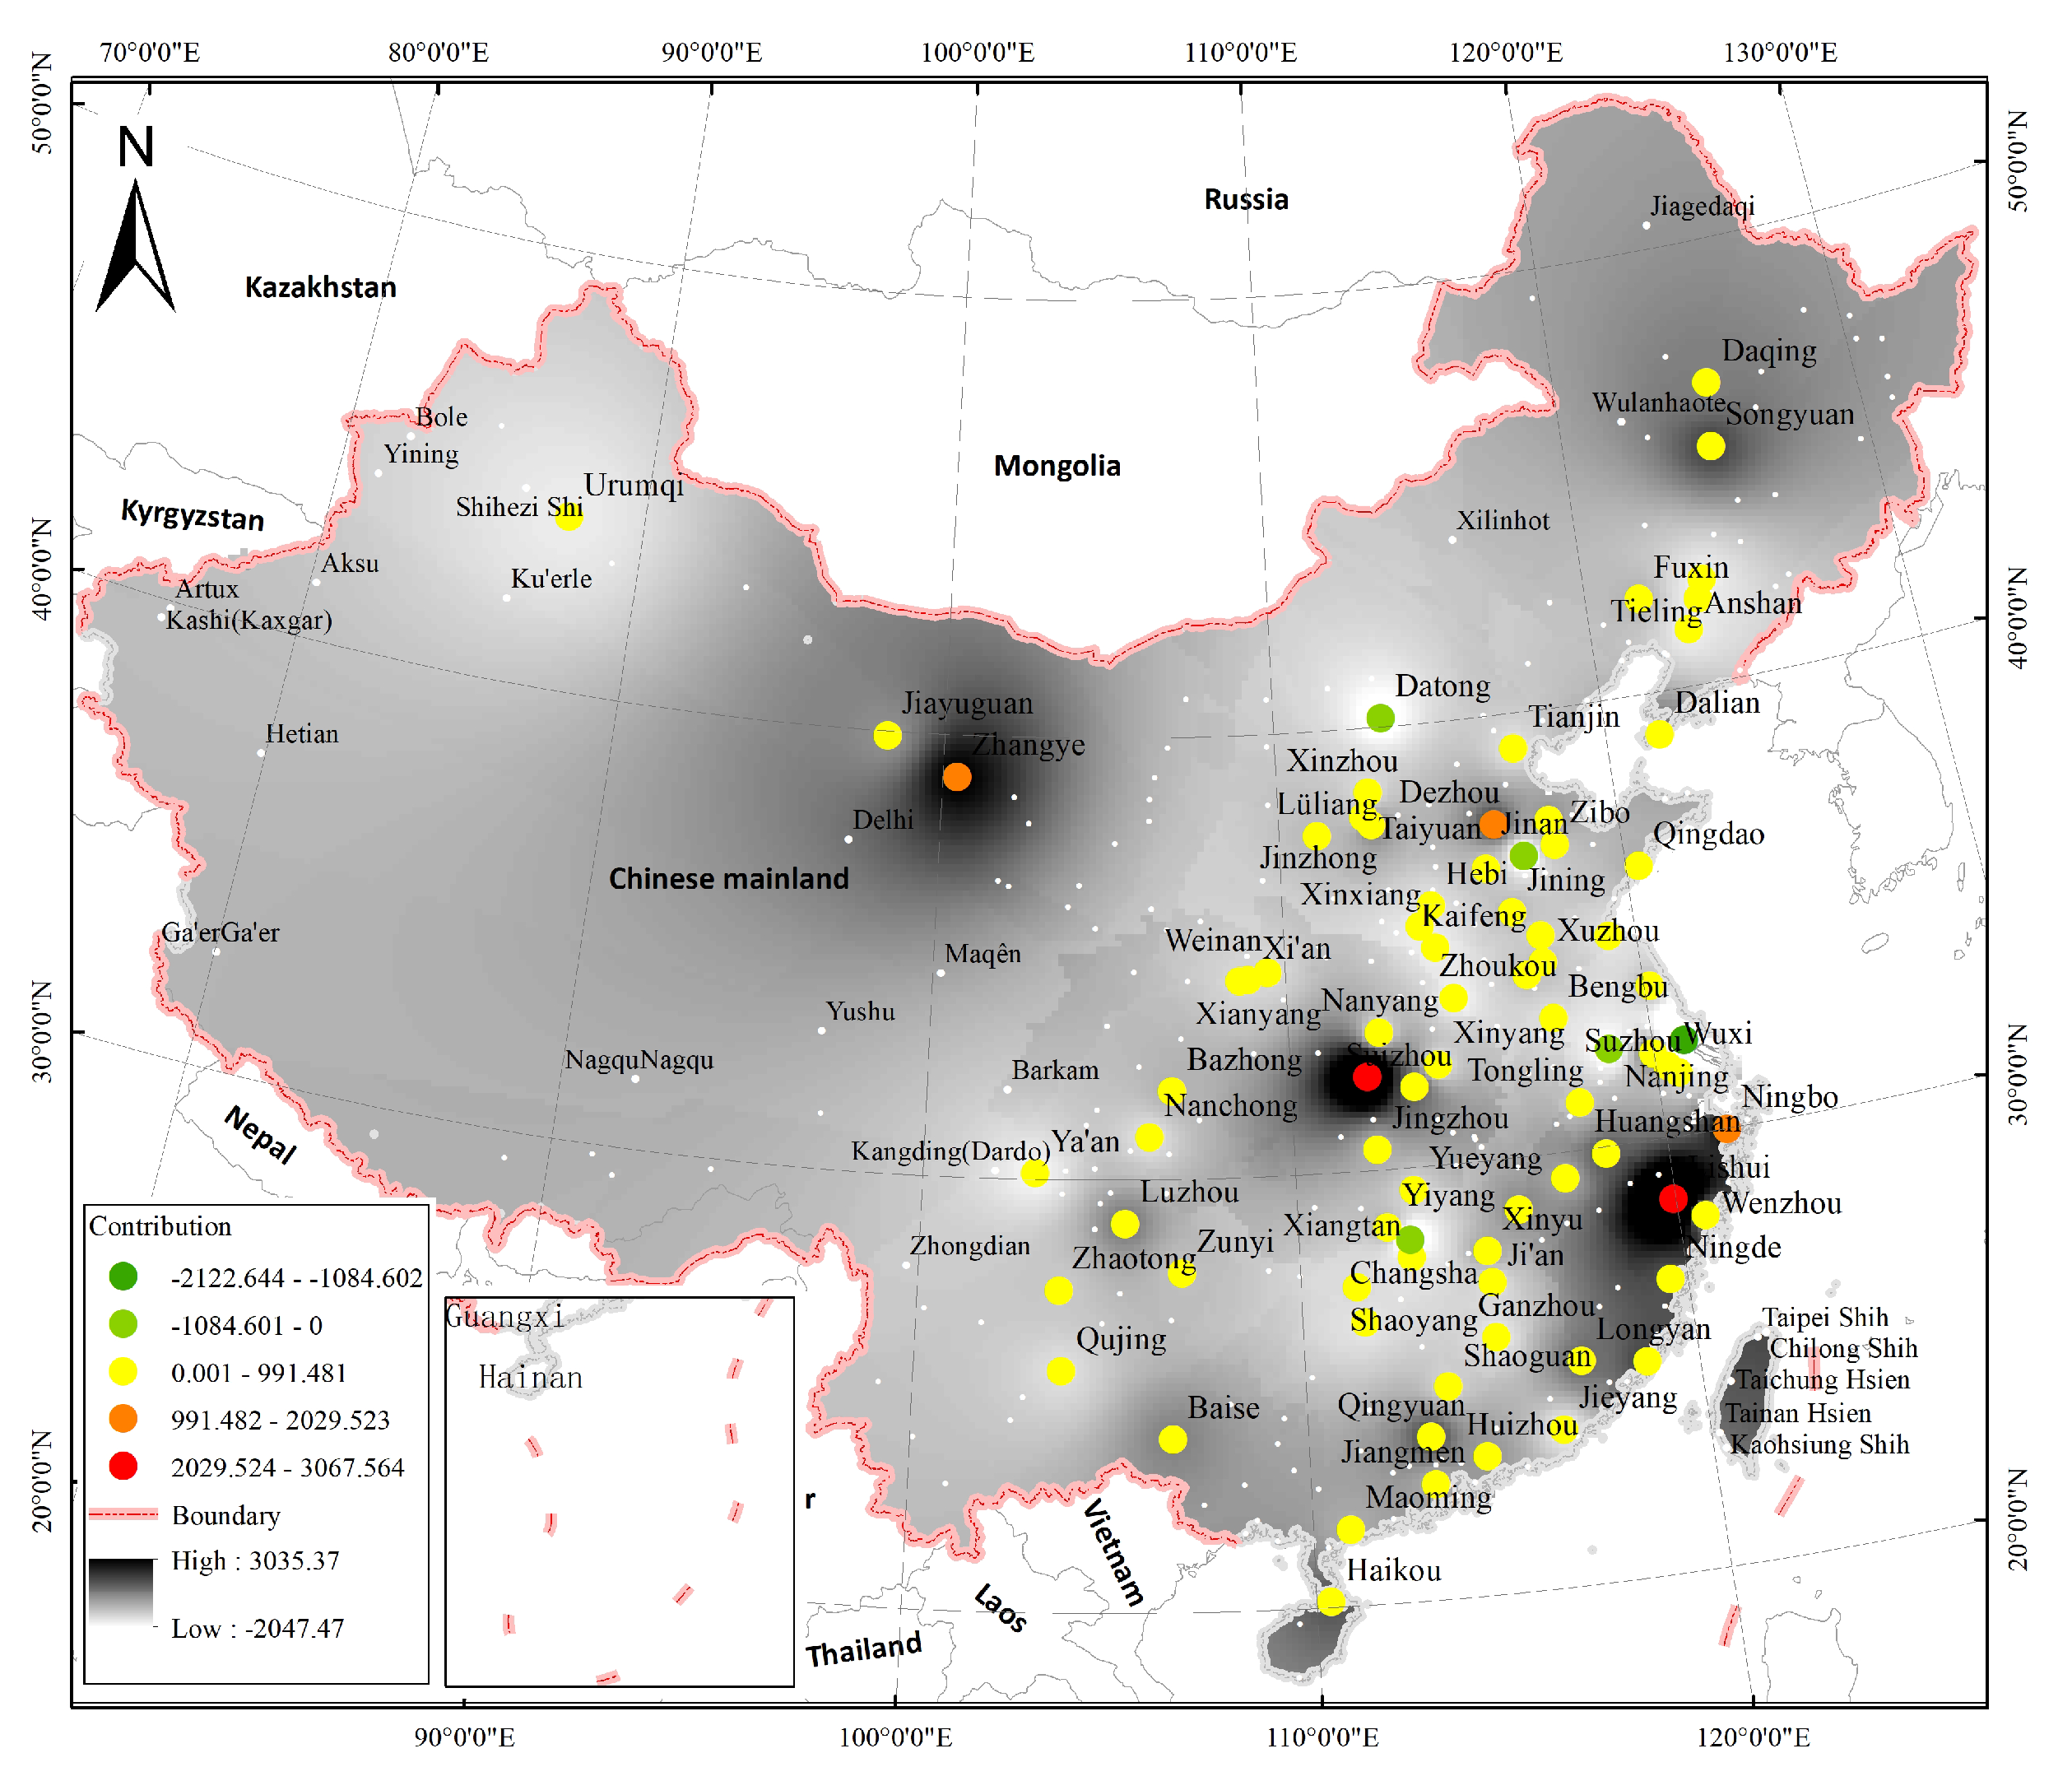
3.3. City-Based Influence Assessment
3.4. The Temporal Influence Assessment
4. Discussion
4.1. Influences on LUI Revealed in Overall Assessment
4.1.1. Influences of Natural Factors on LUI
4.1.2. Influences of Socioeconomic Factors on LUI
4.2. Influences on LUI Revealed in the Region-Based Assessment
4.3. Influences on LUI Revealed in City-Based Assessment
4.4. Influences on LUI Revealed in the Temporal Assessment
5. Conclusions
Author Contributions
Funding
Data Availability Statement
Acknowledgments
Conflicts of Interest
Appendix A

| Region | Province | City |
|---|---|---|
| East | Beijing, Fujian, Guangdong, Guangxi, Hainan, Hebei, Jiangsu, Liaoning, Shandong, Shanghai, Tianjin, Zhejiang | Anshan, Baise, Baoding, Beihai, Beijing, Benxi, Binzhou, Cangzhou, Changzhou, Chaoyang, Chaozhou, Chengde, Chongzuo, Dalian, Dandong, Danzhou, Dezhou, Dongguan, Dongying, Fangchenggang, Foshan, Fuzhou, Fushun, Fuxin, Guangzhou, Guigang, Guilin, Haikou, Handan, Hangzhou, Hechi, Heyuan, Heze, Hezhou, Hengshui, Huludao, Huzhou, Huaian, Huizhou, Jinan, Jining, Jiaxing, Jiangmen, Jieyang, Jinhua, Jinzhou, Laibin, Laiwu, Langfang, Lishui, Lianyungang, Liaoyang, Liaocheng, Linyi, Liuzhou, Longyan, Maoming, Meizhou, Nanjing, Nanning, Nanping, Nantong, Ningbo, Ningde, Panjin, Putian, Qinzhou, Qinhuangdao, Qingdao, Qingyuan, Quzhou, Quanzhou, Rizhao, Sanming, Sansha, Sanya, Xiamen, Shantou, Shanwei, Shanghai, Shaoguan, Shaoxing, Shenzhen, Shenyang, Shijiazhuang, Suzhou, Taizhou, Taian, Taizhou, Tangshan, Tianjin, Tieling, Weihai, Weifang, Wenzhou, Wuxi, Wuzhou, Xingtai, Suqian, Xuzhou, Yantai, Yancheng, Yangzhou, Yangjiang, Yingkou, Yulin, Yunfu, Zaozhuang, Zhanjiang, Zhangjiakou, Zhangzhou, Zhaoqing, Zhenjiang, Zhongshan, Zhoushan, Zhuhai, Zibo |
| Middle | Anhui, Heilongjiang, Henan, Hubei, Hunan, Jiangxi, Jilin, Neimenggu, Shanxi | Anqing, Anyang, Bayannaodong, Baicheng, Baishan, Bangbu, Baotou, Bozhou, Changde, Chenzhou, Chizhou, Chifeng, Chuzhou, Daqing, Datong, Dongdongdongsi, Dongzhou, Fuzhou, Fuyang, Ganzhou, Hadongbin, Hefei, Hebi, Hegang, Heihe, Hengyang, Huhehaote, Hulunbeidong, Huaihua, Huaibei, Huainan, Huanggang, Huangshan, Huangshi, Jixi, Jian, Jilin, Jiamusi, Jiaozuo, Jincheng, Jinzhong, Jingmen, Jingzhou, Jingdezhen, Jiujiang, Kaifeng, Liaoyuan, Linfen, Liuan, Loudi, Luoyang, Luohe, Lvliang, Maanshan, Mudanjiang, Nanchang, Nanyang, Pingdingshan, Pingxiang, Puyang, Qitaihe, Qiqihadong, Sanmenxia, Shangqiu, Shangrao, Shaoyang, Shiyan, Shuangyashan, Shuozhou, Siping, Songyuan, Suihua, Suizhou, Taiyuan, Tonghua, Tongliao, Tongling, Wuhai, Wulanchabu, Wuhu, Wuhan, Xianning, Xiangtan, Xiangyang, Xiaogan, Xinzhou, Xinxiang, Xinyu, Xinyang, Suzhou, Xuchang, Xuancheng, Yangquan, Yichun, Yichang, Yichun, Yiyang, Yingtan, Yongzhou, Yueyang, Yuncheng, Zhangjiajie, Changchun, Changsha, Changzhi, Zhengzhou, Zhoukou, Zhuzhou, Zhumadian |
| West | Gansu, Guizhou, Ningxia, Qinghai, Shanxi, Sichuan, Xicang, Xinjiang, Yunnan, Zhongqing | Ankang, Anshun, Bazhong, Baiyin, Baoji, Baoshan, Bijie, Changdong, Chengdong, Dazhou, Deyang, Dingxi, Guyuan, Guangan, Guangyuan, Guiyang, Hami, Haidong, Hanzhong, Jiayuguan, Jinchang, Jiuquan, Kelamayi, Kunming, Lasa, Lanzhou, Leshan, Lijiang, Linzhi, Lincang, Liupanshui, Longnan, Luzhou, Meishan, Mianyang, Nanchong, Neijiang, Panzhihua, Pingliang, Pudong, Qingyang, Qujing, Rikaze, Shannan, Shangluo, Shizuishan, Suining, Tianshui, Tongchuan, Tongren, Tulufan, Weinan, Wulumuqi, Wuzhong, Wuwei, Xian, Xining, Xianyang, Yaan, Yanan, Yibin, Yinchuan, Yulin, Yuxi, Zhangye, Zhaotong, Zhongwei, Zhongqing, Ziyang, Zigong, Zunyi |


References
- Erb, K.-H.; Haberl, H.; Jepsen, M.R.; Kuemmerle, T.; Lindner, M.; Müller, D.; Verburg, P.H.; Reenberg, A. A Conceptual Framework for Analysing and Measuring Land-Use Intensity. Curr. Opin. Environ. Sustain. 2013, 5, 464–470. [Google Scholar] [CrossRef] [PubMed] [Green Version]
- Godfray, H.C.J.; Beddington, J.R.; Crute, I.R.; Haddad, L.; Lawrence, D.; Muir, J.F.; Pretty, J.; Robinson, S.; Thomas, S.M.; Toulmin, C. Food Security: The Challenge of Feeding 9 Billion People. Science 2010, 327, 812–818. [Google Scholar] [CrossRef] [PubMed] [Green Version]
- Zang, J.; Zhang, T.; Chen, L.; Li, L.; Liu, W.; Yuan, L.; Zhang, Y.; Liu, R.; Wang, Z.; Yu, Z.; et al. Optimization of Modelling Population Density Estimation Based on Impervious Surfaces. Land 2021, 10, 791. [Google Scholar] [CrossRef]
- Ellis, E.C.; Ramankutty, N. Putting People in the Map: Anthropogenic Biomes of the World. Front. Ecol. Environ. 2008, 6, 439–447. [Google Scholar] [CrossRef] [Green Version]
- Erb, K.-H.; Gaube, V.; Krausmann, F.; Plutzar, C.; Bondeau, A.; Haberl, H. A Comprehensive Global 5 Min Resolution Land-Use Data Set for the Year 2000 Consistent with National Census Data. J. Land Use Sci. 2007, 2, 191–224. [Google Scholar] [CrossRef]
- Dobler-Morales, C.; Roy Chowdhury, R.; Schmook, B. Governing Intensification: The Influence of State Institutions on Smallholder Farming Strategies in Calakmul, Mexico. J. Land Use Sci. 2019, 15, 108–126. [Google Scholar] [CrossRef]
- Yang, J.; Zeng, C.; Cheng, Y.J. Spatial Influence of Ecological Networks on Land Use Intensity. Sci. Total Environ. 2020, 717, 137151. [Google Scholar] [CrossRef]
- Meyfroidt, P.; Roy Chowdhury, R.; de Bremond, A.; Ellis, E.C.; Erb, K.H.; Filatova, T.; Garrett, R.D.; Grove, J.M.; Heinimann, A.; Kuemmerle, T.; et al. Middle-Range Theories of Land System Change. Glob. Environ. Chang. 2018, 53, 52–67. [Google Scholar] [CrossRef]
- Brookfield, H.C. Intensification and Disintensification in Pacific Agriculture. Pac. Viewp. 1972, 13, 30–48. [Google Scholar] [CrossRef]
- Erb, K.H. How a Socio-Ecological Metabolism Approach Can Help to Advance Our Understanding of Changes in Land-Use Intensity. Ecol. Econ. 2012, 76, 8–14. [Google Scholar] [CrossRef] [Green Version]
- Lorel, C.; Plutzar, C.; Erb, K.H.; Mouchet, M. Linking the Human Appropriation of Net Primary Productivity-Based Indicators, Input Cost and High Nature Value to the Dimensions of Land-Use Intensity across French Agricultural Landscapes. Agric. Ecosyst. Environ. 2019, 283, 106565. [Google Scholar] [CrossRef]
- Teillard, F.; Allaire, G.; Cahuzac, E.; Léger, F.; Maigné, E.; Tichit, M. A Novel Method for Mapping Agricultural Intensity Reveals Its Spatial Aggregation: Implications for Conservation Policies. Agric. Ecosyst. Environ. 2012, 149, 135–143. [Google Scholar] [CrossRef]
- Shriar, A.J. Agricultural Intensity and Its Measurement in Frontier Regions. Agrofor. Syst. 2000, 49, 301–318. [Google Scholar] [CrossRef]
- Keys, E.; McConnell, W.J. Global Change and the Intensification of Agriculture in the Tropics. Glob. Environ. Chang. 2005, 15, 320–337. [Google Scholar] [CrossRef]
- Lambin, E.F.; Meyfroidt, P. Global Land Use Change, Economic Globalization, and the Looming Land Scarcity. Proc. Natl. Acad. Sci. USA 2011, 108, 3465–3472. [Google Scholar] [CrossRef] [Green Version]
- Ruiz-Martinez, I.; Marraccini, E.; Debolini, M.; Bonari, E. Indicators of Agricultural Intensity and Intensification: A Review of the Literature. Ital. J. Agron. 2015, 10, 74–84. [Google Scholar] [CrossRef] [Green Version]
- Shaw, B.J.; van Vliet, J.; Verburg, P.H. The Peri-Urbanization of Europe: A Systematic Review of a Multifaceted Process. Landsc. Urban Plan. 2020, 196, 103733. [Google Scholar] [CrossRef]
- Appiah, D.O.; Bugri, J.T.; Forkuo, E.K.; Boateng, P.K. Determinants of Peri-Urbanization and Land Use Change Patterns in Peri-Urban Ghana. J. Sustain. Dev. 2014, 7, 95. [Google Scholar] [CrossRef] [Green Version]
- Plieninger, T.; Draux, H.; Fagerholm, N.; Bieling, C.; Bürgi, M.; Kizos, T.; Kuemmerle, T.; Primdahl, J.; Verburg, P.H. The Driving Forces of Landscape Change in Europe: A Systematic Review of the Evidence. Land Use Policy 2016, 57, 204–214. [Google Scholar] [CrossRef] [Green Version]
- Wellmann, T.; Haase, D.; Knapp, S.; Salbach, C.; Selsam, P.; Lausch, A. Urban Land Use Intensity Assessment: The Potential of Spatio-Temporal Spectral Traits with Remote Sensing. Ecol. Indic. 2018, 85, 190–203. [Google Scholar] [CrossRef]
- Kaini, S.; Gardner, T.; Sharma, A.K. Assessment of Socio-Economic Factors Impacting on the Cropping Intensity of an Irrigation Scheme in Developing Countries. Irrig. Drain. 2020, 69, 363–375. [Google Scholar] [CrossRef]
- Lu, X.; Huang, X.; Zhong, T.; Zhao, X.; Chen, Y.; Guo, S. Comparative Analysis of Influence Factors on Arable Land Use Intensity at Farm Household Level: A Case Study Comparing Suyu District of Suqian City and Taixing City, Jiangsu Province, China. Chin. Geogr. Sci. 2012, 22, 556–567. [Google Scholar] [CrossRef]
- Lambin, E.F.; Rounsevell, M.D.A.; Geist, H.J. Are Agricultural Land-Use Models Able to Predict Changes in Land-Use Intensity? Agric. Ecosyst. Environ. 2000, 82, 321–331. [Google Scholar] [CrossRef]
- Jiang, L.; Deng, X.; Seto, K.C. The Impact of Urban Expansion on Agricultural Land Use Intensity in China. Land Use Policy 2013, 35, 33–39. [Google Scholar] [CrossRef]
- Xie, H.; Zou, J.; Jiang, H.; Zhang, N.; Choi, Y. Spatiotemporal Pattern and Driving Forces of Arable Land-Use Intensity in China: Toward Sustainable Land Management Using Emergy Analysis. Sustainability 2014, 6, 3504–3520. [Google Scholar] [CrossRef] [Green Version]
- Liu, G.; Wang, H.; Cheng, Y.; Zheng, B.; Lu, Z. The Impact of Rural Out-Migration on Arable Land Use Intensity: Evidence from Mountain Areas in Guangdong, China. Land Use Policy 2016, 59, 569–579. [Google Scholar] [CrossRef]
- Zhong, T.; Qian, Z.; Huang, X.; Zhao, Y.; Zhou, Y.; Zhao, Z. Impact of the Top-down Quota-Oriented Farmland Preservation Planning on the Change of Urban Land-Use Intensity in China. Habitat. Int. 2018, 77, 71–79. [Google Scholar] [CrossRef]
- Persson, A.S.; Olsson, O.; Rundlöf, M.; Smith, H.G. Land Use Intensity and Landscape Complexity-Analysis of Landscape Characteristics in an Agricultural Region in Southern Sweden. Agric. Ecosyst. Environ. 2010, 136, 169–176. [Google Scholar] [CrossRef]
- Chen, L.; Yang, X.; Chen, L.; Potter, R.; Li, Y. A State-Impact-State Methodology for Assessing Environmental Impact in Land Use Planning. Environ. Impact Assess. Rev. 2014, 46, 1–12. [Google Scholar] [CrossRef]
- Chen, L.; Li, L.; Yang, X.; Zheng, J.; Chen, L.; Shen, Z.; Matthieu, K. A Worst-Case Scenario Based Methodology to Assess the Environmental Impact of Land Use Planning. Habitat Int. 2017, 67, 148–163. [Google Scholar] [CrossRef]
- Chen, L.; Yang, X.; Chen, L.; Li, L. Impact Assessment of Land Use Planning Driving Forces on Environment. Environ. Impact Assess. Rev. 2015, 55, 126–135. [Google Scholar] [CrossRef]
- Chen, L.; Li, L.; Yang, X.; Zhang, Y.; Chen, L.; Ma, X. Assessing the Impact of Land-Use Planning on the Atmospheric Environment through Predicting the Spatial Variability of Airborne Pollutants. Int. J. Environ. Res. Public Health 2019, 16, 172. [Google Scholar] [CrossRef] [Green Version]
- Wang, J.; Sun, K.; Ni, J.; Xie, D. Evaluation and Factor Analysis of the Intensive Use of Urban Land Based on Technical Efficiency Measurement—A Case Study of 38 Districts and Counties in Chongqing, China. Sustainability 2020, 12, 8623. [Google Scholar] [CrossRef]
- Hao, H.; Li, X.; Tan, M.; Zhang, J.; Zhang, H. Agricultural Land Use Intensity and Its Determinants: A Case Study in Taibus Banner, Inner Mongolia, China. Front. Earth Sci. 2015, 9, 308–318. [Google Scholar] [CrossRef]
- Xu, F.; Chi, G. Spatiotemporal Variations of Land Use Intensity and Its Driving Forces in China, 2000–2010. Reg. Environ. Chang. 2019, 19, 2583–2596. [Google Scholar] [CrossRef]
- Jiang, Z.; Lyu, P.; Ye, L.; wenqian Zhou, Y. Green Innovation Transformation, Economic Sustainability and Energy Consumption during China’s New Normal Stage. J. Clean. Prod. 2020, 273, 123044. [Google Scholar] [CrossRef]
- Yang, X.; Li, L.; Chen, L.; Zhang, Y.; Chen, L.; Li, C. Use of a Non-Planning Driving Background Change Methodology to Assess the Land-Use Planning Impact on the Environment. Environ. Impact Assess. Rev. 2020, 84, 106440. [Google Scholar] [CrossRef]
- Lee, J.; Jung, S. Industrial Land Use Planning and the Growth of Knowledge Industry: Location Pattern of Knowledge-Intensive Services and Their Determinants in the Seoul Metropolitan Area. Land Use Policy 2020, 95, 104632. [Google Scholar] [CrossRef]
- Li, L.; Solana, C.; Canters, F.; Chan, J.C.-W.; Kervyn, M. Impact of Environmental Factors on the Spectral Characteristics of Lava Surfaces: Field Spectrometry of Basaltic Lava Flows on Tenerife, Canary Islands, Spain. Remote Sens. 2015, 7, 16986–17012. [Google Scholar] [CrossRef] [Green Version]
- Mallick, J.; Almesfer, M.K.; Singh, V.P.; Falqi, I.I.; Singh, C.K.; Alsubih, M.; Kahla, N. ben Evaluating the Ndvi–Rainfall Relationship in Bisha Watershed, Saudi Arabia Using Non-Stationary Modeling Technique. Atmosphere 2021, 12, 593. [Google Scholar] [CrossRef]
- Röder, A.; Hill, J.; Duguy, B.; Alloza, J.A.; Vallejo, R. Using Long Time Series of Landsat Data to Monitor Fire Events and Post-Fire Dynamics and Identify Driving Factors. A Case Study in the Ayora Region (Eastern Spain). Remote Sens. Environ. 2008, 112, 259–273. [Google Scholar] [CrossRef]
- Peng, Y.; Yang, F.; Zhu, L.; Li, R.; Wu, C.; Chen, D. Comparative Analysis of the Factors Influencing Land Use Change for Emerging Industry and Traditional Industry: A Case Study of Shenzhen City, China. Land 2021, 10, 575. [Google Scholar] [CrossRef]
- Cheng, J. Analysis of Commercial Land Leasing of the District Governments of Beijing in China. Land Use Policy 2021, 100, 104881. [Google Scholar] [CrossRef]
- Zhang, Z. Evolution and Evaluation of the Chinese Economic Regions Division. J. Shanxi Financ. Econ. Univ. (High. Educ. Ed.) 2010, 13, 89–92. [Google Scholar]
- Zeng, P.; Qin, Y. Study on the Influence of Urban Administrative Level and Industrial Agglomeration on Foreign Direct Investment. J. Int. Trade 2017, 1, 104–115. [Google Scholar]
- Ba, J.; Wu, Y. Beijing Shanghai and Guangdong Are Tiring, Shenzhen Is Rising, While Kunming Is at the 2nd Level. Youth Soc. 2018, 6, 52–55. [Google Scholar]
- Yang, X.; Li, L.; Chen, L.; Chen, L.; Shen, Z. Improving ASTER GDEM Accuracy Using Land Use-Based Linear Regression Methods: A Case Study of Lianyungang, East China. ISPRS Int. J. Geo-Inf. 2018, 7, 145. [Google Scholar] [CrossRef] [Green Version]
- Yuan, L.; Li, L.; Zhang, T.; Chen, L.; Liu, W.; Hu, S.; Yang, L. Modeling Soil Moisture from Multisource Data by Stepwise Multilinear Regression: An Application to the Chinese Loess Plateau. ISPRS Int. J. Geo-Inf. 2021, 10, 233. [Google Scholar] [CrossRef]
- Iwahashi, J.; Kamiya, I.; Matsuoka, M. Regression Analysis of Vs30 Using Topographic Attributes from a 50-m DEM. Geomorphology 2010, 117, 202–205. [Google Scholar] [CrossRef]
- Maeda, E.E. Downscaling MODIS LST in the East African Mountains Using Elevation Gradient and Land-Cover Information. Int. J. Remote Sens. 2014, 35, 3094–3108. [Google Scholar] [CrossRef]
- Whittingham, M.J.; Stephens, P.A.; Bradbury, R.B.; Freckleton, R.P. Why Do We Still Use Stepwise Modelling in Ecology and Behaviour? J. Anim. Ecol. 2006, 75, 1182–1189. [Google Scholar] [CrossRef]
- Li, L.; Bakelants, L.; Solana, C.; Canters, F.; Kervyn, M. Dating Lava Flows of Tropical Volcanoes by Means of Spatial Modeling of Vegetation Recovery. Earth Surf. Process. Landf. 2018, 43, 840–856. [Google Scholar] [CrossRef]
- Li, L.; Zhou, X.; Chen, L.; Chen, L.; Zhang, Y.; Liu, Y. Estimating Urban Vegetation Biomass from Sentinel-2A Image Data. Forests 2020, 11, 125. [Google Scholar] [CrossRef] [Green Version]
- Fernández-Castilla, B.; Aloe, A.M.; Declercq, L.; Jamshidi, L.; Onghena, P.; Natasha Beretvas, S.; van den Noortgate, W. Concealed Correlations Meta-Analysis: A New Method for Synthesizing Standardized Regression Coefficients. Behav. Res. Methods 2019, 51, 316–331. [Google Scholar] [CrossRef] [Green Version]
- Hartkamp, A.D.; de Beurs, K.; Stein, A.; White, J.W. Interpolation Techniques for Climate Variables Interpolation. Soil Sci. 1999, 1–16. [Google Scholar]
- Salari, M.; Rakhshandehroo, G.; Ehetshami, M. Investigating the Spatial Variability of Some Important Groundwater Quality Factors Based on the Geostatistical Simulation (Case Study: Shiraz Plain). Desalination Water Treat. 2017, 65, 163–174. [Google Scholar] [CrossRef]
- Wang, Y.; Wang, Z.; Zhang, Z.; Shen, D.; Zhang, L. The Best-Fitting Distribution of Water Balance and the Spatiotemporal Characteristics of Drought in Guizhou Province, China. Theor. Appl. Climatol. 2021, 143, 1097–1112. [Google Scholar] [CrossRef]
- Thanh, V.Q.; Roelvink, D.; van der Wegen, M.; Tu, L.X.; Reyns, J.; Linh, V.T.P. Spatial Topographic Interpolation for Meandering Channels. J. Waterw. Port Coast. Ocean Eng. 2020, 146, 4020024. [Google Scholar] [CrossRef]
- Nelson, A.; Oberthür, T.; Cook, S. Multi-Scale Correlations between Topography and Vegetation in a Hillside Catchment of Honduras. Int. J. Geogr. Inf. Sci. 2007, 21, 145–174. [Google Scholar] [CrossRef]
- Thapa, P. The Relationship between Land Use and Climate Change: A Case Study of Nepal. In Global Warming and Climate Change [Working Title]; IntechOpen: London, UK, 2021. [Google Scholar]
- Kumar, R.; Jyoti Das, A. Climate Change and Its Impact on Land Degradation: Imperative Need to Focus. J. Climatol. Weather Forecast. 2014, 2, 2–4. [Google Scholar] [CrossRef]
- Buzhdygan, O.Y.; Tietjen, B.; Rudenko, S.S.; Nikorych, V.A.; Petermann, J.S. Direct and Indirect Effects of Land-Use Intensity on Plant Communities across Elevation in Semi-Natural Grasslands. PLoS ONE 2020, 15, e0231122. [Google Scholar] [CrossRef] [PubMed]
- Di, X.; Hou, X.; Wang, Y.; Wu, L. Spatial-Temporal Characteristics of Land Use Intensity of Coastal Zone in China during 2000–2010. Chin. Geogr. Sci. 2014, 25, 51–61. [Google Scholar] [CrossRef]
- Leys, A.; Govers, G.; Gillijns, K.; Berckmoes, E.; Takken, I. Scale Effects on Runoff and Erosion Losses from Arable Land under Conservation and Conventional Tillage: The Role of Residue Cover. J. Hydrol. 2010, 390, 143–154. [Google Scholar] [CrossRef]
- Hu, S.; Li, L.; Chen, L.; Cheng, L.; Yuan, L.; Huang, X.; Zhang, T. Estimation of Soil Erosion in the Chaohu Lake Basin through Modified Soil Erodibility Combined with Gravel Content in the RUSLE Model. Water 2019, 11, 1806. [Google Scholar] [CrossRef] [Green Version]
- Land and Resources Bureau of Lianyungang City. Geohazard Control Planning for 2016–2020 of Lianyungang City; Land and Resources Bureau of Lianyungang City: Lianyungang, China, 2015.
- Ministry of Housing and Urban-Rural Construction of the People’s Republic of China. China’s Criterion for Vertical Planning of Urban Land Use (CJJ83-2016); Ministry of Housing and Urban-Rural Construction of the People’s Republic of China: Beijing, China, 2016.
- Su, S. GIS Based Evaluation on Ecological Suitability of Construction Land Use in Haikou City. Master’s Thesis, Hainan Normal University, Haikou, China, 2013. [Google Scholar]
- Liu, X.; Wang, Y.; Li, Y.; Liu, F.; Shen, J.; Wang, J.; Xiao, R.; Wu, J. Changes in Arable Land in Response to Township Urbanization in a Chinese Low Hilly Region: Scale Effects and Spatial Interactions. Appl. Geogr. 2017, 88, 24–37. [Google Scholar] [CrossRef]
- Yin, G.; Lin, Z.; Jiang, X.; Yan, H.; Wang, X. Spatiotemporal Differentiations of Arable Land Use Intensity—A Comparative Study of Two Typical Grain Producing Regions in Northern and Southern China. J. Clean. Prod. 2019, 208, 1159–1170. [Google Scholar] [CrossRef]
- Williams, A.M.; Shaw, G. Future Play: Tourism, Recreation and Land Use. Land Use Policy 2009, 26, S326–S335. [Google Scholar] [CrossRef] [Green Version]
- Zeng, Y.; Zhong, L. Identifying Conflicts Tendency between Nature-Based Tourism Development and Ecological Protection in China. Ecol. Indic. 2020, 109, 105791. [Google Scholar] [CrossRef]
- Xia, C.; Yeh, A.G.O.; Zhang, A. Analyzing Spatial Relationships between Urban Land Use Intensity and Urban Vitality at Street Block Level: A Case Study of Five Chinese Megacities. Landsc. Urban Plan. 2020, 193, 103669. [Google Scholar] [CrossRef]
- Gao, B.; Huang, Q.; He, C.; Sun, Z.; Zhang, D. How Does Sprawl Differ across Cities in China? A Multi-Scale Investigation Using Nighttime Light and Census Data. Landsc. Urban Plan. 2016, 148, 89–98. [Google Scholar] [CrossRef]
- Tan, M.; Li, X.; Xie, H.; Lu, C. Urban Land Expansion and Arable Land Loss in China—A Case Study of Beijing–Tianjin–Hebei Region. Land Use Policy 2005, 22, 187–196. [Google Scholar] [CrossRef]
- Tan, Z.; Wei, D.; Yin, Z. Housing Vacancy Rate in Major Cities in China: Perspectives from Nighttime Light Data. Complexity 2020, 2020, 1–12. [Google Scholar] [CrossRef]
- Chen, Z.; Tang, J.; Wan, J.; Chen, Y. Promotion Incentives for Local Officials and the Expansion of Urban Construction Land in China: Using the Yangtze River Delta as a Case Study. Land Use Policy 2017, 63, 214–225. [Google Scholar] [CrossRef]
- Huang, J.; Xue, D. Study on Temporal and Spatial Variation Characteristics and Influencing Factors of Land Use Efficiency in Xi’an, China. Sustainability 2019, 11, 6649. [Google Scholar] [CrossRef] [Green Version]
- Bai, X.; Sun, X.; Chiu, Y.H. Does China’s Higher Education Investment Play a Role in Industrial Growth? Technol. Soc. 2020, 63, 101332. [Google Scholar] [CrossRef]
- Mariana, D.R. Education as a Determinant of the Economic Growth. The Case of Romania. Procedia—Soc. Behav. Sci. 2015, 197, 404–412. [Google Scholar] [CrossRef] [Green Version]
- Jia, M.; Liu, Y.; Lieske, S.N.; Chen, T. Public Policy Change and Its Impact on Urban Expansion: An Evaluation of 265 Cities in China. Land Use Policy 2020, 97, 104754. [Google Scholar] [CrossRef]


| Category | Factor | Indicator | Acronym (Unit) | Data Source | Description and Indicator Calculation |
|---|---|---|---|---|---|
| Natural | Location | Eastern city | East (-) | See Table A1 | Location influences land-use pattern by regulating the type and intensity of land use [38]. It is represented as the regional division, which is widely accepted and applied to national development strategies in China. Distance to primary river was selected because rivers often play a significant role in shaping regional landscapes [39]. |
| Middle city | Middle (-) | ||||
| Distance to primary river | DPR (km) | National Geomatics Center of China (https://www.webmap.cn/commres.do?method=dataDownload, accessed on 5 June 2020) | |||
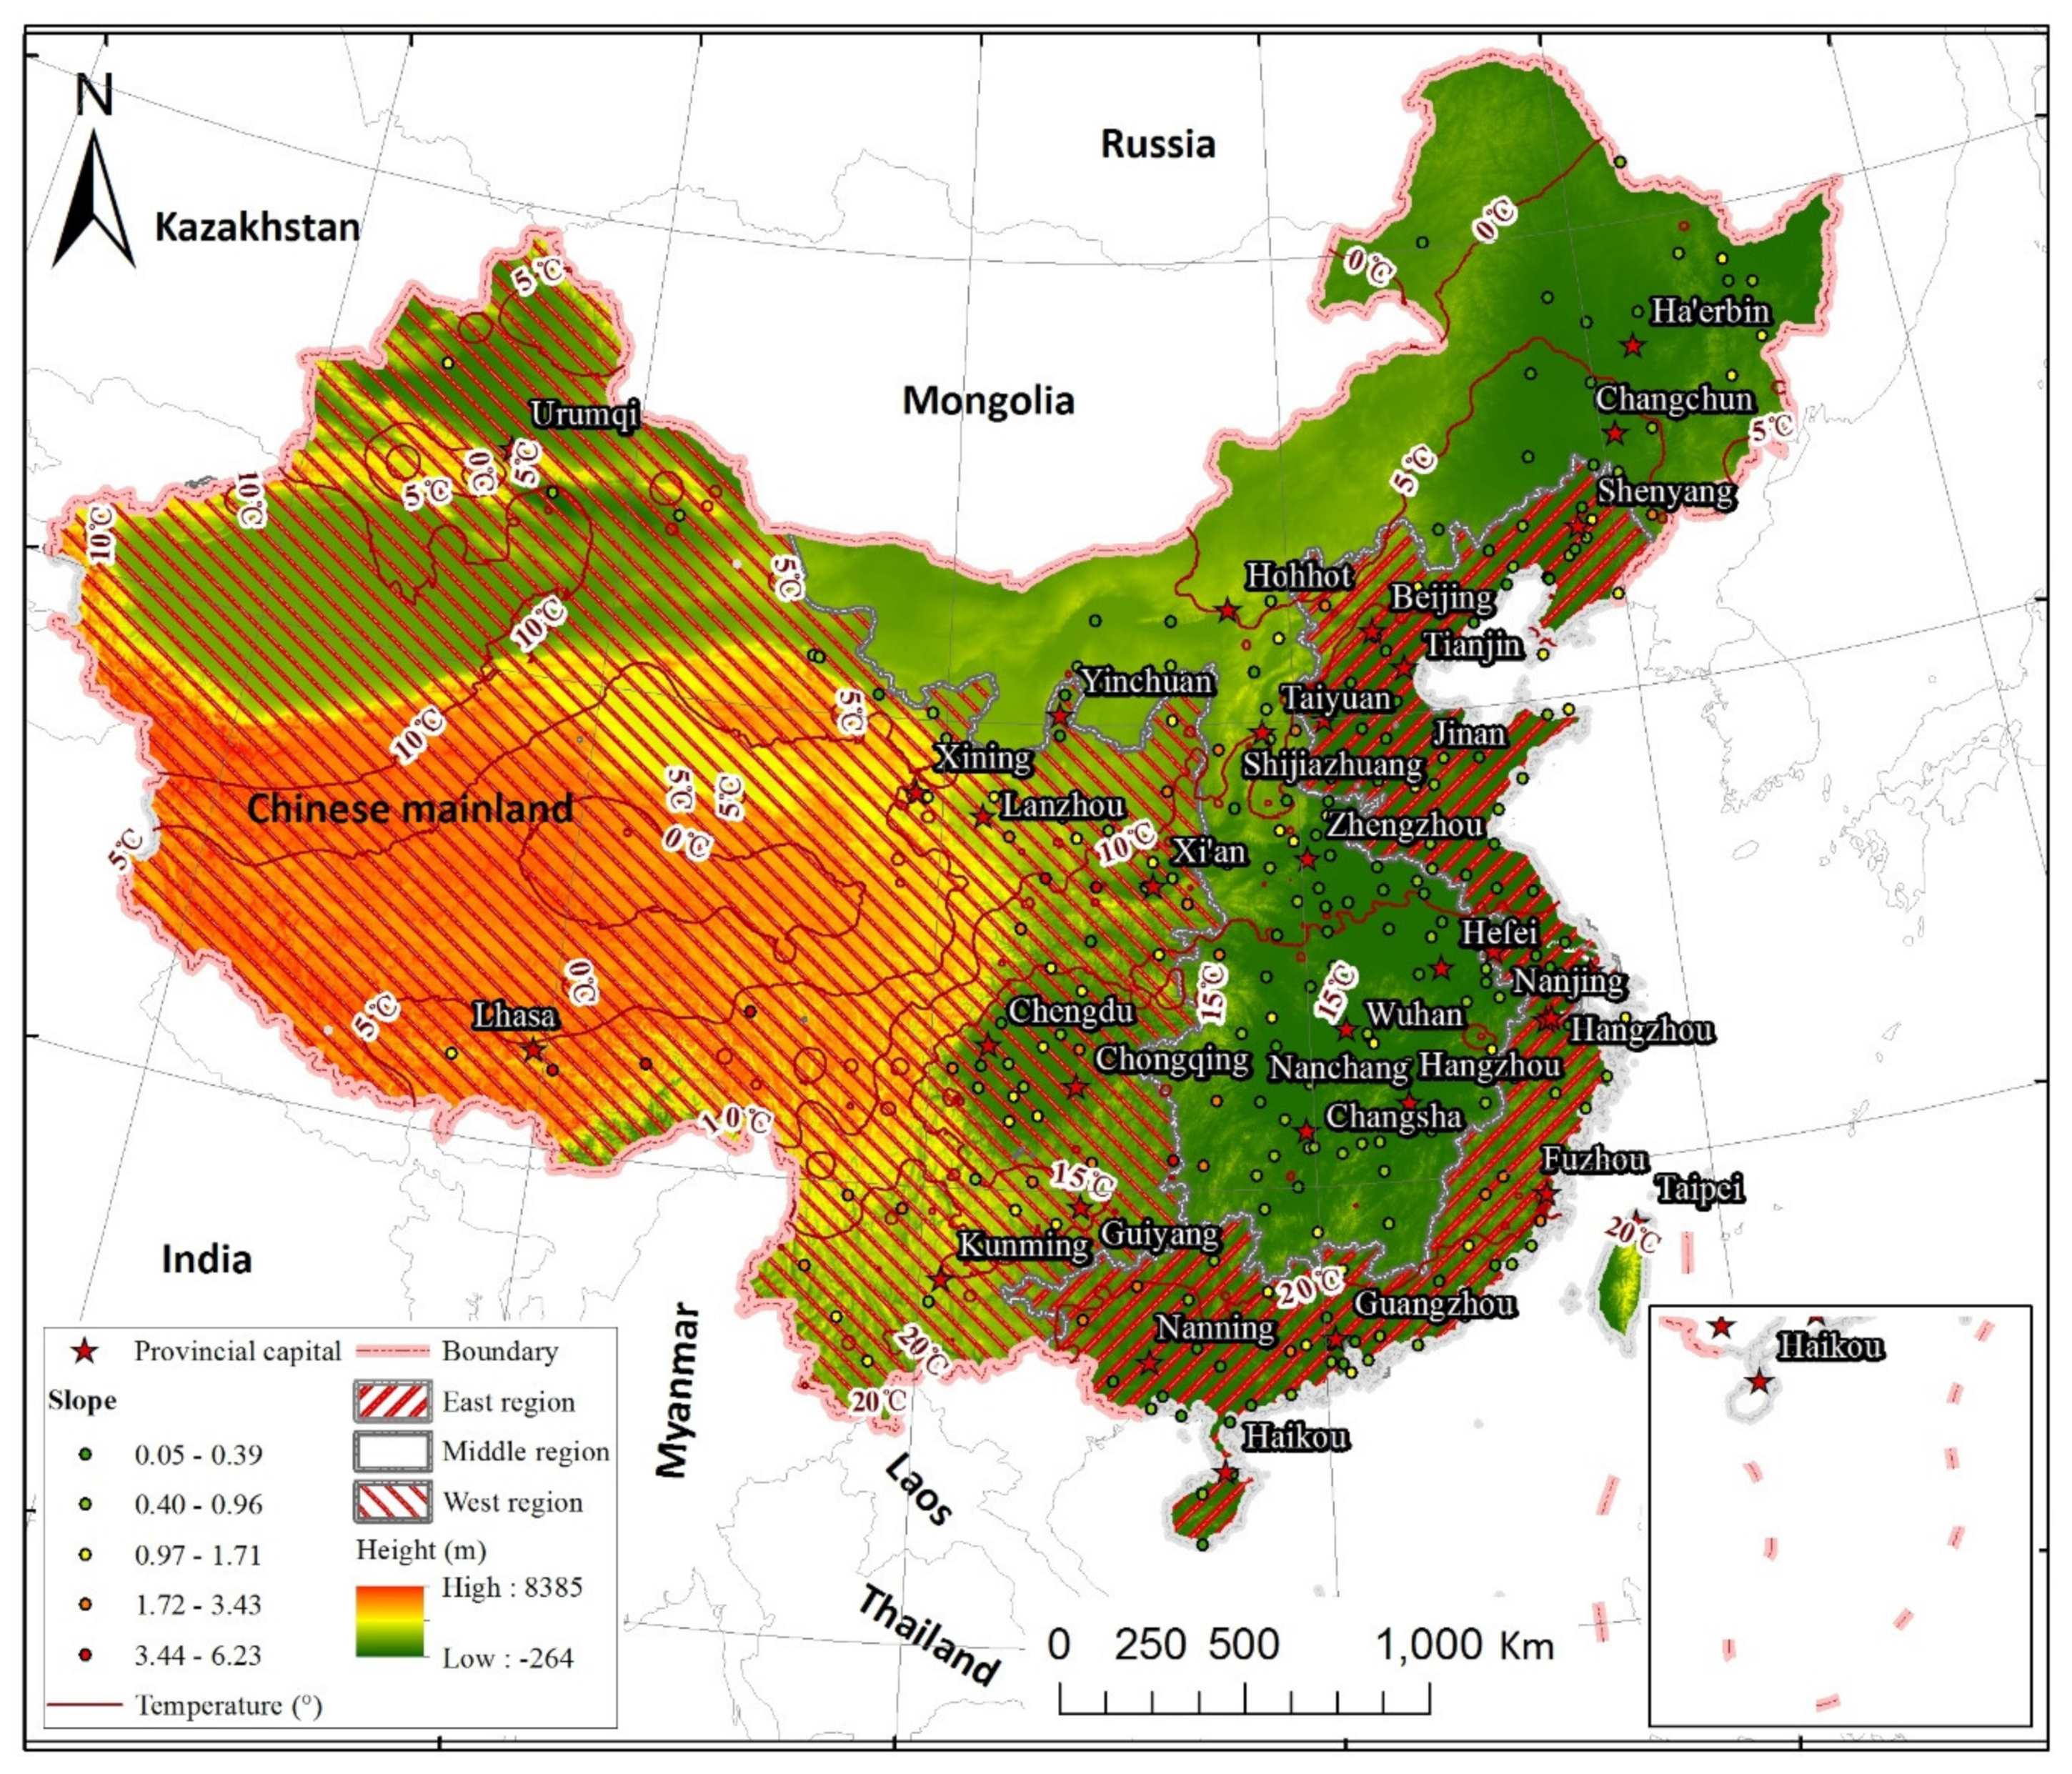
| Terrain | Elevation | Elev (m) | Computer Network Information Center of Chinese Academy of Sciences (www.gscloud.cn, accessed on 5 June 2020) | Terrain is one of the key factors for land use/cover, generally represented by elevation and slope [19,39]. Elevation and slope were measured from ASTER GDEM. | |
| Slope | Slope (°) | ||||
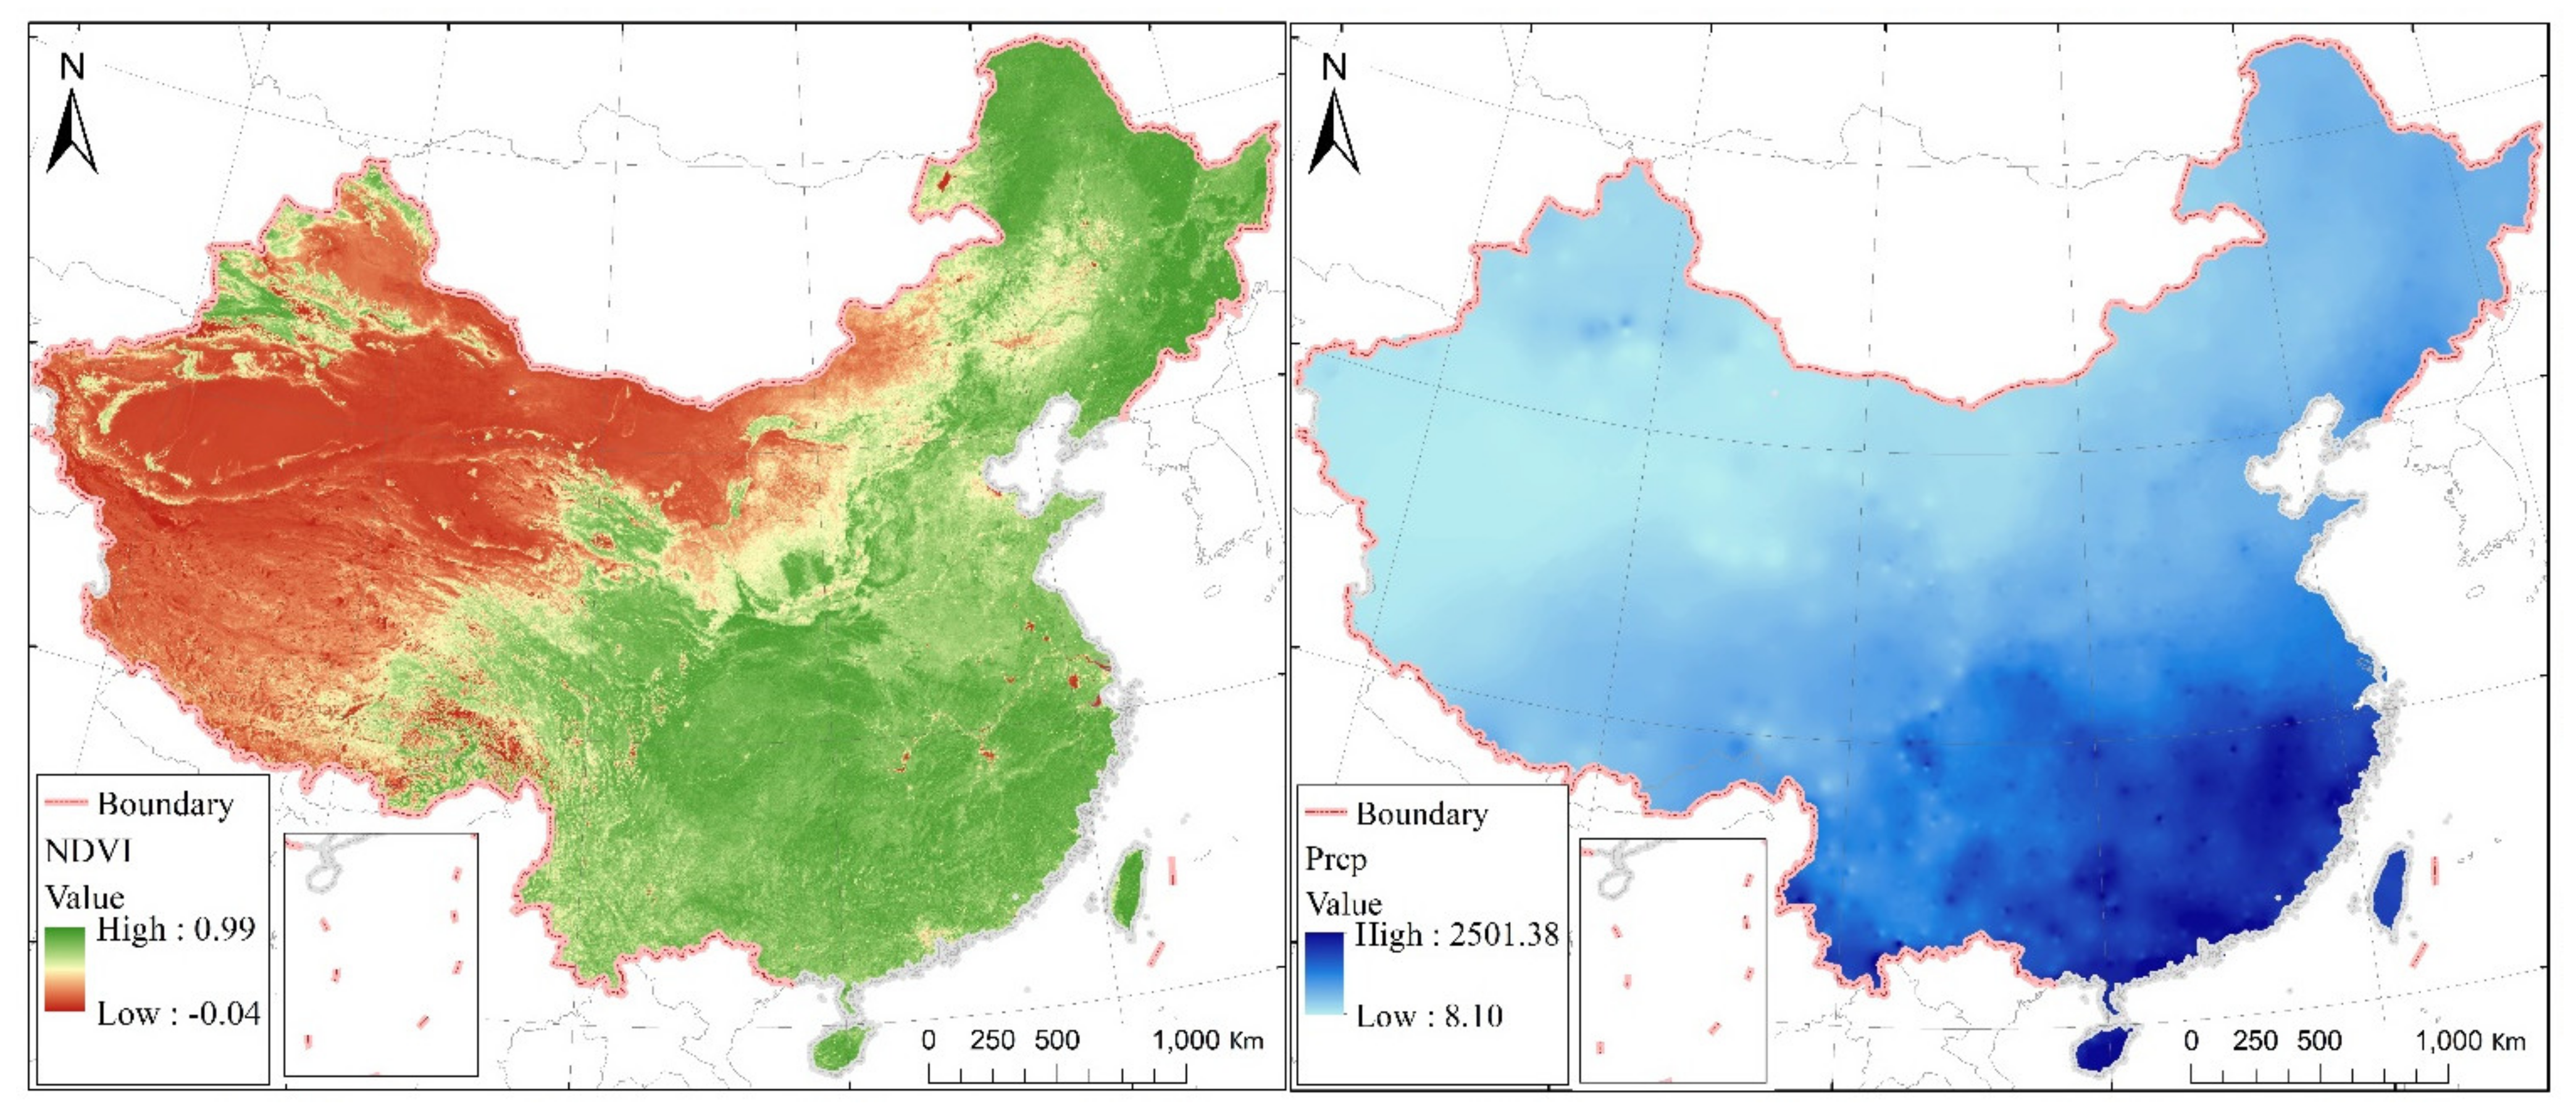
| Vegetation | Normalized differential vegetation index | NDVI (-) | The total photosynthesis and productivity of vegetation can be measured by MODIS NDVI data [19,40]. | ||
| Climate | Temperature | Temp (°C) | China Meteorological Data Service Center (http://data.cma.gov.cn, accessed on 5 June 2020) | Climate, including temperature and precipitation, determines the availability of water, nutrients, and organic matter, thereby influencing land use [19,41]. | |
| Precipitation | Prcp (mm/year) | ||||
| Socioeconomic | Demography | The population of the city | PPC (10,000) | The annual China City Statistical Yearbook and the statistical yearbooks of individual provinces. | Research indicates that socioeconomic factors including demography, infrastructure, economy, educational and scientific investment, and policy play dominant roles in intensive land use. According to related research achievements and data accessibility, we selected indicators to depict the corresponding factors [6,21,39,42]. |
| The population proportion of municipal to city | PPMC (%) | ||||
| Infrastructure | Road area on land per km2 (km2) | RoadDensity | |||
| Economy | Gross regional product of the city (CNY 10,000 per capital) | GRPC | |||
| Gross regional product of municipal district/s (CNY 10,000 per capital) | GRPMD | ||||
| Proportion of secondary industry gross regional product in municipal district | GRPSIMD (%) | ||||
| Proportion of tertiary industry gross regional product downtown | GRPTIMD (%) | ||||
| Annual average labor income of downtown | IncomeMD (Yuan/per capital) | ||||
| Annual average consumption per capita of downtown | ConMD (Yuan/per capital) | ||||
| Educational and scientific investment | Proportion of education investment to the fiscal expenditure in the city | PEI (%) | |||
| Proportion of science and technology investment to the fiscal expenditure in the city | PSI (%) | ||||
| Policy | Commercial rank of the city | CRC (-) | |||
| Administrative rank of the city | ARC (-) |
| East | Middle | Elevation | Slope | DPR | NDVI | Temp | Prcp | PPC | PPMC | GRPC | |
| STGRPP | 0.199 | −0.133 | −0.095 | −0.071 | −0.06 | −0.093 | 0.169 | 0.151 | 0.134 | 0.253 | 0.617 |
| GRPMD | RoadDensity | GRPSIMD | GRPTIMD | IncomeMD | ConMD | PEI | PSI | CRC | ARC | ||
| STGRPP | 0.801 | 0.305 | 0.073 | 0.197 | 0.668 | 0.723 | −0.041 | −0.194 | −0.298 | −0.182 |
| Constant/Indicator | Regression Coefficients | Standardized Regression Coefficients (SRCs) | t-Test | p Values | Constant/Indicator | Regression Coefficients | Standardized Regression Coefficients (SRCs) | t-Test | p Values |
|---|---|---|---|---|---|---|---|---|---|
| Constant | −46630.992 | −7.775 | 0.000 | RoadDensity | −1365.251 | −0.038 | −4.793 | 0.000 | |
| GRPMD | 0.584 | 0.594 | 36.535 | 0.000 | PEI | 219.485 | 0.039 | 5.494 | 0.000 |
| Temp | 227.164 | 0.028 | 1.816 | 0.069 | DPR | −0.010 | −0.047 | −6.173 | 0.000 |
| IncomeMD | 0.407 | 0.207 | 18.119 | 0.000 | ConMD | −0.192 | −0.076 | −4.467 | 0.000 |
| PPMC | 21354.960 | 0.139 | 16.954 | 0.000 | GRPTIMD | 233.535 | 0.062 | 4.729 | 0.000 |
| PPC | 7.967 | 0.056 | 5.493 | 0.000 | Prcp | 5.599 | 0.066 | 4.634 | 0.000 |
| GRPSIMD | 390.884 | 0.120 | 10.084 | 0.000 | Middle | −4288.474 | −0.050 | −6.498 | 0.000 |
| GRPC | 0.000 | 0.085 | 7.411 | 0.000 | Elevation | −2.768 | −0.033 | −3.650 | 0.000 |
| ARC | 6351.697 | 0.093 | 9.106 | 0.000 | NDVI | −8266.692 | −0.017 | −2.301 | 0.021 |
| CRC | −2151.133 | −0.064 | −5.421 | 0.000 |
| Region | Constant | Slope | DPR | NDVI | Temp | Prcp | PPC | PPMC | GRPC | GRPMD |
| East | −95410.74 | - | - | −57408.80 | - | 6.28 | 19.31 | 47638.10 | - | 0.69 |
| Middle | −9975.47 | −1869.99 | 0.005 | - | 820.53 | - | - | 5897.09 | 0.001 | 0.45 |
| West | −13195.66 | - | −0.01 | 18726.62 | 952.75 | - | - | −7087.55 | 0.0003 | 0.64 |
| Region | RoadDensity | GRPSIMD | GRPTIMD | IncomMD | ConMD | PEI | PSI | CRC | ARC | |
| East | −2039.94 | 800.45 | 542.32 | 0.50 | −0.37 | 360.10 | 32.54 | −2283.71 | 11790.09 | - |
| Middle | −1984.16 | 345.02 | 156.45 | 0.58 | −0.45 | - | - | 1572.71 | −6397.86 | |
| West | - | 157.07 | - | 0.14 | - | - | - | - | - | - |
| Total Cities | PPC | PPMC | GRPC | GRPMD | RoadDensity | |
| Count | 294 | 80 | 92 | 107 | 186 | 64 |
| GRPSIMD | GRPTIMD | IncomeMD | ConMD | PEI | PSI | |
| Count | 62 | 52 | 64 | 70 | 36 | 22 |
| Year | Constant | East | Elevation | Slope | DPR | NDVI | Temp | Prcp | PPC | PPMC | GRPC |
| 1990 | −1499.57 | 2.49 | −756.20 | 6078.93 | 239.67 | 0.0011 | |||||
| 1991 | 428.58 | 0.00 | 0.0016 | ||||||||
| 1992 | −629.45 | 1748.03 | 177.86 | 0.0010 | |||||||
| 1993 | 13138.37 | 2920.57 | −0.01 | 2679.63 | |||||||
| 1994 | 15843.80 | −2.89 | |||||||||
| 1995 | 4169.47 | 5.82 | 834.34 | 0.0015 | |||||||
| 1996 | 9708.27 | 454.72 | 0.0009 | ||||||||
| 1997 | 10011.39 | 542.58 | 0.0010 | ||||||||
| 1998 | 2549.56 | 560.32 | |||||||||
| 1999 | −9792.35 | 515.25 | 8.78 | 7592.67 | |||||||
| 2000 | 1819.26 | 724.96 | −4.28 | 0.0007 | |||||||
| 2001 | 14411.66 | 682.23 | 0.0006 | ||||||||
| 2002 | 8202.89 | 618.96 | 8559.83 | 0.0005 | |||||||
| 2003 | −14985.87 | 581.29 | 10764.81 | 0.0005 | |||||||
| 2004 | 30051.39 | 5081.44 | 528.61 | 11684.86 | |||||||
| 2005 | 7008.60 | 8.39 | 26102.53 | ||||||||
| 2006 | −28522.88 | 742.11 | 25538.49 | 0.0004 | |||||||
| 2007 | −8287.75 | 806.19 | 19912.20 | 0.0005 | |||||||
| 2008 | −8636.55 | 924.43 | 30402.20 | ||||||||
| 2009 | −63940.39 | 1184.72 | 46344.43 | 0.0004 | |||||||
| 2010 | −91437.88 | 1138.31 | 59239.65 | 0.0005 | |||||||
| 2011 | −108988.57 | 1247.86 | 70690.66 | 0.0004 | |||||||
| 2012 | −107270.93 | 1110.96 | 74078.47 | 0.0004 | |||||||
| 2013 | −79198.01 | 1060.56 | 60960.09 | 0.0004 | |||||||
| 2014 | −100569.46 | 1277.55 | 63866.65 | 0.0004 | |||||||
| 2015 | −73986.49 | 1506.71 | 60325.03 | 0.0003 | |||||||
| 2016 | −84569.33 | 1621.95 | 66478.85 | 0.0003 | |||||||
| 2017 | −23365.94 | −10.05 | −0.04 | 1391.64 | 57676.66 | ||||||
| Year | GRPMD | RoadDensity | GRPSIMD | GRPTIMD | IncomMD | ConMD | PEI | PSI | CRC | ARC | |
| 1990 | 0.99 | 2.59 | −1.85 | −700.13 | |||||||
| 1991 | −102.77 | 6.19 | |||||||||
| 1992 | 0.74 | 2.61 | −2.47 | −283.72 | 291.75 | −1055.30 | |||||
| 1993 | 0.57 | −3525.92 | 2.13 | −0.57 | −2386.38 | ||||||
| 1994 | 0.37 | −4507.31 | 2.21 | −2809.43 | |||||||
| 1995 | 2.54 | −3.35 | −3.44 | 197.35 | −1431.59 | ||||||
| 1996 | 0.93 | −2136.60 | −0.78 | −1623.04 | |||||||
| 1997 | 0.82 | −1409.81 | −0.63 | −1769.10 | |||||||
| 1998 | 1.49 | −2.14 | 290.96 | −2180.41 | −4382.60 | ||||||
| 1999 | 0.81 | −3027.06 | 111.06 | 0.35 | |||||||
| 2000 | 0.75 | −2201.43 | 0.25 | ||||||||
| 2001 | 1.15 | −1.34 | 213.99 | −4462.59 | |||||||
| 2002 | 1.06 | −1.22 | 307.50 | −2706.95 | |||||||
| 2003 | 0.61 | 373.88 | 283.36 | 0.54 | −1.63 | 310.50 | −3717.61 | ||||
| 2004 | 0.65 | 188.92 | −1.29 | −6250.29 | |||||||
| 2005 | 0.40 | 448.54 | 0.74 | −0.94 | 386.41 | −7262.72 | |||||
| 2006 | 0.43 | −3415.23 | 433.36 | 508.64 | −7553.40 | 10426.75 | |||||
| 2007 | 0.64 | −2539.67 | 283.31 | −0.99 | −6598.45 | 9102.71 | |||||
| 2008 | 0.46 | 489.91 | 724.32 | −5210.52 | |||||||
| 2009 | 0.46 | 245.08 | 698.34 | −4484.65 | 14269.26 | ||||||
| 2010 | 0.42 | 364.37 | 1295.16 | −5866.05 | 18975.24 | ||||||
| 2011 | 0.41 | 399.74 | 1550.52 | −5464.74 | 20463.22 | ||||||
| 2012 | 0.37 | 427.87 | 1612.10 | −6407.30 | 20611.48 | ||||||
| 2013 | 0.38 | 359.18 | 958.91 | −5871.87 | 18771.69 | ||||||
| 2014 | 0.38 | 464.40 | 1102.99 | −5182.36 | 20710.04 | ||||||
| 2015 | 0.40 | 449.54 | −5954.43 | 19446.60 | |||||||
| 2016 | 0.42 | 437.56 | −6942.81 | 22775.06 | |||||||
| 2017 | 0.60 | 1533.09 | |||||||||
| Region | Elev (m) | Slope (°) | DPR (m) | NDVI (-) | Temp (℃) | Prcp (mm/year) | PPMC (-) | GRPMD (CNY 10,000 per Capital) |
|---|---|---|---|---|---|---|---|---|
| East | 55.084 | 0.627 | 206,910.083 | 0.443 | 16.484 | 1176.945 | 0.366 | 38,675.385 |
| Middle | 244.369 | 0.623 | 172,473.227 | 0.434 | 12.534 | 911.994 | 0.334 | 26,727.740 |
| West | 1168.070 | 1.492 | 173,856.982 | 0.416 | 12.506 | 697.263 | 0.380 | 23,293.330 |
| China | 391.753 | 0.833 | 186,300.666 | 0.433 | 14.075 | 964.320 | 0.357 | 31,040.168 |
Publisher’s Note: MDPI stays neutral with regard to jurisdictional claims in published maps and institutional affiliations. |
© 2021 by the authors. Licensee MDPI, Basel, Switzerland. This article is an open access article distributed under the terms and conditions of the Creative Commons Attribution (CC BY) license (https://creativecommons.org/licenses/by/4.0/).
Share and Cite
Chen, L.; Yang, X.; Li, L.; Chen, L.; Zhang, Y. The Natural and Socioeconomic Influences on Land-Use Intensity: Evidence from China. Land 2021, 10, 1254. https://doi.org/10.3390/land10111254
Chen L, Yang X, Li L, Chen L, Zhang Y. The Natural and Socioeconomic Influences on Land-Use Intensity: Evidence from China. Land. 2021; 10(11):1254. https://doi.org/10.3390/land10111254
Chicago/Turabian StyleChen, Longgao, Xiaoyan Yang, Long Li, Longqian Chen, and Yu Zhang. 2021. "The Natural and Socioeconomic Influences on Land-Use Intensity: Evidence from China" Land 10, no. 11: 1254. https://doi.org/10.3390/land10111254
APA StyleChen, L., Yang, X., Li, L., Chen, L., & Zhang, Y. (2021). The Natural and Socioeconomic Influences on Land-Use Intensity: Evidence from China. Land, 10(11), 1254. https://doi.org/10.3390/land10111254