1. Introduction
Earth scientists and demographers have been interested in land cover and land use change (LCLUC) and its associated socio-demographic change, and urban expansion is a form of LCLUC that occurs globally [
1]. For the past three decades, global urban population has doubled [
2], while global urban areal coverage has almost tripled [
3]. Currently, over 50% of the world’s population lives in urban areas where most human economic activities occur [
2], and the global population is expected to grow until 2100 [
4]. Thus, urban environments and their associated human dynamics deserve more research attention for improving urban development in the future.
Many drivers can contribute to urban expansion, including population growth, economic growth, industrialization, and transportation development [
5]. Reilly et al. implemented a stochastic pixel-based model to estimate urban expansion from the impacts of transportation and activity accessibility and pointed out that the expense of automobile transport led to different urban expansion patterns in the San Francisco Bay area, USA, and Bangalore, India [
6]. Compared to Bangalore, automobile expenses were relatively lower in the Bay Area, and the resultant urban expansion forms are sparse over a greater geographical extent. Wu et al. applied geographically and temporally weighted regression (GTWR) to estimate urban expansion in China from 2000 to 2015 with multiple socio-economic variables and found that gross domestic product (GDP), population density, secondary industry employment, and capital investment positively contributed to urban expansion more than other variables [
7]. Li et al. applied a spatial probability model to estimate whether urban expansion would occur in China from 1990 to 2010 based on socioeconomic, physical, proximity, accessibility, and neighborhood factors [
8]. They indicated that the physical factors of a land parcel (e.g., elevation, slope) became less important when its environs were urbanized. Meta analyses were conducted to rank the drivers of expansion, and population growth was found to be the most critical driver of urban expansion globally [
1,
9].
The relationship between population and the environment is not unidirectional [
10,
11], and population growth (caused either by natural increase or net in-migration) can be a driver of and be driven by LCLUC. Population size and the size of human settlements showed a log-log relationship in Rondonia, Brazil [
12]. Stow et al. found that population density and its change linearly impacted on the areal coverage of built-up areas at the district level in southeastern Ghana [
13]. Li et al. and Wu et al. confirmed that population density is a significant driver of urban expansion in China [
7,
8]. Miyauchi et al. applied linear and quadratic regression to monitor the areal extent coverage based on population size within Japan for handling future population decline [
14]. Thus, the area of built-up land cover is a plausible demographic indicator, especially for human population size (e.g., [
12,
13]). Urban expansion is often examined for five-year (e.g., [
7,
8]) or ten-year intervals (e.g., [
13]) due to the fact that censuses often only occur with this frequency. However, these studies have failed to reveal the reciprocal processes and impacts between urban expansion and population growth. In addition, these studies used total urban area coverage as a single entity without considering that people perform activities differently for different land uses.
Urbanization is a process of more people, and a greater fraction of people, living in urban areas over time [
9,
15,
16]. The process can be decomposed into two phenomena, urban population growth and built environment expansion. Rural-to-urban and/or urban-to-urban migration are critical sources of population growth for growing cities in addition to natural increase. Clark summarized the reasons why people move, and over 50% of the moves were associated with the desire of improved housing quality, safe neighborhoods, and accessibility to public facilities (e.g., universities, schools, and subway stations) [
17]. A third of the moves resulted from life cycle changes (e.g., marriage, divorce, new or deceased household members), while the remainder of the moves stemmed from forced moving (e.g., housing eviction, wars, natural hazards) or employment change. Nevertheless, Clark pointed out that people often move due to multiple reasons and were more likely to move when they lived five miles from their workplace [
17].
Massey articulated the main reasons for why people migrate from rural to urban areas [
18]. First, wages in cities are higher than in traditional agrarian work, and neoclassical economic theory suggests that people are motivated to seek higher wages [
19]. Second, some rural households intend to maximize their profit and lower the risk of conducting traditional cultivation, as described by household-based economic theory [
20]. Third, cities need laborers to fill in the secondary sector positions for serving people who work in the primary sector based on segmented market labor theory, and unskilled, rural-to-urban migrants are attracted to fill the need for labor [
21].
LCLUC occurs in both rural and urban areas due to urbanization. Massey pointed out that rural households having members who work in urban areas often spend the remittances sent home on acquiring more land in their home communities [
18]. Newly purchased land either lies fallow or changes to cash crops to maximize profit. Antrop pointed out that new commercial and industrial activities may appear at the edge of large cities where new peripheral roads are developed for relieving traffic congestion during the process of urbanization [
22]. Bell et al. found land abandonment due to out-migration in rural areas of Latvia, suburbanization of new luxurious housing due to in-migration of retirees to the coastal areas of Spain, and suburbanization of new illegal housing units in the Lisbon Metropolitan area [
23]. However, their results were presented qualitatively with limited quantitative support for urbanization occurring at finer spatial scales, and they focused on human migration at a national scale without quantifying the impact on land use change. Li et al. and Wu et al. pointed out that urban population growth due to urban migration caused urban expansion, but they only briefly mentioned urban migration and did not quantify its magnitude [
7,
8].
Based on rural-to-urban theory, we hypothesize that the dominant relationships between population change and land use change in an urbanizing area occur as follows: (1) After new commercial and industrial establishments are built in a given place, job seekers from other places move to the vicinity of these establishments and primarily become renters of residential dwellings; (2) Increasing numbers of residents prompts the demand for housing, which leads to new residential developments in the place of work or nearby; (3) After the new residential buildings are completed, people can “officially” move into the new housing developments, which indicates that the migrants are officially recorded in a registered population system; and (4) Places in the process of urbanization will continue to densify with new small-scale businesses and transportation developments, and more migrants will move in. However, the latter types of land use change and human migration is not the focus of this study, as the goal is to determine whether or not most of the places (i.e., districts in this study) that were once undeveloped share similar temporal processes of land development and human in-migration at the beginning of development.
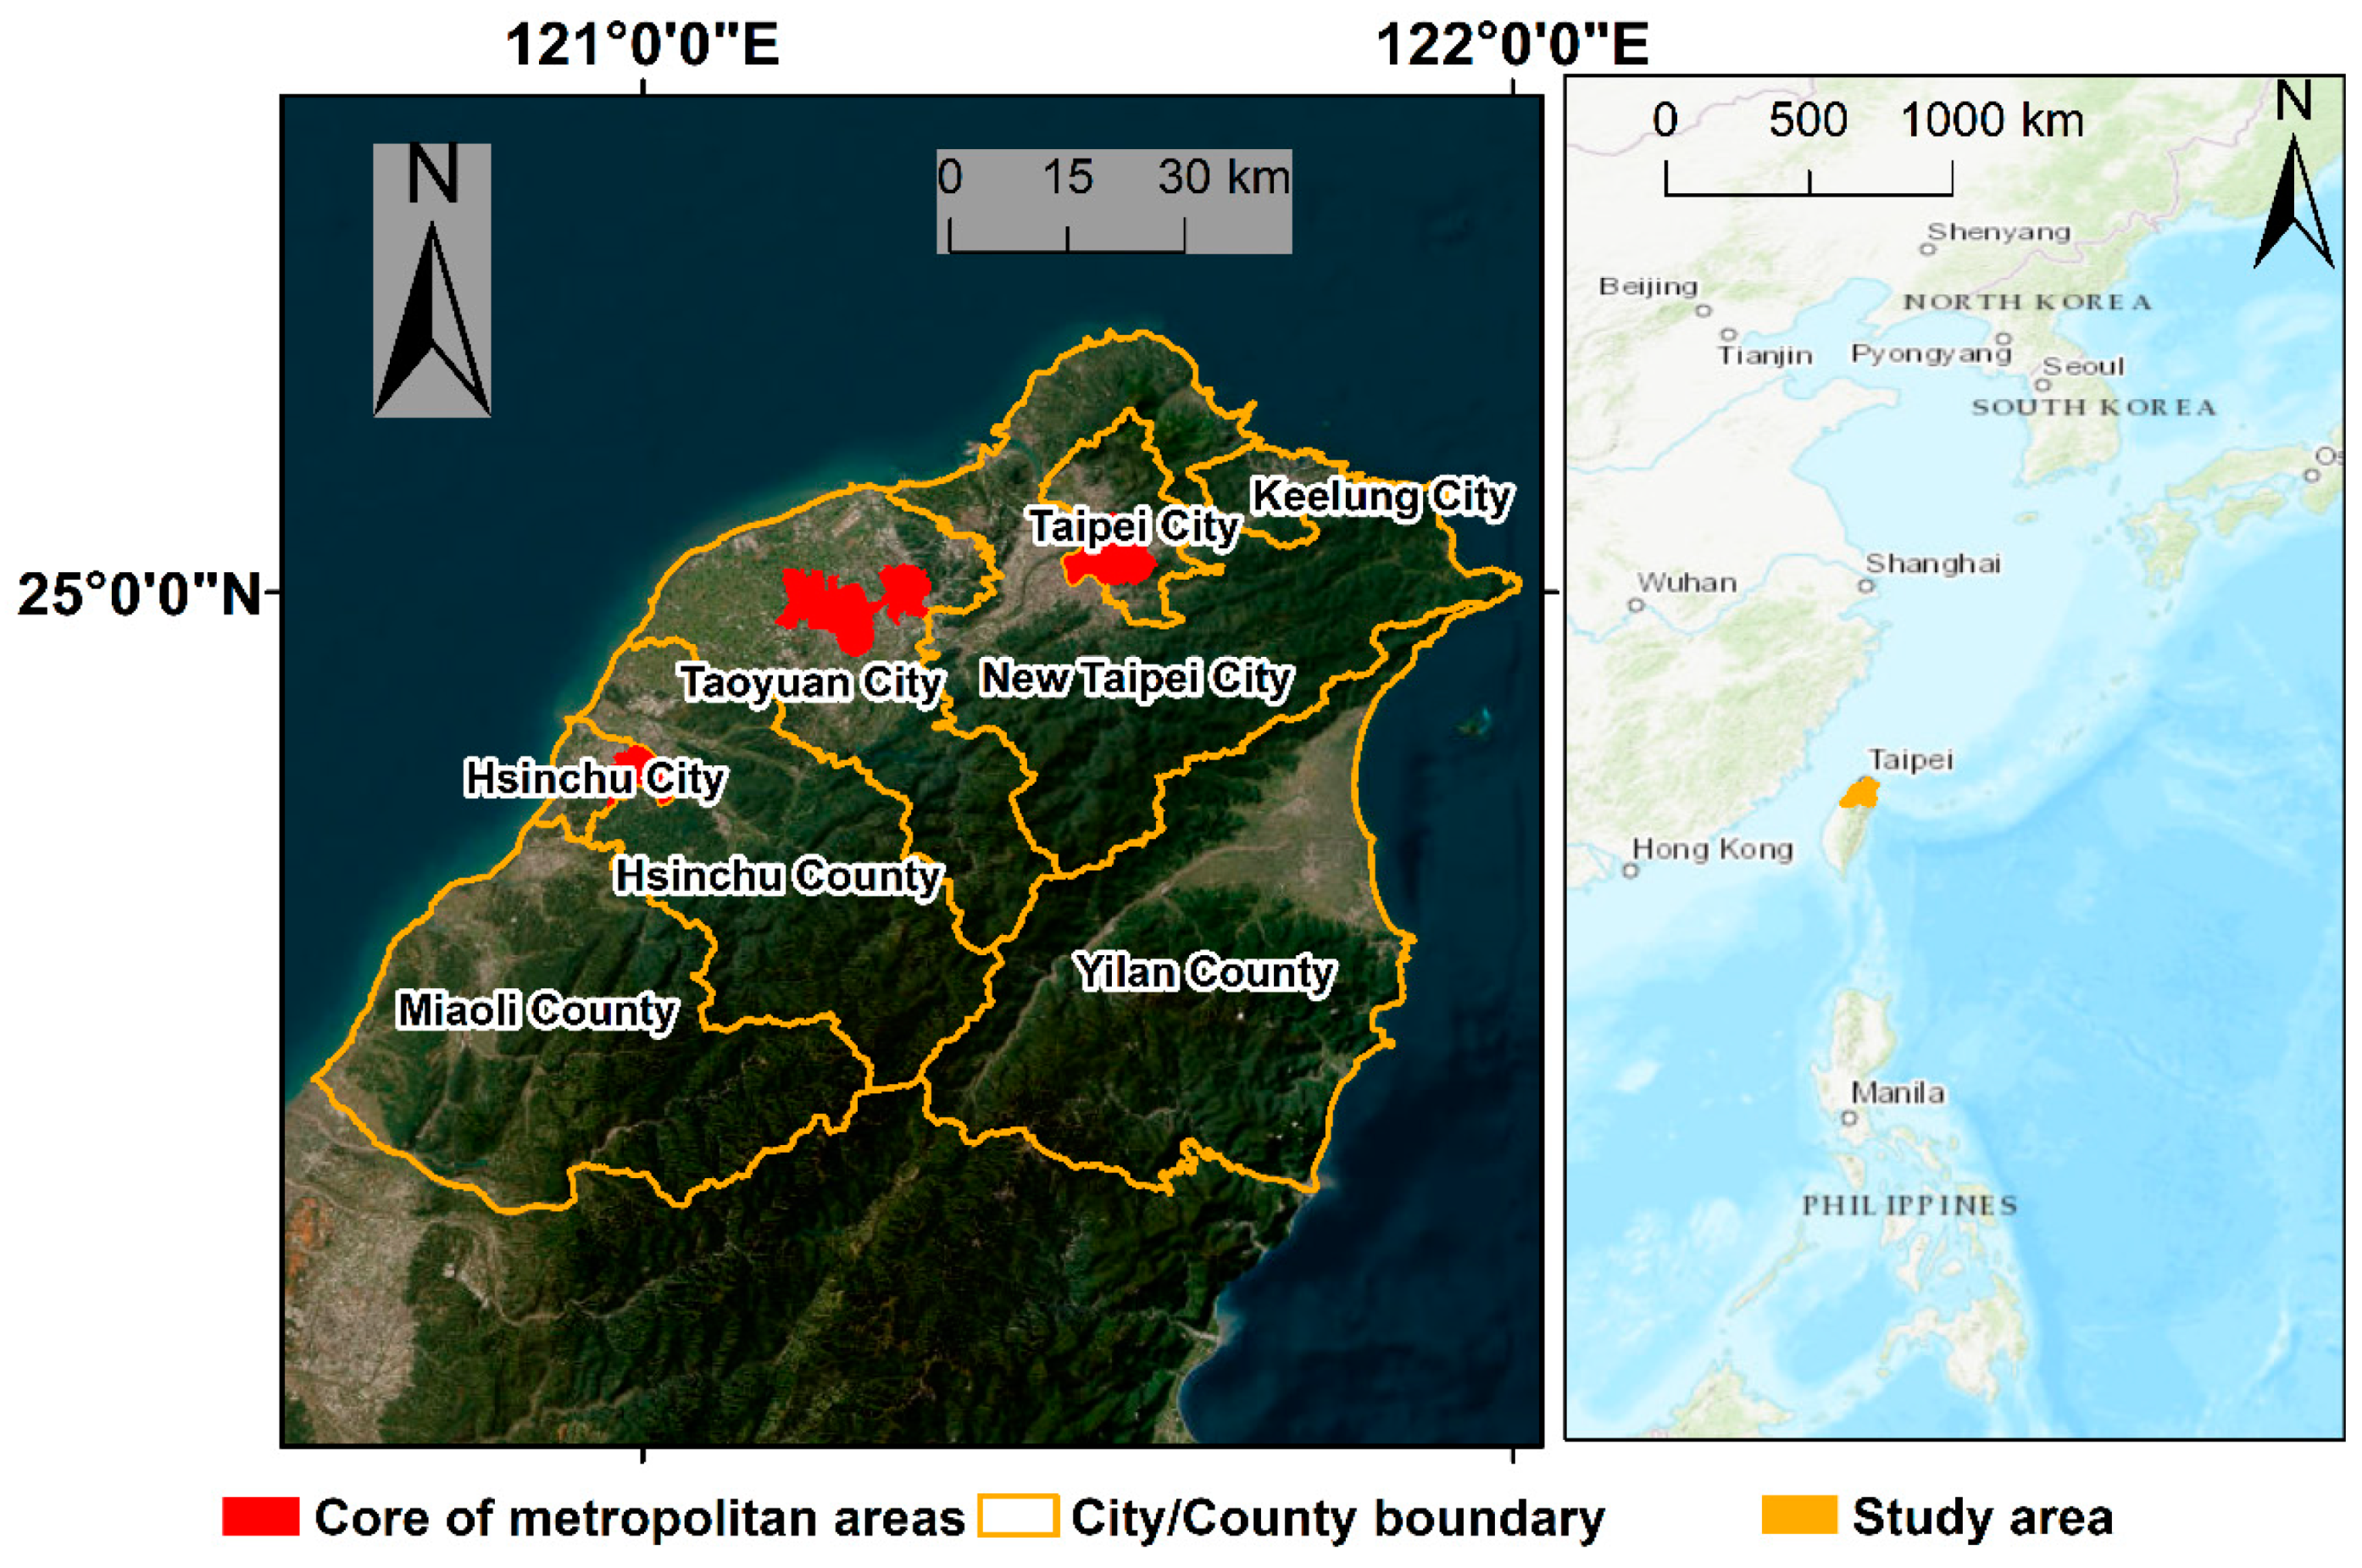
The purpose of this study is to explore the relationship and the relative timing between population change and land use change based on a case study of northern Taiwan from 1990 to 2015. This is the first study to explore and identify the relative timing between LCLUC and population migration at the annual-scale by leveraging data completeness for the study area. First, the general relationship between population, land use, and their change across space and time was tested with regression analysis. Second, the relative timing between population change and land use change was identified with lagged correlation tests. Finally, hypothetical processes of urbanization among population growth, residential, and employment land use change were validated. This study provides the first direct empirical evidence of the manner in which growth of an urban environment is associated with population growth across space and time.
3. Materials and Methods
3.1. Materials
The data we used in this study are listed in
Table 1 along with their associated spatial granularity and temporal coverage. A digital geographic information system file containing all district polygons was downloaded from a Taiwanese governmental website (
https://data.gov.tw/ accessed on 1 September 2018). In total, 368 districts represent the entire Taiwan island. Within the study area, 107 districts were extracted from the downloaded shapefile, and then islets that are too small to live on and not connected to the main island of Taiwan were manually removed. The modified GIS file representing 107 districts was used as a basis for deriving areal extent of land use.
Two main sources of data were used to represent both land use and population on an annual basis. Time series data on land use from 1990 to 2015 were derived from classification of dense time series of Landsat imagery. An efficient method of estimating areal extent of three urban land-use types (Transportation Corridor, Employment, and Residential categories) in an urbanizing region over time is to generate an urban land-use change map labelled with the date that urbanization commenced, and then conduct an overlay analysis between the urban land-use change map and an accurate land-use map for the end date of the study period. Thus, a semi-automatic approach to identifying the starting time of urban land change was developed and tested based on a dense time series of Vegetation-Impervious-Soil (V-I-S) proportion maps derived from Landsat surface reflectance imagery [
24]. Normalized spectra analysis was applied to estimate V-I-S proportion to reduce endmember variance and shadow in the densely built environment [
25]. In total, 102 independent samples were digitized and collected in no change areas to as endmembers of the NSMA model. Later, logistic regression was applied to Landsat-derived impervious fraction time series for identifying urban expansion. An independent set of urban expansion samples based on 3 by 3 pixel units were collected from Google Earth very-high-resolution imagery to assess the accuracy of identified urban expansion. The location and estimated time for newly urbanized lands were generally accurate, with 80% of urban expansion estimated within ±2.4 years.
Next, random forest (RF) classification was applied to a Landsat image from 2015 to create maps of detailed urban land use (e.g., Residential, Employment, and Transportation categories). Residential includes pure residential and mixed use; Employment land is places where people work, including commercial, industrial, public use (e.g., governmental agencies); Transportation Corridor includes roads and railways. About 2000 training and testing polygons consisting of 500,000 Landsat pixels were manually digitized from a 2016 land use map published online by Taiwanese governmental agencies. Another independent set of samples for accuracy assessment was collected based on the same land use map, which comprises 1486 no-change, stratified random samples. Multiple input features for the RF classifier were evaluated and tested in terms of the overall map accuracy, and the input features include Landsat surface reflectance, its derivative V-I-S proportion maps, spatial arrangement of V-I-S (i.e., gray level co-occurrence matrices of V-I-S), and temporal variation of V-I-S. We found that a detailed urban land use map derived from the top 10 features with the highest RF feature importance has the highest overall accuracy. Spectral reflectance of Residential is similar to the reflectance of Employment, which causes misclassification in the resultant RF classified land use map. Additionally, accurate land use mapping with Landsat imagery within such densely built environments is quite challenging. Thus, manual editing was applied to correct misclassified pixels according to the government-published land use map, and the overall accuracy of the manually-edited land use map is 83.9% [
26].
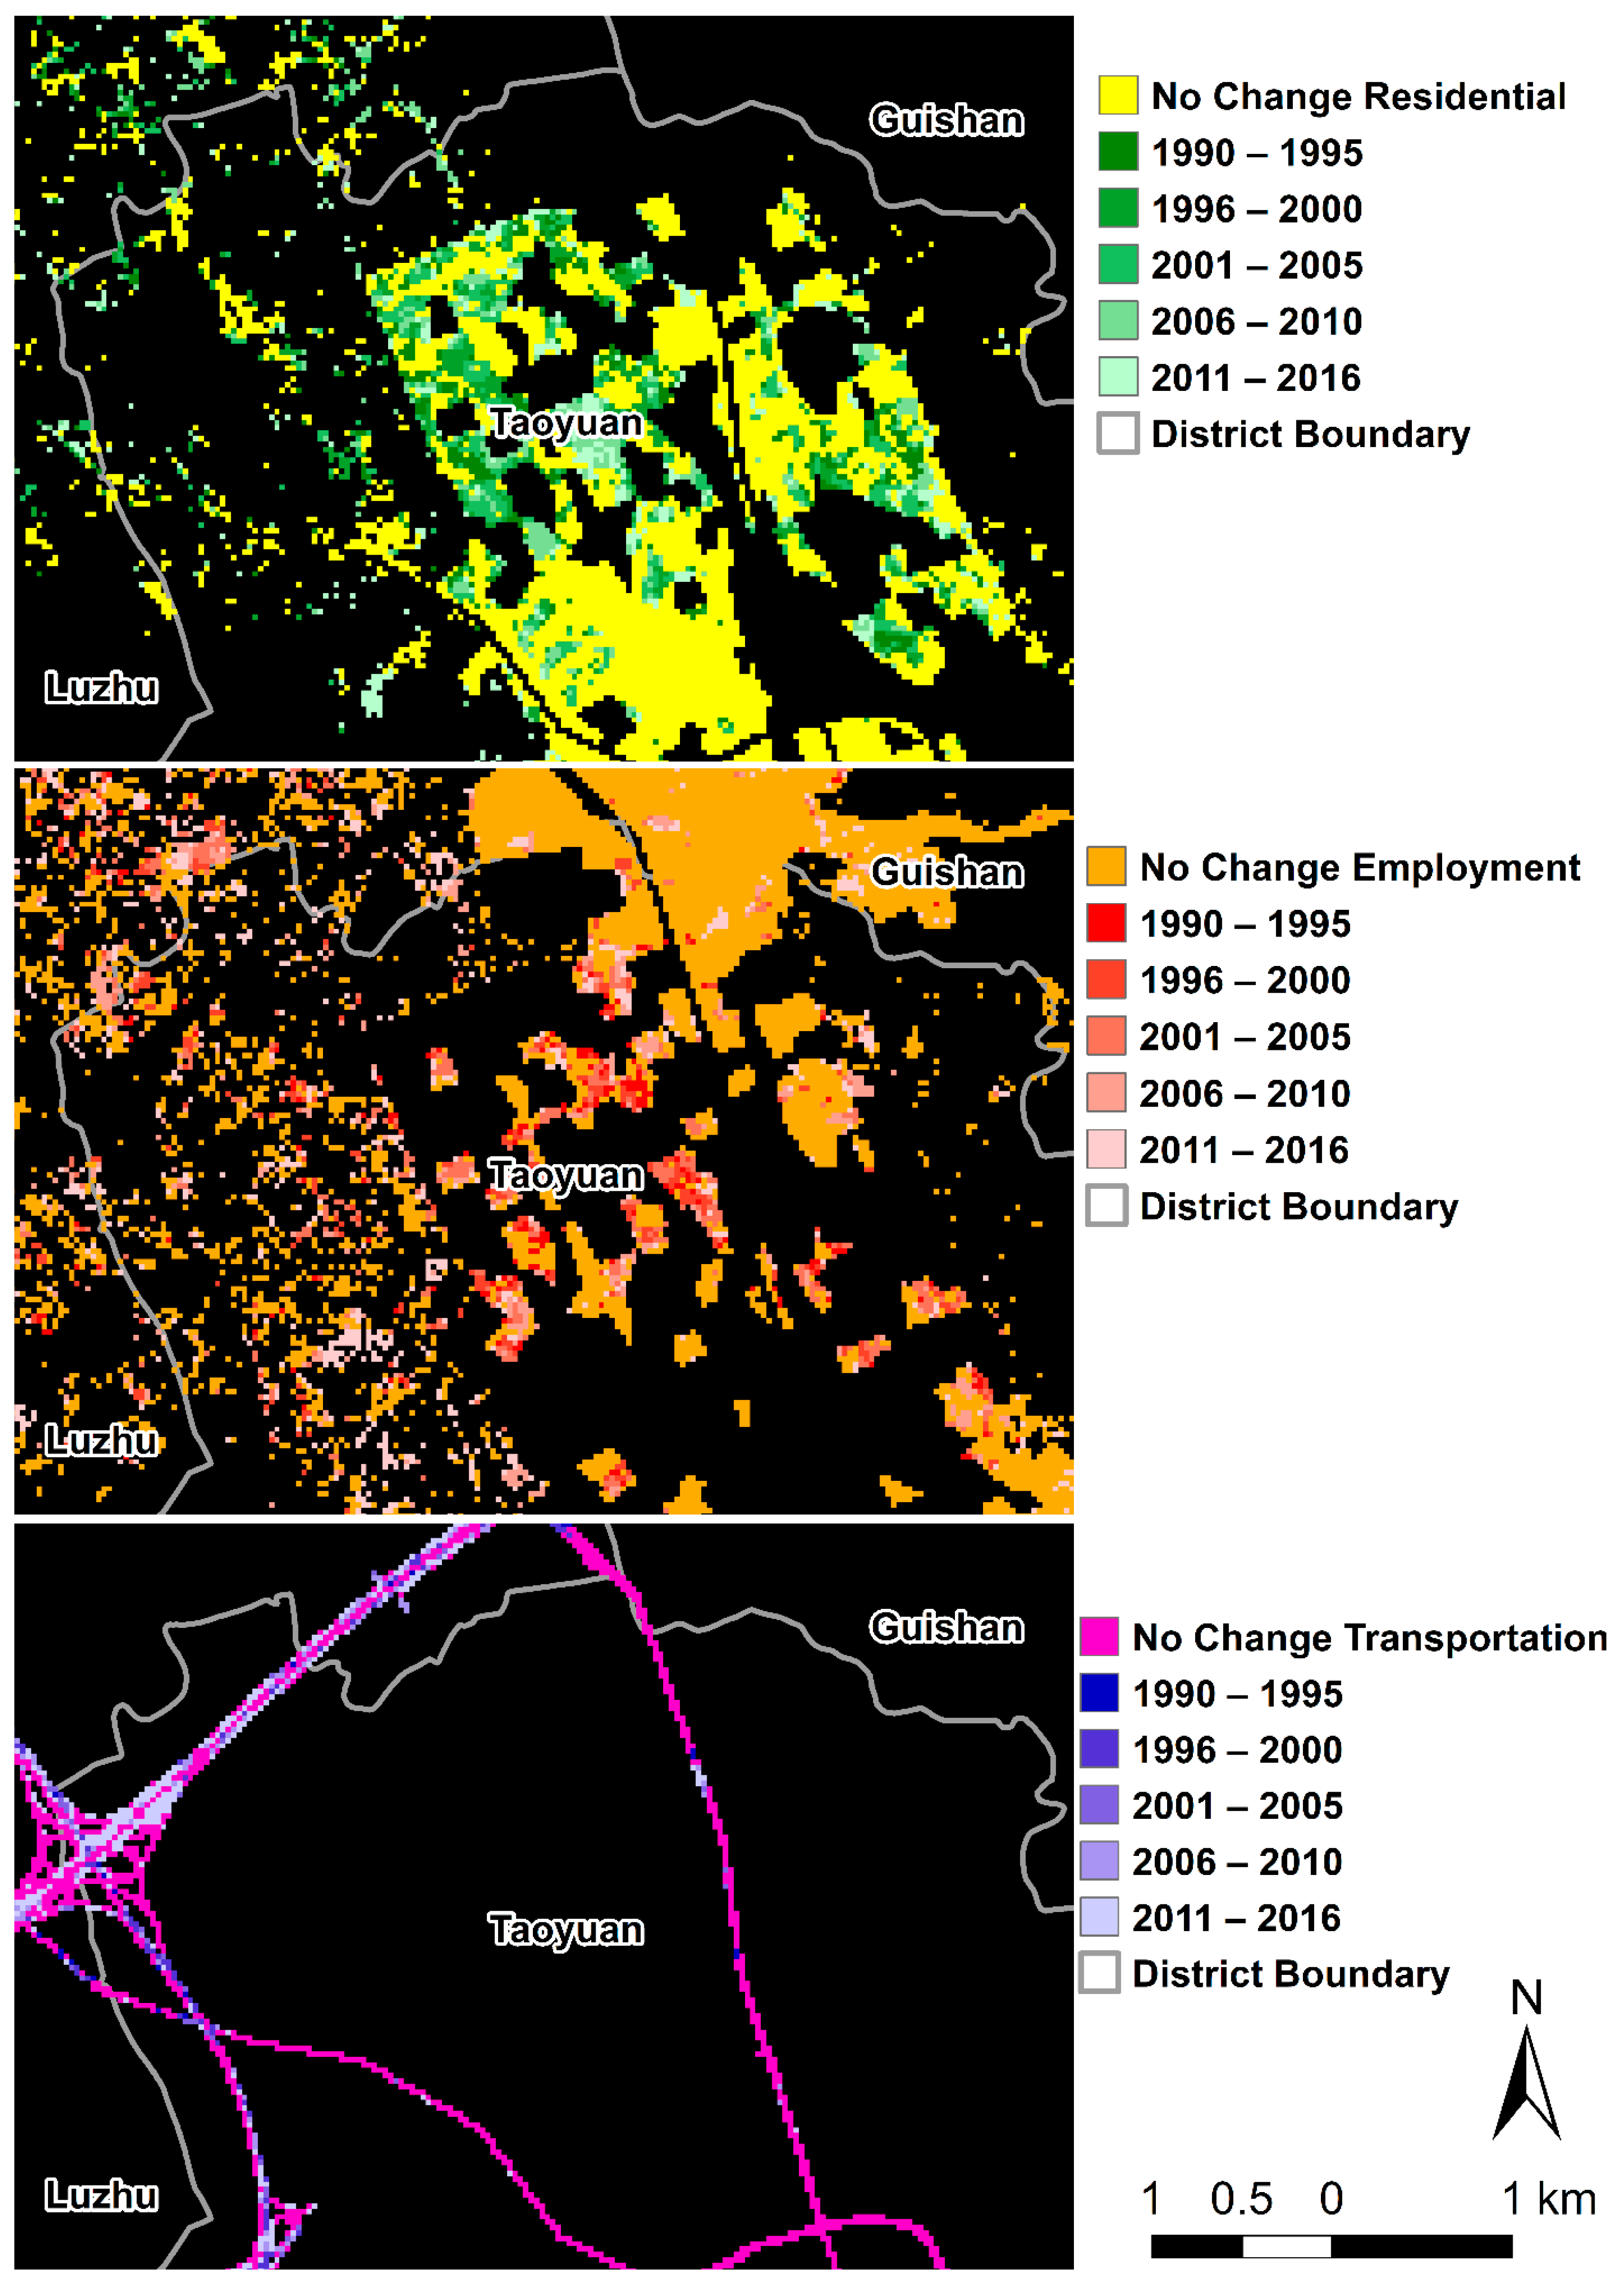
A change map was derived from the overlay analysis between the manually-edited land use map and the map of newly urbanized areas (shown in
Figure 2). An additional set of 300 urban expansion samples was collected based on the government-published land use map for assessing accuracy of urban expansion along with the 1486 no change samples. The overall accuracy of 82.7% for land-use change categories, and the user’s and producer’s accuracies are shown in
Table 2 [
26]. The areal extents of Residential, Employment, and Transportation Corridor (Transportation hereafter) land use types were summarized for each district on an annual basis.
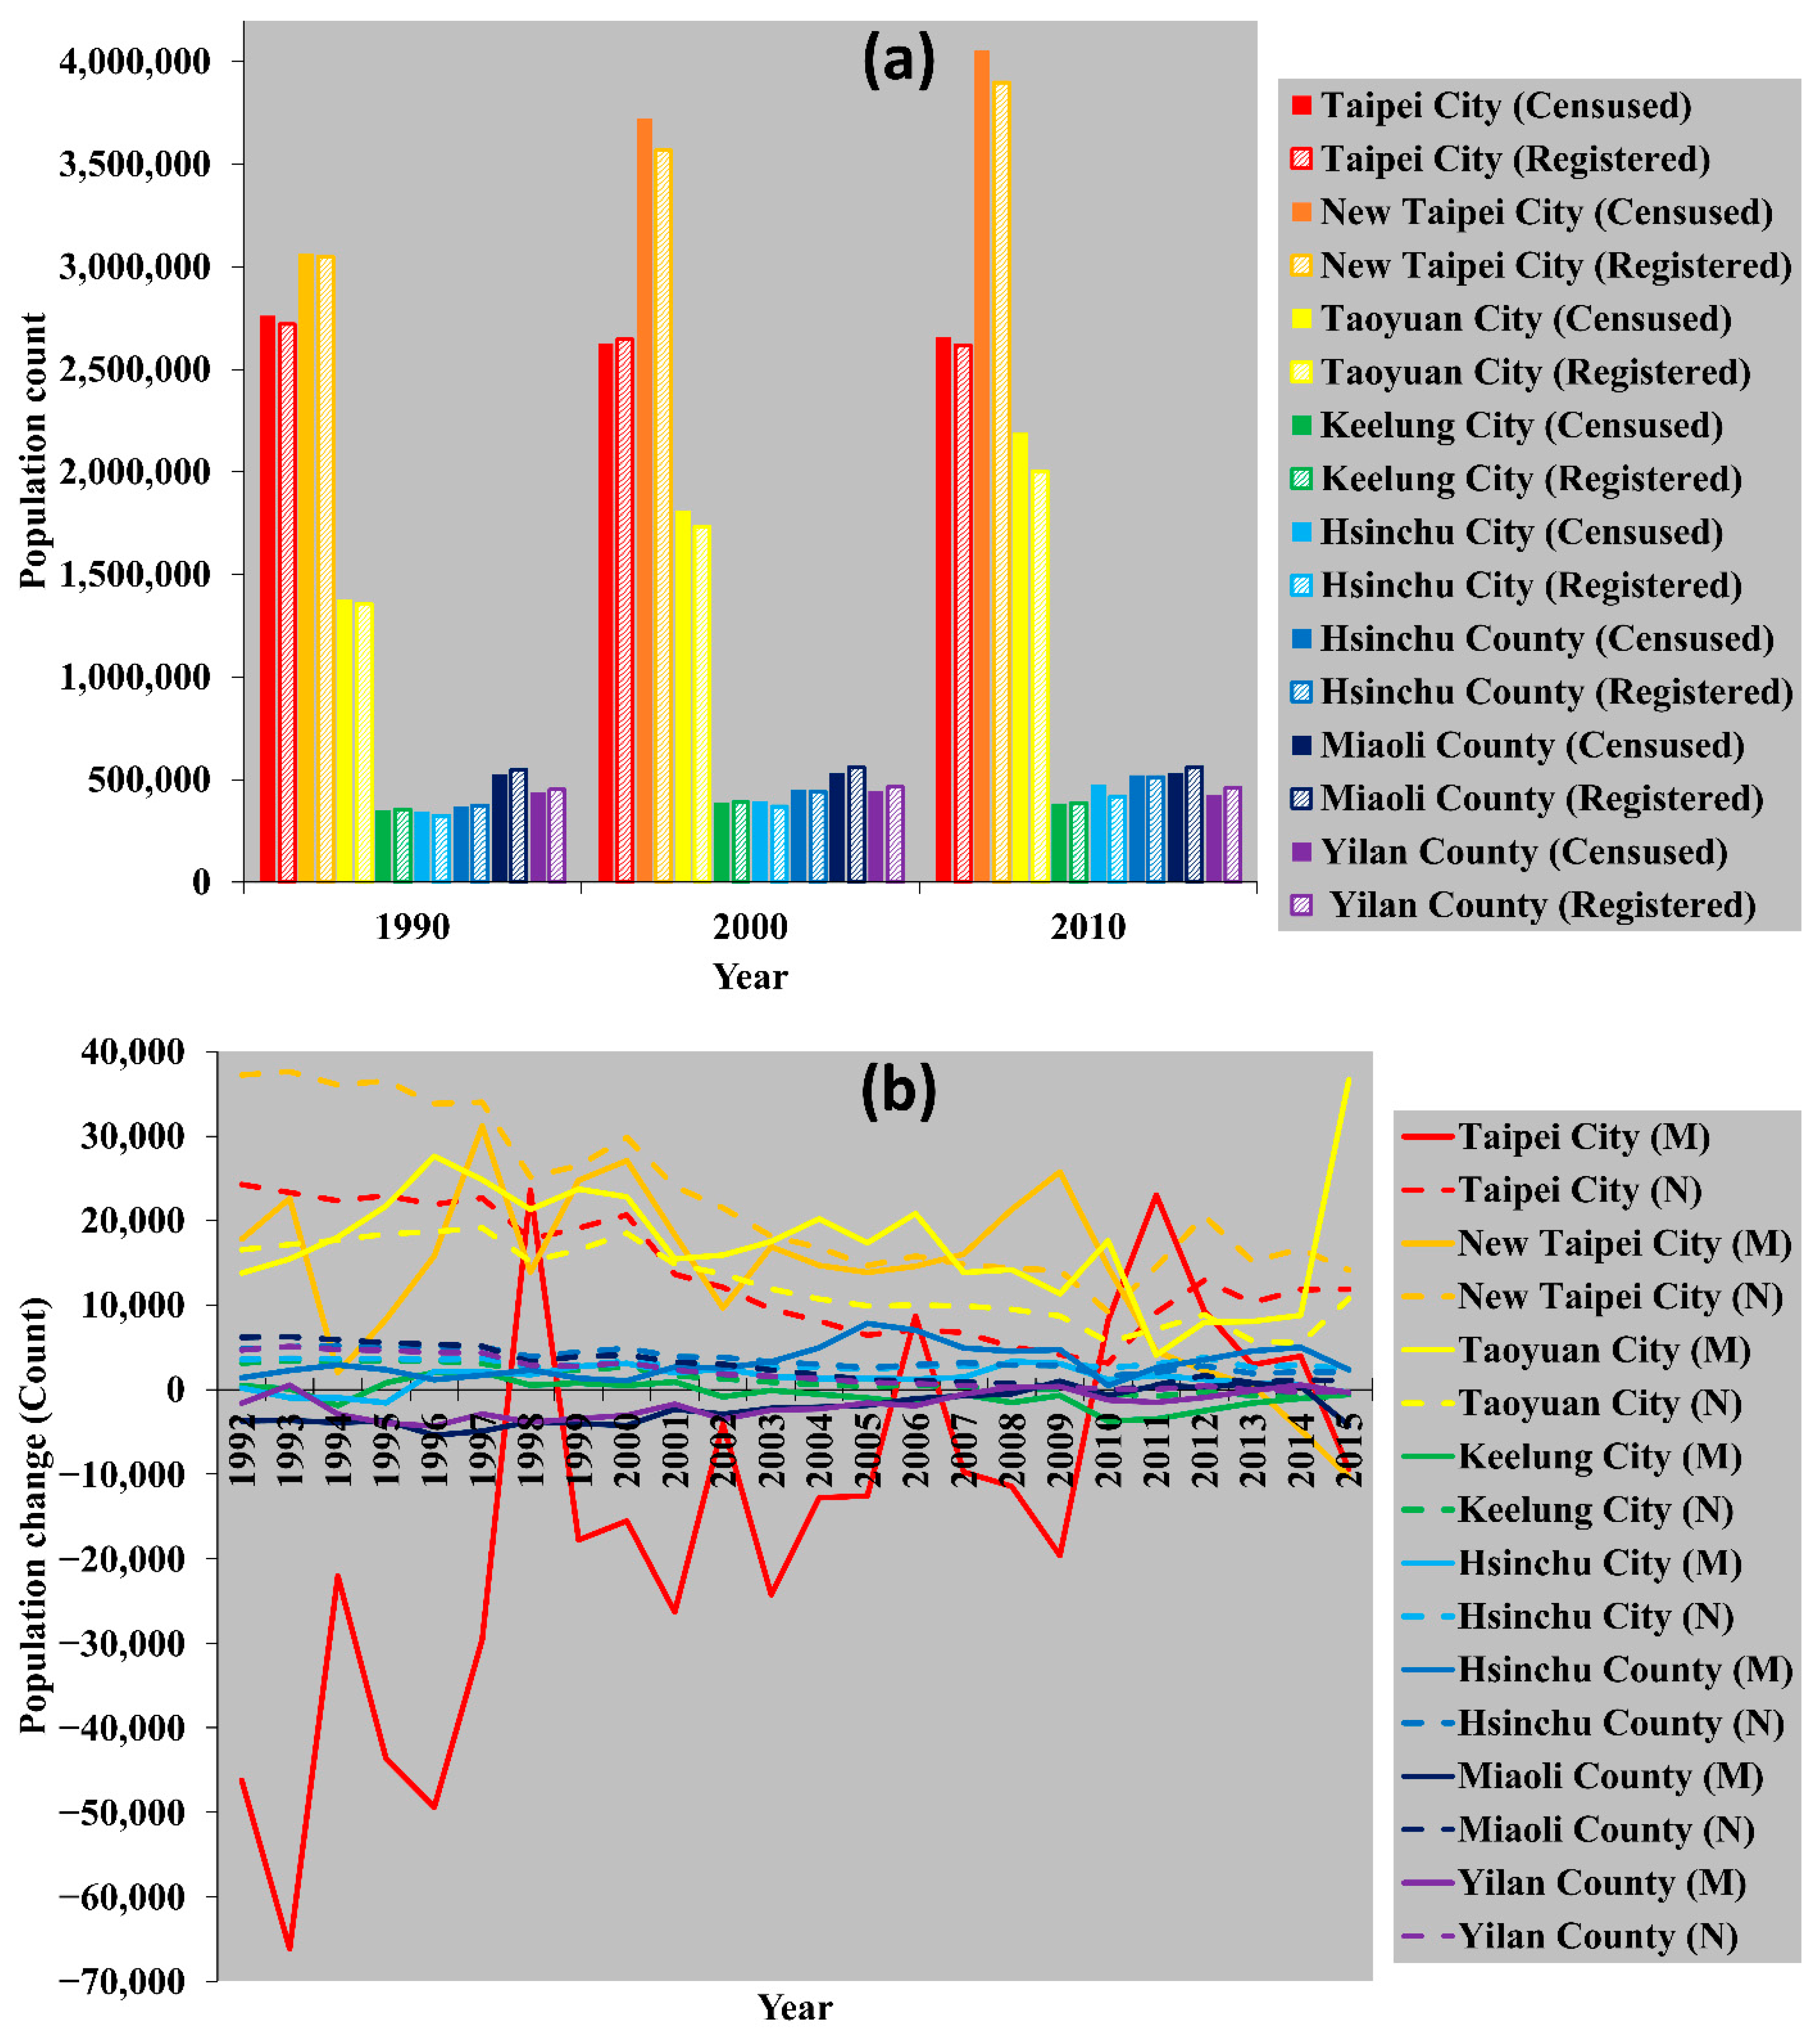
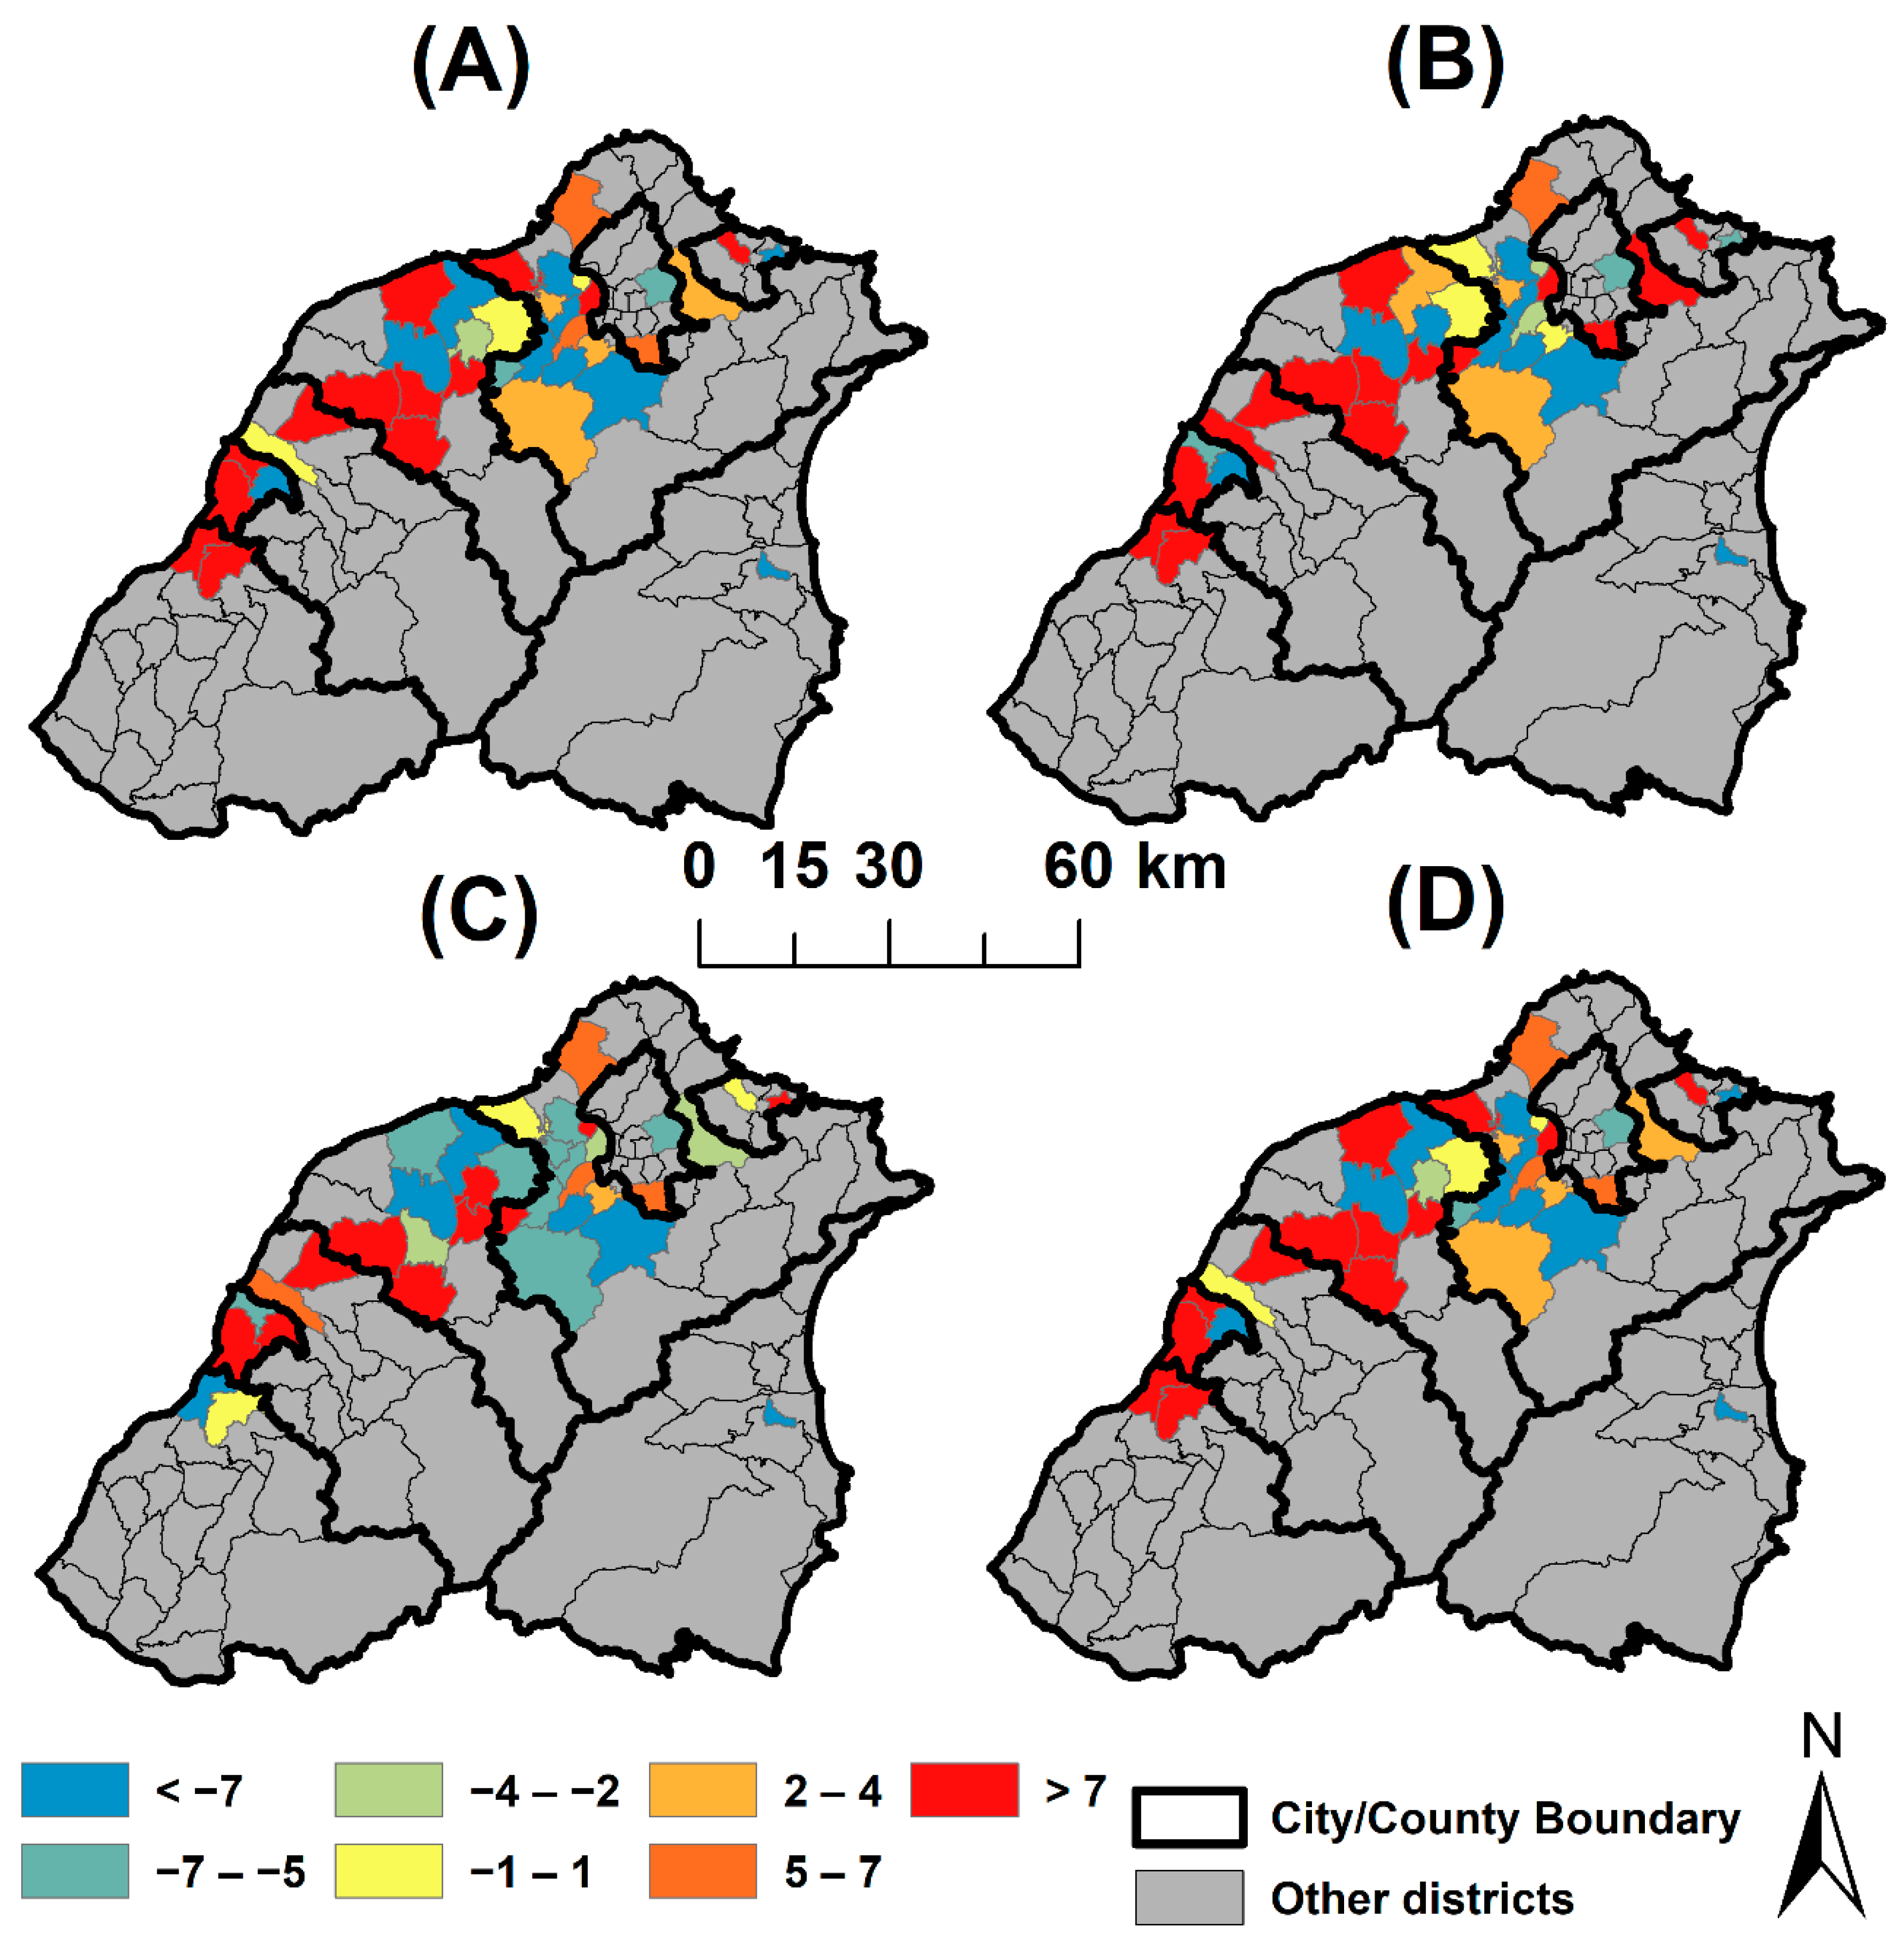
Two sources of population data were used, population registers and census data. The registered population data contain annual population counts at the district level. The registered population data were downloaded from Monthly Bulletin of Interior Statistics, Taiwan (R.O.C.). These data date back to 1981 on an annual basis, but district boundaries were readjusted in 1990. Thus, the registered population from 1991 to 2015 at the district level was used in the analysis. The numbers of natural increase and net migrants recorded by the population register system were published at the City/County level (i.e., the finest spatial level data that are available online) for 1992 to 2015, and the data were downloaded and used to analyze the sources of population growth. Three decadal censuses for 1990, 2000, and 2010 were also downloaded from the website of National Statistics. The census data are aggregated to the City/County level. Data from the registers and censuses were compared for consistency. Spatial-temporal trends of registered population at the district level were also analyzed.
3.2. Relationship between Population and Land Use
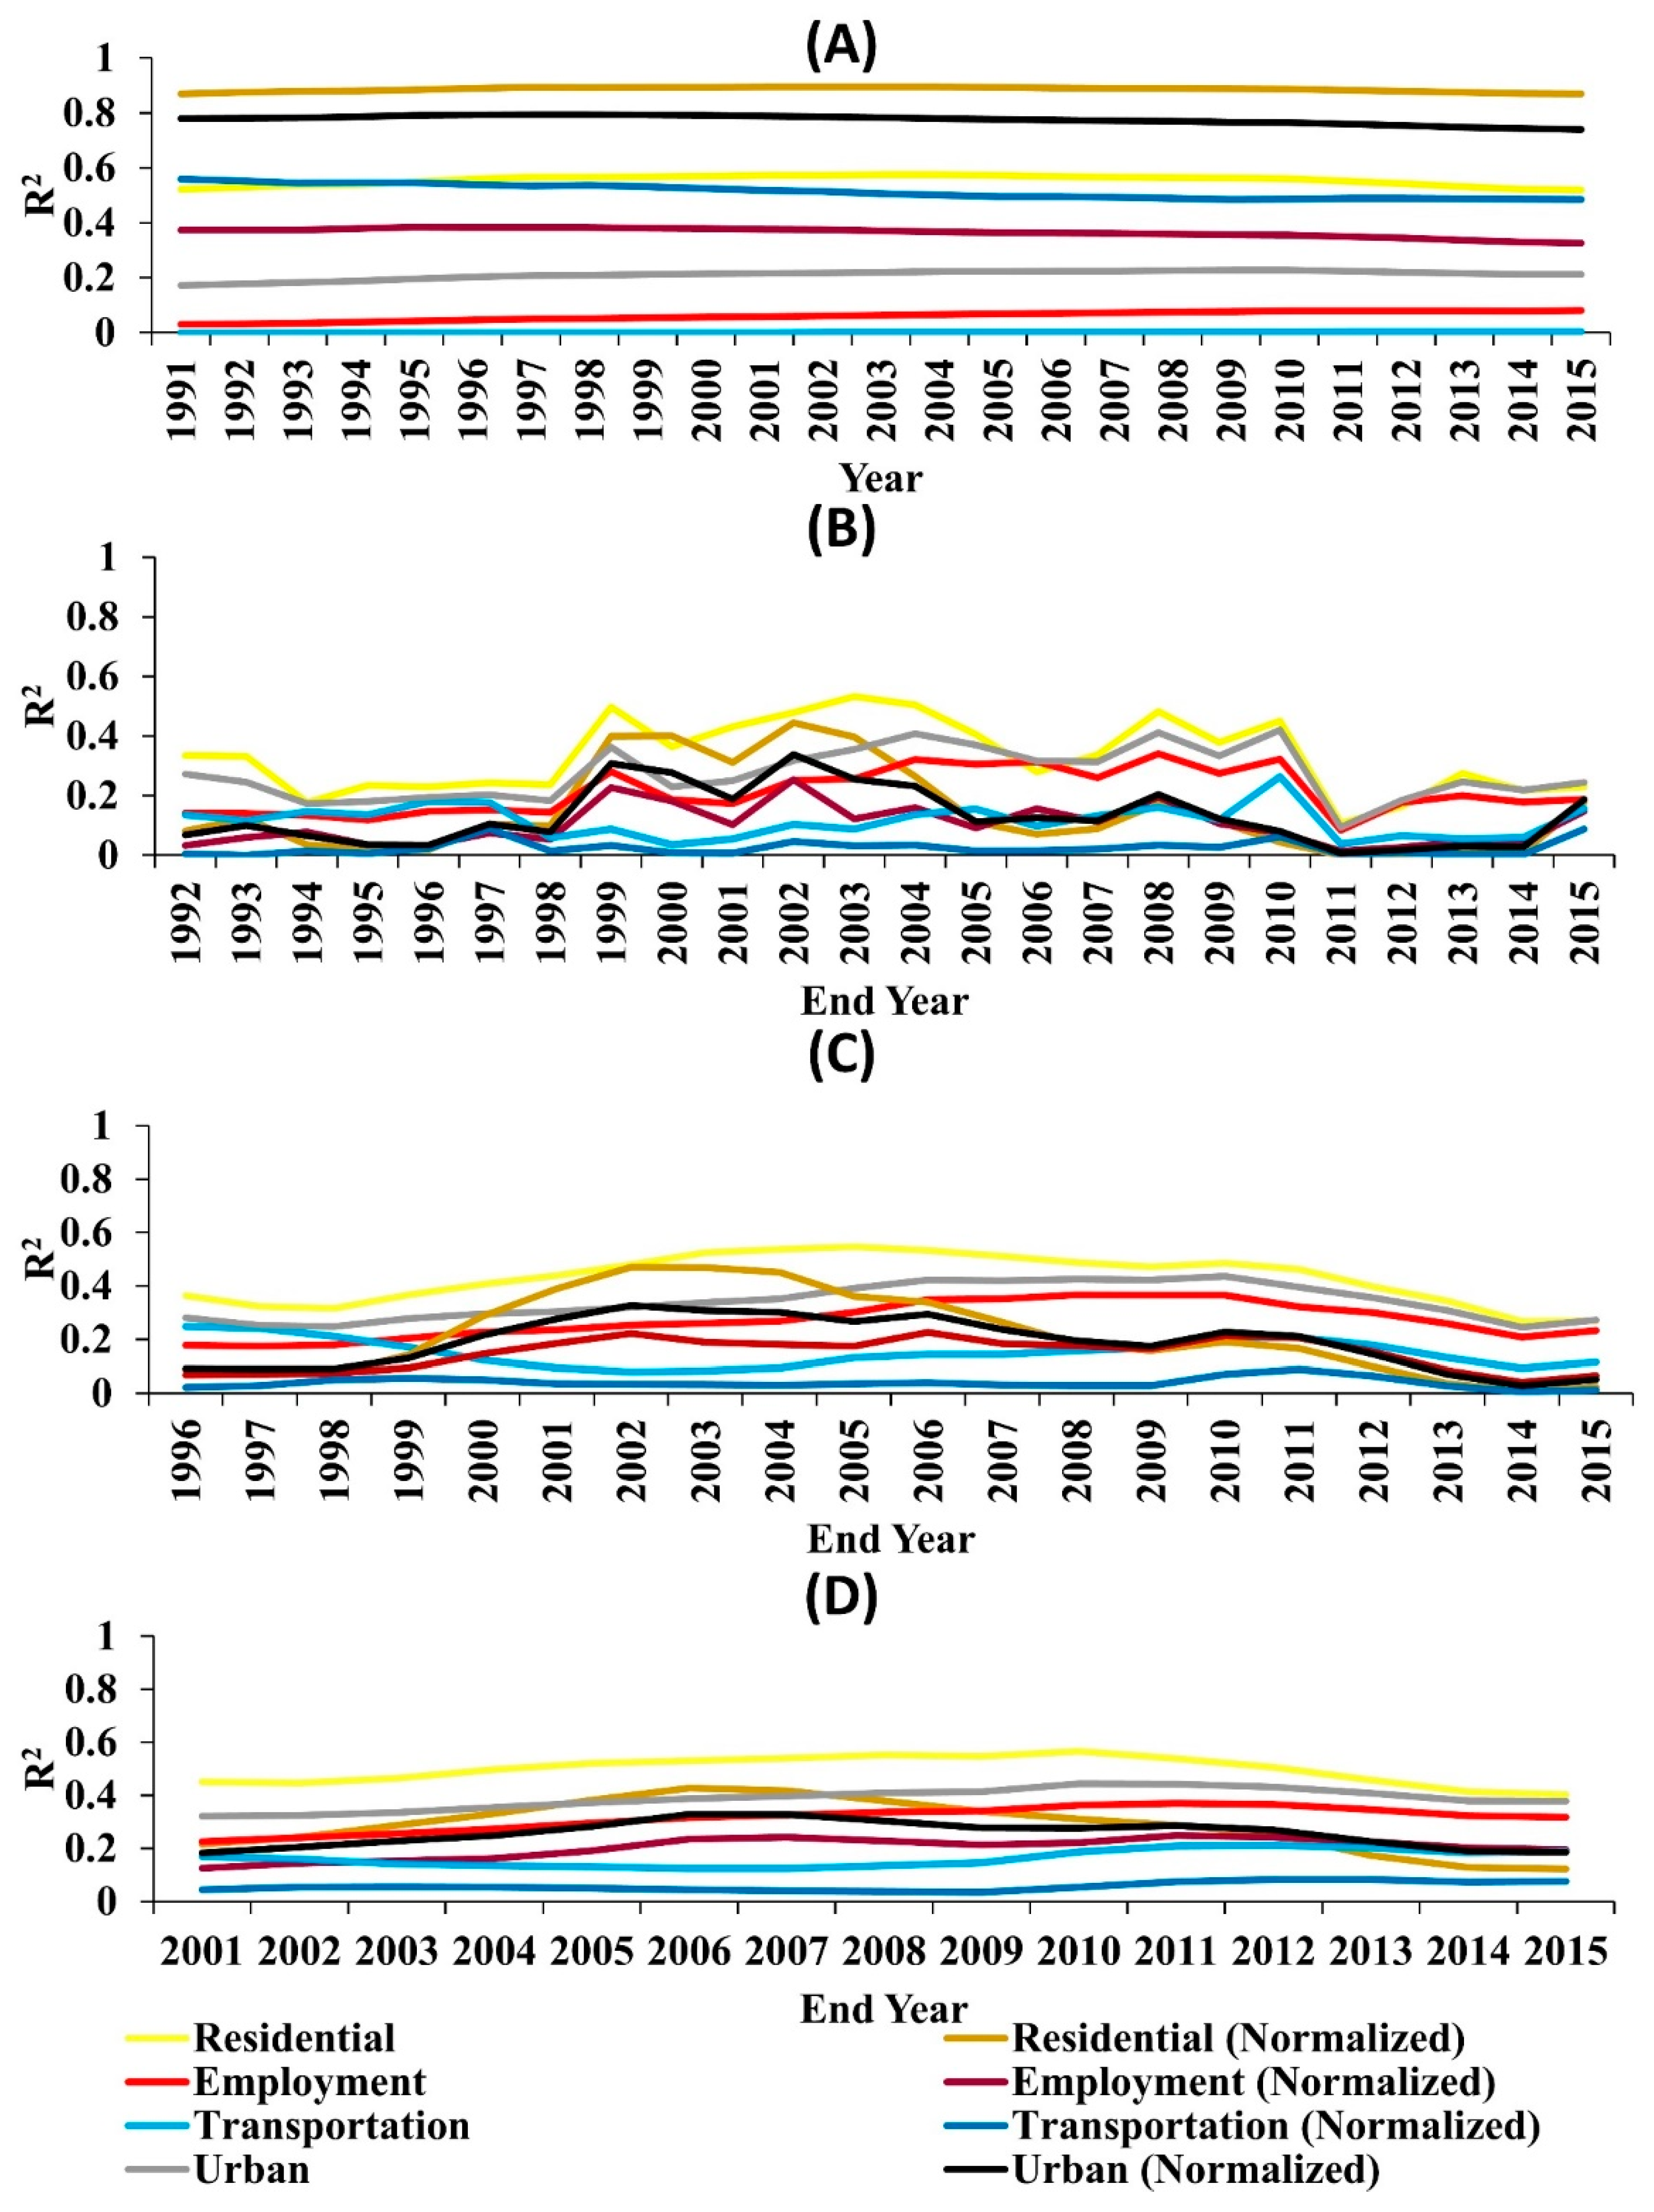
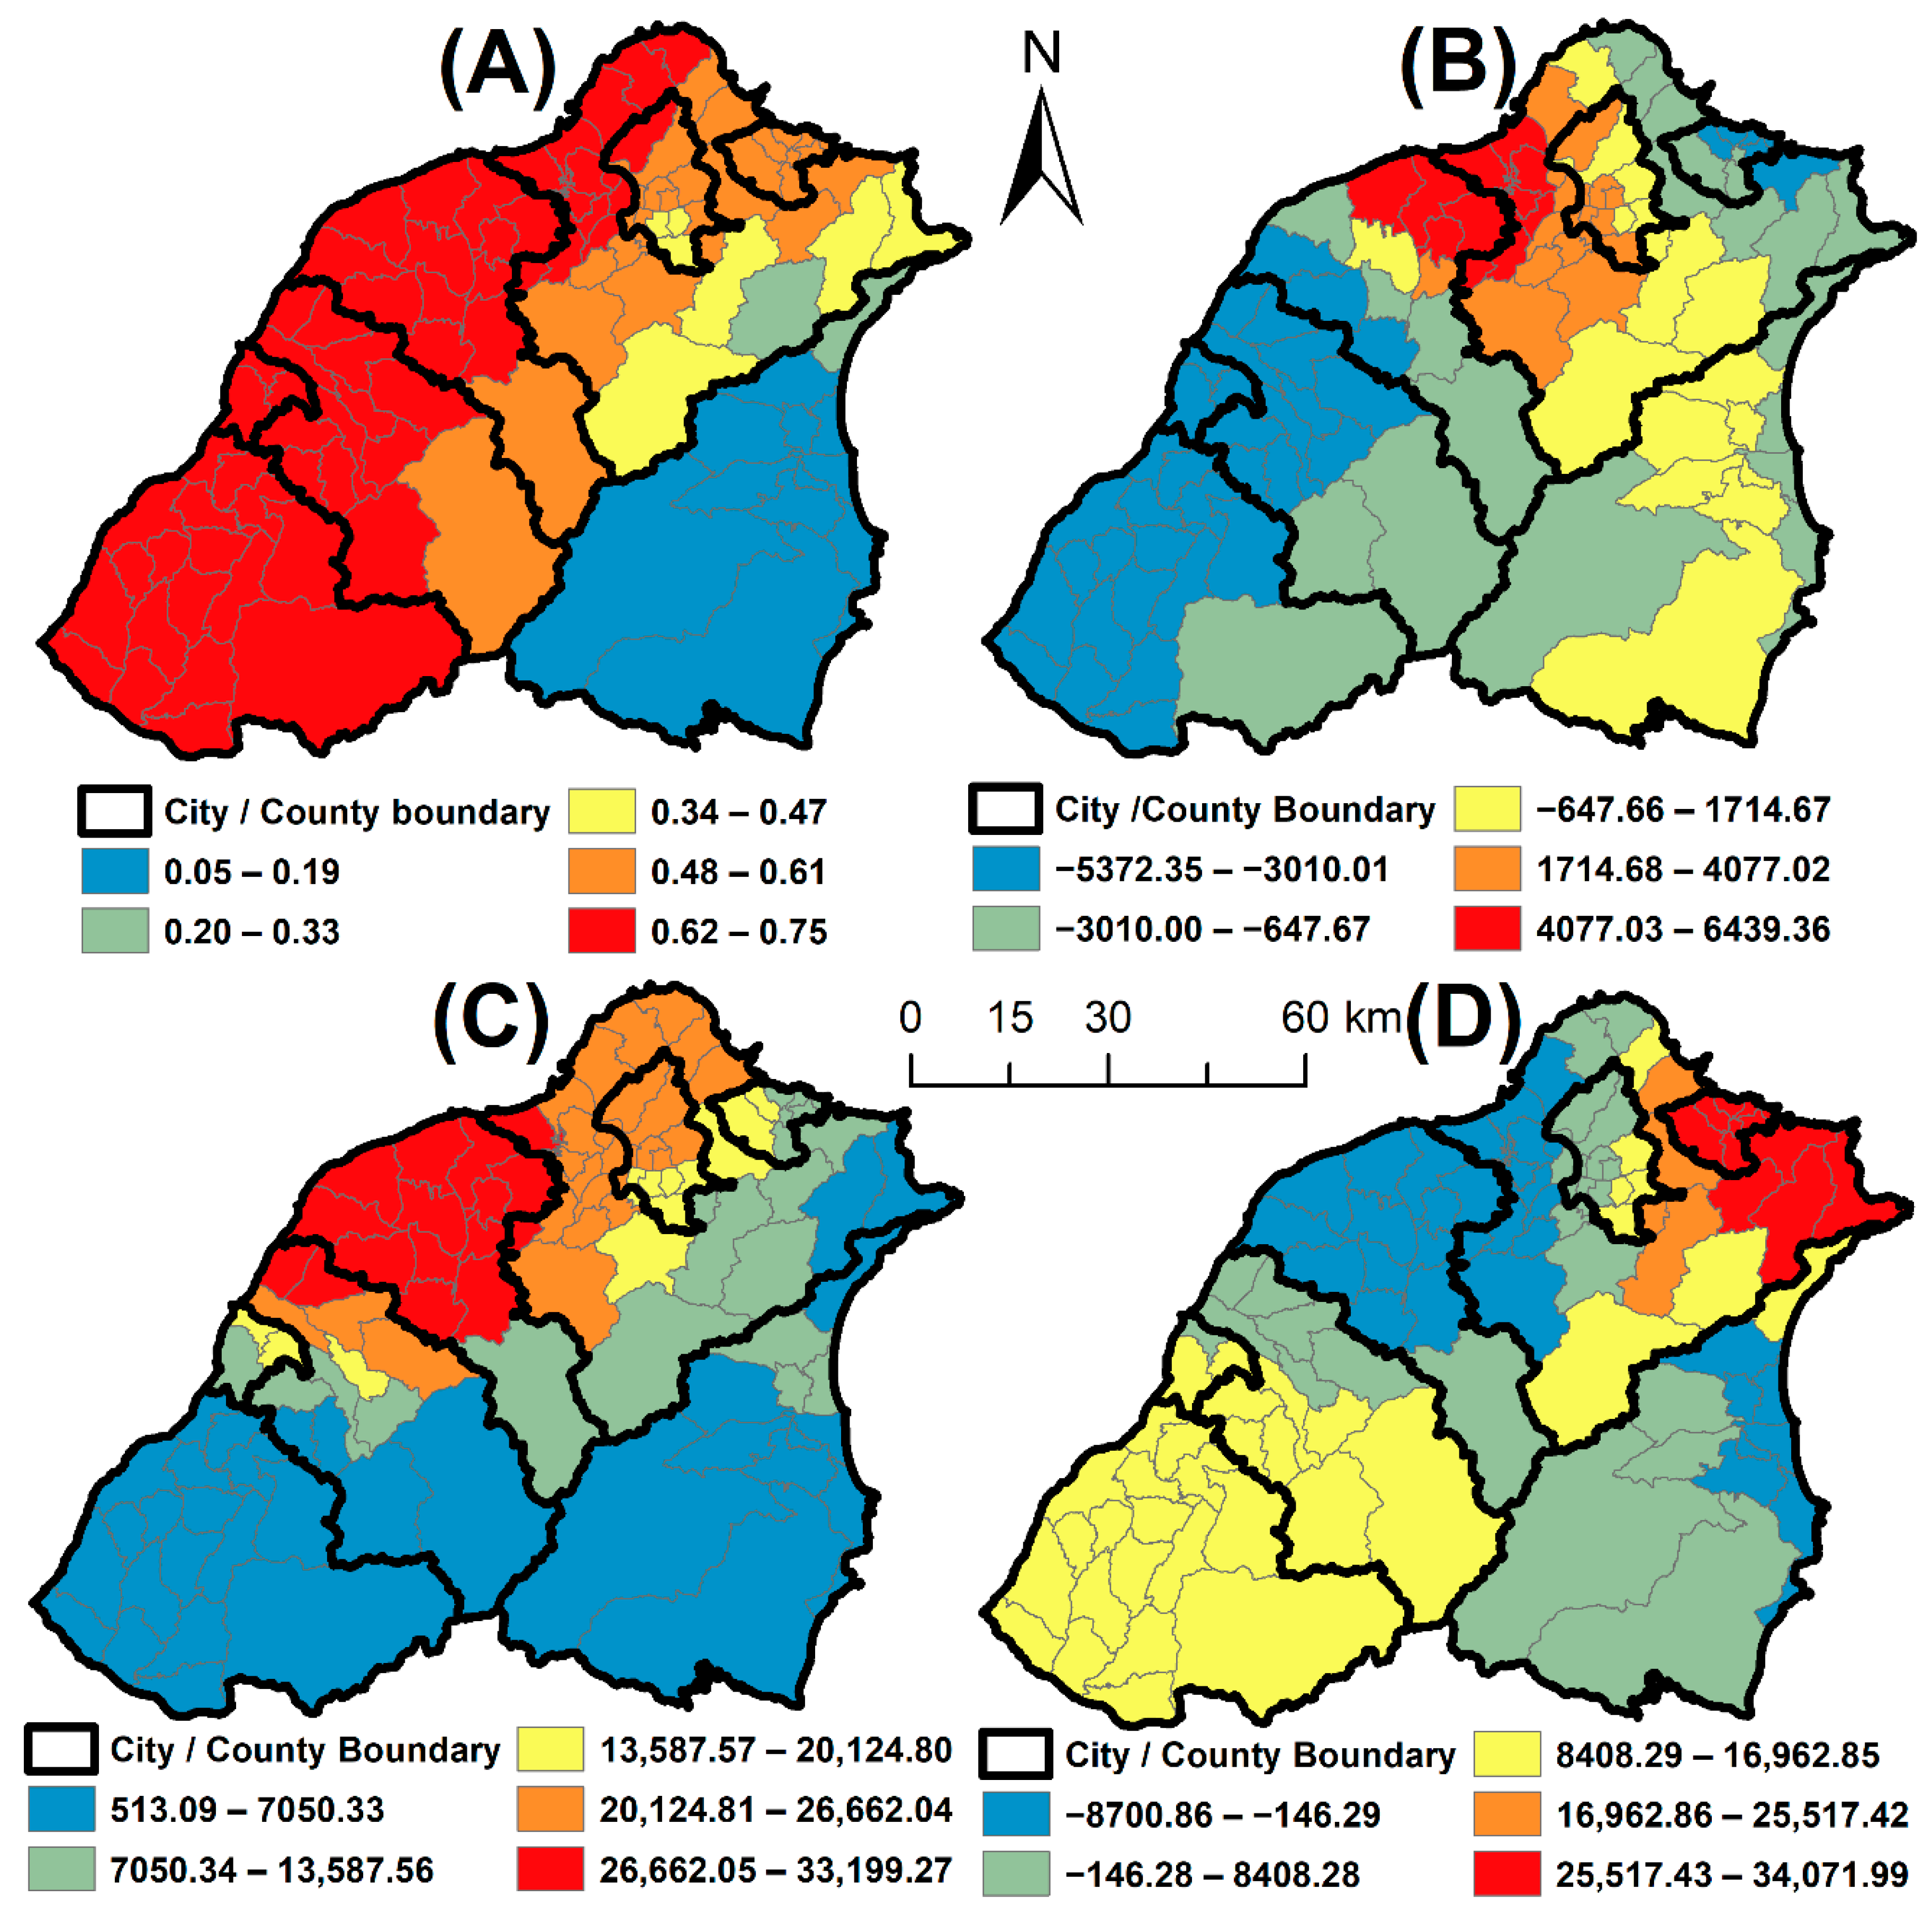
To understand the spatial-temporal relationships between areal extent of urban land-use types (i.e., Residential, Employment, and Transportation) and population counts (p), linear regression models were run. The models were run for population size and areal extents of land use for the same years in a synchronized manner. In addition, regression models were run between population and Urban area extent (i.e., the sum of Residential, Employment, and Transportation land uses). Annual, five-year, and ten-year changes based on the annual land-use and population data were inputs to the linear regression models. Models were run with actual data (i.e., p and land-use area in km2) as well as data normalized by district areas (i.e., population density in p/km2 and land-use areal fraction in %).
3.3. Relative Timing between Population Growth and Land-Use Expansion
The relative timing between land-use expansion and population growth was assessed using lagged correlation analysis, and each type of land use was tested exhaustively against population as a series of annual data using districts as the spatial unit of analysis. Initially, the top 30 districts with the greatest population growth or population density growth were selected for the lagged correlation analysis. Twenty-four of the top 30 population growth districts are also in the top 30 population density growth districts, so 36 districts were selected in total. Time series of population and land use are non-stationary in the temporal domain, which violates the normal distribution assumption of time series variables for any statistical test [
27]. Thus, the linear growth trend of annual population and land-use data was removed before lagged correlation. Pearson’s
r test was applied to each pair of
L and
Pd, where
L is the detrended areal extent of land use,
P is the detrended population count, and
d represents the number of lag years, i.e., the relative timing between land-use expansion and population growth, which must satisfy the following conditions: −10 ≥
d ≥ 10 and
d ∈
Z. The relative timing between land-use expansion and population growth was determined based on the
d value with the highest Pearson’s
r. Such a statistical test revealed whether land-use expansion tended to occur prior to population growth (i.e.,
d > 0), or vice versa (i.e.,
d < 0).
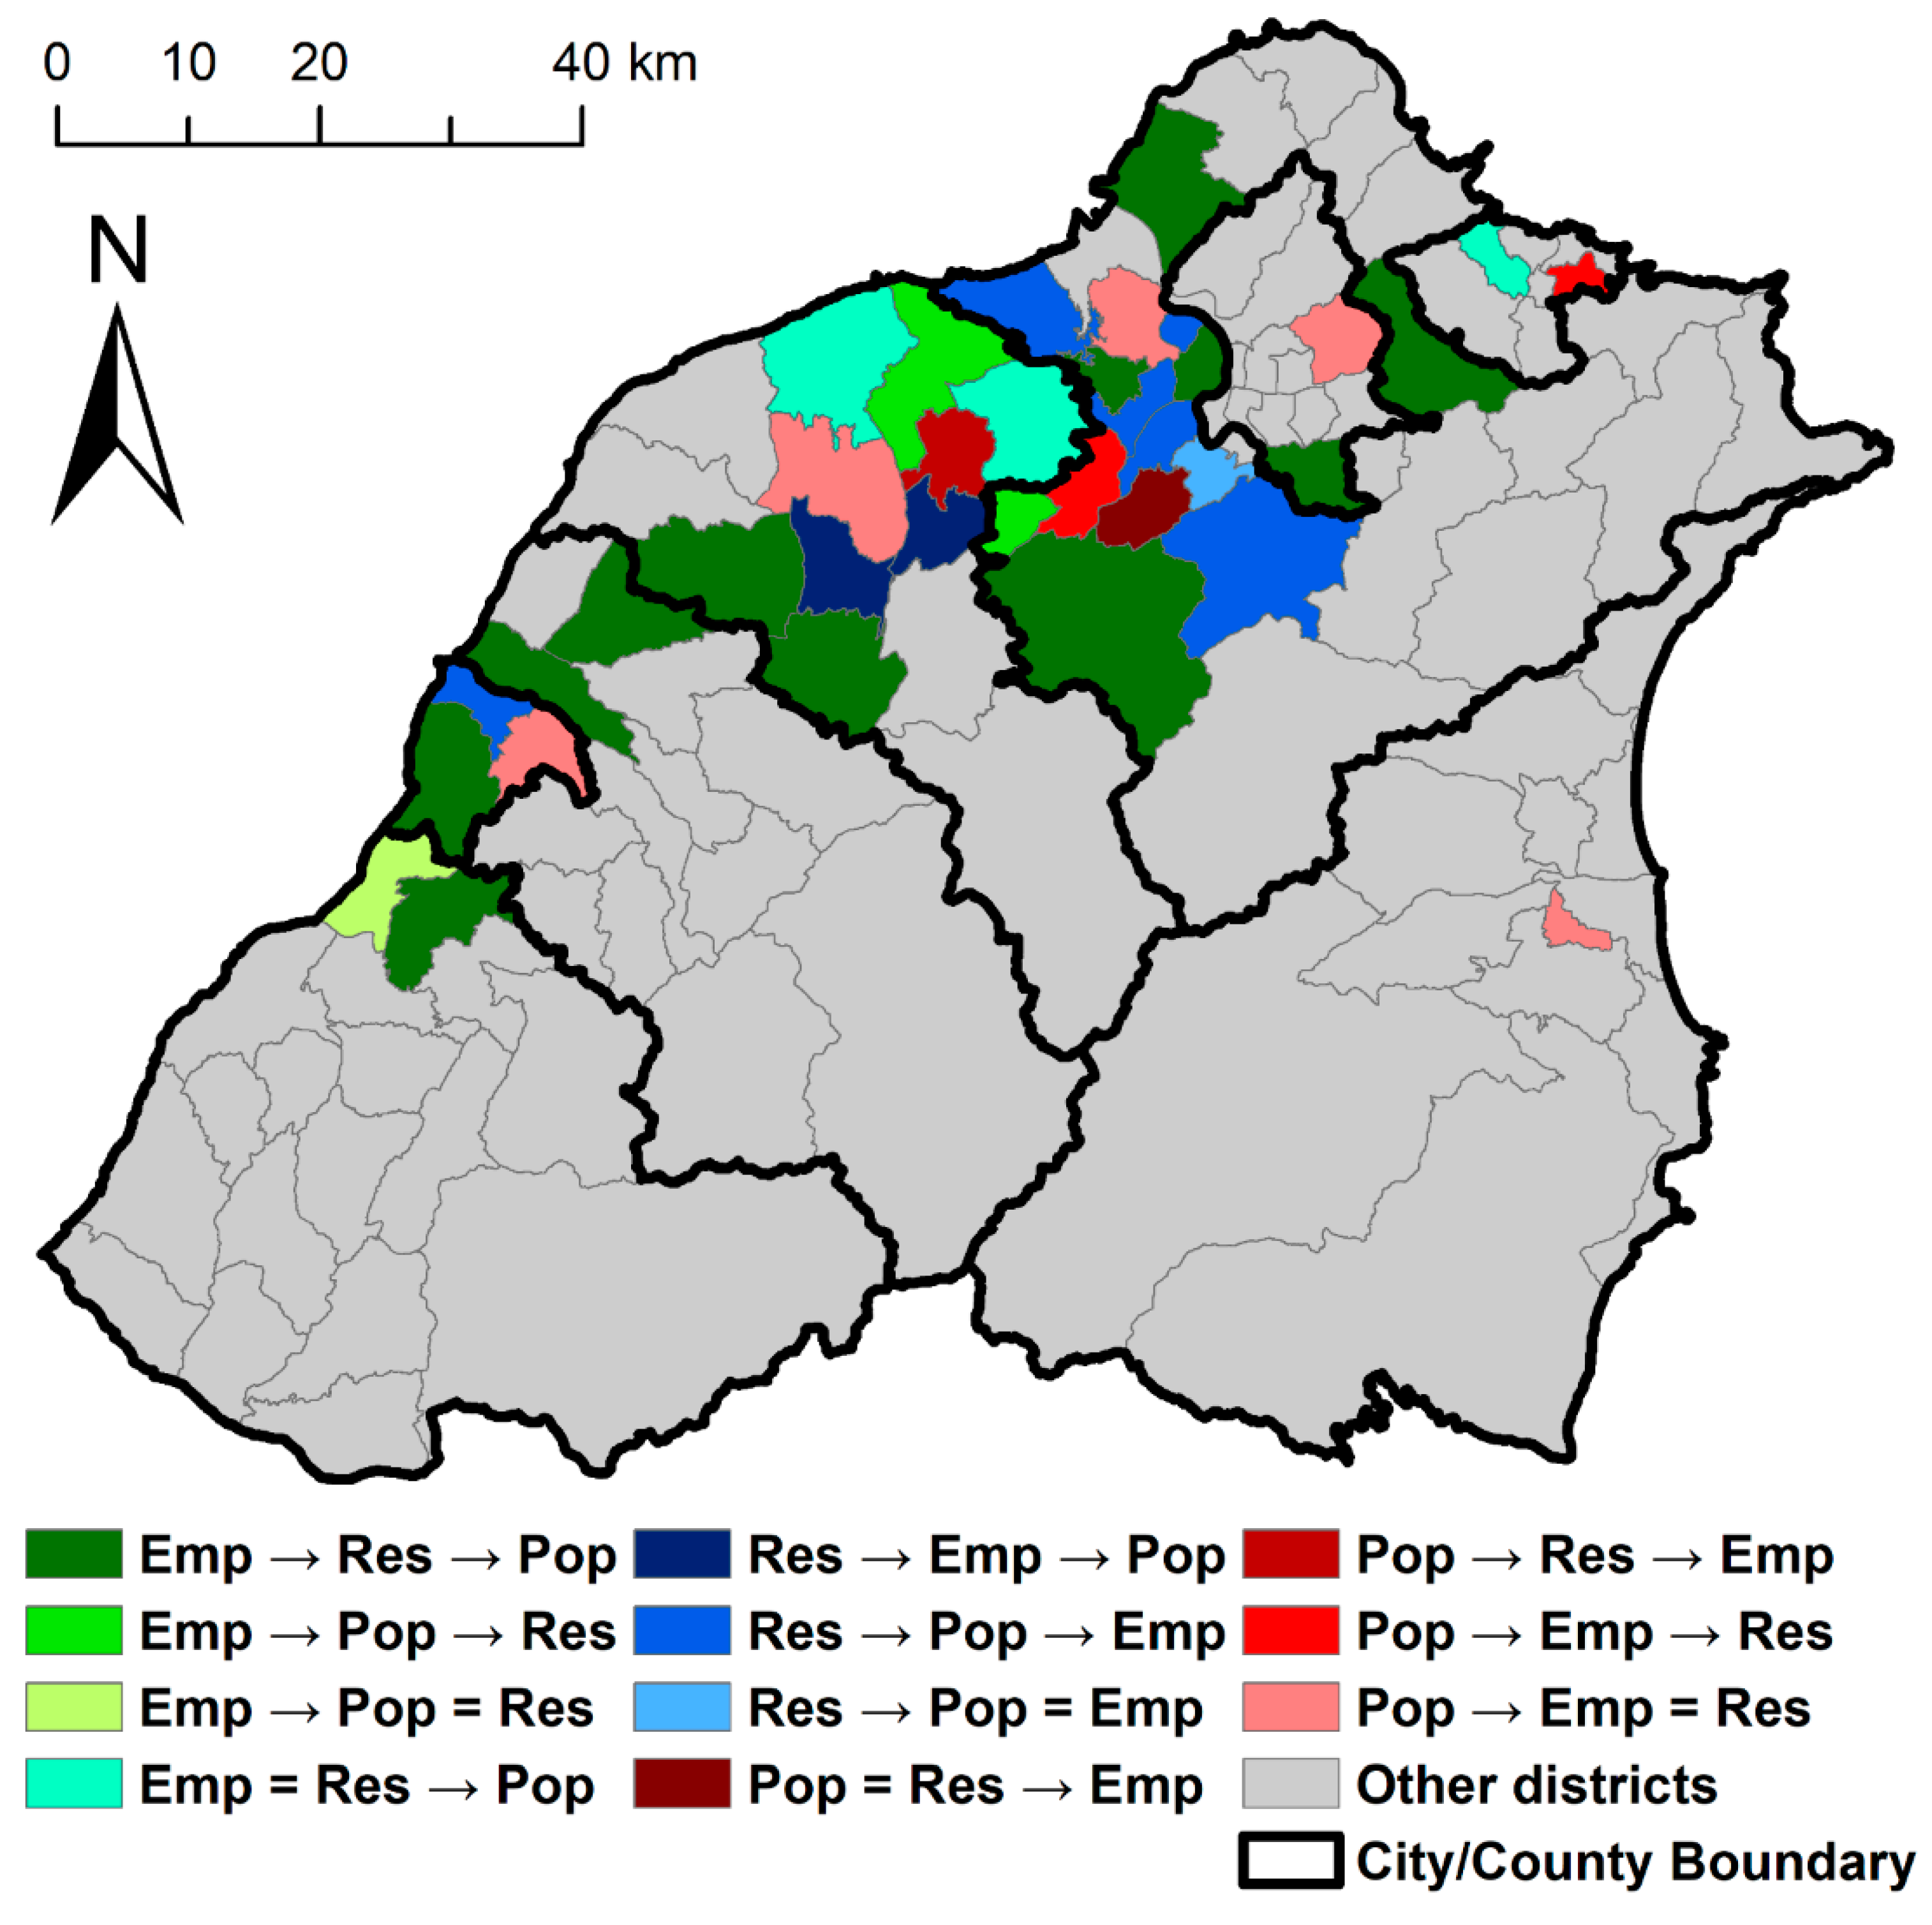
3.4. Hypothetical Processes of Urban Growth
We hypothesized two types of change sequences in terms of population change and land use change associated with urbanization in northern Taiwan. One is that Employment land (i.e., commercial and industrial areas) increases, followed by Residential land expansion, and finally population increases. This hypothetical sequence accounts for the situation that migrant workers initially commute to the newly built employment places for work from their existing homes before new construction of housing. Conversely, migrant workers could move to the existing housings in the proximities of the new employment places, and the growing population put more pressure on the local housing market over time. Construction companies observe the increase demands on housing, and new residential land use starts to appear. The other hypothetical sequence of change is Employment land increase, followed by population increases, and finally Residential land increases. For the selected 36 districts, the relative timing between population growth and Residential expansion, and relative timing between population growth and Employment expansion were identified by lagged correlation tests. Hence, the change sequences among population growth, Employment land expansion, and Residential land expansion were determined, enabling testing of the hypothesis.
5. Discussion and Conclusions
5.1. Discussion
Population growth stemming from net migration was confirmed by evaluating the temporal trend of natural increase and net migration, and the associated urban land expansion was confirmed to be partially resulting from net migration. Net migration has been suggested as a source of growing population pressure in urban areas, and influence urban expansion, but the magnitude has been rarely reported (e.g., [
7,
8,
13,
22]). Here, we observe that net migration accounts for 30% of the population growth at the City/County level, and future studies should focus on upscaling net migration from city/county to district levels for estimating the direct impacts from net migration.
The relationship between population and urban areal coverage was reported in a few studies, and such relationships are linear and moderate within these study areas. For Brazil, the relationship was found to be strong when a logarithm transformation was applied (R
2 = 0.9; [
12]). A linear relationship was found within southeast Ghana (R
2 = 0.79), which implies that urban areal coverage highly reflects on the district population count [
13]. However, the relationship between population density (normalized population in our case) and urban land coverage is similar to the results that were found for southeast Ghana. More future studies should isolate population and population density from other independent variables to systematically compare such relationship in other cities and regions.
The relative timing between population change and land use change is affected by the modifiable areal unit problem (MAUP). The lag correlation was applied at the city and district scale, and Hsinchu City was used as an example (shown in
Table 6). Different time lags were found in the urban core areas and the entire city, and the differences due to MAUP should be explored in future studies. However, aggregation from district to city level is inappropriate for cities with large coverage (e.g., New Taipei City and Taoyuan City) because population growth in a district hardly drives or is driven by land use change in other distant districts within the same city. Thus, time lags derived from the aggregated level data can be erroneous for such large cities. In this study, we confirm that the relationship between population and environments is not unidirectional, but rather reciprocal [
11]. Within the context of urbanization, the change sequence between population and land use change varies depending on the relative location to the urban core areas. Districts in the urban core areas (e.g., districts in west of Taipei City) experienced depopulation while the land use stays the same. On the other hand, districts located in the suburban and peri-urban areas tend to have Residential and Employment expansion prior to population growth. Antrop examined Europe cities with four stages of urbanization in terms of population size, including urbanization, suburbanization, disurbanization, and reurbanization [
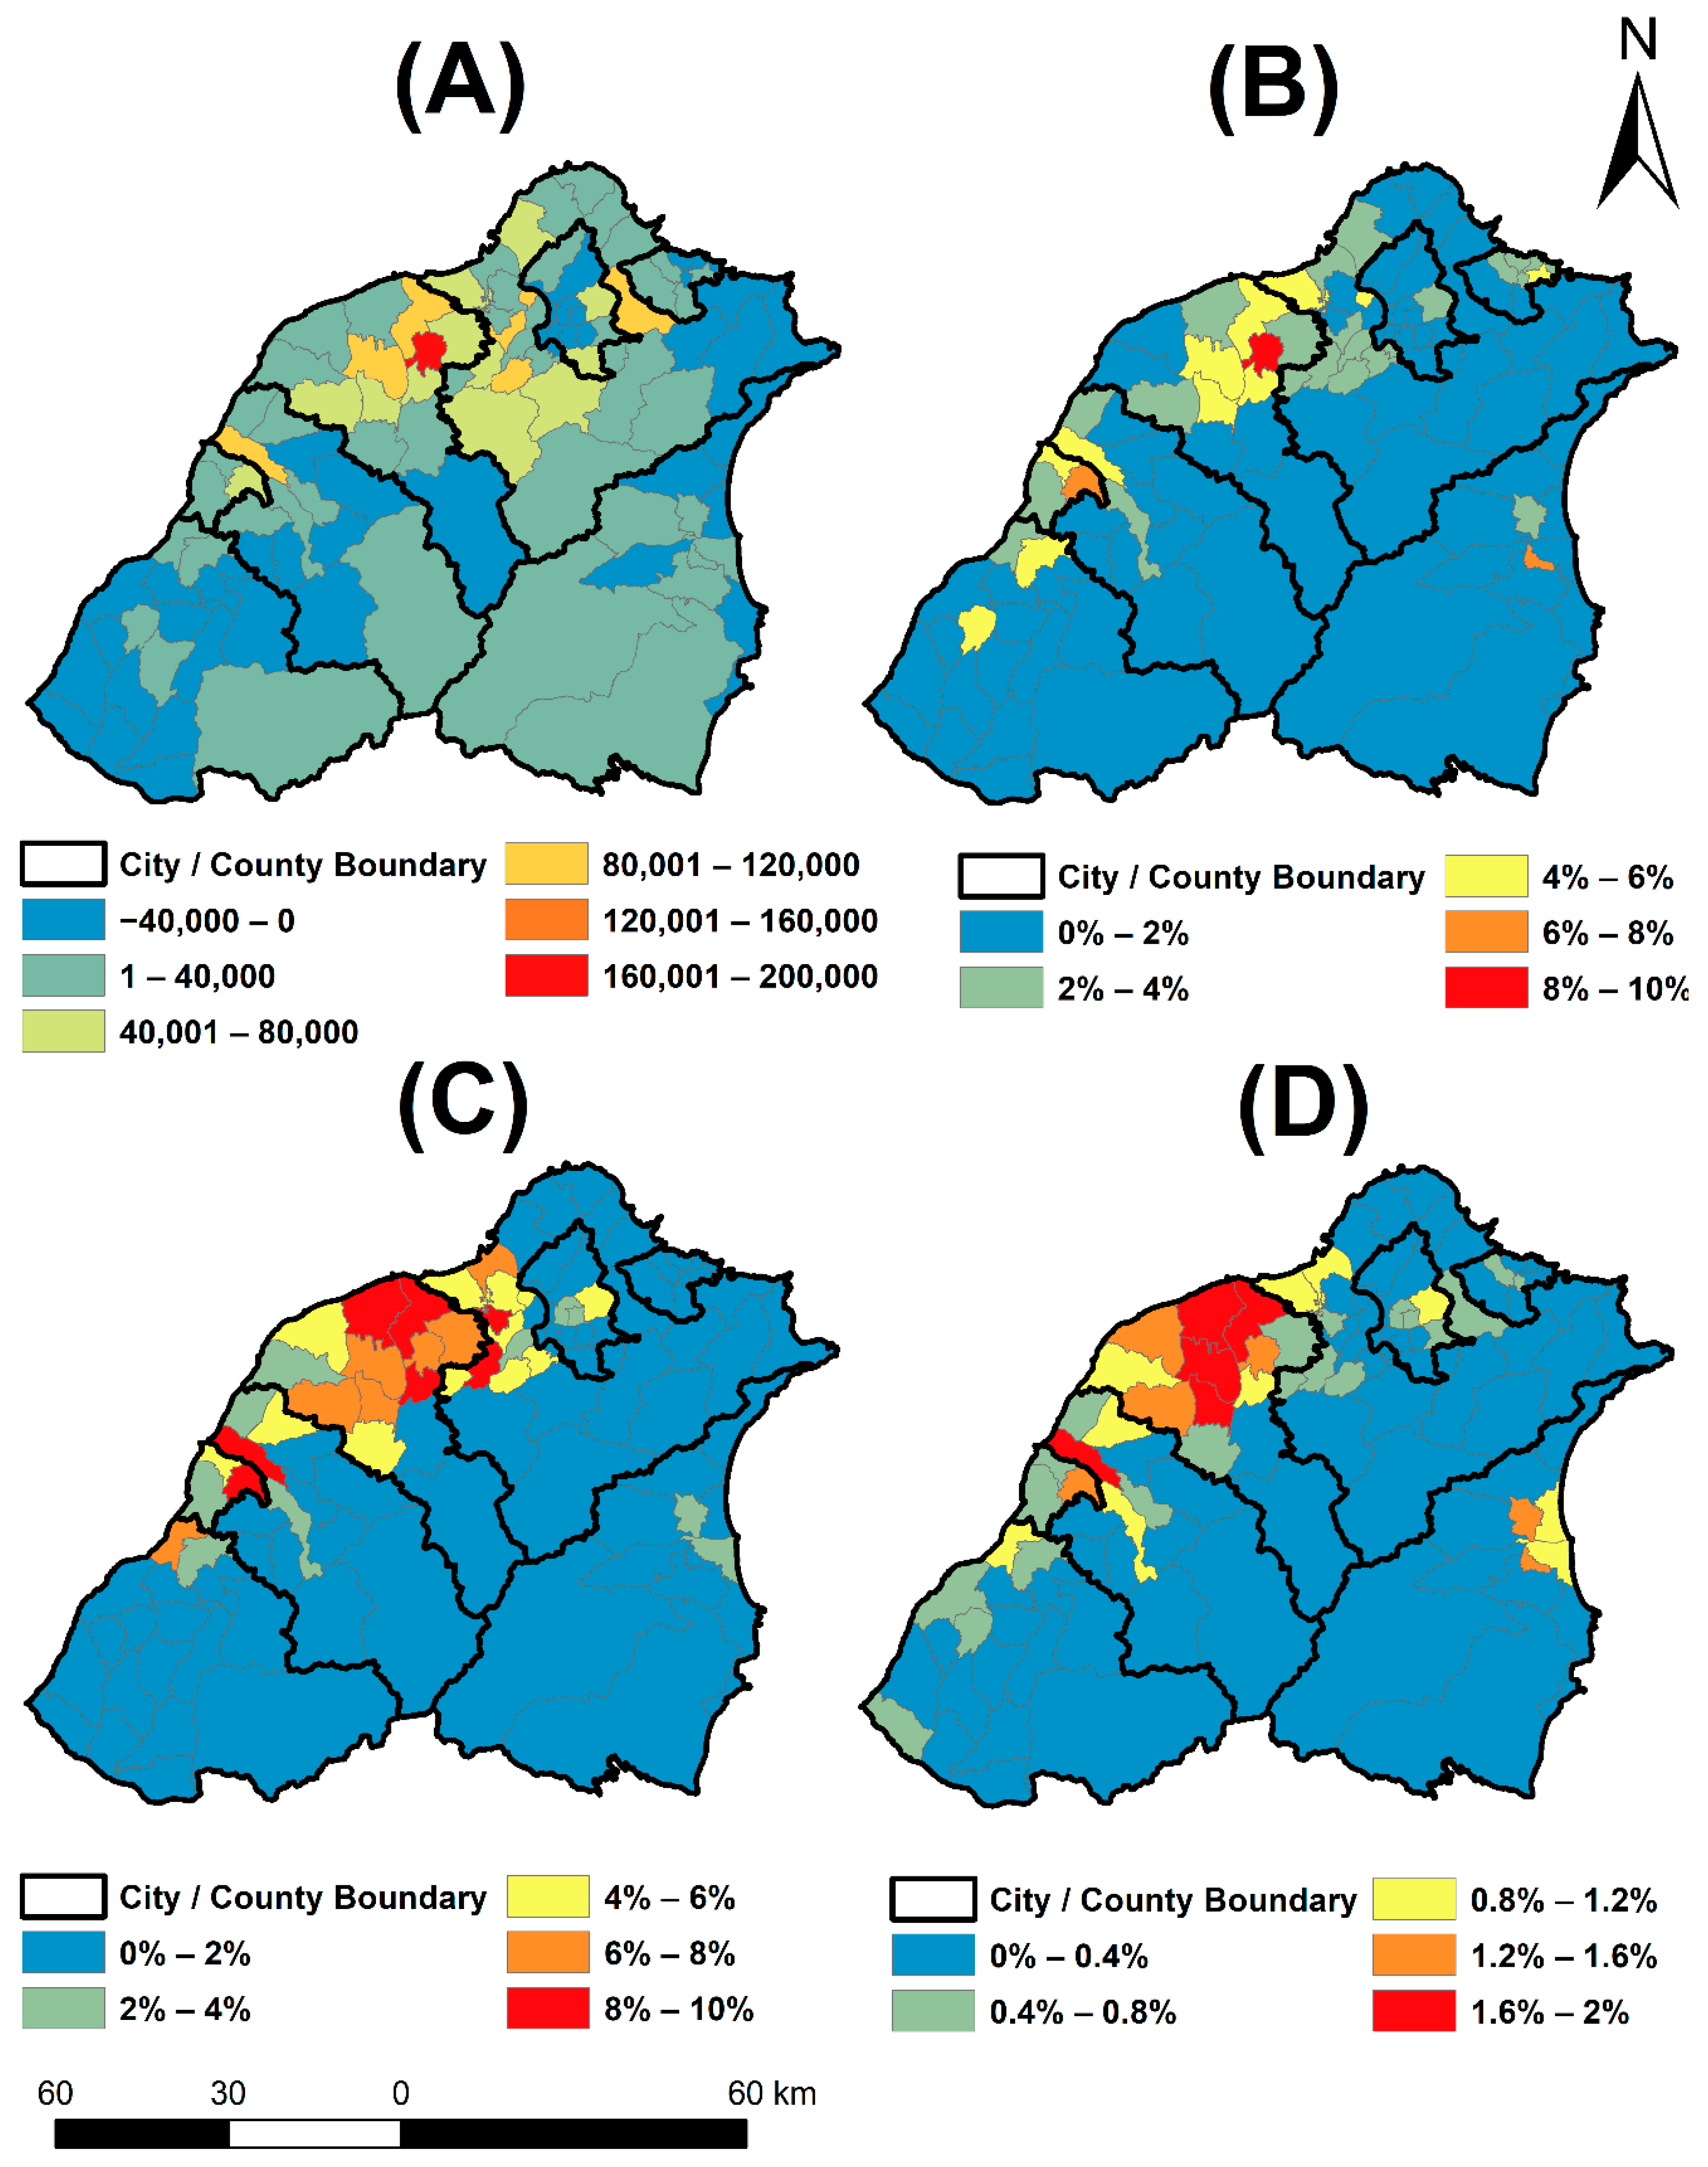
22]. Depopulation occurred in the districts’ urban core of Taipei City, while population substantially increased in the urban core of Taoyuan City (shown in
Figure 4A). Difference in population change reflects on different urbanization stages: disurbanization for Taipei City, while urbanization for Taoyuan City. Future study can focus on the entire time series of population and urban land use dynamics to better examine the urbanization stages and reciprocal relationship.
Two limitations may have influenced the results of this study. Differences between the people enumerated in the population register and the census exist, and the actual population for districts in urban areas is underestimated while overestimated for rural districts. No existing district-level data can be applied to adjust such misestimation in population count. Thus, the resultant time lag between population growth and residential expansion could partially reflect the latency of the population register system. The approaches we used to derive annual land use data were designed within the context of urban expansion, and we assumed that no changes occurred within developed areas. Later, we found evidence of urban renewal and park conversion. To accurately account for urban land use areal coverage over space and time, more research effort should be put on generation of land use time series.
The estimated relative timing between population change and land use change is restricted to the study period for which we have data. The entire trajectories of population and land use were not recorded in the data for some developed districts, and the initial statuses of population and land use remain unknown for these data. Thus, time lags that we estimated through lagged correlation could be mis-specified. Therefore, more case studies should be conducted with the same approaches with a longer study period to reconfirm our findings and test our hypothesis of urbanization processes.
Mobile phone signal data with geographical coordinates could provide a data source for augmenting satellite-derived mapping of land use [
29] and population estimates [
30]. Toole et al. derived weekday-weekend human activity schedules from individual-based time series mobile phone data, and then inferred land use types based on the weekday-weekend daily activity schedules [
29]. Deville et al. estimated population density based on mobile phone signals at fine spatial (cellular tower zone) and temporal (seasonal) levels [
30]. The resultant land-use map and population estimates were found to be accurate and precise.
5.2. Conclusions
This is the first study to examine the relative timing between population change and land-use change and to identify the cause–effect relationships based on fine spatial and temporal scale of population and land-use data at the annual time scale. This was possible because of the unique availability of annual population data for Taiwan, and the readily accessible and free long-term archive of Landsat surface reflectance data.
Linear regression models were run for each type of land use versus population to understand the general relationship between the abundance of land use and population. We found that the areal extent of Residential land use (and change) was most related to population count (and change), and the relationship was stronger when Residential and population were normalized by district areas. Future studies should put effort into separating residential land from the remainder of urban land use for estimating the impacts from population growth in other cities.
The relative timing between population growth and land use change was estimated with lagged correlation. Population growth generally occurred 2.5 years later than Residential land expansion based on the median time lag, and most districts experienced population growth later than Residential land expansion. With the lagged correlation test results, the hypothetical change sequence of population growth and land use expansion was validated within the context of urbanization. Fourteen districts with population growth exhibited our hypothetical change sequence of population growth and land-use expansion. Other districts exhibited different change sequences, primarily due to the closeness of metropolitan cores that provide abundant jobs.
Finally, the expansion of Residential and Employment land uses was deemed to be an important driver of population change. Synchronized OLS, time lag OLS, synchronized GWR, and time lag GWR were applied to model population change with the Residential and Employment change as predictors. Population change modeled with GWR, along with time lags of Residential and Employment change, were found to have the highest adjusted R2-values. We confirm the reciprocal relationship between population and environment (land use in our case) instead of a unidirectional impact from population to land use.


 ,
, 


