
Multi-Scenario Land Use Optimization Simulation and Ecosystem Service Value Estimation Based on Fine-Scale Land Survey Data


Abstract
:1. Introduction
2. Study Area and Data Sources
2.1. Study Area
2.2. Data and Processing
3. Methods
3.1. The GMOP-PLUS Model
3.1.1. Optimization of Land Use Structure Using GMOP Algorithm
- Scenario Setting
- Constraints
3.1.2. Optimization of Land Use Spatial Allocation by PLUS Model
- Spatial driving factors
- Spatial restrictions
- Conversion elastic coefficient and conversion matrix setting
- Model validation
3.2. Ecosystem Services
3.2.1. Ecosystem Services Valuation
3.2.2. Spatial Autocorrelation Analysis
4. Results and Analysis
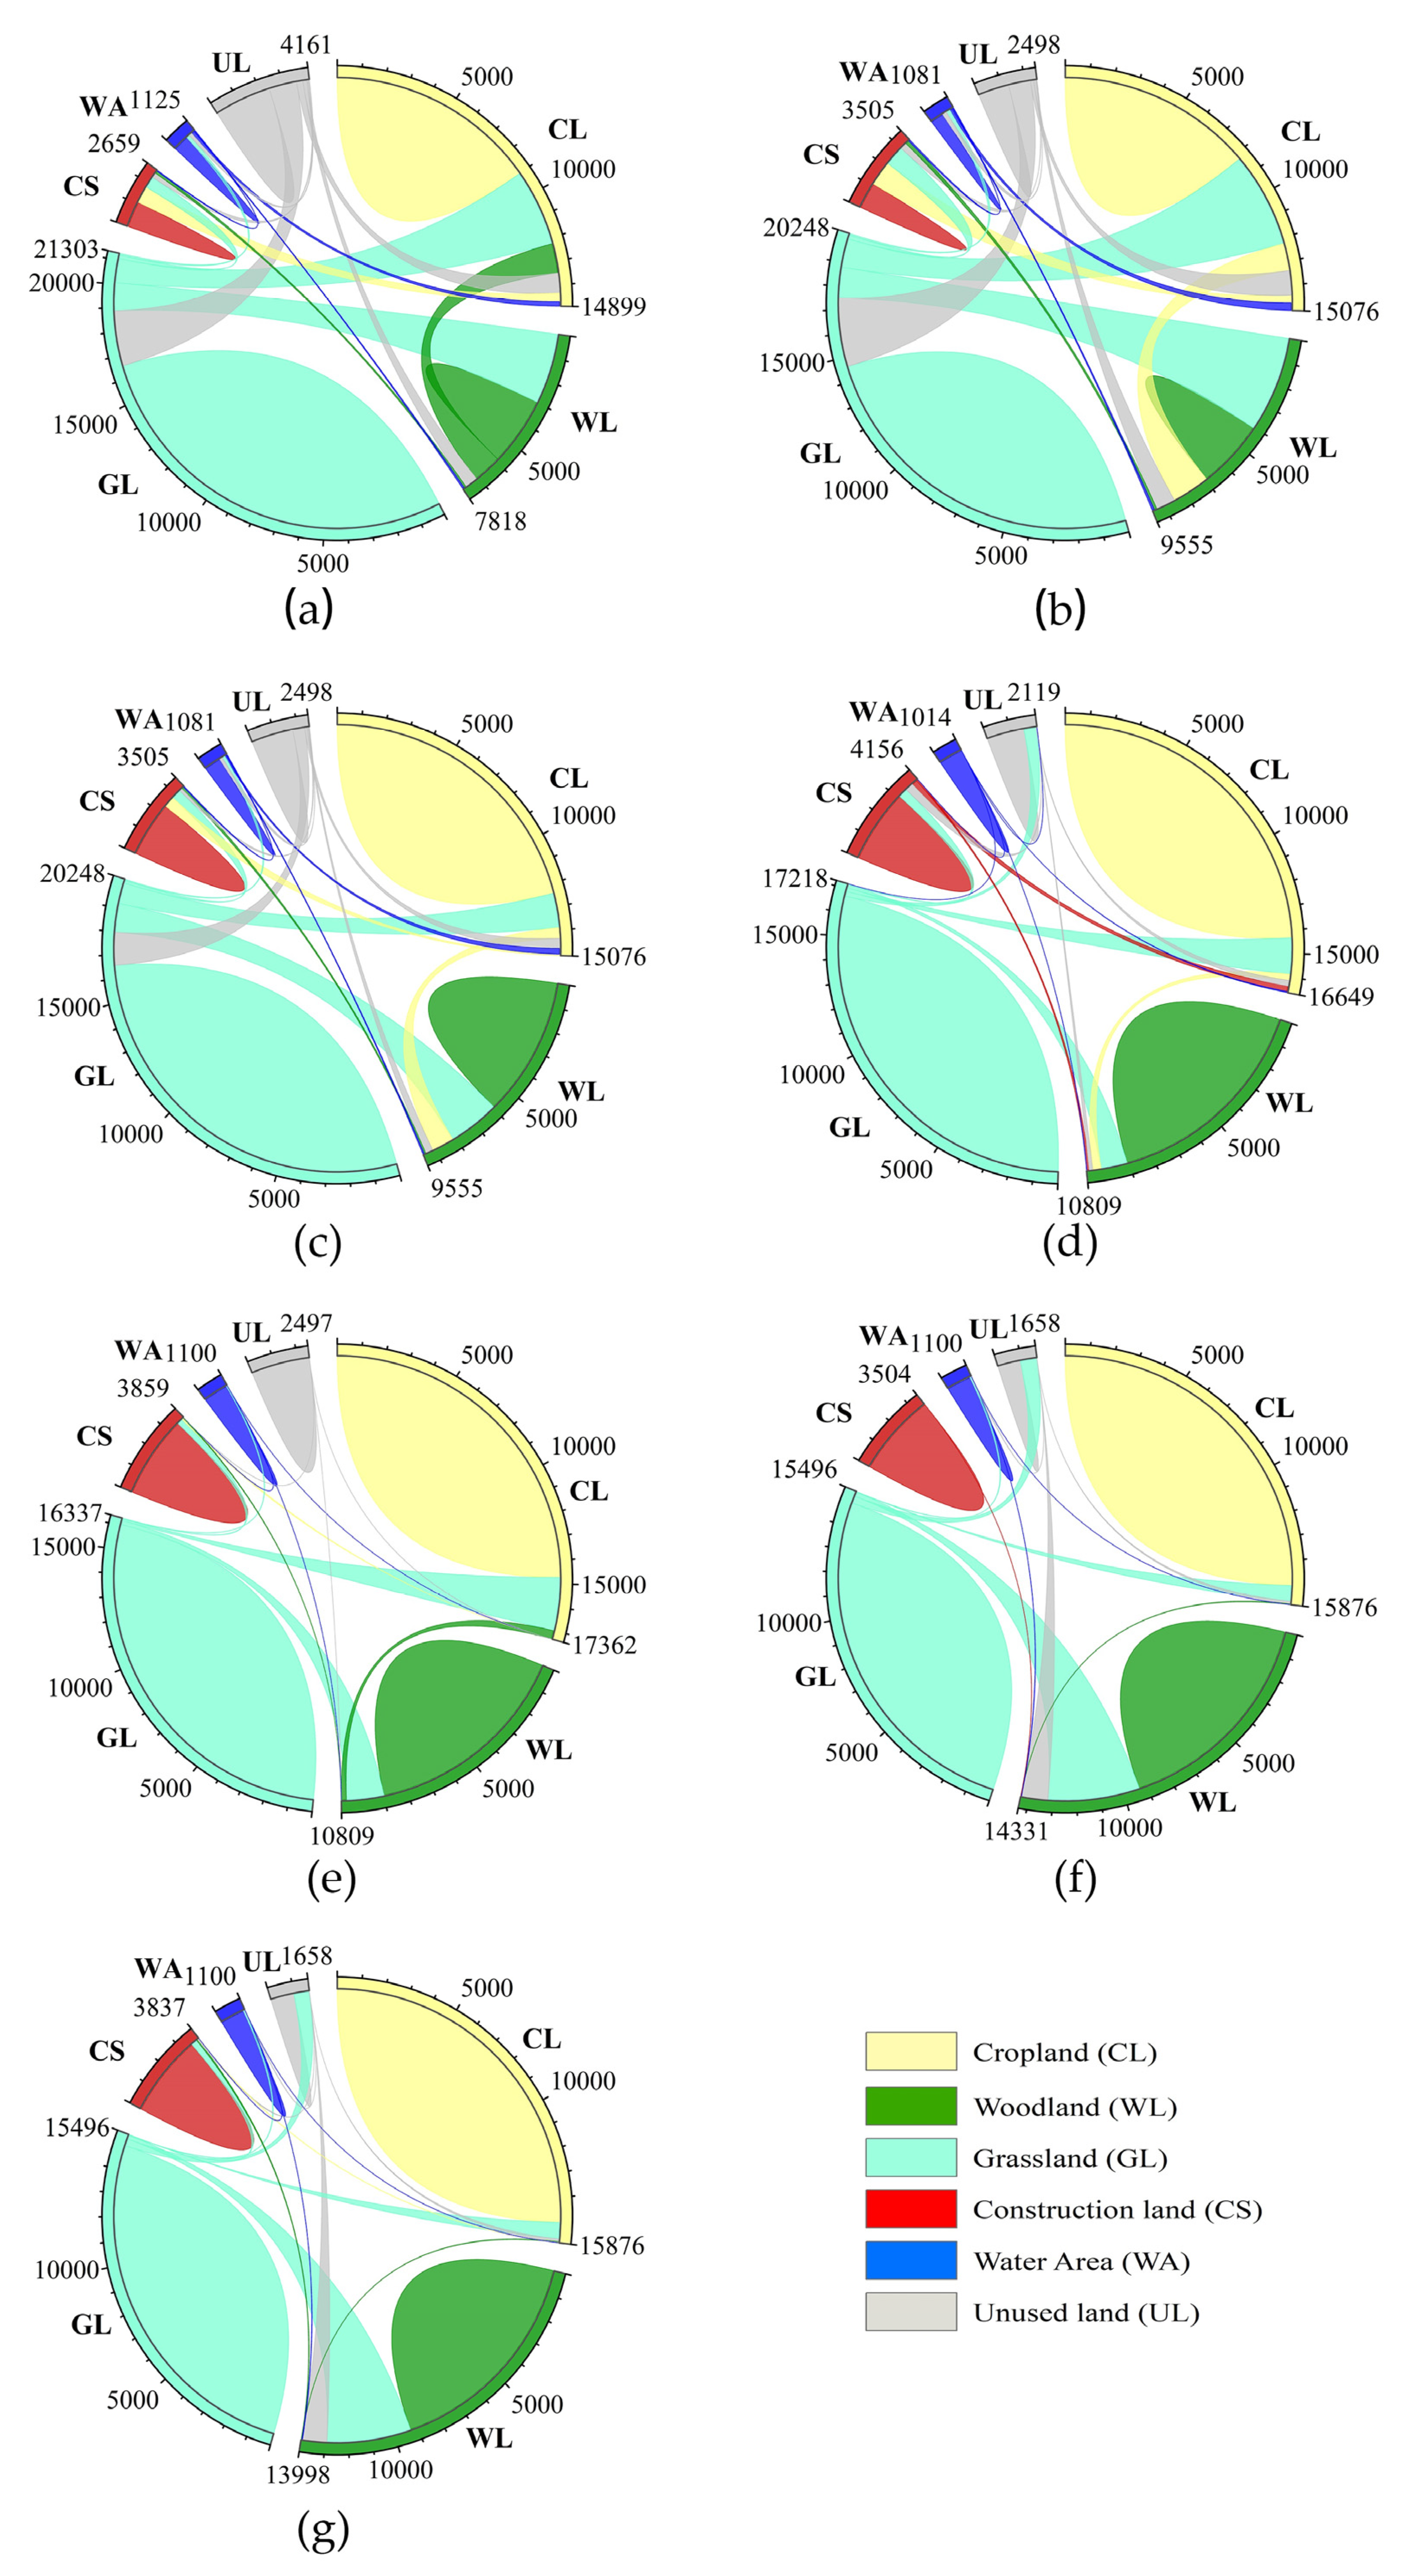
4.1. Spatial and Temporal Variation Characteristics of Land Use
4.1.1. Variation in Land Use between 2000 and 2020
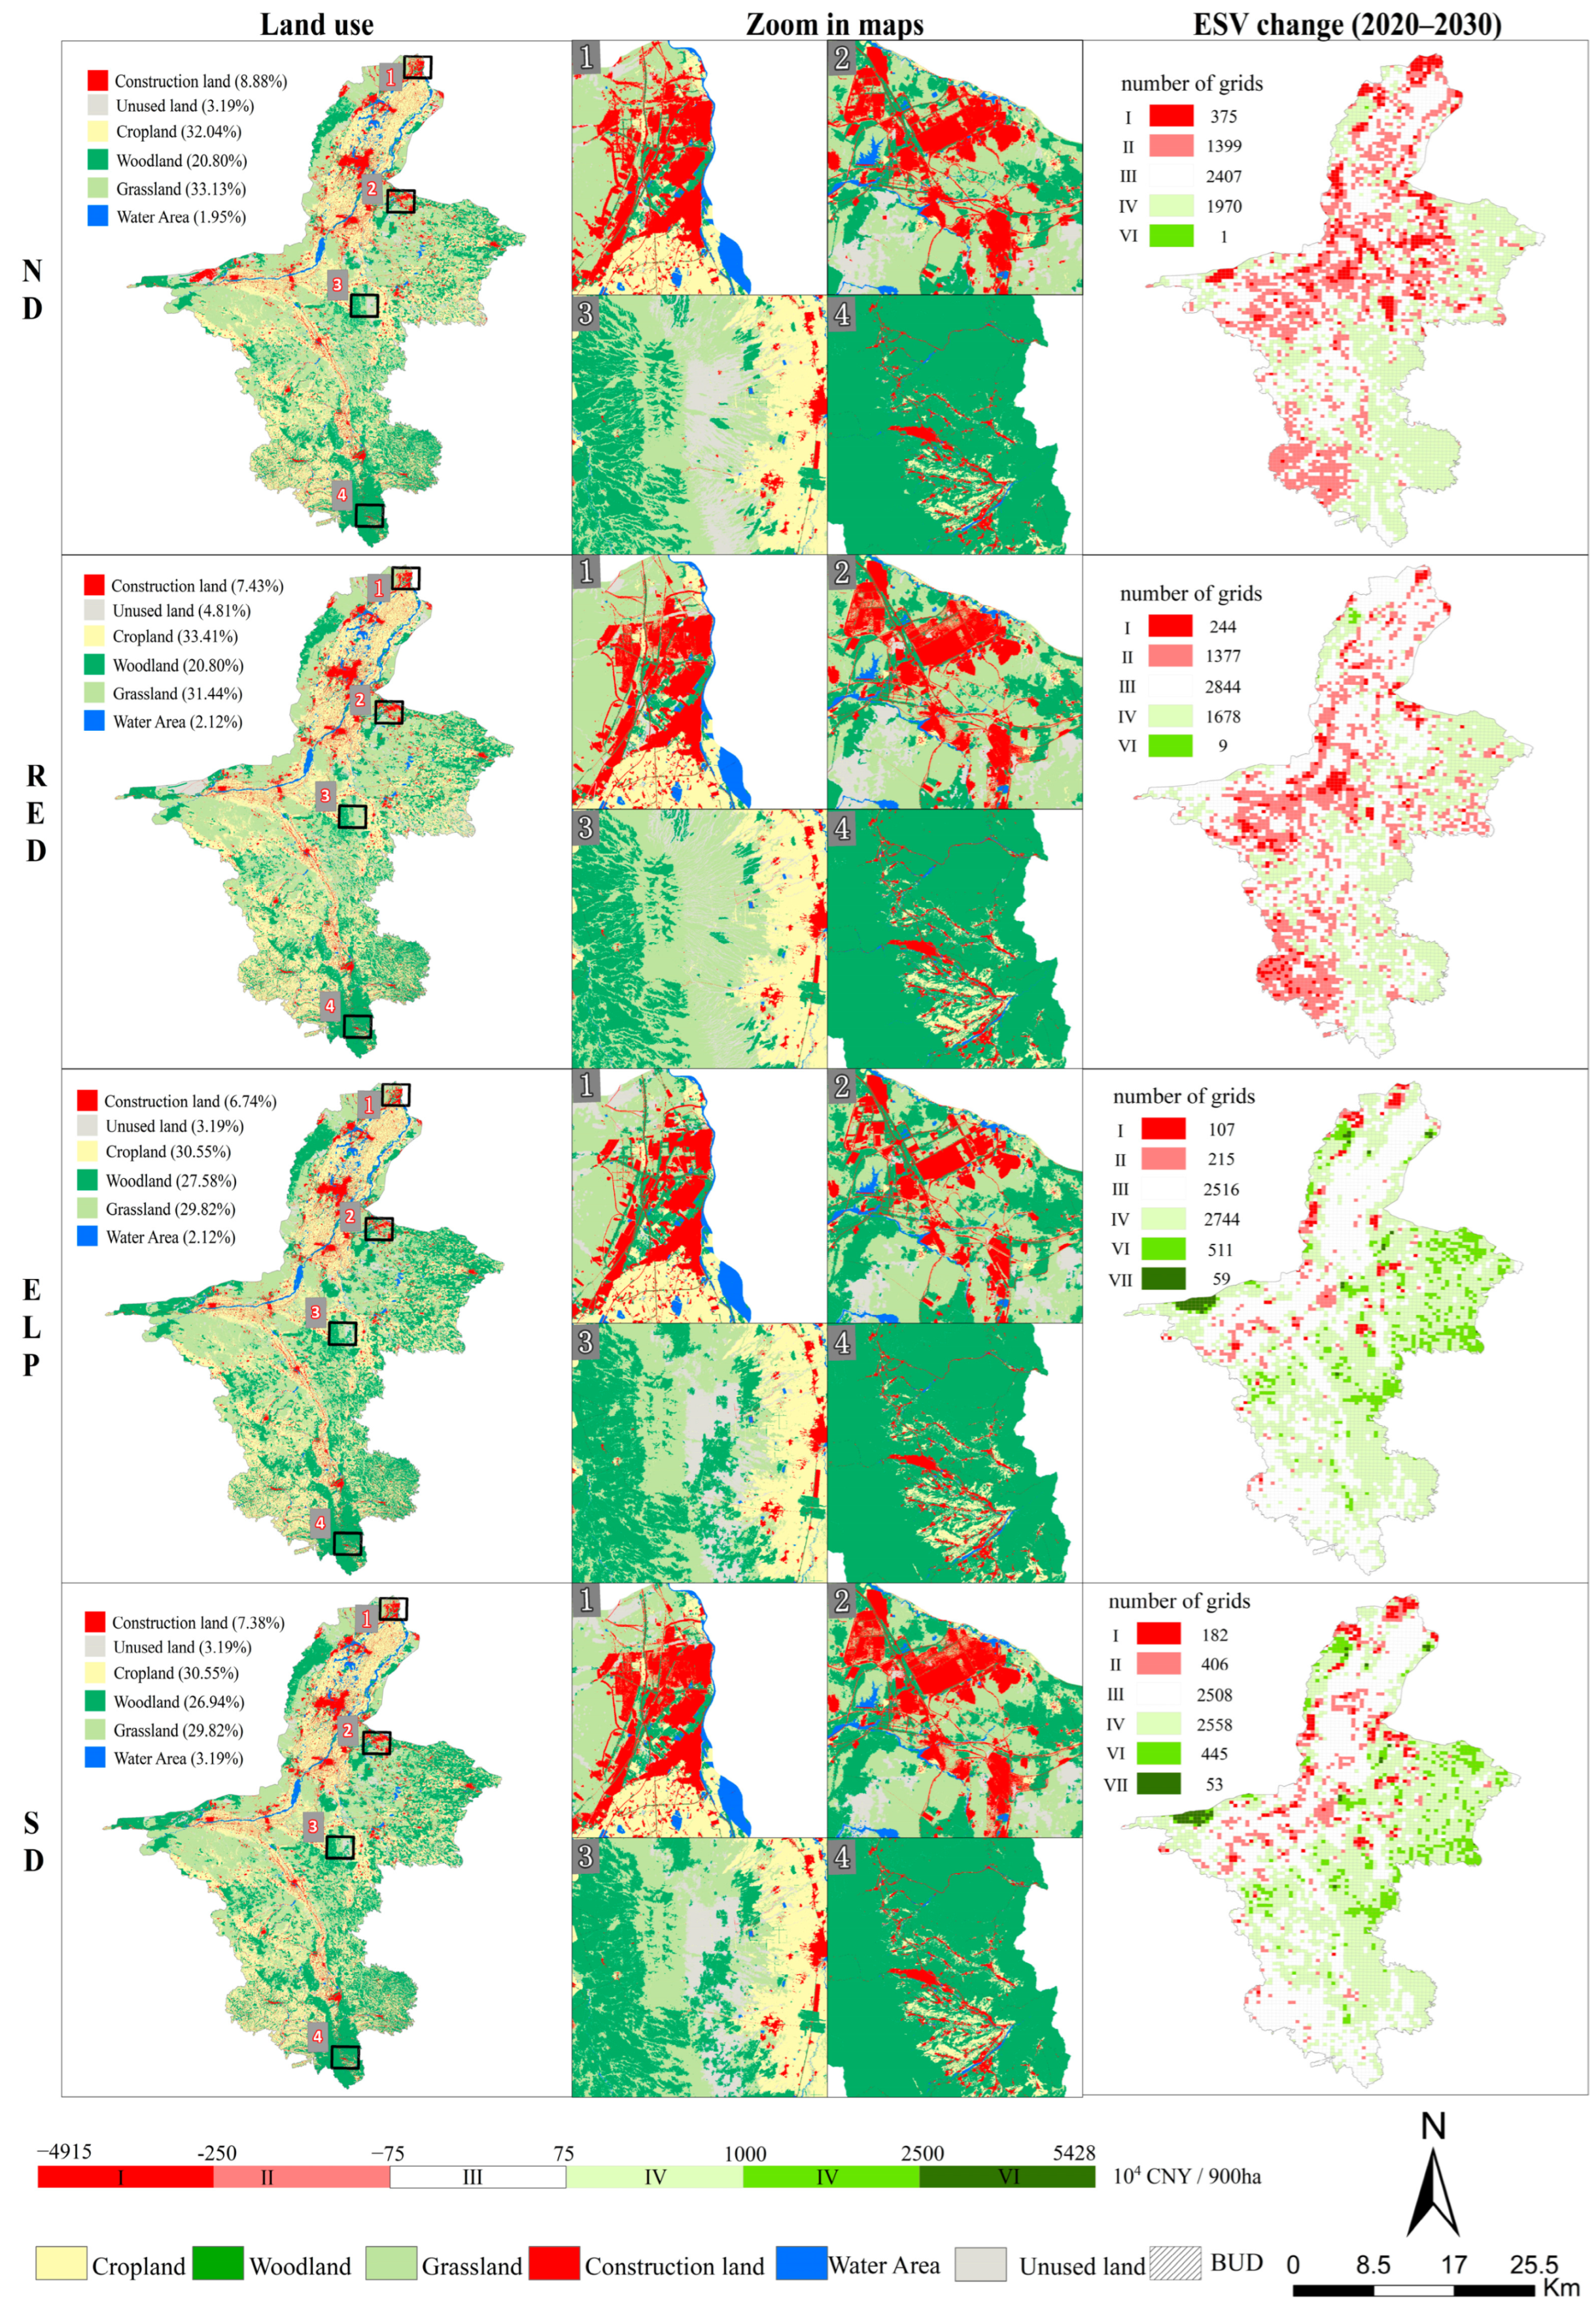
4.1.2. Projection of Land Use Changes in 2030 Based on GMOP-PLUS Model

| LU Type | Land Use (km2) | Relative Change Rate (%) | ||||||||||||
|---|---|---|---|---|---|---|---|---|---|---|---|---|---|---|
| 2000 | 2010 | 2020 | ND | RED | ELP | SD | 2000–2010 | 2010–2020 | 2000–2020 | 2020–ND | 2020–RED | 2020–ELP | 2020–SD | |
| Ecological land | 43,704 | 45,144 | 45,961 | 45,690 | 45,608 | 46,801 | 46,469 | 3.29 | 1.81 | 5.16 | −0.59 | −0.77 | 1.83 | 1.11 |
| Cropland | 12,350 | 14,899 | 15,076 | 16,649 | 17,362 | 15,876 | 15,876 | 20.64 | 1.19 | 22.07 | 10.43 | 15.16 | 5.30 | 5.30 |
| Woodland | 5646 | 7817 | 9555 | 10,809 | 10,809 | 14,330 | 13,998 | 38.46 | 22.23 | 69.24 | 13.12 | 13.12 | 49.97 | 46.50 |
| Grassland | 24,603 | 21,303 | 20,248 | 17,218 | 16,337 | 15,496 | 15,496 | −13.41 | −4.95 | −17.70 | −14.97 | −19.32 | −23.47 | −23.47 |
| Construction land | 1770 | 2659 | 3505 | 4156 | 3859 | 3505 | 3837 | 50.16 | 31.83 | 97.96 | 18.57 | 10.10 | 0.00 | 9.47 |
| Water area | 1105 | 1125 | 1081 | 1014 | 1100 | 1100 | 1100 | 1.79 | −3.93 | −2.20 | −6.20 | 1.77 | 1.77 | 1.77 |
| Unused land | 6489 | 4161 | 2498 | 2119 | 2497 | 1658 | 1658 | −35.87 | −39.96 | −61.50 | −15.20 | −0.05 | −33.64 | −33.64 |
4.2. Variations in Ecosystem Service Value during 2000–2030
4.2.1. Temporal Estimation in Ecosystem Service Value
4.2.2. Spatial Characteristics of Ecosystem Service Value
4.3. Impact of Land Use Changes on the Value of Ecosystem Services
5. Discussion
5.1. Significance of the ESV-GMOP-PLUS Model for Future Land Use Optimization
5.2. Impact of Land Use Policies on Changes in Ecosystem Services Value
5.3. The Necessity and Urgency of Integrating ESV into Land Management
5.4. Realism in Land Optimization Simulations
5.5. Limitations and Future Research Directions
6. Conclusions
Supplementary Materials
Author Contributions
Funding
Data Availability Statement
Acknowledgments
Conflicts of Interest
References
- Duan, X.; Chen, Y.; Wang, L.; Zheng, G.; Liang, T. The impact of land use and land cover changes on the landscape pattern and ecosystem service value in Sanjiangyuan region of the Qinghai-Tibet Plateau. J. Environ. Manag. 2023, 325 Pt B, 116539. [Google Scholar] [CrossRef]
- Cui, X.; Liu, C.; Shan, L.; Lin, J.; Zhang, J.; Jiang, Y.; Zhang, G. Spatial-Temporal Responses of Ecosystem Services to Land Use Transformation Driven by Rapid Urbanization: A Case Study of Hubei Province, China. Int. J. Environ. Res. Public Health 2021, 19, 178. [Google Scholar] [CrossRef]
- He, Y.; Chen, Y.; Tang, H.; Yao, Y.; Yang, P.; Chen, Z. Exploring spatial change and gravity center movement for ecosystem services value using a spatially explicit ecosystem services value index and gravity model. Environ. Monit. Assess. 2011, 175, 563–571. [Google Scholar] [CrossRef] [PubMed]
- Deng, C.; Liu, J.; Liu, Y.; Li, Z.; Nie, X.; Hu, X.; Wang, L.; Zhang, Y.; Zhang, G.; Zhu, D.; et al. Spatiotemporal dislocation of urbanization and ecological construction increased the ecosystem service supply and demand imbalance. J. Environ. Manag. 2021, 288, 112478. [Google Scholar] [CrossRef]
- Lautenbach, S.; Kugel, C.; Lausch, A.; Seppelt, R. Analysis of historic changes in regional ecosystem service provisioning using land use data. Ecol. Indic. 2011, 11, 676–687. [Google Scholar] [CrossRef]
- Ouyang, Z.; Song, C.; Zheng, H.; Polasky, S.; Xiao, Y.; Bateman, I.J.; Liu, J.; Ruckelshaus, M.; Shi, F.; Xiao, Y.; et al. Using gross ecosystem product (GEP) to value nature in decision making. Proc. Natl. Acad. Sci. USA 2020, 117, 14593–14601. [Google Scholar] [CrossRef] [PubMed]
- Akhtar, M.; Zhao, Y.; Gao, G.; Gulzar, Q.; Hussain, A. Assessment of spatiotemporal variations of ecosystem service values and hotspots in a dryland: A case-study in Pakistan. Land Degrad. Dev. 2022, 33, 1383–1397. [Google Scholar] [CrossRef]
- Cao, Y.; Kong, L.; Zhang, L.; Ouyang, Z. The balance between economic development and ecosystem service value in the process of land urbanization: A case study of China’s land urbanization from 2000 to 2015. Land Use Policy 2021, 108, 105536. [Google Scholar] [CrossRef]
- Costanza, R.; de Groot, R.; Sutton, P.; van der Ploeg, S.; Anderson, S.J.; Kubiszewski, I.; Farber, S.; Turner, R.K. Changes in the global value of ecosystem services. Glob. Environ. Chang. 2014, 26, 152–158. [Google Scholar] [CrossRef]
- Keith, H.; Vardon, M.; Stein, J.A.; Stein, J.L.; Lindenmayer, D. Ecosystem accounts define explicit and spatial trade-offs for managing natural resources. Nat. Ecol. Evol. 2017, 1, 1683–1692. [Google Scholar] [CrossRef]
- Nijhum, F.; Westbrook, C.; Noble, B.; Belcher, K.; Lloyd-Smith, P. Evaluation of alternative land-use scenarios using an ecosystem services-based strategic environmental assessment approach. Land. Use Policy 2021, 108, 105540. [Google Scholar] [CrossRef]
- Tammi, I.; Mustajärvi, K.; Rasinmäki, J. Integrating spatial valuation of ecosystem services into regional planning and development. Ecosyst. Serv. 2017, 26, 329–344. [Google Scholar] [CrossRef]
- Kang, N.; Hou, L.; Huang, J.; Liu, H. Ecosystem services valuation in China: A meta-analysis. Sci. Total Environ. 2022, 809, 151122. [Google Scholar] [CrossRef] [PubMed]
- Zhang, P.; Liu, L.; Yang, L.; Zhao, J.; Li, Y.; Qi, Y.; Ma, X.; Cao, L. Exploring the response of ecosystem service value to land use changes under multiple scenarios coupling a mixed-cell cellular automata model and system dynamics model in Xi’an, China. Ecol. Indic. 2023, 147, 110009. [Google Scholar] [CrossRef]
- Xie, G.; Zhang, C.; Zhen, L.; Zhang, L. Dynamic changes in the value of China’s ecosystem services. Ecosyst. Serv. 2017, 26, 146–154. [Google Scholar] [CrossRef]
- Schägner, J.P.; Brander, L.; Maes, J.; Hartje, V. Mapping ecosystem services’ values: Current practice and future prospects. Ecosyst. Serv. 2013, 4, 33–46. [Google Scholar] [CrossRef]
- Lin, J.C.; Chiou, C.R.; Chan, W.H.; Wu, M.S. Valuation of Forest Ecosystem Services in Taiwan. Forests 2021, 12, 1694. [Google Scholar] [CrossRef]
- Thapa, S.; Wang, L.H.; Koirala, A.; Shrestha, S.; Bhattarai, S.; Aye, W.N. Valuation of Ecosystem Services from an Important Wetland of Nepal: A Study from Begnas Watershed System. Wetlands 2020, 40, 1071–1083. [Google Scholar] [CrossRef]
- Wang, Y.; Li, X.; Zhang, Q.; Li, J.; Zhou, X. Projections of future land use changes: Multiple scenarios-based impacts analysis on ecosystem services for Wuhan city, China. Ecol. Indic. 2018, 94, 430–445. [Google Scholar] [CrossRef]
- Shi, Q.; Gu, C.-J.; Xiao, C. Multiple scenarios analysis on land use simulation by coupling socioeconomic and ecological sustainability in Shanghai, China. Sustain. Cities Soc. 2023, 95, 104578. [Google Scholar] [CrossRef]
- Huang, Y.; Nian, P.; Zhang, W. The prediction of interregional land use differences in Beijing: A Markov model. Environ. Earth Sci. 2014, 73, 4077–4090. [Google Scholar] [CrossRef]
- Lin, Z.; Peng, S. Comparison of multimodel simulations of land use and land cover change considering integrated constraints—A case study of the Fuxian Lake basin. Ecol. Indic. 2022, 142, 109254. [Google Scholar] [CrossRef]
- Karimi, H.; Jafarnezhad, J.; Khaledi, J.; Ahmadi, P. Monitoring and prediction of land use/land cover changes using CA-Markov model: A case study of Ravansar County in Iran. Arab. J. Geosci. 2018, 11, 592. [Google Scholar] [CrossRef]
- Liu, J.; Hu, C.; Kang, X.; Chen, F. A Loosely Coupled Model for Simulating and Predicting Land Use Changes. Land 2023, 12, 189. [Google Scholar] [CrossRef]
- Du, Y.; Li, X.; He, X.; Li, X.; Yang, G.; Li, D.; Xu, W.; Qiao, X.; Li, C.; Sui, L. Multi-Scenario Simulation and Trade-Off Analysis of Ecological Service Value in the Manas River Basin Based on Land Use Optimization in China. Int. J. Environ. Res. Public Health 2022, 19, 6216. [Google Scholar] [CrossRef]
- Zhang, W.; Wang, H.; Han, F.; Gao, J.; Nguyen, T.; Chen, Y.; Huang, B.; Zhan, F.B.; Zhou, L.; Hong, S. Modeling urban growth by the use of a multiobjective optimization approach: Environmental and economic issues for the Yangtze watershed, China. Environ. Sci. Pollut. Res. Int. 2014, 21, 13027–13042. [Google Scholar] [CrossRef]
- Zhao, X.; Li, S.; Pu, J.; Miao, P.; Wang, Q.; Tan, K. Optimization of the National Land Space Based on the Coordination of Urban-Agricultural-Ecological Functions in the Karst Areas of Southwest China. Sustainability 2019, 11, 6752. [Google Scholar] [CrossRef]
- Zhang, H.; Zeng, Y.; Jin, X.; Shu, B.; Zhou, Y.; Yang, X. Simulating multi-objective land use optimization allocation using Multi-agent system—A case study in Changsha, China. Ecol. Model. 2016, 320, 334–347. [Google Scholar] [CrossRef]
- Zhao, X.; Ma, X.; Tang, W.; Liu, D. An adaptive agent-based optimization model for spatial planning: A case study of Anyue County, China. Sustain. Cities Soc. 2019, 51, 101733. [Google Scholar] [CrossRef]
- Wang, H.; Qiu, L.; Chen, Z.; Li, F.; Jiang, P.; Zhang, A.; Nie, X. Is rationality or herd more conducive to promoting farmers to protect wetlands? A hybrid interactive simulation. Habitat. Int. 2022, 128, 102647. [Google Scholar] [CrossRef]
- An, X.; Jin, W.; Long, X.; Chen, S.; Qi, S.; Zhang, M. Spatial and temporal evolution of carbon stocks in Dongting Lake wetlands based on remote sensing data. Geocarto Int. 2022, 37, 14983–15009. [Google Scholar] [CrossRef]
- Halmy, M.W.A.; Gessler, P.E.; Hicke, J.A.; Salem, B.B. Land use/land cover change detection and prediction in the north-western coastal desert of Egypt using Markov-CA. Appl. Geogr. 2015, 63, 101–112. [Google Scholar] [CrossRef]
- Li, X.; Chen, Y.; Liu, X.; Xu, X.; Chen, G. Experiences and issues of using cellular automata for assisting urban and regional planning in China. Int. J. Geogr. Inf. Sci. 2017, 31, 1606–1629. [Google Scholar] [CrossRef]
- Liao, G.; He, P.; Gao, X.; Lin, Z.; Huang, C.; Zhou, W.; Deng, O.; Xu, C.; Deng, L. Land use optimization of rural production–living–ecological space at different scales based on the BP–ANN and CLUE–S models. Ecol. Indic. 2022, 137, 108710. [Google Scholar] [CrossRef]
- Rahman, M.T.U.; Tabassum, F.; Rasheduzzaman, M.; Saba, H.; Sarkar, L.; Ferdous, J.; Uddin, S.Z.; Zahedul Islam, A.Z.M. Temporal dynamics of land use/land cover change and its prediction using CA-ANN model for southwestern coastal Bangladesh. Env. Monit. Assess. 2017, 189, 565. [Google Scholar] [CrossRef] [PubMed]
- Dong, H.; Huang, Q.; Zhang, F.; Lu, X.; Zhang, Q.; Cao, J.; Gen, L.; Li, N. Path of carbon emission reduction through land use pattern optimization under future scenario of multi-objective coordination. Front. Environ. Sci. 2022, 10, 1065140. [Google Scholar] [CrossRef]
- Liang, X.; Guan, Q.; Clarke, K.C.; Liu, S.; Wang, B.; Yao, Y. Understanding the drivers of sustainable land expansion using a patch-generating land use simulation (PLUS) model: A case study in Wuhan, China. Comput. Environ. Urban Syst. 2021, 85, 101569. [Google Scholar] [CrossRef]
- Wu, R.; Lan, H.; Cao, Y.; Li, P. Optimization of low-carbon land use in Chengdu based on multi-objective linear programming and the future land use simulation model. Front. Environ. Sci. 2022, 10, 989747. [Google Scholar] [CrossRef]
- Nie, W.; Xu, B.; Yang, F.; Shi, Y.; Liu, B.; Wu, R.; Lin, W.; Pei, H.; Bao, Z. Simulating future land use by coupling ecological security patterns and multiple scenarios. Sci. Total Environ. 2023, 859 Pt 1, 160262. [Google Scholar] [CrossRef]
- Guo, P.; Zhang, F.; Wang, H. The response of ecosystem service value to land use change in the middle and lower Yellow River: A case study of the Henan section. Ecol. Indic. 2022, 140, 109019. [Google Scholar] [CrossRef]
- Zhang, X.; Zhou, Y.; Long, L.; Hu, P.; Huang, M.; Xie, W.; Chen, Y.; Chen, X. Simulation of land use trends and assessment of scale effects on ecosystem service values in the Huaihe River basin, China. Environ. Sci. Pollut. Res. Int. 2023, 30, 58630–58653. [Google Scholar] [CrossRef] [PubMed]
- Li, C.; Wu, Y.; Gao, B.; Zheng, K.; Wu, Y.; Li, C. Multi-scenario simulation of ecosystem service value for optimization of land use in the Sichuan-Yunnan ecological barrier, China. Ecol. Indic. 2021, 132, 108328. [Google Scholar] [CrossRef]
- Wang, W.; Jiao, L.; Jia, Q.; Liu, J.; Mao, W.; Xu, Z.; Li, W. Land use optimization modelling with ecological priority perspective for large-scale spatial planning. Sustain. Cities Soc. 2021, 65, 102575. [Google Scholar] [CrossRef]
- Gu, M.; Ye, C.; Li, X.; Hu, H. Land-Use Optimization Based on Ecosystem Service Value: A Case Study of Urban Agglomeration around Poyang Lake, China. Sustainability 2022, 14, 7131. [Google Scholar] [CrossRef]
- Li, R.; Shi, Y.; Feng, C.-C.; Guo, L. The spatial relationship between ecosystem service scarcity value and urbanization from the perspective of heterogeneity in typical arid and semiarid regions of China. Ecol. Indic. 2021, 132, 108299. [Google Scholar] [CrossRef]
- Zhang, C.; Bai, Y.; Yang, X.; Gao, Z.; Liang, J.; Chen, Z. Scenario analysis of the relationship among ecosystem service values—A case study of Yinchuan Plain in northwestern China. Ecol. Indic. 2022, 143, 109320. [Google Scholar] [CrossRef]
- Hasan, S.S.; Zhen, L.; Miah, M.G.; Ahamed, T.; Samie, A. Impact of land use change on ecosystem services: A review. Environ. Dev. 2020, 34, 100527. [Google Scholar] [CrossRef]
- Tan, Z.; Guan, Q.; Lin, J.; Yang, L.; Luo, H.; Ma, Y.; Tian, J.; Wang, Q.; Wang, N. The response and simulation of ecosystem services value to land use/land cover in an oasis, Northwest China. Ecol. Indic. 2020, 118, 106711. [Google Scholar] [CrossRef]
- Xin, L.J.; Wang, J.Y.; Wang, L.X. Prospect of per capita grain demand driven by dietary structure change in China. Resour. Sci. 2015, 37, 1347–1356. [Google Scholar]
- Pontius, R.G.; Millones, M. Death to Kappa: Birth of quantity disagreement and allocation disagreement for accuracy assessment. Int. J. Remote Sens. 2011, 32, 4407–4429. [Google Scholar] [CrossRef]
- Penny, J.; Ordens, C.M.; Barnett, S.; Djordjevic, S.; Chen, A.S. Small-scale land use change modelling using transient groundwater levels and salinities as driving factors—An example from a sub-catchment of Australia’s Murray-Darling Basin. Agric. Water Manag. 2023, 278, 108174. [Google Scholar] [CrossRef]
- Xie, G.D.; Zhen, L.; Lu, C.X.; Xiao, Y.; Chen, C. Expert Knowledge Based Valuation Method of Ecosystem Services in China. J. Nat. Resour. 2008, 23, 911–919. [Google Scholar]
- Costanza, R.; dArge, R.; deGroot, R.; Farber, S.; Grasso, M.; Hannon, B.; Limburg, K.; Naeem, S.; Oneill, R.V.; Paruelo, J.; et al. The value of the world’s ecosystem services and natural capital. Nature 1997, 387, 253–260. [Google Scholar] [CrossRef]
- Xie, G.D.; Lu, C.X.; Len, Y.F.; Zheng, D.; Li, S.C. Ecological assets valuation of the Tibetan Plateau. J. Nat. Resour. 2003, 18, 189–196. [Google Scholar]
- Li, X.S.; Zhu, Y.M.; Zhao, L.; Tian, J.J.; Li, J. Ecosystem services value change in Qinglong County from dynamically adjusted value coefficients. Chin. J. Eco-Agric. 2015, 23, 373–381. [Google Scholar]
- Bai, X.F.; Chen, H.W. The changes of ecosystem services and their values in various constructions of land use—A case study from Yijinhuoluo County of Inner Mogolia. Chin. J. Eco-Agric. 2004, 12, 185–187. [Google Scholar]
- Liang, X.; Liu, X.; Li, X.; Chen, Y.; Tian, H.; Yao, Y. Delineating multi-scenario urban growth boundaries with a CA-based FLUS model and morphological method. Landsc. Urban Plan. 2018, 177, 47–63. [Google Scholar] [CrossRef]
- Wang, Y.; Zhang, Z.; Chen, X. Spatiotemporal change in ecosystem service value in response to land use change in Guizhou Province, southwest China. Ecol. Indic. 2022, 144, 109514. [Google Scholar] [CrossRef]
- Shi, J.; Li, S.; Song, Y.; Zhou, N.; Guo, K.; Bai, J. How socioeconomic factors affect ecosystem service value: Evidence from China. Ecol. Indic. 2022, 145, 109589. [Google Scholar] [CrossRef]
- Chen, P.; Xu, H.; Chen, S.; Shang, Y.; Zhang, B.; Zhao, X. Developing a System Framework for China’s Natural Resources Balance Sheet from the Perspective of Sustainable Development. Front. Environ. Sci. 2022, 9, 807092. [Google Scholar] [CrossRef]


| Category | Data Name | Year | Resolution | Data Sources and Data Processing |
|---|---|---|---|---|
| Land use | Land survey data | 2000, 2010, 2020 | Vector | Ningxia Department of Natural Resources. |
| Socio-economic statistics data | Population, GDP, Grain yield, Planting area, Food prices, Output value of agriculture, forestry, animal husbandry, and fishery | 2010–2020 | Non-spatial data | Ningxia Statistical Yearbook 2010–2020 (https://tj.nx.gov.cn/) (accessed on 20 October 2022) Ningxia Grain and Material Reserve Bureau (http://lswz.nx.gov.cn/) (accessed on 15 March2023) |
| Socio-economic spatial data | Population density | 2019 | 1 km | Resource and Environmental Science and Data Center (http://www.resdc.cn) (accessed on 30 October 2022) |
| GDP | 2019 | 1 km | ||
| Nighttime light intensity | 2020 | 0.004° | ||
| Climate and environmental data | Average annual precipitation, Average annual ground temperature, Average annual evaporation, Soil type | 1960–2010 | 1 km | Resource and Environment Sciences and Data Center (http://www.resdc.cn) (accessed on 30 October 2022) |
| Spatial accessibility data | Distance to rural settlements | 2020 | 30 m | The range of settlements and towns was extracted from the 2020 Land Change Survey data. The range of development zones was extracted from the 2020 Land Intensification Evaluation data of development zones. The data on roads and rivers were extracted from geographic state monitoring. The distances to rural settlements, towns, open economic zones, major rivers, railroads, national roads, provincial roads, and other roads are calculated in ArcGIS with the “near” tool. |
| Distance to town | 2020 | 30 m | ||
| Distance to open economic zone | 2020 | 30 m | ||
| Distance to major rivers | 2020 | 30 m | ||
| Distance to railroads, national roads, provincial roads, and other roads | 2020 | 30 m | ||
| Spatial constraints data | Permanent basic farmland | 2022 | Vector | Ningxia Territorial Spatial Planning (2021–2035) |
| Urban development boundary | 2022 | Vector | ||
| Key projects | 2021–2035 | Vector | Outline of the 14th Five-Year Plan and Vision 2035 |
| Primary Classification | Secondary Classification | ESV (109 CNY) | ESV Relative Changes (%) | ||||||||||
|---|---|---|---|---|---|---|---|---|---|---|---|---|---|
| 2000 | 2010 | 2020 | ND | RED | ELP | SD | 2000–2020 | 2020–ND | 2020–RED | 2020–ELP | 2020–SD | ||
| Supply services | Food production | 59.27 | 63.48 | 64.03 | 65.54 | 66.44 | 64.80 | 64.55 | 8.02 | 2.37 | 3.76 | 1.21 | 0.81 |
| Raw material | 72.43 | 86.83 | 97.95 | 105.48 | 105.49 | 127.77 | 125.47 | 35.24 | 7.69 | 7.70 | 30.45 | 28.10 | |
| Regulating service | Air regulation | 166.68 | 180.98 | 194.68 | 199.20 | 197.57 | 227.42 | 224.08 | 16.80 | 2.32 | 1.48 | 16.82 | 15.10 |
| Climate regulation | 184.61 | 198.46 | 210.45 | 214.10 | 213.56 | 240.25 | 237.10 | 14.00 | 1.73 | 1.48 | 14.16 | 12.66 | |
| Water conservation | 194.85 | 201.65 | 205.79 | 201.82 | 205.97 | 236.57 | 230.73 | 5.62 | −1.93 | 0.09 | 14.96 | 12.12 | |
| Waste treatment | 169.92 | 170.93 | 167.81 | 162.42 | 166.90 | 175.12 | 171.90 | −1.24 | −3.21 | −0.54 | 4.35 | 2.43 | |
| Supporting services | Soil formation and protection | 227.89 | 238.83 | 249.39 | 250.51 | 248.66 | 271.80 | 268.69 | 9.44 | 0.45 | −0.29 | 8.99 | 7.74 |
| Biodiversity conservation | 210.68 | 223.16 | 235.25 | 238.13 | 237.05 | 266.03 | 262.55 | 11.66 | 1.22 | 0.76 | 13.08 | 11.60 | |
| Cultural services | Recreation and culture | 98.22 | 102.46 | 107.86 | 107.90 | 107.34 | 121.43 | 120.01 | 9.81 | 0.04 | −0.48 | 12.58 | 11.27 |
| total | 1384.55 | 1466.79 | 1533.22 | 1545.10 | 1548.98 | 1731.19 | 1705.08 | 10.74 | 0.78 | 1.03 | 12.91 | 11.21 | |
Disclaimer/Publisher’s Note: The statements, opinions and data contained in all publications are solely those of the individual author(s) and contributor(s) and not of MDPI and/or the editor(s). MDPI and/or the editor(s) disclaim responsibility for any injury to people or property resulting from any ideas, methods, instructions or products referred to in the content. |
© 2024 by the authors. Licensee MDPI, Basel, Switzerland. This article is an open access article distributed under the terms and conditions of the Creative Commons Attribution (CC BY) license (https://creativecommons.org/licenses/by/4.0/).
Share and Cite
Shu, R.; Wang, Z.; Guo, N.; Wei, M.; Zou, Y.; Hou, K. Multi-Scenario Land Use Optimization Simulation and Ecosystem Service Value Estimation Based on Fine-Scale Land Survey Data. Land 2024, 13, 557. https://doi.org/10.3390/land13040557
Shu R, Wang Z, Guo N, Wei M, Zou Y, Hou K. Multi-Scenario Land Use Optimization Simulation and Ecosystem Service Value Estimation Based on Fine-Scale Land Survey Data. Land. 2024; 13(4):557. https://doi.org/10.3390/land13040557
Chicago/Turabian StyleShu, Rui, Zhanqi Wang, Na Guo, Ming Wei, Yebin Zou, and Kun Hou. 2024. "Multi-Scenario Land Use Optimization Simulation and Ecosystem Service Value Estimation Based on Fine-Scale Land Survey Data" Land 13, no. 4: 557. https://doi.org/10.3390/land13040557
APA StyleShu, R., Wang, Z., Guo, N., Wei, M., Zou, Y., & Hou, K. (2024). Multi-Scenario Land Use Optimization Simulation and Ecosystem Service Value Estimation Based on Fine-Scale Land Survey Data. Land, 13(4), 557. https://doi.org/10.3390/land13040557