1. Introduction
Agricultural production and biodiversity conservation have long been considered antagonistic. Protected areas have conventionally been designed to set aside land for conservation with restricted access, while land conversion to agriculture was thought to lead to natural habitat loss or degradation. Now reaching the world’s finite land boundaries, agriculture and conservation can no longer compete and instead must be reconciled in order to identify trade-offs between them [
1,
2,
3]. Recent recognition of their mutual interdependence—the potential of agricultural areas for conservation as well as the role of biodiversity for agricultural production [
4]—highlights the possibility that these two contrasted land-uses can benefit from each other. The land sharing
vs. land sparing debate [
5] has generated useful knowledge on the pros and cons of conservation in heterogeneous landscapes and is seen as a useful framework for making land-use decisions addressing the trade-offs between food production and biodiversity conservation [
1].
Multipurpose landscapes can be defined as areas that can simultaneously produce several commodities, e.g., food and wood, or can have several uses, e.g., agricultural production and nature conservation. The multipurpose nature of such areas also refers to the fact that they can also provide a range of other services which are normally not included in market mechanisms, e.g., ecosystem services such as carbon capture, pollination, or offsetting environmental externalities, e.g., pollution. A multipurpose landscape is also relevant to deal with public policy and collective action initiatives (e.g., farming practices, construction of infrastructures) and to address the management of public goods such as water or biodiversity [
6]. In recent literature about innovative land management options, landscapes are seen as an operational scale for understanding and shaping the relationship between society and the environment [
7] and landscape approaches are recommended to reconcile conservation and development trade-offs [
8,
9]. The integration between conservation and development is easier at scales larger than a plot, a farm or even a protected area, making landscape-based approaches useful to identify synergies and trade-offs between competing land-uses and allowing to link local initiatives with larger-scale national and regional processes [
10].
Ecoagriculture—“a fully integrated, landscape-level approach to agriculture, conservation and rural livelihoods” [
3]—has been proposed as an answer to the challenge of combining land uses at landscape level. Building from similar earlier concepts, including sustainable agriculture, agroecology and integrated resource management, ecoagriculture focuses on the synergy existing between conservation, production and livelihoods as the three main components of integrated multipurpose landscapes, working at a large scale, both spatial and temporal [
11]. Ecoagriculture landscapes are land use mosaics with natural areas and agricultural production areas, as well as other landscape features (such as inhabited land), both configured and managed to have a neutral or positive impact on each other, and integrating institutional mechanisms as a fourth component required for coordination at the landscape level [
12]. When such positive interactions occur between the multiple units of a landscape mosaic, these heterogeneous landscapes become more than the sum of their parts.
In ecoagriculture, special importance is given to biodiversity conservation, which must be integrated into the agricultural and rural development per se, but must also be recognized as productive, for example when it supports natural or semi-natural habitats for useful species such as pollinators. In fact, besides the protection of wild biodiversity often considered as an ethical imperative, conservation within an ecoagriculture landscape supports ecosystem services [
3],
i.e., the multiple benefits humans obtain from ecosystems [
4]. They range from provision of food and fresh water, carbon sequestration and pollination, to aesthetics and spirituality. Although essential for human well-being, their decline in both natural and human-modified ecosystems was noted by the Millennium Ecosystem Assessment [
4], insisting on the urgent need to protect or restore ecosystem services. Virtually all types of landscapes, from human-dominated agricultural landscapes to wilderness areas, can provide ecosystem services. Strategic goal D of the Aichi Biodiversity Targets highlights the need to “enhance the benefits to all from biodiversity and ecosystem services”. Target 14 specifically insists on safeguarding ecosystems that provide essential services [
13].
A much-debated approach to translate the non-market value of ecosystem services into financial incentives is the so-called “Payments for Ecosystem Services” (PES) schemes which compensate landowners or managers for management strategies that provide ecosystem benefits to other parties [
14,
15]. PES are defined as (a) a voluntary transaction where (b) a well-defined ecosystem service or a land use likely to secure that service (c) is bought by an ecosystem service buyer (d) from an ecosystem service provider (e) only if the service provision is secured (conditionality) [
16,
17]. A simpler definition goes as follows: A PES pays an economic operator for a service provided to other operators by means of a deliberate action aimed at preserving, restoring or increasing an agreed environmental service [
18]. By including environmental objectives in land use decisions, PES make a connection between the maintenance and restoration of ecosystem functions and improvements in living conditions, or even poverty alleviation. Watershed protection, atmospheric carbon fixation by plants and biodiversity conservation are classic examples of PES.
One of the problems of the PES approach is the difficulty of defining and monitoring ecosystem services—necessary to ensure conditionality—or simply of finding a willing buyer. Other limiting factors of PES schemes include the evaluation of opportunity costs, used as a questionable proxy for ecosystem services values, as well as the high transaction costs often involved in the payments thus limiting their implementation on the ground. Moreover, although designed to secure environmental protection and to alleviate poverty, PES face the challenge of distributing benefits widely and avoiding societal conflicts over land-use [
15,
19]. In view of these limitations, and given the recognized importance of the landscape scale, Ghazoul
et al. [
14] proposed a new approach called “landscape labelling”, which combines environmental certification principles with PES ideas.
Certification is the process of indicating through labelling that a commodity complies with a set of regulations governing a production process [
14]. It can be used to reach various goals. Some well-known examples focus on achieving social or environmental efficiency, such as fair trade and eco-labels, through the determination of minimum performance requirements—fair trade coffee and Forest Stewardship Council certifications for instance [
20]. Geographical Origin labels are also a form of certification. The landscape labelling approach is based on the recognition and reward of ecosystem services provided by a landscape through certification principles. The certification goal of a landscape label is therefore the sustainable delivery of a wide variety of ecosystem services, which can also constitute criteria for its granting process [
14]. In the landscape labelling approach, certification is not applied to a specific product but rather at the whole landscape level, thus potentially generating added-value not only to a specific commodity, but potentially to all commodities or services (e.g., ecotourism, lodging) originating in the landscape in question.
As any other market tool, a landscape label can create or give access to niche markets, increase product recognition and/or secure price premiums. In this overall approach, opportunity is also provided for minor products to attain market benefits by association with commercially important ones. A landscape label based on ecosystem services delivery offers other benefits going beyond PES schemes’ issues, including reduced transaction costs and improved inclusivity (see [
14] for a detailed list and explanations). The question of who is paying for ecosystem services, namely the willing buyer in PES schemes, also becomes irrelevant under landscape certification principles for the provision of ecosystem services is indirectly rewarded through the added value paid by consumers.
Guided by the principles presented by Ghazoul
et al. [
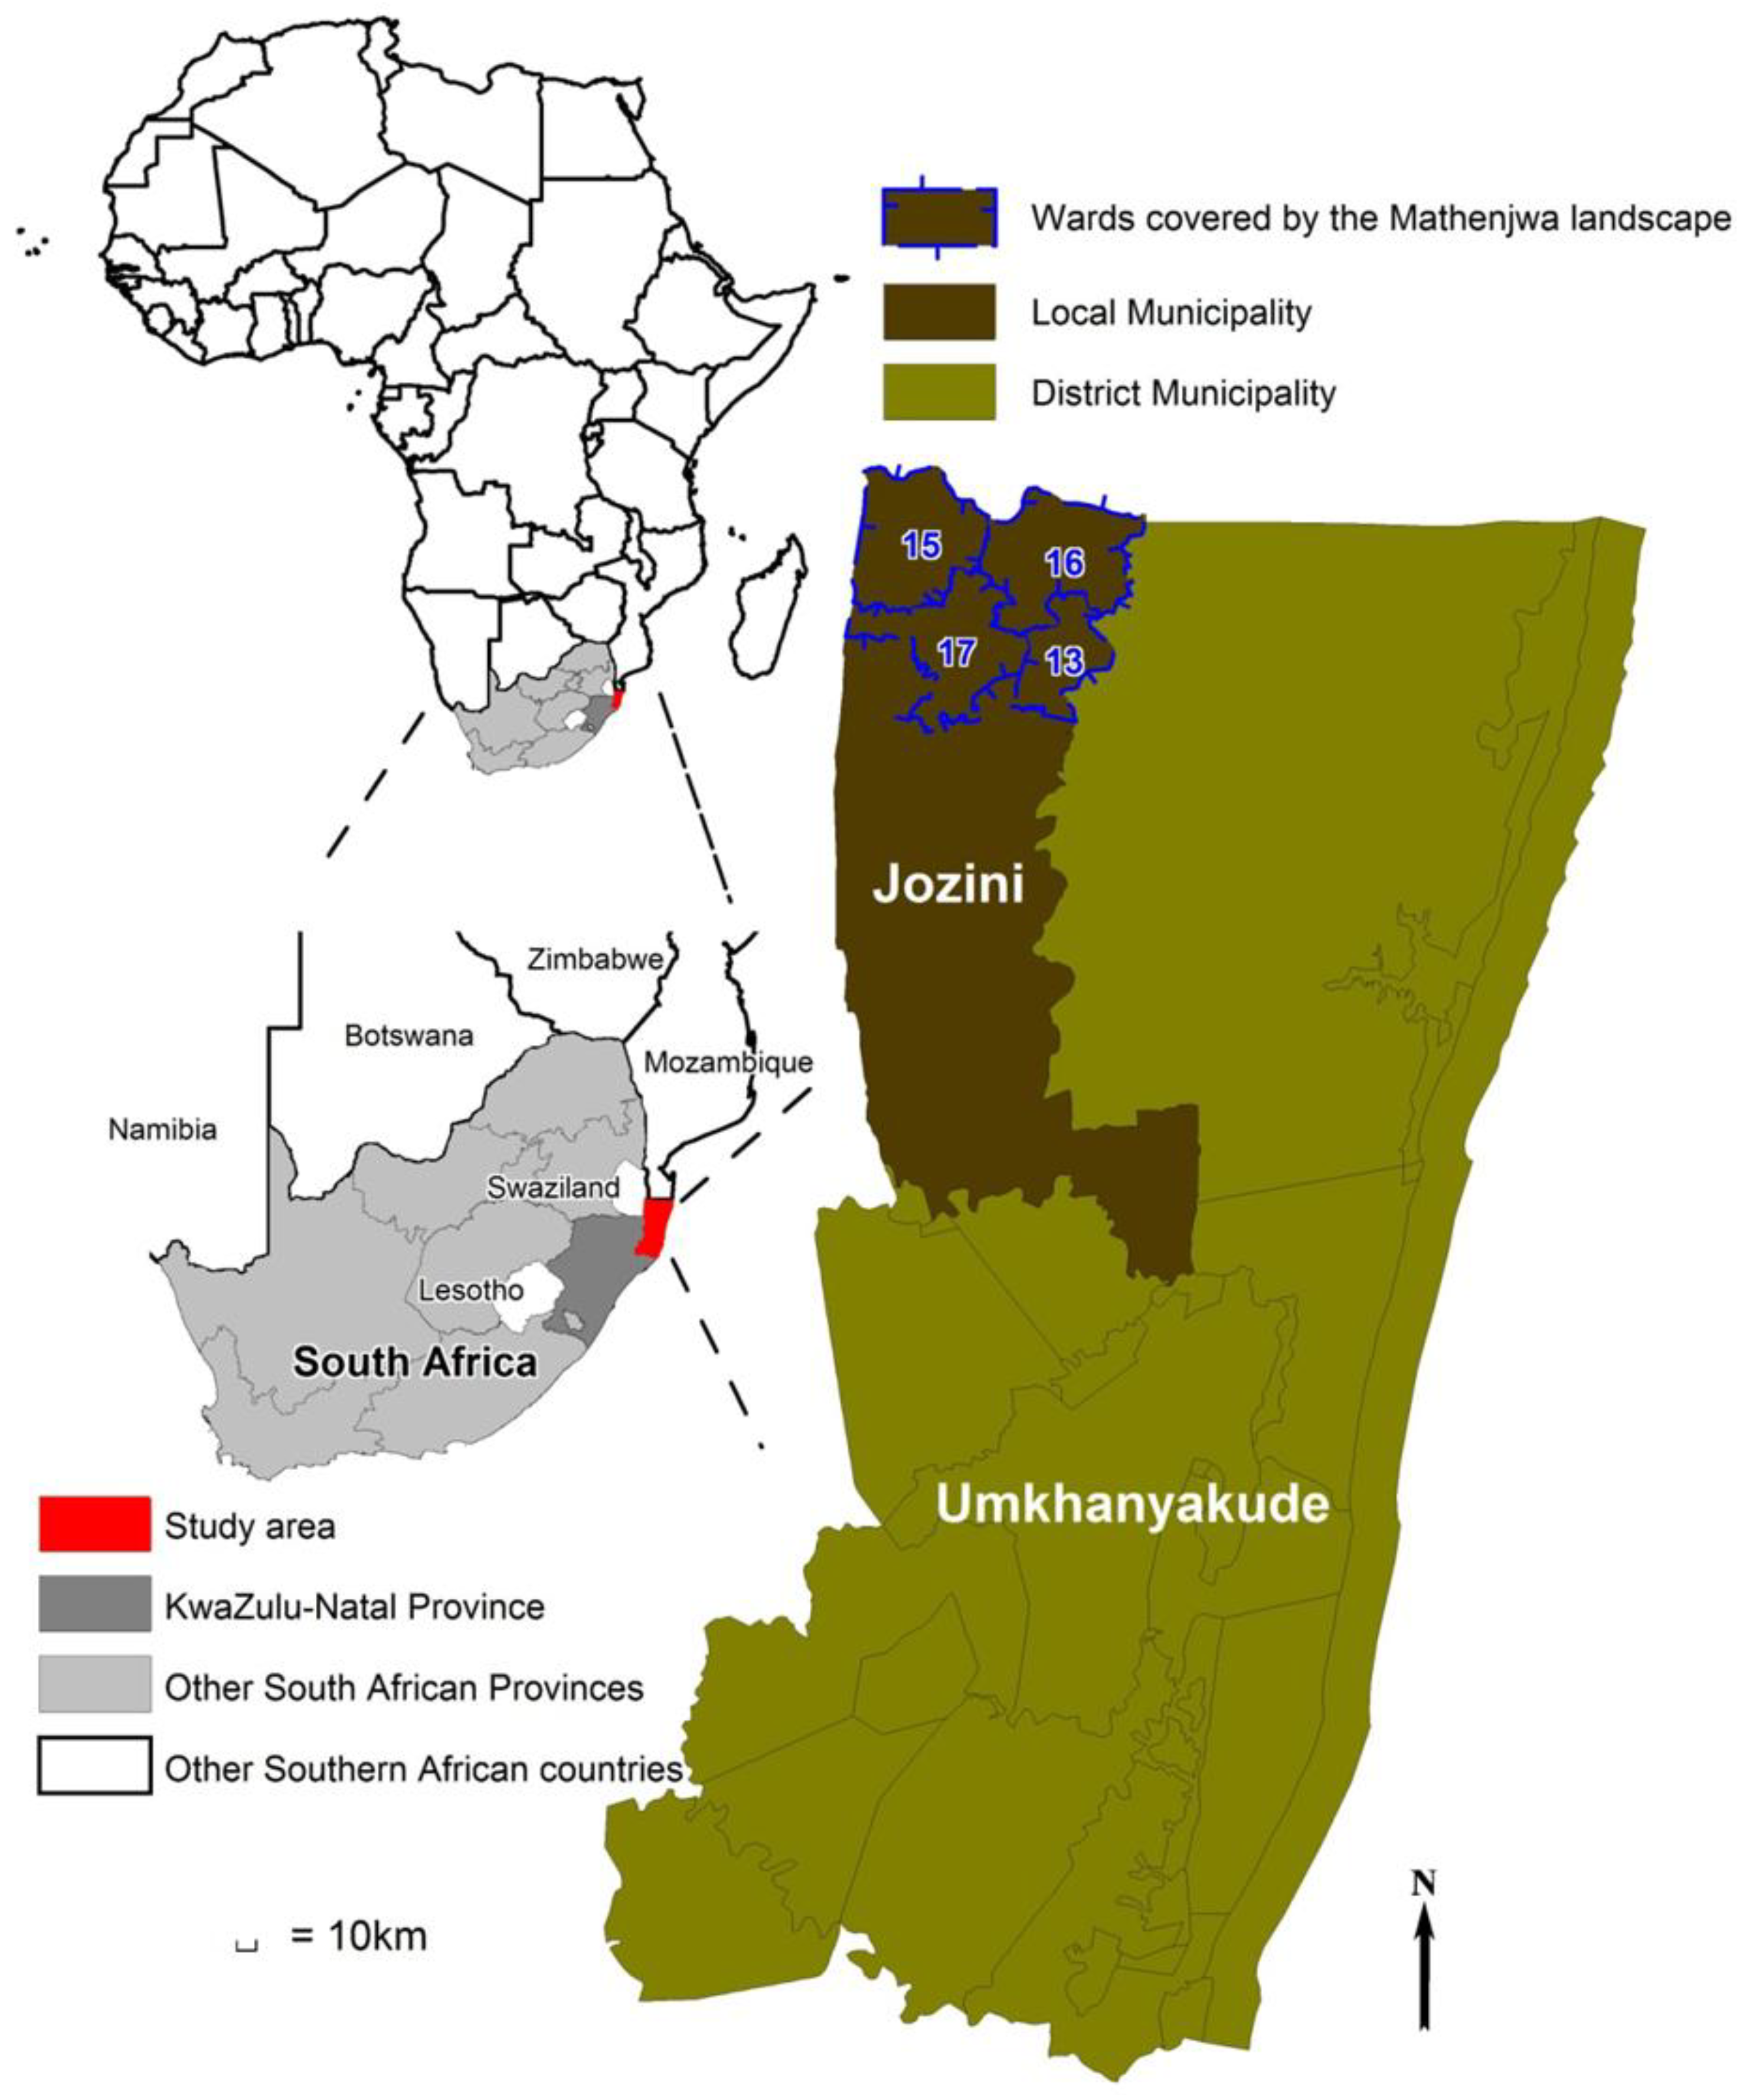
14], we investigated the feasibility of combining PES and landscape labelling through the design of a “landscape label” and its testing in two contrasting multipurpose landscapes in Southern Africa: a former South African homeland showing characteristics of an ecoagriculture mosaic on the one hand, and a Zimbabwean conservancy where small scale farming is found in proximity to formal wildlife conservation areas on the other hand. Specifically, we designed a composite index describing landscape conditions in terms of production, conservation, institutions, well-being and ecosystem services and we compared index values obtained from answers to a questionnaire implemented with a variety of stakeholders. The main hypotheses behind our work were (1) that landscape structure, ecosystem services and consequently the value of the labelling index, are influenced by farmers’ and other stakeholders’ points of view; and (2) that there should be a positive correlation between landscape heterogeneity and index value. Our two studies areas are each located in a “TransFrontier Conservation Area (TFCA)”,
i.e., areas straddling across the boundaries of two or more countries and designed to associate objectives of nature conservation as well as multiple resource use areas [
21]. As such, TFCAs incorporate both human dwellings (typically farms and villages) as well as natural and/or protected areas.
3. Results
At site level (KZN
vs. SVC), the analysis of ELP and ES variance as a function of site, of stakeholder, or of the interaction between site and stakeholder, did not reveal any significant difference (
Table 3). Based on those means, the overall landscape index (LI) did not show any significant difference across sites either.
Table 3.
Means of ELP and ES sub-indices values across sites as a function of stakeholders. ES, Ecosystem Services; ELP, Ecoagriculture Landscape Performance; KZN, KwaZulu-Natal; SVC, Savé Valley Conservancy.
Table 3.
Means of ELP and ES sub-indices values across sites as a function of stakeholders. ES, Ecosystem Services; ELP, Ecoagriculture Landscape Performance; KZN, KwaZulu-Natal; SVC, Savé Valley Conservancy.
| | | Farmers | Other Experts |
|---|
| KZN | ELP | 0.6563 | 0.5277 |
| ES | 0.7097 | 0.6821 |
| Overall landscape index LI | 0.6439 |
| SVC | ELP | 0.5875 | 0.5313 |
| ES | 0.6996 | 0.5687 |
| Overall landscape index LI | 0.5967 |
When taking into account categories within the ELP and ES sub-indices, some statistically significant differences appeared. In South Africa (KZN site;
Table 4), categories within the ELP sub-index showed a difference between stakeholders, with Farmers > Other experts (indicating that farmers give ecoagriculture (ELP) criteria a higher importance than other key stakeholders do). There were also differences among categories within the ES sub-index, with Cultural > Provisioning > Regulating (indicating a higher importance given to cultural services). The lowest score was given by the other experts group for the institution category while the highest was given by farmers for cultural services (
Table 4).
In Zimbabwe (SVC site;
Table 5), ELP sub-index values showed differences between categories (Farmers > Other experts and Conservation > Institutions = Production > Livelihood). ES sub-index values showed differences between stakeholders (Farmers > Other experts) and between categories (Cultural > Provisioning = Regulating). Thus, in Zimbabwe as well as in South Africa, farmers tend to give higher scores than other stakeholders and cultural ecosystem services consistently rank higher than other services at both sites. The lowest score at the SVC site is given to the livelihood category by the other experts group while the highest is given by farmers for cultural services (
Table 5).
Table 4.
Means of ELP and ES sub-index values at the KZN site (standard deviation in brackets). ES, Ecosystem Services; ELP, Ecoagriculture Landscape Performance; KZN, KwaZulu-Natal.
Table 4.
Means of ELP and ES sub-index values at the KZN site (standard deviation in brackets). ES, Ecosystem Services; ELP, Ecoagriculture Landscape Performance; KZN, KwaZulu-Natal.
| | ELP | p-Value (Stakeholder Effect) |
|---|
| Farmers | Other Experts |
|---|
| Conservation | 0.6611 (±0.0411) | 0.6607 (±0.0466) | <0.0001 |
| Production | 0.6528 (±0.0411) | 0.4857 (±0.0466) |
| Livelihoods | 0.6972 (±0.0411) | 0.5143 (±0.0466) |
| Institutions | 0.6139 (±0.0411) | 0.4500 (±0.0466) |
| Means | 0.6562 | 0.5275 |
| | ES | Means |
| Provisioning | 0.7380 (±0.0274) | 0.6632 (±0.0311) | 0.7006 |
| Regulating | 0.5868 (±0.0257) | 0.6250 (±0.0291) | 0.6059 |
| Cultural | 0.8667 (±0.0325) | 0.8000 (±0.0368) | 0.8333 |
| p-value (category effect) | <0.0001 | |
Finally, when analysing ES and ELP criteria at site level, based on individual data points, there was a difference between South Africa and Zimbabwe for ES (KZN > SVC) but not for ELP, and a significantly higher value for the overall LI index value at the KZN site (
Table 6). However, when analysed by stakeholder (Farmers
vs. Other experts;
Table 7), ES criteria appeared to be higher in KZN only for the other experts group while it was ELP criteria which were higher, also in KZN, but for farmers. In other words, the difference between the two sites is due to a stakeholder effect.
Table 5.
Means of ELP and ES sub-index values at the SVC site (standard deviation in brackets). ES, Ecosystem Services; ELP, Ecoagriculture Landscape Performance; SVC, Savé Valley Conservancy.
Table 5.
Means of ELP and ES sub-index values at the SVC site (standard deviation in brackets). ES, Ecosystem Services; ELP, Ecoagriculture Landscape Performance; SVC, Savé Valley Conservancy.
| | ELP | p-Value (Interaction Effect) |
|---|
| Farmers | Other Experts | Means |
|---|
| Conservation | 0.5716 (±0.0374) | 0.7250 (±0.0724) | 0.6483 | 0.0052 |
| Production | 0.5533 (±0.0374) | 0.5625 (±0.0724) | 0.5579 |
| Livelihoods | 0.5566 (±0.0374) | 0.3750 (±0.0724) | 0.4658 |
| Institutions | 0.6683 (±0.0374) | 0.4625 (±0.0724) | 0.5654 |
| Means | 0.5874 | 0.5312 | |
| | ES | p-Value (Category Effect) |
| Farmers | Other Experts | Means |
| Provisioning | 0.6476 (±0.0300) | 0.5446 (±0.0581) | 0.5961 | 0.0023 |
| Regulating | 0.6989 (±0.0280) | 0.5000 (±0.0543) | 0.5994 |
| Cultural | 0.7733 (±0.0355) | 0.7125 (±0.0697) | 0.7429 |
| Means | 0.7066 | 0.5857 | |
| p-value (stakeholder effect) | 0.0056 | | |
Table 6.
Means of overall ES and ELP sub-indices across sites. ES, Ecosystem Services; ELP, Ecoagriculture Landscape Performance; KZN, KwaZulu-Natal; SVC, Savé Valley Conservancy.
Table 6.
Means of overall ES and ELP sub-indices across sites. ES, Ecosystem Services; ELP, Ecoagriculture Landscape Performance; KZN, KwaZulu-Natal; SVC, Savé Valley Conservancy.
| | ELP | ES | LI |
|---|
| KZN | 0.5919 | 0.7132 | 0.6526 |
| SVC | 0.5593 | 0.6461 | 0.6028 |
| p-value (site effect) | | | 0.0055 |
Table 7.
Means of ES and ELP sub-indices across sites by stakeholder. ES, Ecosystem Services; ELP, Ecoagriculture Landscape Performance; KZN, KwaZulu-Natal; SVC, Savé Valley Conservancy.
Table 7.
Means of ES and ELP sub-indices across sites by stakeholder. ES, Ecosystem Services; ELP, Ecoagriculture Landscape Performance; KZN, KwaZulu-Natal; SVC, Savé Valley Conservancy.
| | Farmers | Other Experts |
|---|
| | ELP | ES | ELP | ES |
| KZN | 0.6563 | 0.7305 | 0.5277 | 0.6961 |
| SVC | 0.5875 | 0.7066 | 0.5313 | 0.5857 |
| p-value (interaction effect) | 0.0252 |
Cultural services are ranked high at both landscapes, both by farmers and other experts. At the other end of the spectrum, it is by far the livelihood services at the SVC site which are ranked lowest, especially for the other experts group, indicating a serious concern here. This score (0.375;
Table 5) is the only one way below the median value (0.5). There is often a disagreement between farmers and other experts, for instance in the case of production, livelihood and institutions in the KZN site, where farmers consistently give a higher score. In the SVC landscape, ecosystems services are also ranked higher by the farmers.
4. Discussion
Results for the South African site (KZN landscape) confirm previous positive results on the feasibility of ecoagriculture and the delivery of ecosystem services in this area [
27,
28]. The KZN landscape is performing better than the Zimbabwean site (SVC landscape) due to a better assessment of ecosystem services components. However, these are better ranked only by the other experts group and not by farmers who rank ecoagriculture components higher. Analysis on the means, nevertheless, does not allow detecting interesting differences among components such as the fact that cultural services are consistently ranked high, by both farmers and other experts, and that other experts have a much lower assessment of ecoagriculture criteria than farmers. A first remark at this stage of the analysis is that contrasted views exist among people about what are the attributes and potential problems of a multipurpose landscape (e.g., 0.45 for institutions by the other experts group but 0.6139 by farmers). This tends to confirm our first hypothesis that index values are influenced by stakeholders. Does it reflect the fact that key stakeholders know institutions and their problems well? It is indeed congruent with other findings in the area [
29] indicating that existing institutions (e.g., Wildlife service; Ministry of agriculture) do not have any landscape-level actions and that the policy context poses a potential barrier to landscape-level management (e.g., inconsistencies between customary norms and public legislation). This could also be related to the complex tenure and governance system existing in the area, where several authorities coexist [
23]. Alternatively, the two groups of interviewees agree on the fact that the KZN landscape can provide cultural services, an interesting finding to be correlated with strong Zulu traditions in the area.
The results of the ES sub-index can be traced back to each category of ecosystem services. Especially well rated, the cultural and provisioning services are in fact the easiest to perceive for locals as well as for the other experts group. Cultural services are recognized as a tribal pride, and provisioning services, the most tangible ones (provisioning services are actually “goods”), are closely related to the natural resources which the inhabitants rely on for many purposes. Regulating services are more difficult to perceive and to understand which is probably part of the reason why this category receives a lower score from both groups. In summary, there seems not to be any specific ecoagriculture goal or ecosystem service severely lacking in the South African landscape except institutional support. Interestingly, farmers did perceive problems in terms of livelihoods and production while the other experts group did not.
The results for the Zimbabwean site (SVC landscape) do not confirm the feasibility of ecoagriculture and the delivery of ecosystem services as clearly as in the South African landscape, an expected finding due to lower landscape heterogeneity at this site. An extremely low score for the livelihood component (0.375, to be compared with the score of 0.725 given to the conservation component) under the ELP (ecoagriculture) sub-index value for the other experts group points out to a real problem in this area. As acknowledged during the fieldwork, living conditions are not satisfactory and the other experts group seems much more critical than the farmers on the livelihood aspect, which they can probably rate with more objectivity since it does not affect them directly. The nearby presence of wealthy neighbours, such as ranch owners or other industrial farmers, does worsen this perception. However, it must be noted that results from farmers and other experts are quite different and lead to different classifications of the ecoagriculture goals. On the institutions goal, this difference is striking, as it receives the highest score of the ecoagriculture goals from the farmers and a very low one from the other experts group.
Similar though less differentiated results can be found within the ES sub-index at the SVC site. Cultural services are similarly acknowledged by both groups but farmers rank provisioning services third and last while the other experts group ranks them second. As the most tangible ones being directly used by local populations, one would expect provisioning services to receive a higher score from the farmers. On the contrary, they receive their lowest score, indicating relative rarity. If available but not used by locals (if they can be substituted for instance), provisioning services should have been given a higher score by the other experts group. In parallel, regulating services receive a lower score from the other experts group, which tend to perceive them better than the farmers. This could be taken as an alert for regulating services. They may be at risk in a landscape where trees and other natural elements important to their functioning are disappearing fast in the non-protected areas. Most values thus consistently rank lower in Zimbabwe than in South Africa for most goals and categories.
Based on the above analysis, the KZN landscape performs better than the SVC landscape on both the ecoagriculture and the ecosystem services. The KZN landscape is thus “winning” in terms of potential for performing multiple functions over the SVC landscape (overall index value of 0.6526 vs. 0.6028). The better score given to institutions by farmers in the SVC landscape does not suffice to counterbalance the negative effect of several other scores. The KZN landscape offers better living conditions to its inhabitants. Based on the different classifications of the ecoagriculture goals within each landscape, it appears that although some conditions are not met for ecoagriculture to perform at its highest capacity in this landscape (e.g., the problem with institutions), the current landscape mosaic does bear elements of multifunctionality (e.g., interdependence between different land units used by farmers). On the contrary, the SVC landscape tends to gather all the necessary conditions (conservation, production and institutions) but functioning separately. Our second hypothesis linking landscape heterogeneity with a higher index value is thus confirmed.
The size and structure of the data base (five questions for each of the four ELP criteria but seven, eight and five questions respectively for the only three ES criteria) do not allow performing two-by-two comparisons between all individual scores across sites. The trends detected above are congruent with the fact that natural and semi-natural areas are much more common in the KZN landscape than in the SVC landscape, especially if considering those found outside the protected areas and available to the locals. It thus offers many cultural opportunities, as well as a wide diversity of actual natural “goods” (i.e., provisioning services) that can be used for various purposes. The KZN people rely a lot on these provisioning services, used in the daily life, but also on the cultural ones for religious purposes for instance. In the SVC landscape, although engaged in activities involving the natural ecosystem (mainly agriculture or wildlife tourism), the inhabitants seem much more independent from their natural environment and the services it delivers, provisioning or cultural. Based on these preliminary results, it appears that if a selection for further ecoagriculture development (i.e., strengthening the natural heterogeneity of the landscape mosaic) were to be made, the KZN landscape would be the best option.
The scoring process described here has thus been able to reveal important differences between the two landscapes. An index (
i.e., a quantitative figure), possibly broken down into sub-index values, can be used to decide whether or not a given landscape can be “labelled”. However, any labelling or certification index must be considered as a single piece of a much broader and more complex labelling process. Product labelling, and by extension, landscape labelling, require taking into account many more aspects, and that they be more precisely studied than the ones considered here. For instance, stakeholders and institutions are a central element of any labelling process: Their willingness to participate and their involvement determine the outcome of the process [
30]. As for any labelling process, an independent auditing mechanism also needs to be set up.
Other aspects impacting the issue of the labelling process include the overall situation within the landscape, especially when different individual or collective stakeholders pursue different and sometimes conflicting interests. For instance, conflicts over land or between authorities are not directly integrated within the index, although they would be critical for the implementation of a labelling process. In fact, although the overall situation within the KZN landscape seems positive, specific conflicts over the land exist, leading to severe concerns. For instance, the Ndumo Game Reserve, a protected area managed by the provincial nature conservation service, faces land claims and illegal poaching issues. In parallel, production of marketable goods is currently low in the KZN landscape. Handicraft is not common, and often limited to household use. However, the potential for all types of tourism (ecotourism, adventure tourism and rural or cultural tourism) seems extremely high given the rather wealthy middle class present in South Africa. This tourism potential has been identified by the Jozini Local Municipality as a priority for the development of the area, and confirmed by some key informants. A feasibility study for an adventure tourism project has also already been conducted [
31], but not implemented so far.
In Zimbabwe, observations in the field and discussions with farmers as well as other experts render a very conflicting situation, with high tensions between these two categories of stakeholders. In fact, this situation is common in the country, where the black population is claiming rights over the land held by white farmers, sometimes violently. In the SVC landscape, the visible consequences of these conflicts are the illegal settlements taking place within the central protected area. Its boundaries are destroyed and its surface area is reduced, with negative consequences on the conservation aspect, but also for the invading and neighbouring population confronted to severe human-wildlife conflicts. Different levels of conflict exist, depending on the positive or negative relationships between the SVC ranch and the neighbouring wards.
To confirm the preliminary results presented here, further research needs to be carried out on actually measuring and calculating the ecoagriculture potential and current state of the landscapes, as well as the delivery of ecosystem services. In parallel, the creation of this specific new label will require further research on labelling and certification processes, while checking that the goods (commodities) and services (handicraft, tourism) possibly provided by the landscape would meet consumers’ expectations. Economic studies, based on the “willingness to pay” of consumers for the added-value of this specific label, will also help evaluate the potential benefits from its implementation. The economics from the PES approach will have to compare these expected benefits of the label to the opportunity costs. The “landscape approach” may look impractical to many practitioners in developing countries [
32] and thus requires improved research methods in spatial planning, livelihood monitoring and landscape governance.


