1. Introduction
Land-use change affects the environment on a global scale [
1,
2,
3]. The effects of urbanisation are apparent both on land and water [
4] leading to erosion and sediments [
5] deforestation and elevated greenhouse gas emissions [
6]. The effects also include loss of biodiversity and land degradation [
7]. Urban expansion results from a need to accommodate a growing population and economic development [
8,
9,
10,
11] and is growing constantly [
12]. A United Nations report (2010) [
13] indicates that approximately 50% of the world’s population live in urban areas and predicts that this proportion will reach 60% by 2030. Two-thirds of the future population will be living in developing countries [
14]. Therefore, problems caused by the future land-use change are being investigated, along with efforts to mitigate the impacts. These efforts included preventing urban sprawl and changing urban land use to protect citizens from environmentally related health problems.
Nakhon Ratchasima is a city in northeastern Thailand and has emerged as the centre of development for the northeastern part of the country in government, economy, education, medicine, and public health and transportation. The city’s location has historically been strategically important [
15,
16]. The Thai government recognised the city’s significance as a primary city for the northeastern region as part of the Fourth National Economic and Social Development Plan (1977–1981). This recognition contributed to the rapid growth of Nakhon Ratchasima, which continues to the present day [
16,
17]. A report published by Nakhon Ratchasima Municipality (2016) [
18] reported that its population density was as high as 3500.96 people per sq km. The city was ranked at the third most populous cities in Thailand following Bangkok and Nonthaburi metropolis [
19]. The calculation did not include non-registered residents, comprising 22% of the registered population. The city’s rapid expansion led to water shortages and losing agricultural lands [
15]. The city suffered from loss of green area by an average of 0.25 sq km/year, while community and built-up areas increased by an average of 0.35 sq km [
20]. Other related problems included drainage problems in urban areas [
21] and rising temperatures [
22].
Prediction of land-use change and urban growth are crucial to ensure sustainable urban development and many prediction models are available for this purpose. The models are such as the DINAMICA model for predicting landscape change [
23,
24] the MOLAND model for spatial planning in urban and regional development using land-use change database and human-related factors [
25,
26], the CLUE-S model for predicting land-use change in different types of environment [
27,
28] and the AVGWLF model for predicting spatial development in river basin areas [
29,
30]. However, these models are unsuitable for urban areas. For example, the DINAMICA model is not able to take into account the complexity of urban infrastructure and the CLUE-S model is not able to calculate the unpredictability of land-use changes in city areas. Therefore, these models are not considered sufficiently accurate to predict land-use changes in urban areas.
However, the CA-Markov model is widely accepted as an effective tool to predict changes in urban land use [
31,
32,
33,
34,
35,
36,
37]. The model was developed from the Cellular Automata model and the Markov model which were invented to predict land-use changes in complex and unpredictable urban areas [
34,
35,
36,
38]. The model takes into account complexities from human activities and state policy, making this model unique among comparable models. The CA-Markov model offers higher accuracy and closer predictions for specified scenarios. The model is also able to visualise land-use change as a result of the Cellular Automata model. Nowadays, the CA-Markov model is widely used to measure land-use change and land-use change prediction in urban areas. Research studies employing the model have been conducted to predict land-use change in different cities such as Changping in Beijing, China [
39], Dehradun in Uttarakhand, India [
33], Samsun, Turkey [
35], London, England [
37] and in the AMA region, north of Georgia, USA [
38]. Each study area has been continuously updated due to rapid economic development and associated continuous and complex changes in land use. Moreover, the CA-Markov model has proven its value as an operational model in predicting future land use and land cover scenarios [
35,
40]. In the process of urban utilisation forecasting, basic forecasting data are needed. Most studies are based on data obtained between 2-4 years such as Wang et al. [
39] using two satellite images from Landsat 5TM in 1988 and 1995 to predict the land-use change in Changping, China in 2000 using the Ca-Markov model. Huang et al. [
41] used two years of satellite images taken by Landsat in 1999 and 2002 to analyse the urban land use pattern in Wuhan city. Halmy et al. [
42] used satellite images from Landsat 5 in 1988, 1999 and 2011 to forecast land use areas of the northwest desert of Egypt in 2023. Lastly, Yang et al. [
43] used the data to forecast land-use change in Changping, Beijing in 2008 from the satellite images taken in 1988 and 1998. The satellite images were verified as suitable for both CA-Markov model and ACO model and for model accuracy, in order to the accuracy of the 2 models. The results showed that two years of the satellite data can verify model accuracy and suitable for predicting land-use changes. Moreover, Al-sharif & Pradhan [
44] and Aburas et al. [
45] used four satellite images to forecast land-use change in the two-year period by checking the accuracy of modelling and simulation as a database similar to Halmy et al. [
42] and Yang et al. [
43].
As a rapidly developing city in terms of urban space and economic growth, it is appropriate to use the CA-Markov model to predict land-use changes in Nakhon Ratchasima for the best possible outcomes. In this study, the CA-Markov model was used to predict and create land use maps for Nakhon Ratchasima in 2026 in two different scenarios. The study employed satellite images from Landsat-5 in 1992, Landsat-7 in 2002 and Theos in 2016 to analyse spatial land-use changes over the last two decades, predict future land use patterns and draft development policies to mitigate anticipated adverse impacts.
2. Materials and Methods
2.1. The Study Area
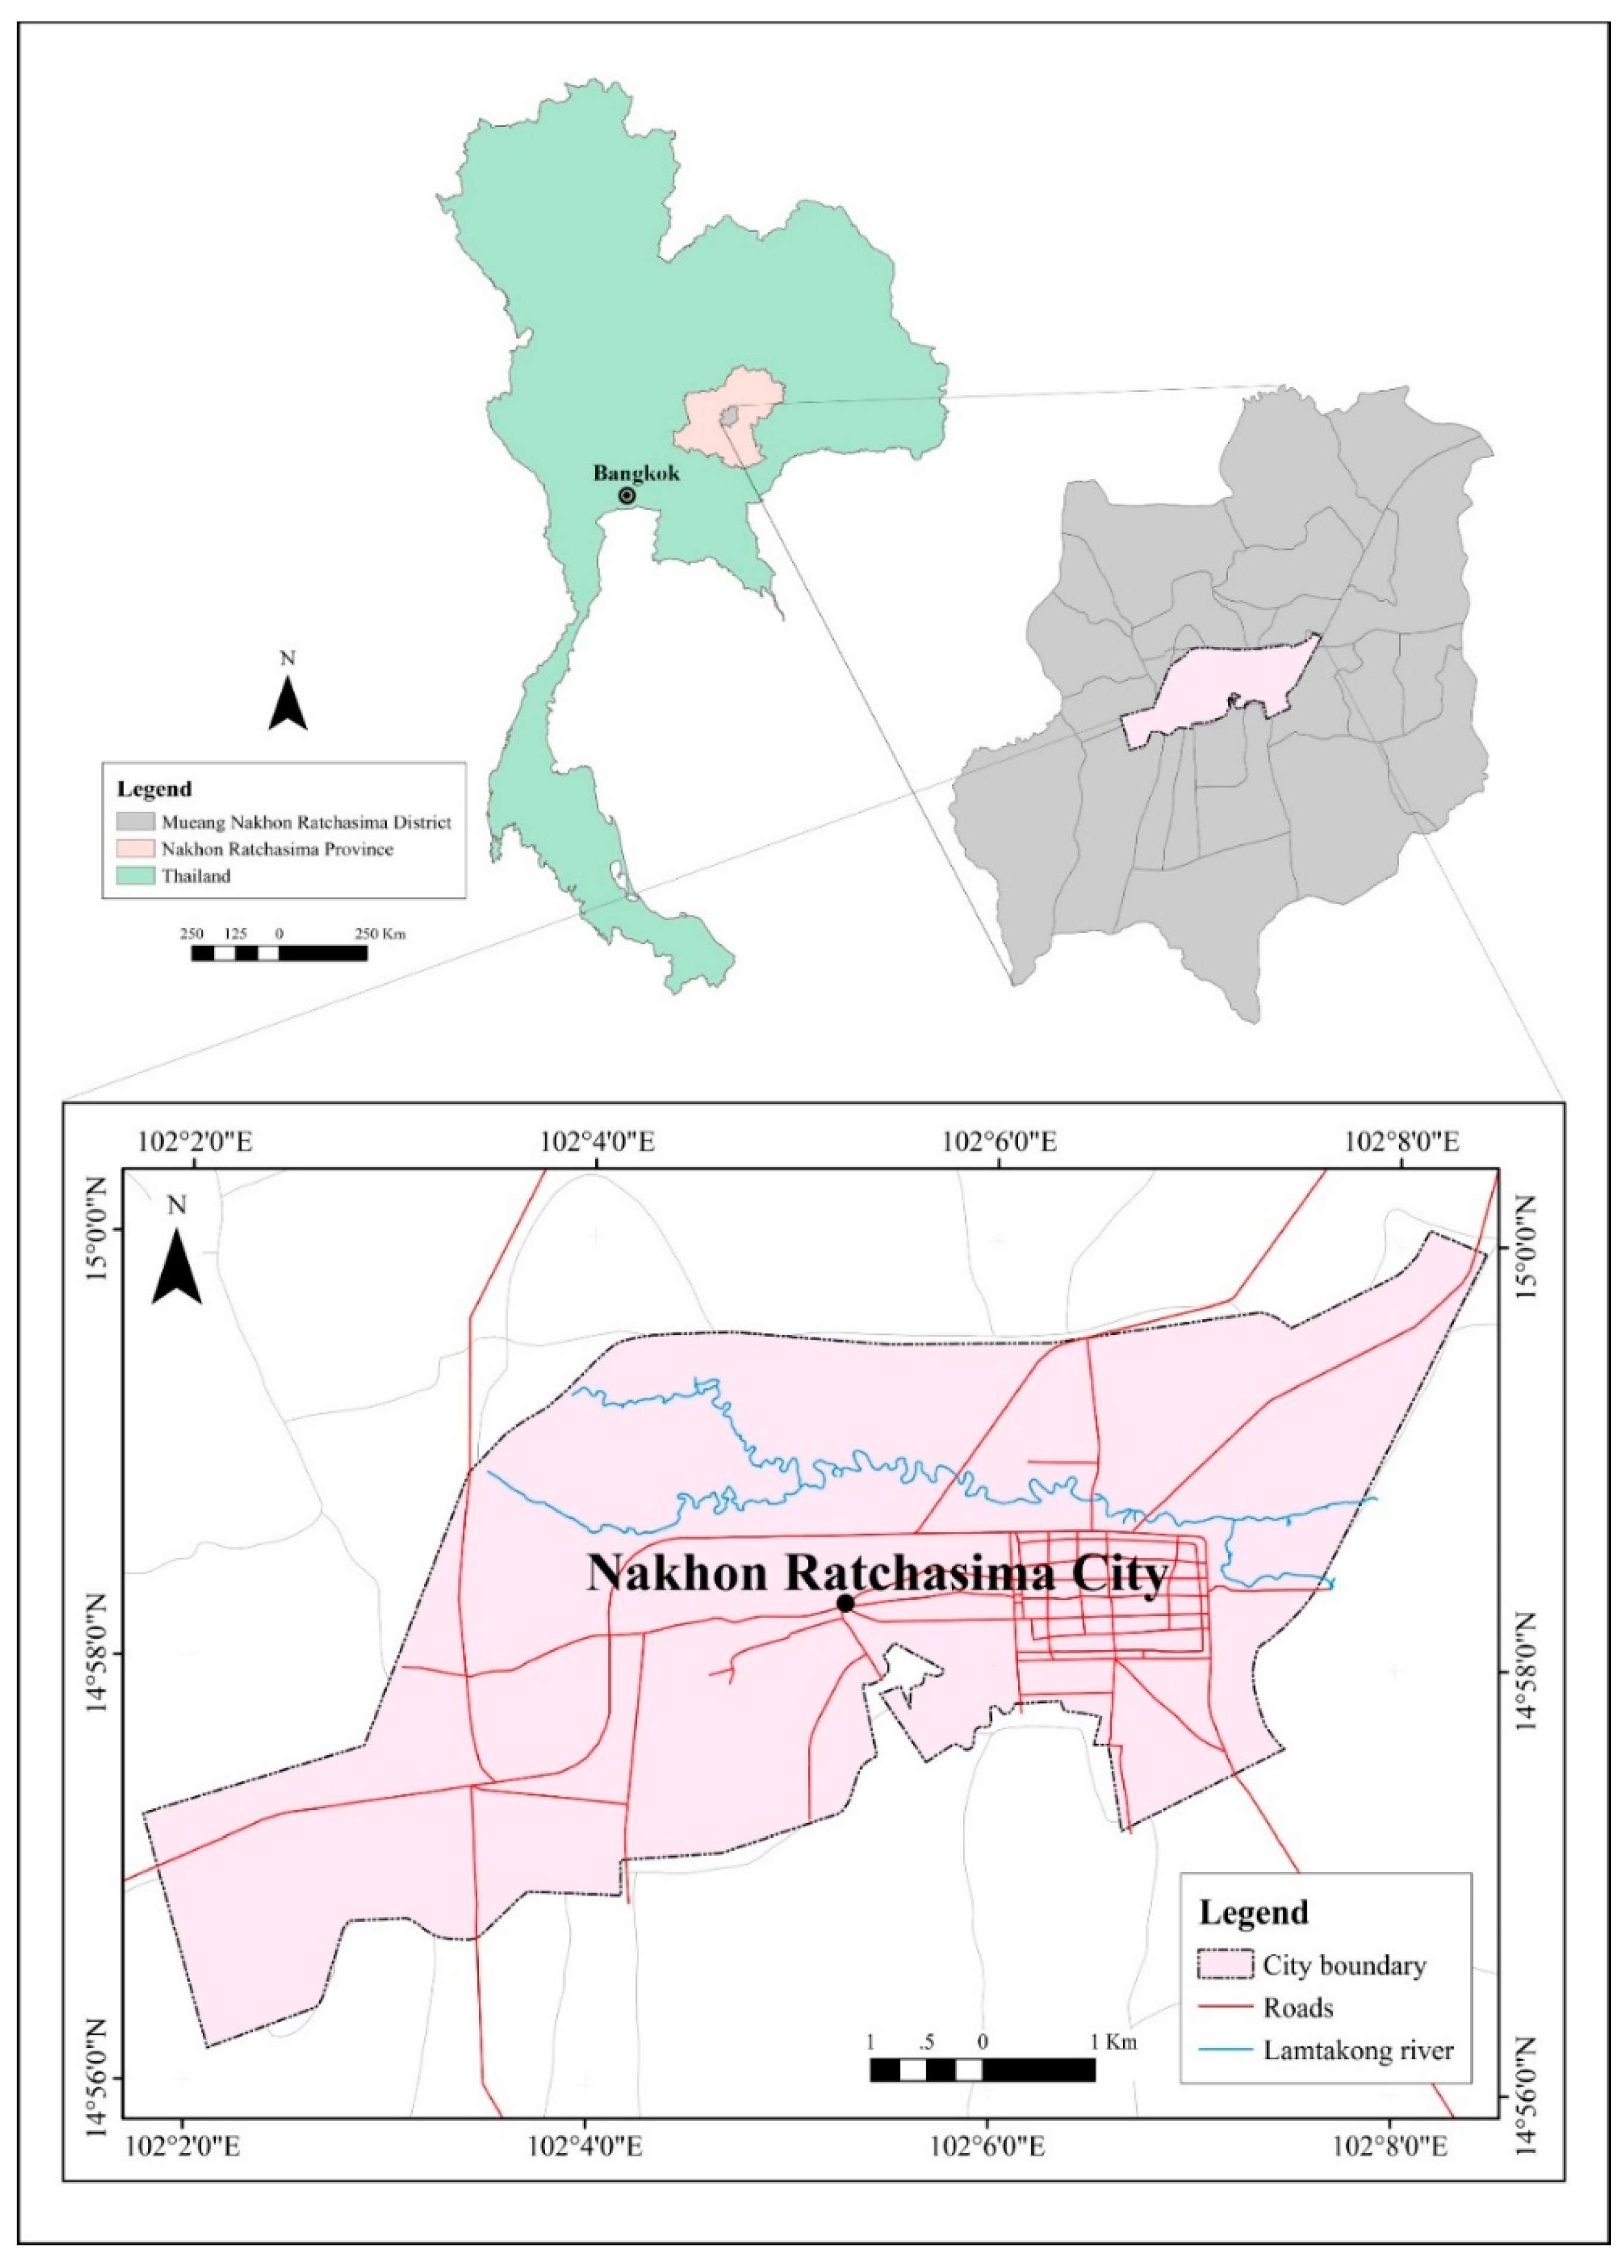
The study was conducted in Nakhon Ratchasima City, located between 14° N to 16° N latitude and 101° E to 103° E longitude at an altitude of 174–206 MASL (
Figure 1). The city lies along the banks of the Lam Ta Kong River which runs through the southwest corner of a vast, low lying plain.
Nakhon Ratchasima City is an ancient city situated in the Korat plateau, which is the lower part of Thailand’s Northeastern plateau. The city, which was rebuilt within the walls of the ancient city on an area of 1.70 sq km, is growing rapidly. The majority of the population are military personnel and their extended families. During the reign of King Rama V (1868–1910), the military area expanded southwards beyond the city wall. In 1982 the area increased from 4.40 sq km to its current area of 37.50 sq km. Nowadays, the City is Thailand’s third most highly populated city. It is characterised by urban sprawl, created to accommodate its large population [
15,
16]. Nakhon Ratchasima will continue to serve as a regional hub of manufacturing, education, business and transportation. As a result, Nakhon Ratchasima is suffering from the loss of green spaces and agricultural areas as well as severe water shortages.
2.2. Analysis and Review of Economic and Area Development Plan
Nakhon Ratchasima was designated as the main city for economic development and wealth distribution in the northeastern part of the country since the Forth National Economic and Social Development Plan (NESD Plan) was implemented. The advantage of the location and the development potential of the city allowed Nakhon Ratchasima to prosper and its plan for land use began and continued to change ever since. Therefore, it is crucial to review the implementation of the plans, especially in the areas contributing to the City’s land-use change. This study reviewed the NESD Plans from 4th to 11th plans. Nakhon Ratchasima’s provincial development plan was also reviewed to illustrate the changes of the city through different periods from the past up until 2017.
2.3. Investigation of Urban Land Use Types
The urban land-use patterns were investigated using remote sensing and ArcGIS10 software. Satellite imagery data from Landsat and Theos were suitable for assessment and evaluation for the changing of land use and land cover for urban areas and other types of land use [
17,
46,
47].
Thus, using satellite images to analyse the expansion and land-use change of Nakhon Ratchasima can be determined by specific time frames depending on the purpose of the study, the period that important changes occurred, the availability of the satellite images, the quality of the images as well as available fundings. This study aimed to predict land-use changes in Nakhon Ratchasima using CA-Markov model. The CA-Markov model is a highly accurate method that can predict land-use changes using only 2–3 satellite images [
39,
42,
43]. Previous research [
15,
16,
20], the review of the National Economic Development Plan and studies on economic activities contributing to the expansion of the city showed that the most significant years for the expansion were 1992, 2002, and 2016. Moreover, the quality of satellite images taken during those years was of great quality without being obscured by the clouds or tilted. Therefore, the years 1992, 2002, and 2016 were selected as the timeframe for this study.
Urban land classification and visual interpretation were accomplished using several image manipulation techniques, including pre-processing, feature extraction, image enhancement, band ratio and spectral classification. The satellite data were obtained from Landsat-5 (1992) on 30th January 1992 (09:55 am) and Landsat-7 (2002) on 18th February 2002 (10:20 am). These data were analysed using the Thematic Mapper system at the 30-m resolution. Sattelite data from THEOS (2016) was obtained on 17th February 2016 (10:26 am) with a Multispectral 15-m resolution. The analysis enabled the classification of the various types of land use using ENVI 4.7 image processing software. The supervised classification and digital number (DN) with the maximum likelihood analysis method were then applied to classify different land-use types.
The images were classified into four classes based on the USGS Circular 671 [
48], namely built-up areas (community areas and commercial buildings), green areas (agricultural land, forestland and rangeland), bare lands (wasteland and unused area) and water sources (natural water sources and built-up water area). Some areas (totalling 6.7 sq km) were omitted because the land use categorisation was ambiguous due to a similar reflection of the images such as combined city canals and some water sources. The land use data were then further validated and adjusted as required by incorporating the geographic information data [
17,
49,
50,
51] and field area inspection.
Accuracy assessment of the satellite images was obtained by calculating the overall accuracy at the 90% confidence level and the Z-score [
52,
53,
54].
Changes in land-use patterns in the study area were identified by recording differences by observing over a period of time [
48]. Spatial land-use change detection was divided into three conditions, past (1992 and 2002) and current (2016) conditions, which were analysed using supervised classification and image differencing methods.
2.4. Land Use Change Prediction in Nakhon Ratchasima by CA-Markov
Land use prediction in Nakhon Ratchasima was conducted using the CA-Markov model. The Markov chain is a statistical tool that describes the probability of land-use changes from one period to another by developing a transition probability matrix between the two periods, based on neighbourhood effects [
31,
32,
34,
36]. However, the Markov analysis does not account for the causes of land-use change and it is insensitive to space [
55]. Therefore, the combination of Cellular automata and Markov chain (CA-Markov) was developed to solve the problem.
The CA-Markov model combines two rationales: a Cellular automata and a transition probability matrix based on land-use changes generated by the cross-tabulation of two images adjusted by the proportional errors. In the CA model, the transition rules are the real engines of change. The transition rules are the transformation from one cell state to another over a specific period, based on the states of the neighbourhood cells [
41].
The Markov model analysis describes the probability of land-use change from one period (t) to another (t+1). The changes were calculated using a probability equation proposed by Bayes to predict land-use changes [
56,
57] (Equation (1)).
where
is the state of the cell in the CA at time (t),
+ 1 is the state of the cell in the CA at time (t+1) and
is the transition probability matrix in a state which is calculated as follows [
58,
59]:
P is the Markov transition matrix P,
stands for the probability of converting from current state
i to another state
j in next time,
is the state probability of any time,
i,
j is the land use type of the first and second periods. The low transition will have a probability near (0) and high transition has probabilities near (1) [
59]. In the transition matrix, it requests that each rate is a non-negative quantity and each live factor 0 to 1. The estimate of Markov chain is the relation frequency of transitions observed over the entire time period. The result of the estimation can be used for prediction [
60]. Thus, the calculation using the Markov model was integrated with the Cellular automata model to update the satellite data. New data cells were generated following their surrounding cells in the format of 3×3 or 5×5 matrix which relocated from one cell to another until it covered the specified area. The method was repeated as programmed [
61].
The key process of Ca-Markov is to set a transition rule, a function of changes in cellular objects that determines the transition condition of the land use pattern. To better simulate the spatial changes of urban land use, the Markov model needs to define the changes in probabilities of the state of land use by setting thresholds for changing the types of land use and random factors. To define land-use change transition rules in the Ca-Markov model, local restrictions and random variations are introduced [
41].
The CA-Markov model comprises two steps: first, to verify the accuracy of the CA-Markov model and, second, to analyse the data from the 2026 land-use change prediction. This study employed satellite images taken in 1992 (Landsat-5TM) and 2002 (Landsat-7TM) to verify the accuracy of the model. The images, taken in 2002 (Landsat-7TM) and 2016 (Theos), were used to predict land-use changes in 2026. The overall accuracy rate is shown in Equation (4) and the result was 90% [
62,
63].
Moreover, the accuracy of land use data obtained from the CA-Markov model was validated using an error matrix (
Table 1) to estimate overall accuracy. The equation used to estimate overall accuracy is shown in Equation (4).
| when | i | is row |
| | j | is column |
| | | row i and column j |
| | | the total number |
The 2026 land-use change prediction was analysed from the three verified satellite images with different conditions in two scenarios. Scenario 1 assumed city development following past trends, while Scenario 2 was based on the implementation of the government’s urban planning policy and strategies. Forecasting land-use changes in the first scenario, following the characteristics and development trends of urban expansion in the past, the changes in the urban utilisation were likely to occur without other influencing factors. Data from 2002 and 2016 were imported to forecast land-use changes in scenario 1. The data included the city’s growth trend that continued from the past and the basic data of the study area such as topography (DEM) and elevations. The imported data was 0.67 sq km according to satellite image translation. The area included moats, treatment areas and Boong Ta Lua Water Park. The data was imported to prevent errors in forecasting land utilisation model and working with a computer program.
Predicting land-use changes in the second scenario, where urban expansion occurred following the implementation of policy and planning in economic development and urban development designated by Government. The policies aiming to establish Nakhon Ratchasia as a centre of trade and economy. Therefore, the probability of changes in land use is limited if the built-up-areas., which is expanding constantly, is not utilised for other land use purposes (probability is equal to 0).
3. Results
3.1. Urbanisation of Nakhon Ratchasima City
With the potential of Nakhon Ratchasima, the gateway to the Northeast region close to Bangkok, it has been considered as the main city and the military dominance of the region since 1448. In the past, travelling from Bangkok to the northeast was difficult due to a lack of transportation infrastructure. The construction of Bangkok-Nakhon Ratchasima railway, the first railway of Thailand, began in 1896 and completed in 1900. The National highway was not constructed until 1955 and was completed in 1957. It was then when the travelling time to Nakhon Ratchasima was shortened from 10 h to only 3 or 4 h on the first highway of Thailand with the road surface paved with asphaltic concrete. The national highway brought development and prosperity that transformed the City. The economic development improved drastically from the transport of agricultural products from Nakhon Ratchasima and the northeastern region to Bangkok and vice versa.
The National Economic and Social Development Plan (NESD Plan) affects the transformation and growth of Nakhon Ratchasima. The first NESD Plan (1961–1967), focusing on infrastructure construction in major cities, aimed to attract private investment and generate economic growth. Nakhon Ratchasima, with developed transportation systems, also attracted the construction of dams and large reservoirs. The irrigation systems brought tremendous prosperity and changes to the region. The first shopping mall of Nakhon Ratchasima was built in 1958 in its urban area. The department store expanded its area in 1976 and 1986 to accommodate the demand.
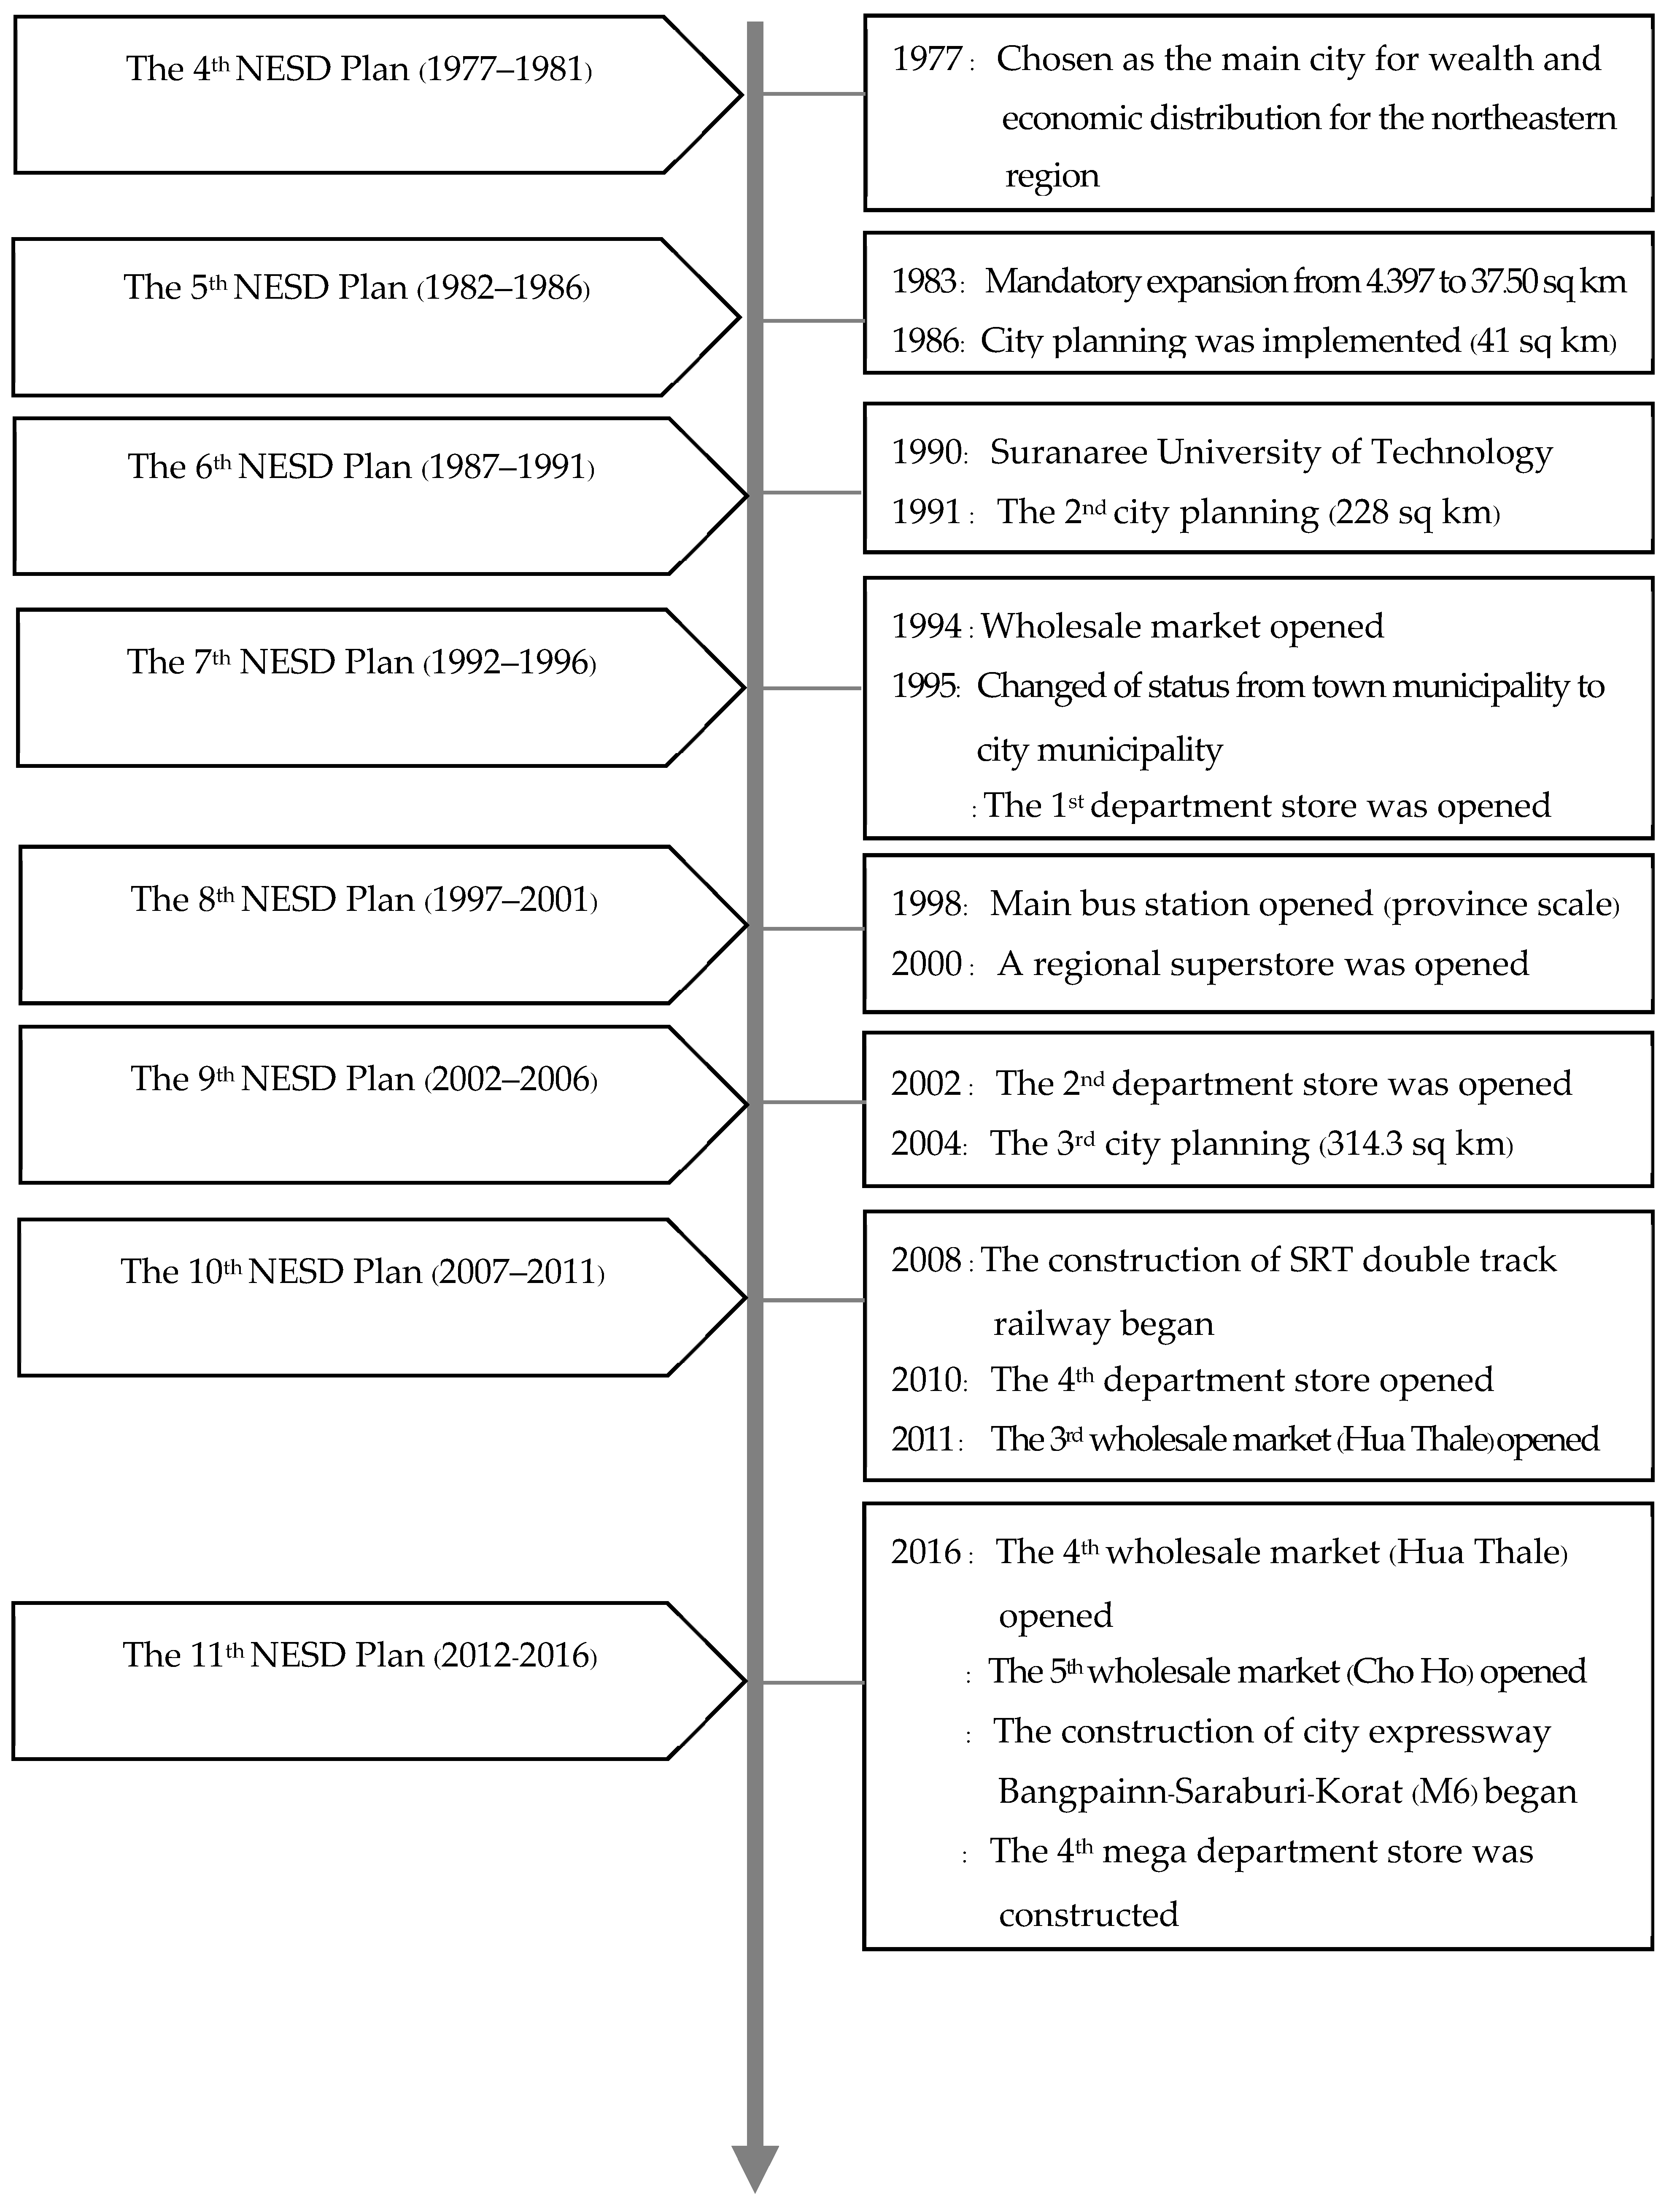
In 1977, the 4th NESD Plan (1977–1981), focusing on the distribution of economic and social services to the urban areas in regional and rural areas, was implemented (
Figure 2). The government selected a province that had the potential to establish a growth centre for regional economic and social development. Nakhon Ratchasima was the first province to be chosen for the Northeastern region of Thailand. The City’s development continued to grow, the urban administrative area expanded from 4.397 to 37.50 sq km in 1983. Moreover, in 1986, the first city planning was implemented with an area of 41 sq km. The implementation of the 4
th NESD Plan led to an expansion of economic activities and investment in the area. It was apparent from the construction of the first large university in the lower northeastern in 1990. In addition, welcoming university students in 1993 led to further economic growth. Business activities began to grow to accommodate students’ demands in areas surrounding the campus and downtown Nakhon Ratchasima such as dormitory, apartment, condominium and retail shops. A regional wholesale market was also opened (1994). An increase in population number and economic growth enabled Nakhon Ratchasima to elevate from a medium-sized municipality to a large city in 1995. The City’s administrative boundaries remained the same size (37.50 sq km) but its urban areas were expanding and began to connect with surrounding areas. Moreover, the City’s population was 179,884 and the population density was 4,797 people/sq km, excluding non-registered residents comprising 22% of the registered population [
15]. As for economic activities in the urban area, the first department store opened in 1995 and the regional superstore opened in 2000.
During the past four decades of planned development under the first eight NESD plans, Nakhon Ratchasima continued to grow. Many economic activities and infrastructure were constructed (
Figure 2) resulting in an expansion of the urban area over the administrative area. 131,286 people were registered live in the urban area. Nakhon Ratchasima welcomed approximately 200,000–400,000 people for works and business during the day. With its growth, the 3rd City Planning expanded the area to total 314.3 sq km without expanding its municipal territory. Nowadays, Nakon Ratchasima is under the 11th NESD Plan. It continues to grow and prospers as the major city of the region. The city was ranked at the third most populous cities in Thailand in 2015 [
19] with the registered population alone [
15]. Land use in the old town shows a dense pattern and the city is expanding in the form of ribbon development [
15,
20]. It is also expanding to the northern part of the city and invading into areas that were once its original settlements and farmlands [
15,
16,
20].
3.2. Changing of Land Use in Nakhon Ratchasima City from Past to Present
As a growth centre for economic development in the Northeastern Region of Thailand, there are multiple land-use changes in the City between 1991 and 2002. For example, in 1992, a large proportion of land was allocated for settlement and economic activity which were built-up areas (47.76% of the total area), followed by green areas (37.45%), bare lands (13.19%) and water bodies (1.60%) (
Table 2). Impacting by the growing economy, the built-up areas increased to 56.04% (an average increase of 1.73% per year) which reduced the green areas to 35.53% (an average reduction of 0.51% per year) and bare lands decreased to 4.80% (average reduction of up to 6.36% per year). In this regard, built-up areas, especially settlement and commercial buildings, were scattered. The old city area became denser whereas it connects the city with major intercity transportation routes. The green areas comprised agricultural lands, gardens and parks. These recreation areas or green space were commonly distributed commonly in urban areas. There is a large green space on the south side of the City, which is taken care of by the military, and there are some agricultural areas north of Lam Ta Kong Watershed.
The growth and the development of the City has been continuing since 2002, 14 years later, the built-up areas of Nakhon Ratchasima that was 56.04% in 2002 rose to 70.87% in 2016 (an average increase of 1.88% per year) while the green areas decreased from 35.52% to 20.78% (an average decrease of 2.96% per year). The bare lands and water bodies had changed only slightly (6.37% and 2.03%).
Settlements and built-up areas located mainly in the old town within the ancient city walls. It expanded along the main road and to the northern part of the city, where agricultural areas that supply the city are located. (
Table 3).
The data based on satellite image interpretation showed 92.37% confidence level in 1992, 93.18% in 2002 and 92.13% in 2016 which was a confidence level for satellite images.
Under the government’s economic and land development policy and Nakhon Ratchasima’s economic development plan, several changes in land-use were observed from 1992 to 2002 and 2002 to 2016.
Table 4 illustrates land-use changes between 1992 and 2002 in different areas. The built-up areas showed an increase of 15.11%. The overall land-use changes in the built-up areas increased by 17.35%. The green areas showed a change of 34.34% since it was transformed into built-up areas (24.79%), followed by bare lands (4.64%) and water bodies (4.92%). The overall land-use change in the green areas decreased by 5.14%. Bare lands had the highest land-use change rate of 87.38% since it was turned into built-up areas (42.46%), green areas (42.30%) and water bodies (2.62%). The overall land-use change of bare lands reduced by 63.57%. Water bodies had as the highest increase of 125.90% from flooding.
The analysis indicated that the green areas reduced by 8.18 km, from 13.09 sq km in 2002 to 4.91 sq km in 2016. The 8.18 sq km area was transformed to serve various purposes: 6.64 sq km for built-up areas, 1.28 sq km for bare lands and the remaining 0.24 sq km for water bodies. Moreover, of the 1.77 sq km of bare lands identified in 2002, 1.08 sq km was transformed into built-up areas in 2016, with only 0.30 sq km of bare lands remained in 2016 (
Table 4).
Table 5 reveals land-use changes between 2002 and 2016 in different areas. The built-up areas showed an increase of 14.44%. The overall land-use changes in the built-up areas increased by 26.31%. The green areas showed a change of 62.43% since it was turned into built-up areas (50.78%), followed by bare lands (9.80%) and water bodies (1.85%). The overall land-use changes in the green areas decreased by 41.48%. Bare lands had the highest land-use change at 82.68% since it was turned into built-up areas (59.17%), green areas (21.84%) and water bodies (1.67%). The overall land-use changes in bare lands increased by 33.16%. The water bodies had as high as 87.79% of land-use change since it was turned into built-up areas (53.79%), green areas (28.10%) and bare lands (5.90%). The overall land-use change of the water bodies showed a decrease of 33.16%.
3.3. Nakhon Ratchasima’s Land Use in 2016 and Verifying Accuracy of the CA-Markov Model
Land-use changes prediction of Nakhon Ratchasima using the CA-Markov method indicated that 65.10% of the city comprised built-up areas. The findings were consistent with data obtained from satellite images (
Table 6).
Model accuracy assessment from both methods revealed an overall accuracy of 80.37% which was similar to the results obtained from other studies employing the CA-Markov model. The accuracy rate was accepted when it was higher than 80% [
38,
42,
43,
44,
45,
63,
64].
3.4. Using the CA-Markov for Land-Use Prediction in Nakhon Ratchasima in 2026 under Two Different Scenarios
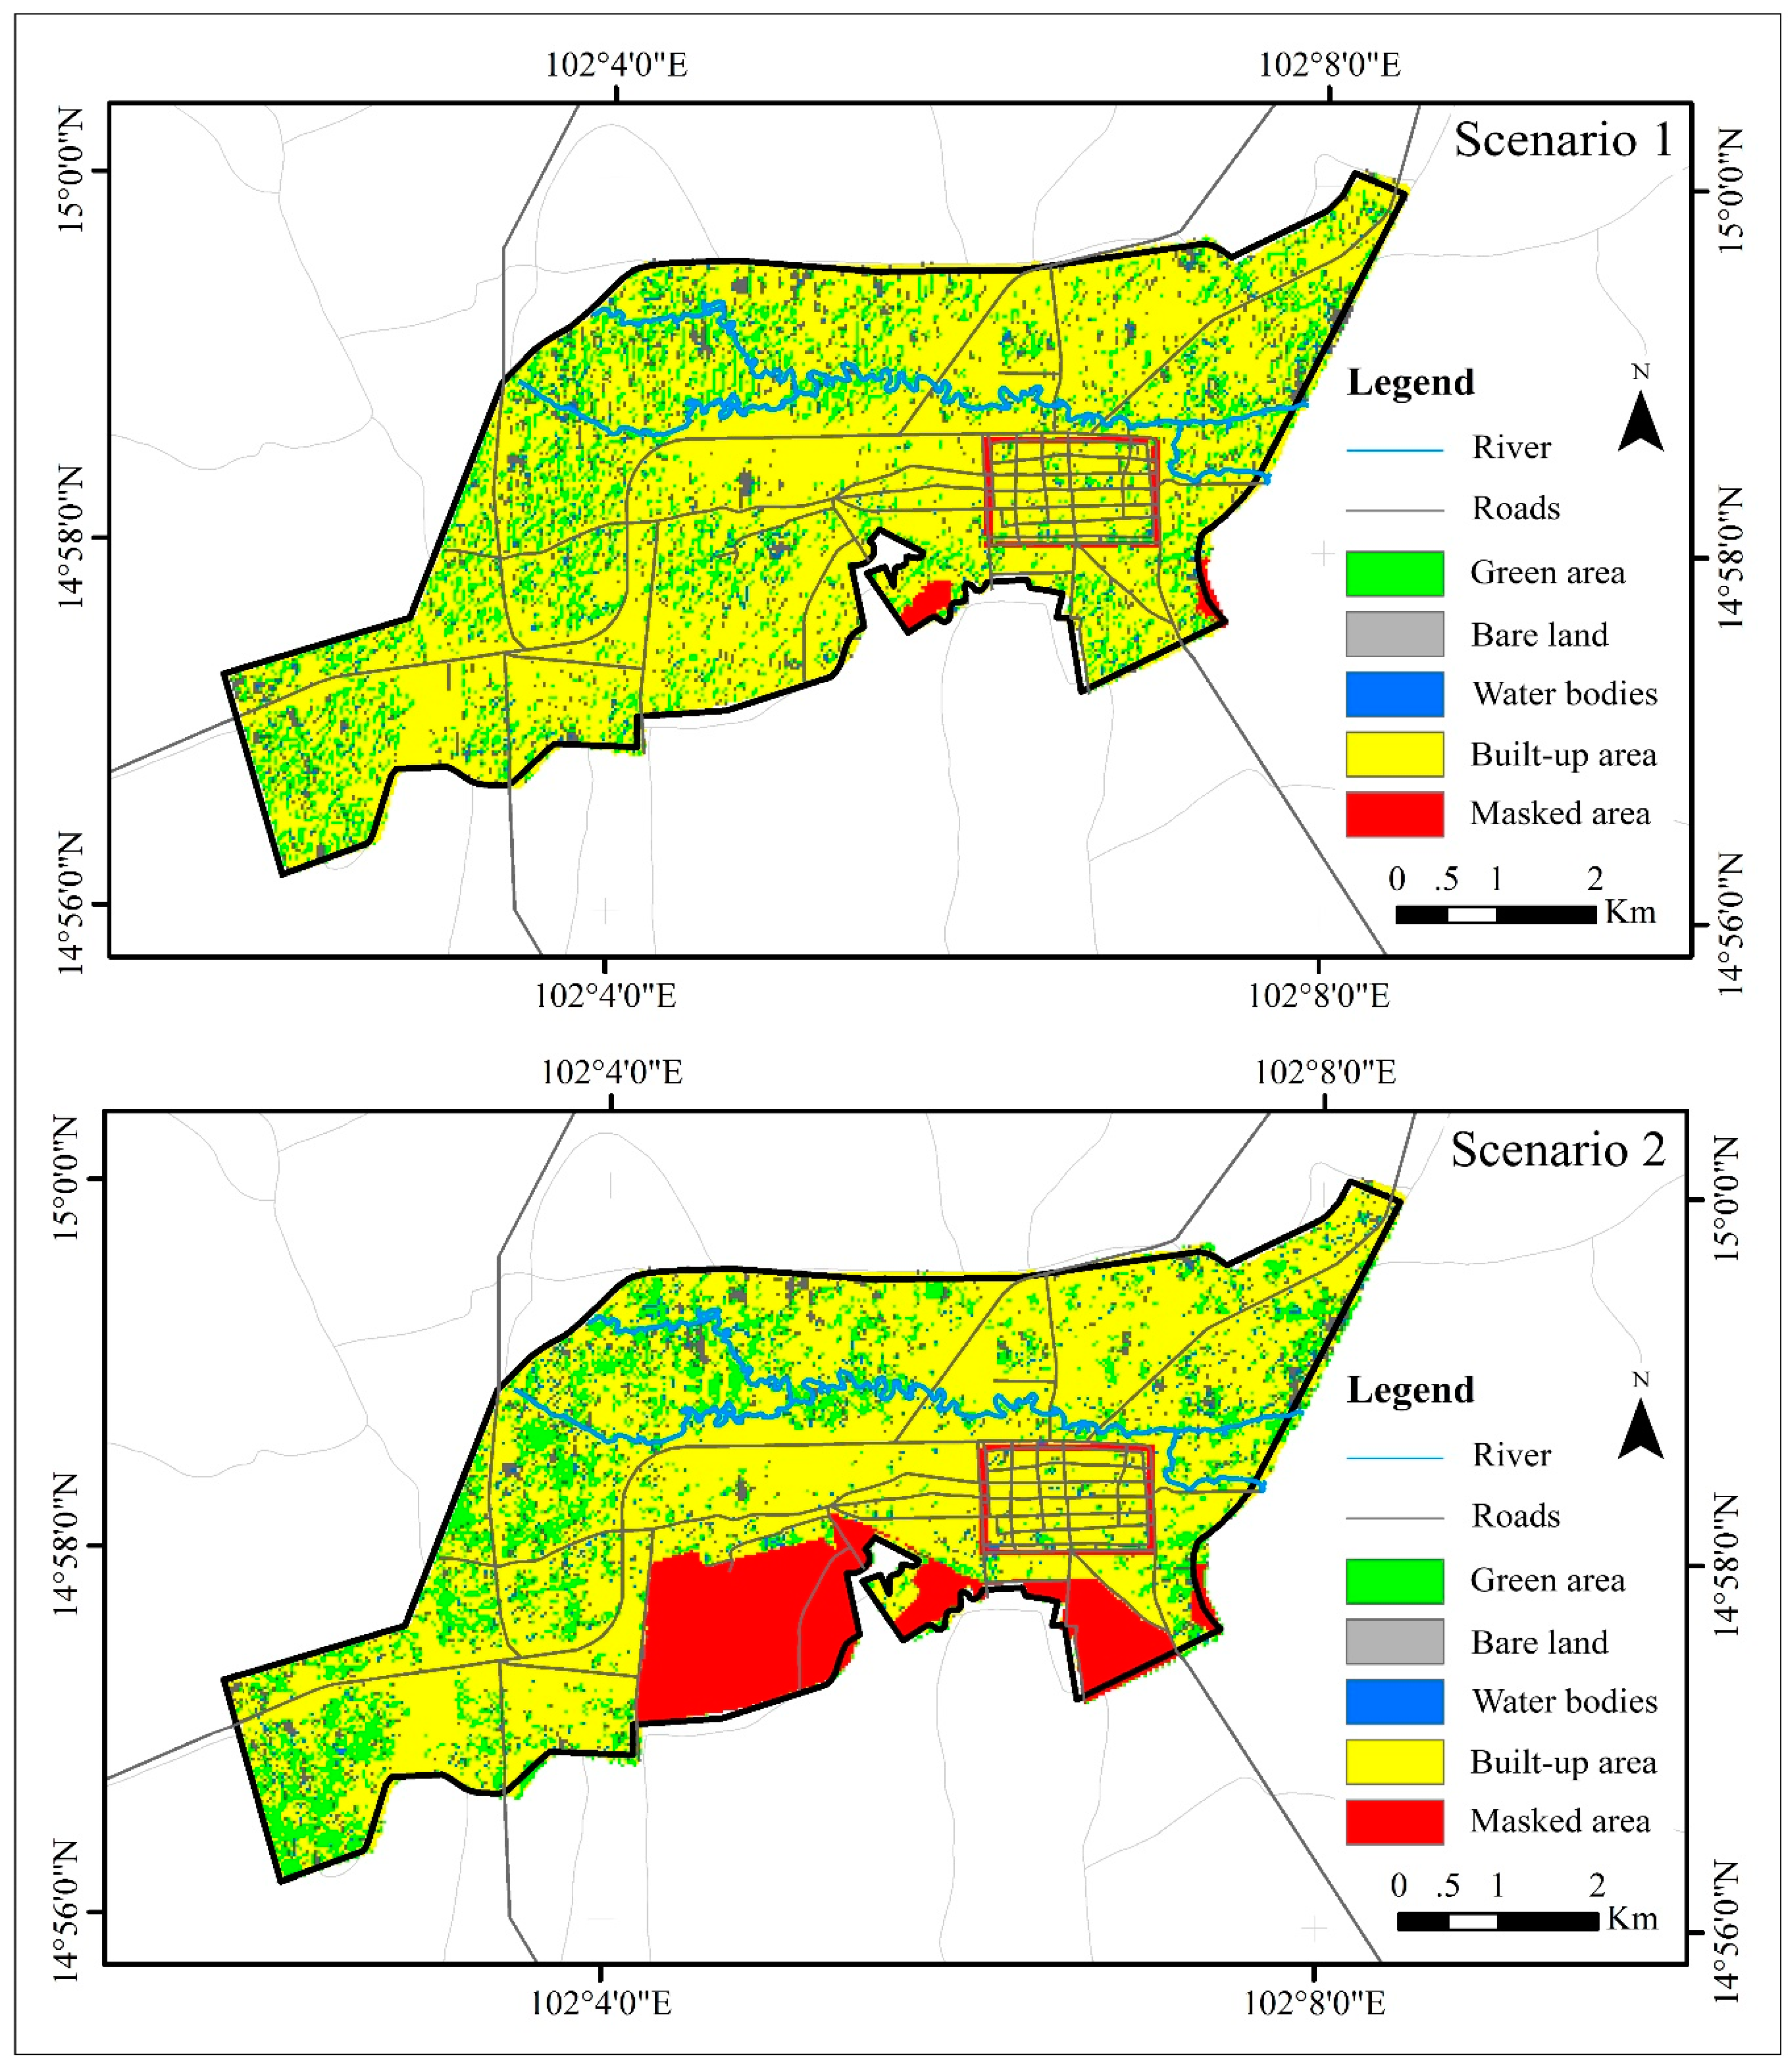
The results of land use prediction in Nakhon Ratchasima 2026 in two scenarios (
Figure 3) are as followed.
In Scenario 1 (
Table 7), extrapolated from past trends, urban expansion in Nakhon Ratchasima, the analysis revealed that the city’s built-up areas would reach 31.63 sq km (85.88% of the total area), its green areas would occupy 11.67% (4.29 sq km), the bare lands would take up 2.15% (0.80 sq km) and it was 0.30% (0.11 sq km) for the water bodies. The results indicated that the built-up areas showed a major increase from 2016 (5.54 sq km) while its green areas decreased (3.37 sq km). Both the bare lands and the water bodies decreased (0.64 sq km and 1.55 sq km).
Scenario 2 (
Table 7) assumed urban expansion as a result of following the implementation of policies, mitigation measures and economic development plan proposed by the government. This included enforcing restricted access to the military areas and national reserved forests of 5.56 sq km (14.82%) and limited expansion or change in the existing built-up areas. The model indicated that the build-up areas would reach 74.91% (23.93 sq km), the green areas 15.77% (5.04 sq km), the bare lands 8.48% (2.70 sq km) and the water bodies 0.84% (0.27 sq km). In 2026, the built-up areas showed a considerable increase (2.14 sq km) while the green areas would decrease (2.62 sq km). The bare lands would increase (1.95 sq km) and the water bodies would decrease 1.04 sq km.
4. Discussion and Conclusion
The continuous expansion of Nakhon Ratchasima over the past decades triggered rapid land-use changes. The city’s built-up areas increased from 47.76% of the total area in 1992 to 56.04% in 2002, and 70.80% in 2016. On the other hand, the green area shrunk from 34.34% in 1992 to 35.52% in 2002, and 20.78% in 2016. The results reflected similar trends in many other cities [
20,
65] where green areas were typically converted to built-up areas [
9,
11]. The CA-Markov model also revealed that irrespective of scenarios, the built-up areas would increase and the green areas would inevitably decrease as a result of urbanisation. However, in Scenario 2, if policies for restricted areas such as military areas and national conserved forests were fully implemented, there would be more green areas and fewer built-up areas than in Scenario 1. However, it is worth noting that the bare land areas increased from transitions during the land-use change process. Previous studies revealed that bare land was typically converted into built-up areas. Therefore, an increase of bare lands may point to urban growth in these areas in the future. This study predicted that, for both scenarios, the continuously rapid urban expansion will have occurred in Nakhon Ratchasima by 2026.
Even though the overall confidence level of the CA-Markov in this study (80.37%) was lower than 90%, many studies indicated that an overall confidence level of 80% was widely accepted and was ensure that the model was effective for the land-use change prediction [
38,
42,
43,
44,
45,
63,
64]. The overall confidence level of the satellite images used in this study was higher than 90% which indicated the accuracy of the satellite images. The data was used as primary data for the prediction of land-use changes using the CA-Markov model.
Urban expansion, together with the shrinking of the green areas surrounding the city, has brought adverse environmental impacts, including rising ground temperatures, the urban heat island effect and drainage problems [
15,
21,
22]. Organisations responsible for city management should plan and restrict future land-use changes in Nakhon Ratchasima by enforcing local laws and regulations. Most importantly, remaining green areas should be conserved and new green areas should be created, including vertical green areas. The size of the green areas should be appropriate for the city and the locations should be distributed throughout the city. Moreover, mitigation measures to assure and incentivised businesses to build new buildings that are environmentally friendly and support the vertical growth of the city.
According to the CA-Markov simulation model, the accuracy of the prediction obtained from this study was less than that of other theoretical predictions (90%) [
42,
61,
62]. However, many studies agreed that accuracy levels between 80% and 90% were adequate to effectively predict land use e.g., [
38,
42,
43,
44,
45,
63,
64,
66]. The accuracy of the model obtained from the study of Al-Sharif et al. (2014) [
44] was 85% and was used to predict land use in Tripoli, Libya. The accuracy level obtained from Yang et al. (2012) [
43] was 80.13% which was used to predict land use in Changping area in Beijing, China. Historically, empirical research in many cities confirms the high level of accuracy of the CA-Markov model and its suitability as a tool for land use prediction.
Factors causing the discrepancy in this study included the quality of the satellite imagery, the processing programs and the data used. These factors affected the accuracy of the predictions [
67]. Nevertheless, the CA-Markov simulation model can accurately predict the possibilities of future changes in land use [
45]. In this study, the size of the images varied due to the timeframe. The pixel size of the 2002 Landsat-7 images was 30 m, while that for images from THEOS in 2016 was 15 m. These differences could also lead to discrepancies in land use predictions. However, the prediction of urban expansion in Nakhon Ratchasima in the land use maps based on the model was reliable and in line with the findings of earlier studies. It can be concluded that the CA-Markov simulation model could effectively predict land-use changes in Nakhon Ratchasima in 2026.
This study concluded that if policies regarding land-use changes and city expansion planning are enforced, Nakhon Ratchasima would be able to preserve its green spaces for the benefits of the City itself and its residents. It also contributes to reducing and preventing an increase in land surface temperature. This research will be presented to local governments such as Nakhon Nakhon Ratchasima Municipal Office for the drafting of practical mitigations for city management. The mitigation will observe the compact city model by allocating designated areas for different purposes including future development, reserved areas for environmental preservation as well as Floor Area Ratio (FAR) and Open Space Ratio (OSR).


