
Effects of Prepartum Dietary Energy Level and Nicotinic Acid Supplementation on Immunological, Hematological and Biochemical Parameters of Periparturient Dairy Cows Differing in Parity


Abstract
:Simple Summary
Abstract
1. Introduction
2. Materials and Methods
2.1. Animals, Housing and Dietary Treatments
2.2. Sample and Data Collection
2.3. Laboratory Methods
2.3.1. Determination of Blood Niacin Concentration
2.3.2. Hematological and Biochemical Analyses
2.3.3. Flow Cytometric Analysis
2.3.4. Isolation and Culture of Peripheral Blood Mononuclear Cells
2.4. Calculations and Statistics

| Item | Diet | P-Value | |||||||||
|---|---|---|---|---|---|---|---|---|---|---|---|
| P 1 | LC-CON 2 | LC-NA 3 | HC-CON 4 | HC-NA 5 | C 6 | S 7 | P 1 | T 8 | C*S*P*T | ||
| NAM, µg/mL | 0.738 | 0.010 | 0.538 | <0.001 | 0.120 | ||||||
| −42 until B 9 | 1 | 1.39 ± 0.49 | 3.25 ± 0.55 | 2.31 ± 0.58 | 2.20 ± 0.49 | ||||||
| >1 | 2.08 ± 0.41 | 2.38 ± 0.45 | 1.86 ± 0.36 | 2.73 ± 0.41 | |||||||
| 1–28 DIM | 1 | 1.85 ± 0.46 | 4.40 ± 0.51 | 1.71 ± 0.51 | 2.79 ± 0.46 | ||||||
| >1 | 2.37 ± 0.39 | 2.60 ± 0.42 | 2.45 ± 0.34 | 3.63 ± 0.39 | |||||||
| 29–100 DIM | 1 | 1.31 ± 0.57 | 2.32 ± 0.63 | 1.41 ± 0.63 | 2.01 ± 0.57 | ||||||
| >1 | 2.54 ± 0.51 | 2.09 ± 0.52 | 2.15 ± 0.42 | 2.17 ± 0.48 | |||||||
3. Results
3.1. Animals
3.2. Serum Niacin Concentration
3.3. Biochemistry
3.4. Hematology and Water Intake
| Item | Diet | P-Value | |||||||||
|---|---|---|---|---|---|---|---|---|---|---|---|
| P 1 | LC-CON 2 | LC-NA 3 | HC-CON 4 | HC-NA 5 | C 6 | S 7 | P 1 | T 8 | C*S*P*T | ||
| Leukocytes, 103/µL | 0.298 | 0.341 | 0.001 | 0.172 | 0.327 | ||||||
| −42 until B 9 | 1 | 9.6 ± 0.9 | 10.5 ± 1.0 | 8.8 ± 1.1 | 9.5 ± 0.9 | ||||||
| >1 | 6.9 ± 0.8 | 8.1 ± 0.9 | 7.2 ± 0.7 | 9.0 ± 0.8 | |||||||
| 1–28 DIM | 1 | 10.3 ± 0.9 | 11.8 ± 1.0 | 8.9 ± 1.0 | 8.1 ± 0.9 | ||||||
| >1 | 7.3 ± 0.8 | 8.4 ± 0.8 | 8.2 ± 0.7 | 7.8 ± 0.8 | |||||||
| 29–100 DIM | 1 | 8.8 ± 0.9 | 9.4 ± 1.0 | 9.0 ± 1.0 | 9.3 ± 0.9 | ||||||
| >1 | 8.0 ± 0.8 | 7.2 ± 0.8 | 7.4 ± 0.7 | 7.0 ± 0.8 | |||||||
| Granulocytes, 103/µL | 0.347 | 0.238 | 0.050 | 0.007 | 0.060 | ||||||
| −42 until B 9 | 1 | 4.7 ± 0.6 | 5.4 ± 0.6 | 4.4 ± 0.7 | 5.3 ± 0.6 | ||||||
| >1 | 3.9 ± 0.5 | 4.3 ± 0.5 | 4.3 ± 0.4 | 5.3 ± 0.5 | |||||||
| 1–28 DIM | 1 | 5.6 ± 0.6 | 6.3 ± 0.6 | 4.1 ± 0.6 | 4.0 ± 0.6 | ||||||
| >1 | 4.0 ± 0.5 | 4.2 ± 0.5 | 4.2 ± 0.4 | 4.1 ± 0.5 | |||||||
| 29–100 DIM | 1 | 4.0 ± 0.6 | 4.7 ± 0.6 | 3.8 ± 0.6 | 4.8 ± 0.6 | ||||||
| >1 | 4.6 ± 0.5 | 3.5 ± 0.5 | 3.7 ± 0.4 | 3.8 ± 0.5 | |||||||
| Lymphocytes, 103/µL | 0.540 | 0.705 | <0.001 | 0.529 | 0.713 | ||||||
| −42 until B 9 | 1 | 4.1 ± 0.4 | 4.3 ± 0.4 | 3.9 ± 0.5 | 3.6 ± 0.4 | ||||||
| >1 | 2.6 ± 0.3 | 3.0 ± 0.4 | 2.6 ± 0.3 | 3.2 ± 0.3 | |||||||
| 1–28 DIM | 1 | 4.1 ± 0.4 | 4.8 ± 0.4 | 3.9 ± 0.4 | 3.4 ± 0.4 | ||||||
| >1 | 2.6 ± 0.3 | 3.2 ± 0.4 | 3.2 ± 0.3 | 3.2 ± 0.3 | |||||||
| 29–100 DIM | 1 | 4.1 ± 0.4 | 4.1 ± 0.4 | 4.3 ± 0.4 | 3.8 ± 0.4 | ||||||
| >1 | 2.9 ± 0.3 | 3.0 ± 0.4 | 3.2 ± 0.3 | 2.8 ± 0.3 | |||||||
| Item | Diet | P-Value | |||||||||
|---|---|---|---|---|---|---|---|---|---|---|---|
| P 1 | LC-CON 2 | LC-NA 3 | HC-CON 4 | HC-NA 5 | C 6 | S 7 | P 1 | T 8 | C*S*P*T | ||
| RBC, 103/µL | 0.216 | 0.519 | <0.001 | 0.004 | 0.152 | ||||||
| −42 until B9 | 1 | 6.1 ± 0.2 | 6.2 ± 0.2 | 5.8 ± 0.2 | 5.9 ± 0.2 | ||||||
| >1 | 5.7 ± 0.2 | 5.5 ± 0.2 | 5.6 ± 0.2 | 5.6 ± 0.2 | |||||||
| 1–28 DIM | 1 | 6.2 ± 0.2 | 5.9 ± 0.2 | 5.7 ± 0.2 | 5.7 ± 0.2 | ||||||
| >1 | 5.7 ± 0.2 | 5.4 ± 0.2 | 5.5± 0.2 | 5.4 ± 0.2 | |||||||
| 29–100 DIM | 1 | 6.3 ± 0.2 | 5.9 ± 0.2 | 5.7 ± 0.2 | 6.0 ± 0.2 | ||||||
| >1 | 5.4 ± 0.12 | 5.1 ± 0.2 | 5.3 ± 0.2 | 5.4 ± 0.2 | |||||||
| MCV, fL | 0.623 | 0.954 | <0.001 | <0.001 | 0.640 | ||||||
| −42 until B 9 | 1 | 54.4 ± 1.7 | 56.0 ± 1.9 | 54.9 ± 1.9 | 53.4 ± 1.7 | ||||||
| >1 | 58.9 ± 1.4 | 58.8 ± 1.5 | 60.5 ± 1.3 | 61.2 ± 1.4 | |||||||
| 1–28 DIM | 1 | 53.8 ± 1.7 | 59.1 ± 1.9 | 55.2 ± 1.9 | 58.9 ± 1.7 | ||||||
| >1 | 54.7 ± 1.4 | 60.6 ± 1.5 | 52.5 ± 1.3 | 61.0 ± 1.4 | |||||||
| 29–100 DIM | 1 | 49.8 ± 1.7 | 55.7 ± 1.9 | 52.7 ± 1.9 | 56.0 ± 1.7 | ||||||
| >1 | 52.3 ± 1.4 | 57.5 ± 1.5 | 49.2 ± 1.3 | 58.0 ± 1.4 | |||||||
| MCH, pg | 0.580 | 0.583 | <0.001 | <0.001 | 0.794 | ||||||
| −42 until B 9 | 1 | 18.6 ± 0.7 | 20.9 ± 0.8 | 18.3 ± 0.8 | 19.8 ± 0.7 | ||||||
| >1 | 18.9 ± 0.6 | 20.7 ± 0.6 | 17.9 ± 0.5 | 20.3 ± 0.6 | |||||||
| 1–28 DIM | 1 | 16.5 ± 0.7 | 18.2 ± 0.8 | 17.0 ± 0.8 | 18.3 ± 0.7 | ||||||
| >1 | 17.2 ± 0.6 | 18.8 ± 0.6 | 16.4 ± 0.5 | 18.7 ± 0.6 | |||||||
| 29–100 DIM | 1 | 15.9 ± 0.7 | 17.3 ± 0.8 | 16.2 ± 0.8 | 17.4 ± 0.7 | ||||||
| >1 | 16.2 ± 0.6 | 17.9 ± 0.6 | 15.3 ± 0.5 | 18.8 ± 0.6 | |||||||
| MCHC, g/dL | 0.944 | 0.013 | 0.829 | <0.001 | 0.059 | ||||||
| −42 until B 9 | 1 | 34.3 ± 0.6 | 35.2 ± 0.6 | 32.7 ± 0.7 | 33.1 ± 0.6 | ||||||
| >1 | 34.9 ± 0.5 | 33.8 ± 0.5 | 32.6 ± 0.4 | 32.5 ± 0.5 | |||||||
| 1–28 DIM | 1 | 30.8 ± 0.6 | 30.8 ± 0.6 | 30.9 ± 0.6 | 31.1 ± 0.5 | ||||||
| >1 | 31.4 ± 0.5 | 31.1 ± 0.5 | 31.2 ± 0.4 | 30.8 ± 0.5 | |||||||
| 29–100 DIM | 1 | 31.8 ± 0.6 | 31.0 ± 0.6 | 30.9 ± 0.6 | 31.1 ± 0.6 | ||||||
| >1 | 31.0 ± 0.5 | 31.1 ± 0.5 | 31.1 ± 0.4 | 32.3 ± 0.5 | |||||||
| Hemoglobin, g/dL | 0.450 | 0.083 | 0.338 | <0.001 | 0.162 | ||||||
| −42 until B 9 | 1 | 11.4 ± 0.3 | 11.7 ± 0.4 | 11.3 ± 0.4 | 10.8 ± 0.3 | ||||||
| >1 | 11.2 ± 0.3 | 11.4 ± 0.3 | 10.4 ± 0.2 | 11.3 ± 0.3 | |||||||
| 1–28 DIM | 1 | 10.3 ± 0.3 | 10.3 ± 0.3 | 10.0 ± 0.4 | 9.9 ± 0.3 | ||||||
| >1 | 9.8 ± 0.3 | 10.3 ± 0.3 | 9.4 ± 0.2 | 10.1 ± 0.3 | |||||||
| 29–100 DIM | 1 | 9.9 ± 0.3 | 9.3 ± 0.4 | 9.6 ± 0.3 | 8.9 ± 0.3 | ||||||
| >1 | 9.3 ± 0.3 | 9.5 ± 0.3 | 9.1 ± 0.2 | 10.1 ± 0.3 | |||||||
| Hematocrit, % | 0.275 | 0.418 | 0.460 | <0.001 | 0.034 | ||||||
| −42 until B 9 | 1 | 33.3 ± 0.8 | 33.2 ± 0.9 | 34.8 ± 0.9 | 32.2 ± 0.8 | ||||||
| >1 | 32.1 ± 0.7 | 33.5 ± 0.8 | 31.6 ± 0.6 | 34.3 ± 0.7 | |||||||
| 1–28 DIM | 1 | 33.5 ± 0.8 | 33.4 ± 0.9 | 32.3 ± 0.9 | 31.9 ± 0.8 | ||||||
| >1 | 31.2 ± 0.7 | 33.2 ± 0.7 | 30.0 ± 0.6 | 33.0 ± 0.7 | |||||||
| 29–100 DIM | 1 | 31.2 ± 0.8 | 30.1 ± 0.9 | 31.2 ± 0.9 | 28.6 ± 0.8 | ||||||
| >1 | 29.9 ± 0.7 | 30.3 ± 0.7 | 29.3 ± 0.6 | 31.0 ± 0.7 | |||||||
| Water intake, L/d | 0.387 | 0.277 | <0.001 | <0.001 | <0.001 | ||||||
| −42 until B 9 | 1 | 34 ± 5 | 35 ± 6 | 42 ± 6 | 33 ± 5 | ||||||
| >1 | 37 ± 4 | 40 ± 5 | 46 ± 4 | 48 ± 4 | |||||||
| 1–28 DIM | 1 | 47 ± 5 | 59 ± 5 | 51 ± 5 | 46 ± 5 | ||||||
| >1 | 69 ± 4 | 78 ± 4 | 73 ± 4 | 75 ± 4 | |||||||
| 29–100 DIM | 1 | 59 ± 5 | 77 ± 5 | 67 ± 5 | 62 ± 5 | ||||||
| >1 | 79 ± 4 | 84 ± 4 | 91 ± 4 | 95 ± 4 | |||||||
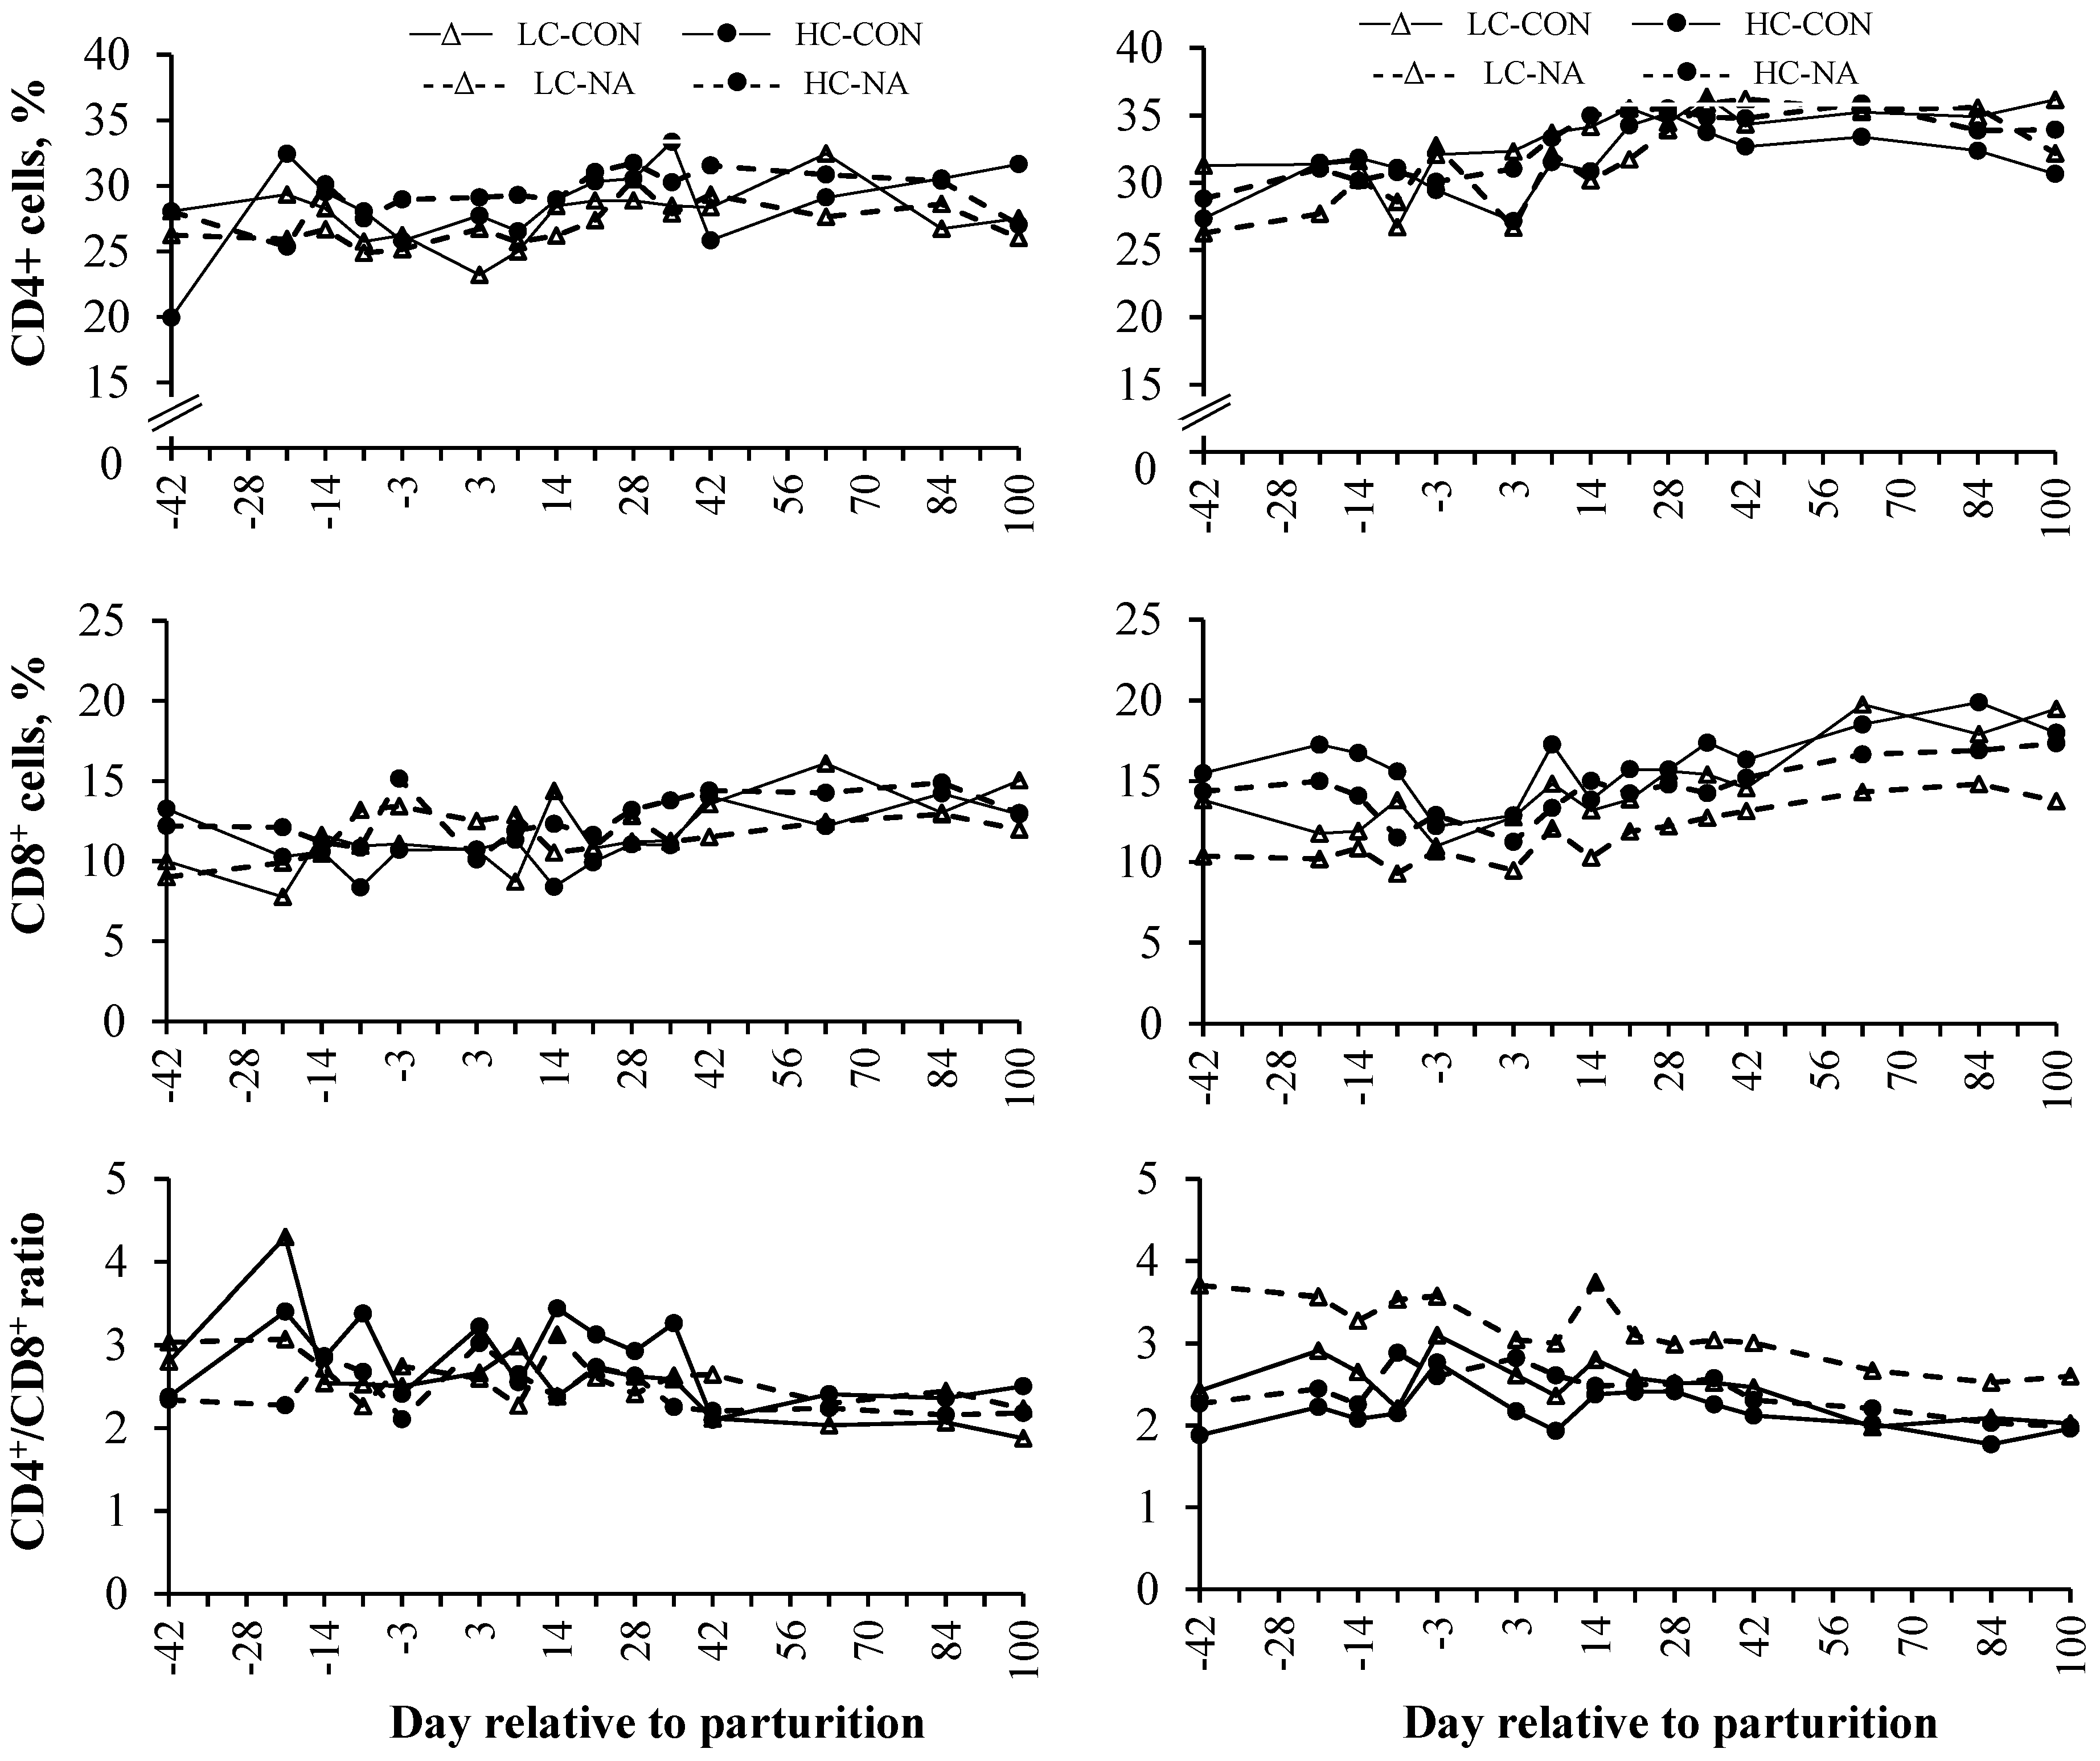
3.5. Lymphocyte Subpopulations
| Item | Diet | P-Value | |||||||||
|---|---|---|---|---|---|---|---|---|---|---|---|
| P 1 | LC-CON 2 | LC-NA 3 | HC-CON 4 | HC-NA 5 | C 6 | S 7 | P 1 | T 8 | C*S*P*T | ||
| CD4+/CD8+ ratio | 0.335 | 0.528 | 0.718 | <0.001 | 0.645 | ||||||
| −42 until B 9 | 1 | 2.8 ± 0.3 | 2.8 ± 0.4 | 2.9 ± 0.4 | 2.5 ± 0.3 | ||||||
| >1 | 2.5 ± 0.3 | 3.4 ± 0.3 | 2.3 ± 0.2 | 2.4 ± 0.3 | |||||||
| 1–28 DIM | 1 | 2.7 ± 0.3 | 2.5 ± 0.4 | 3.1 ± 0.4 | 2.7 ± 0.3 | ||||||
| >1 | 2.6 ± 0.3 | 3.1 ± 0.3 | 2.3 ± 0.2 | 2.6 ± 0.3 | |||||||
| 29–100 DIM | 1 | 2.2 ± 0.3 | 2.5 ± 0.4 | 2.6 ± 0.4 | 2.2 ± 0.3 | ||||||
| >1 | 2.2 ± 0.3 | 2.8 ± 0.3 | 2.0 ± 0.2 | 2.2 ± 0.3 | |||||||
| CD4+, % | 0.368 | 0.955 | <0.001 | <0.001 | 0.128 | ||||||
| −42 until B 9 | 1 | 27.0 ± 1.8 | 25.7 ± 2.0 | 27.8 ± 2.1 | 27.9 ± 1.8 | ||||||
| >1 | 29.4 ± 1.5 | 29.2 ± 1.6 | 30.8 ± 1.3 | 30.2 ± 1.5 | |||||||
| 1–28 DIM | 1 | 26.9 ± 1.7 | 27.4 ± 2.0 | 28.8 ± 1.9 | 30.0 ± 1.7 | ||||||
| >1 | 34.0 ± 1.5 | 31.0 ± 1.6 | 31.8 ± 1.3 | 34.0 ± 1.5 | |||||||
| 29–100 DIM | 1 | 28.5 ± 1.7 | 27.9 ± 1.9 | 30.8 ± 2.0 | 29.9 ± 1.8 | ||||||
| >1 | 35.1 ± 1.5 | 35.0 ± 1.6 | 32.5 ± 1.3 | 34.6 ± 1.5 | |||||||
| CD8+, % | 0.256 | 0.481 | 0.022 | <0.001 | 0.797 | ||||||
| −42 until B 9 | 1 | 10.4 ± 1.7 | 11.1 ± 1.8 | 11.0 ± 1.9 | 12.2 ± 1.6 | ||||||
| >1 | 12.7 ± 1.4 | 10.6 ± 1.5 | 15.3 ± 1.2 | 13.9 ± 1.4 | |||||||
| 1–28 DIM | 1 | 11.2 ± 1.6 | 12.1 ± 1.8 | 10.3 ± 1.8 | 12.0 ± 1.6 | ||||||
| >1 | 14.1 ± 1.4 | 11.4 ± 1.5 | 15.1 ± 1.2 | 13.7 ± 1.4 | |||||||
| 29–100 DIM | 1 | 13.6 ± 1.6 | 12.0 ± 1.8 | 12.8 ± 1.8 | 14.2 ± 1.6 | ||||||
| >1 | 17.3 ± 1.4 | 13.8 ± 1.5 | 18.0 ± 1.2 | 16.0 ± 1.4 | |||||||

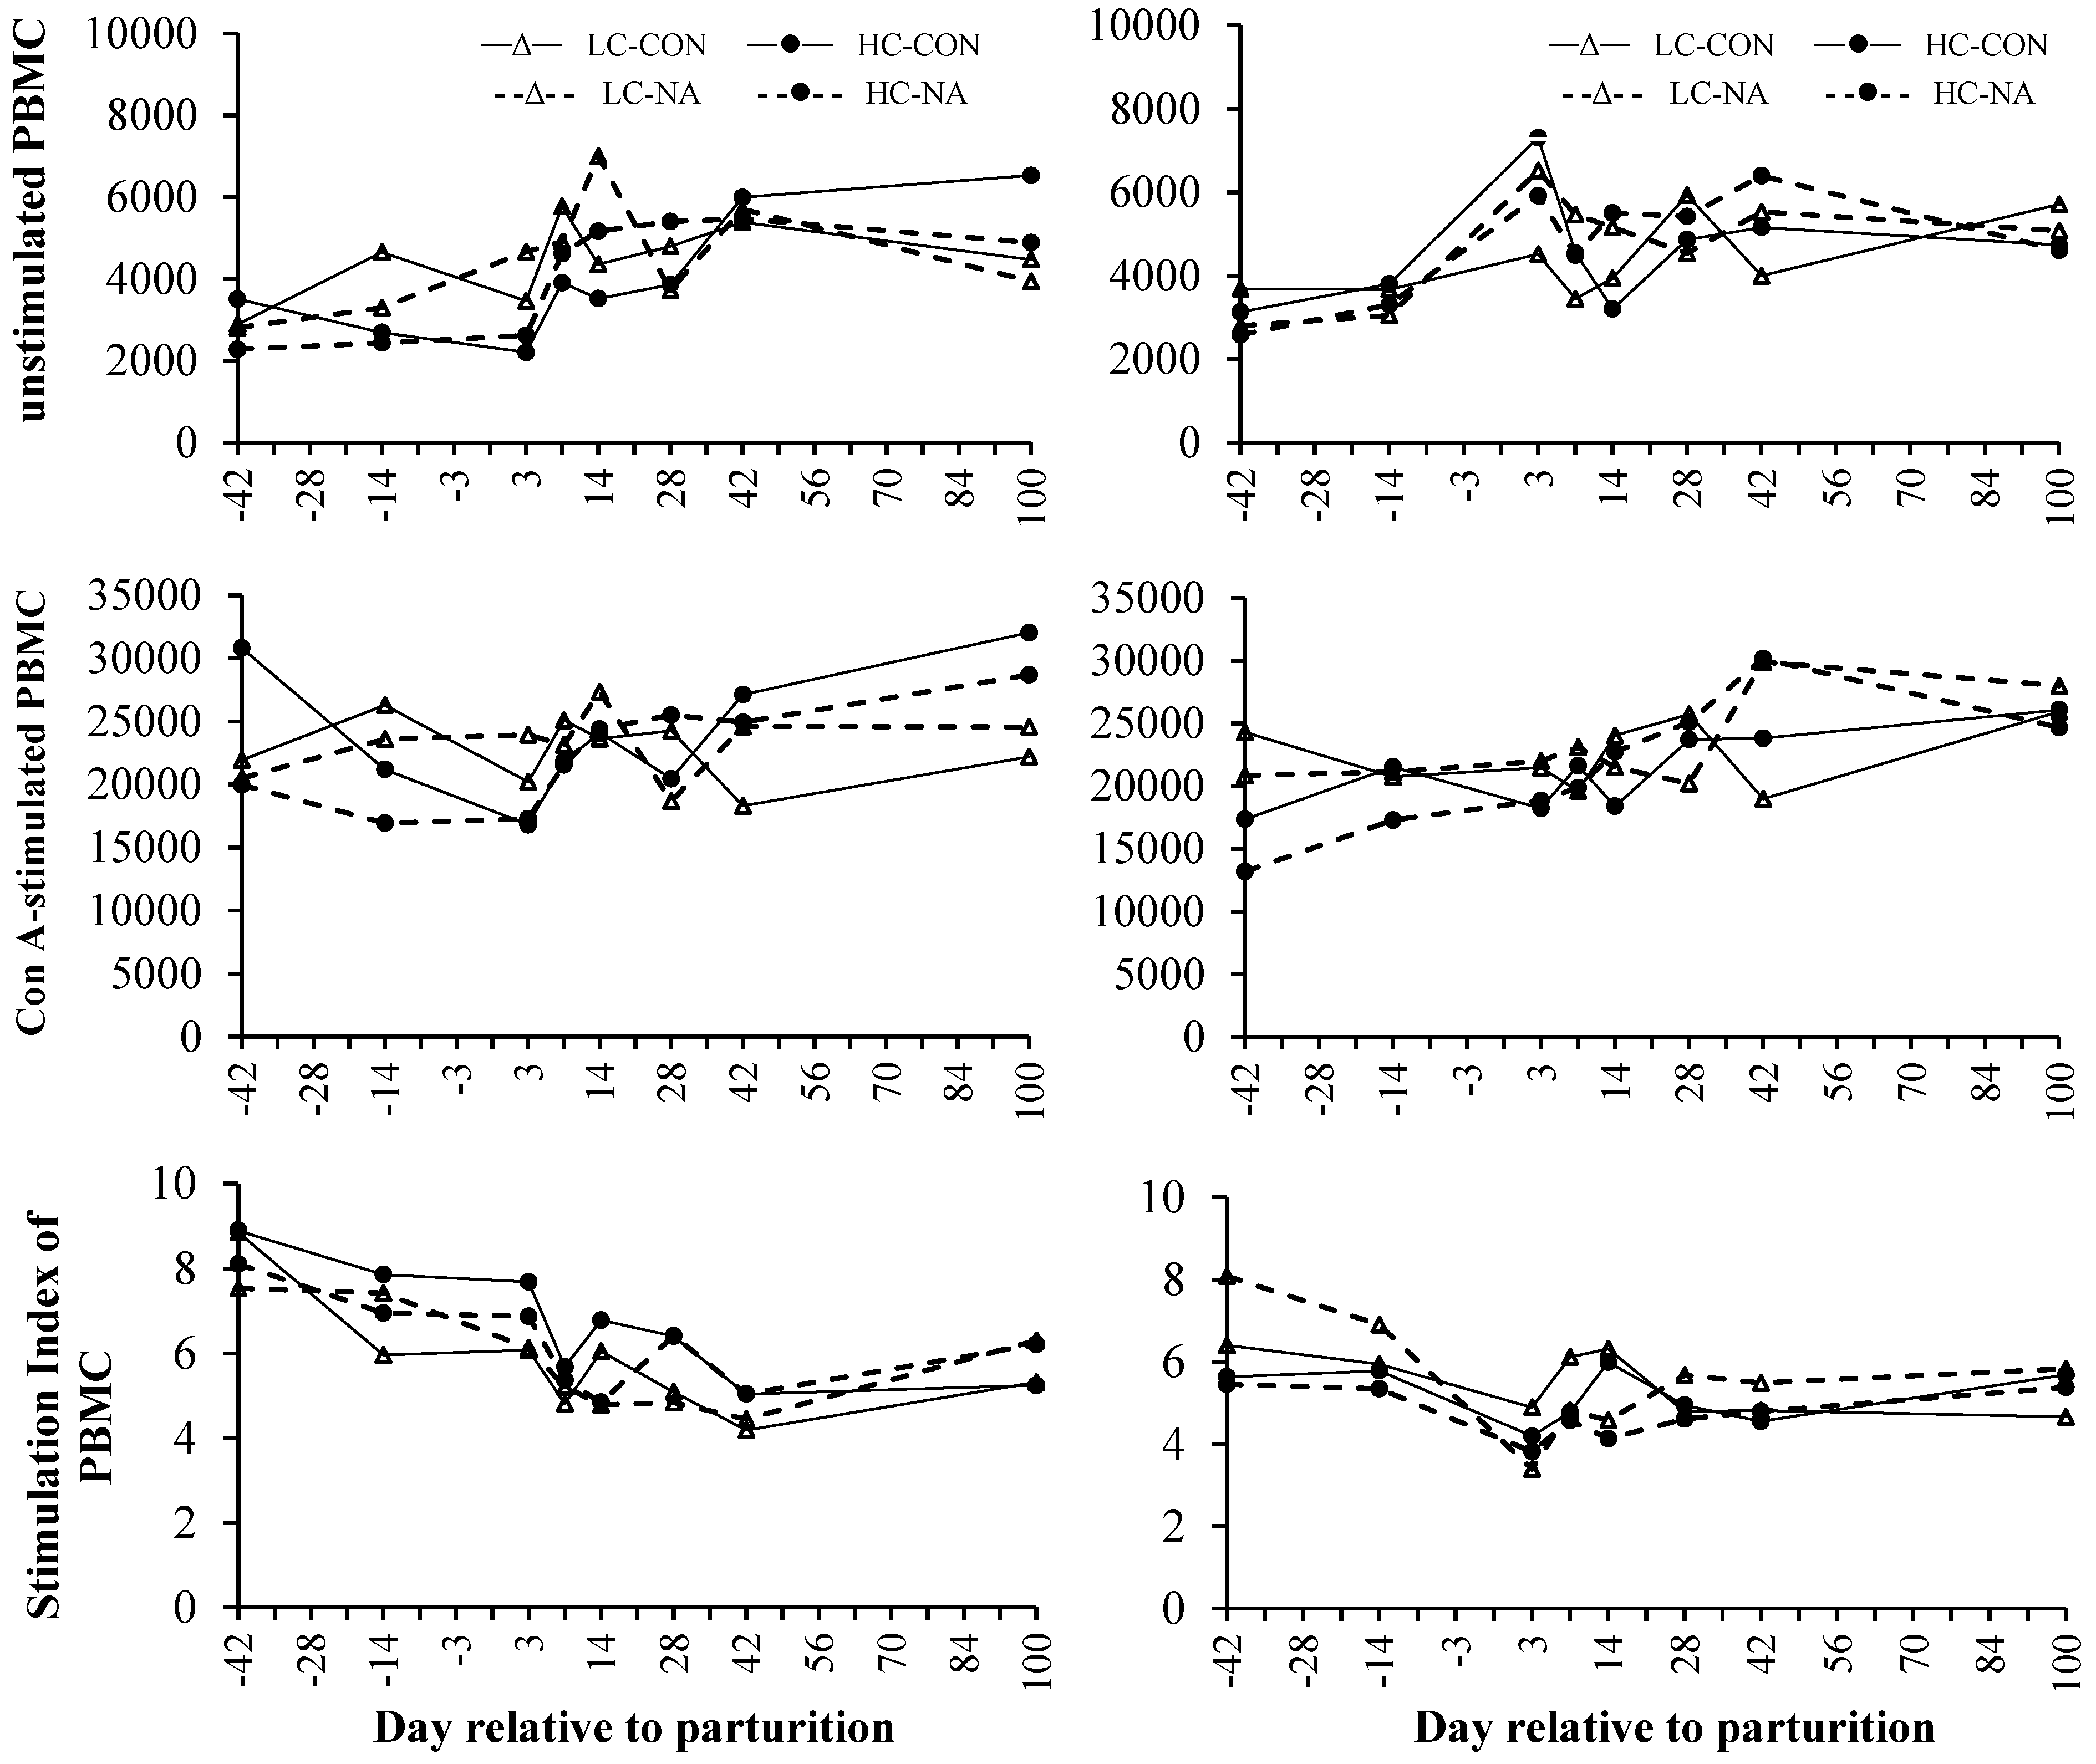
3.6. PBMC Culture ex Vivo
| Diet | P-Value | ||||||||||
|---|---|---|---|---|---|---|---|---|---|---|---|
| Item | P 1 | LC-CON 2 | LC-NA 3 | HC-CON 4 | HC-NA 5 | C 6 | S 7 | P 1 | T 8 | C*S*P*T | |
| Unstimulated PBMC, RFU | 0.828 | 0.909 | 0.431 | <0.001 | 0.895 | ||||||
| −42 until B 9 | 1 | 3774 ± 806 | 3024 ± 960 | 3272 ± 1030 | 2358 ± 806 | ||||||
| >1 | 3680 ± 681 | 2922 ± 736 | 3467 ± 601 | 2912 ± 706 | |||||||
| 1–28 DIM | 1 | 4567 ± 636 | 5076 ± 681 | 3377 ± 681 | 4454 ± 609 | ||||||
| >1 | 4459 ± 515 | 5413 ± 566 | 5065 ± 465 | 5286 ± 516 | |||||||
| 29–100 DIM | 1 | 4932 ± 806 | 4825 ± 902 | 6263 ± 902 | 5183 ± 806 | ||||||
| >1 | 4856 ± 681 | 5309 ± 736 | 4948 ± 601 | 5504 ± 681 | |||||||
| Stimulated PBMC 10, RFU | 0.911 | 0.703 | 0.369 | 0.004 | 0.324 | ||||||
| −42 until B 9 | 1 | 24,110 ± 3144 | 21,671 ± 3702 | 27,976 ± 3923 | 18,441 ± 3144 | ||||||
| >1 | 22,526 ± 2657 | 20,987 ± 2870 | 19,442 ± 2344 | 14,816 ± 2735 | |||||||
| 1–28 DIM | 1 | 23,260 ± 2657 | 23,270 ± 2887 | 20,787 ± 2887 | 22,169 ± 2582 | ||||||
| >1 | 22,721 ± 2182 | 21,567 ± 2385 | 20,535 ± 1955 | 21,602 ± 2188 | |||||||
| 29–100 DIM | 1 | 20,247 ± 3144 | 24,583 ± 3515 | 29,577 ± 3515 | 26,816 ± 3144 | ||||||
| >1 | 22,474 ± 2657 | 28,960 ± 2870 | 24,955 ± 2344 | 27,417 ± 2657 | |||||||
| SI | 0.997 | 0.846 | 0.007 | <0.001 | 0.425 | ||||||
| −42 until B 9 | 1 | 7.4 ± 0.7 | 7.4 ± 0.9 | 8.6 ± 0.9 | 7.5 ± 0.7 | ||||||
| >1 | 6.2 ± 0.6 | 7.5 ± 0.7 | 5.7 ± 0.6 | 5.4 ± 0.6 | |||||||
| 1–28 DIM | 1 | 5.5 ± 0.6 | 5.2 ± 0.7 | 6.6 ± 0.7 | 5.9 ± 0.6 | ||||||
| >1 | 5.5 ± 0.5 | 4.6 ± 0.6 | 4.9 ± 0.5 | 4.3 ± 0.5 | |||||||
| 29–100 DIM | 1 | 4.8 ± 0.7 | 5.4 ± 0.8 | 5.1 ± 0.8 | 5.6 ± 0.7 | ||||||
| >1 | 4.7 ± 0.6 | 5.7 ± 0.7 | 5.1 ± 0.6 | 5.1 ± 0.6 | |||||||

4. Discussion
4.1. Effects of Dietary Concentrate Level
4.2. Effects of NA Supplementation
4.3. Effects of Parity
4.4. Effects of Time
5. Conclusions
Supplementary Files
Supplementary File 1Acknowledgments
Author Contributions
Conflicts of Interest
References
- Hoedemaker, M.; Prange, D.; Zerbe, H.; Frank, J.; Daxenberger, A.; Meyer, H.H.D. Peripartal propylene glycol supplementation and metabolism, animal health, fertility, and production in dairy cows. J. Dairy Sci. 2004, 87, 2136–2145. [Google Scholar] [CrossRef]
- Meglia, G.E.; Johannisson, A.; Agenas, S.; Holtenius, K.; Waller, K.P. Effects of feeding intensity during the dry period on leukocyte and lymphocyte sub-populations, neutrophil function and health in periparturient dairy cows. Vet. J. 2005, 169, 376–384. [Google Scholar] [CrossRef] [PubMed]
- Gonzalez, M.; Yabuta, A.K.; Galindo, F. Behaviour and adrenal activity of first parturition and multiparous cows under a competitive situation. Appl. Anim. Behav. Sci. 2003, 83, 259–266. [Google Scholar] [CrossRef]
- Jonsson, N.N.; Fortes, M.R.S.; Piper, E.K.; Vankan, D.M.; de Cisneros, J.P.J.; Wittek, T. Comparison of metabolic, hematological, and peripheral blood leukocyte cytokine profiles of dairy cows and heifers during the periparturient period. J. Dairy Sci. 2013, 96, 2283–2292. [Google Scholar] [CrossRef] [PubMed]
- Ster, C.; Loiselle, M.C.; Lacasse, P. Effect of postcalving serum nonesterified fatty acids concentration on the functionality of bovine immune cells. J. Dairy. Sci. 2012, 95, 708–717. [Google Scholar] [CrossRef] [PubMed]
- Shafer-Weaver, K.A.; Corl, C.M.; Sordillo, L.M. Shifts in bovine CD4(+) subpopulations increase T-helper-2 compared with T-helper-1 effector cells during the postpartum period. J. Dairy Sci. 1999, 82, 1696–1706. [Google Scholar] [CrossRef]
- Kulberg, S.; Storset, A.K.; Heringstad, B.; Larsen, H.J.S. Reduced levels of total leukocytes and neutrophils in Norwegian cattle selected for decreased mastitis incidence. J. Dairy Sci. 2002, 85, 3470–3475. [Google Scholar] [CrossRef]
- Schulz, K.; Frahm, J.; Kersten, S.; Meyer, U.; Reiche, D.; Sauerwein, H.; Dänicke, S. Effects of elevated parameters of subclinical ketosis on the immune system of dairy cows: In vivo and in vitro results. Arch. Anim. Nutr. 2015, 69, 113–127. [Google Scholar] [CrossRef] [PubMed]
- Bell, A.W. Regulation of organic nutrient metabolism during transition from late pregnancy to early lactation. J. Anim. Sci. 1995, 73, 2804–2819. [Google Scholar] [PubMed]
- Schulz, K.; Frahm, J.; Meyer, U.; Kersten, S.; Reiche, D.; Rehage, J.; Dänicke, S. Effects of prepartal body condition score and peripartal energy supply of dairy cows on postpartal lipolysis, energy balance and ketogenesis: An animal model to investigate subclinical ketosis. J. Dairy Res. 2014, 81, 257–266. [Google Scholar] [CrossRef] [PubMed]
- Janovick, N.A.; Drackley, J.K. Prepartum dietary management of energy intake affects postpartum intake and lactation performance by primiparous and multiparous Holstein cows. J. Dairy Sci. 2010, 93, 3086–3102. [Google Scholar] [CrossRef] [PubMed]
- Burton, J.L.; Kehrli, M.E.; Kapil, S.; Horst, R.L. Regulation of L-selectin and CD18 on bovine neutrophils by glucocorticoids—Effects of cortisol and dexamethasone. J. Leukocyte Biol. 1995, 57, 317–325. [Google Scholar] [PubMed]
- Renner, L.; von Soosten, D.; Sipka, A.; Döll, S.; Beineke, A.; Schuberth, H.J.; Dänicke, S. Effect of conjugated linoleic acid on proliferation and cytokine expression of bovine peripheral blood mononuclear cells and splenocytes ex vivo. Arch. Anim. Nutr. 2012, 66, 73–85. [Google Scholar] [CrossRef] [PubMed]
- Lacetera, N.; Scalia, D.; Franci, O.; Bernabucci, U.; Ronchi, B.; Nardone, A. Short communication: Effects of nonesterified fatty acids on lymphocyte function in dairy heifers. J. Dairy Sci. 2004, 87, 1012–1014. [Google Scholar] [CrossRef]
- Klinkon, M.; Zadnik, T. Dynamics of red and white blood picture in dairy cows during the periparturient period. Comp. Haematol. Int. 1999, 9, 156–161. [Google Scholar] [CrossRef]
- Orru, L.; Abeni, F.; Catillo, G.; Grandoni, F.; Crisa, A.; De Matteis, G.; Scata, M.C.; Napolitano, F.; Moioli, B. Leptin gene haplotypes are associated with change in immunological and hematological variables in dairy cow during the peripartum period. J. Anim. Sci. 2012, 90, 16–26. [Google Scholar] [CrossRef] [PubMed]
- Van Kampen, C.; Mallard, B.A. Effects of peripartum stress and health on circulating bovine lymphocyte subsets. Vet. Immunol. Immunopathol. 1997, 59, 79–91. [Google Scholar] [CrossRef]
- Sinthupoom, N.; Prachayasittikul, V.; Prachayasittikul, S.; Ruchirawat, S.; Prachayasittikul, V. Nicotinic acid and derivatives as multifunctional pharmacophores for medical applications. Eur. Food Res. Technol. 2015, 240, 1–17. [Google Scholar] [CrossRef]
- Fox, C.J.; Hammerman, P.S.; Thompson, C.B. Fuel feeds function: Energy metabolism and the T-cell response. Nat. Rev. Immunol. 2005, 5, 844–852. [Google Scholar] [CrossRef] [PubMed]
- Weitberg, A.B. Effect of nicotinic-acid supplementation in vivo on oxygen radical-induced genetic-damage in human-lymphocytes. Mutat. Res. 1989, 216, 197–201. [Google Scholar] [CrossRef]
- Titgemeyer, E.C.; Mamedova, L.K.; Spivey, K.S.; Farney, J.K.; Bradford, B.J. An unusual distribution of the niacin receptor in cattle. J. Dairy Sci. 2011, 94, 4962–4967. [Google Scholar] [CrossRef] [PubMed]
- Kostylina, G.; Simon, D.; Fey, M.F.; Yousefi, S.; Simon, H.U. Neutrophil apoptosis mediated by nicotinic acid receptors (GPR109A). Cell Death Diff. 2008, 15, 134–142. [Google Scholar] [CrossRef] [PubMed]
- Benyo, Z.; Gille, A.; Kero, J.; Csiky, M.; Suchankova, M.C.; Nusing, R.M.; Moers, A.; Pfeffer, K.; Offermanns, S. GPR109A (PUMA-G/HM74A) mediates nicotinic acid-induced flushing. J. Clin. Investig. 2005, 115, 3634–3640. [Google Scholar] [CrossRef] [PubMed]
- McArt, J.A.A.; Nydam, D.V.; Oetzel, G.R. Epidemiology of subclinical ketosis in early lactation dairy cattle. J. Dairy Sci. 2012, 95, 5056–5066. [Google Scholar] [CrossRef] [PubMed]
- Sato, S.; Suzuki, T.; Okada, K. Suppression of mitogenic response of bovine peripheral blood lymphocytes by ketone bodies. J. Vet. Med. Sci. 1995, 57, 183–185. [Google Scholar] [CrossRef] [PubMed]
- Lacetera, N.; Franci, O.; Scalia, D.; Bernabucci, U.; Ronchi, B.; Nardone, A. Effects of nonesterified fatty acids and beta-hydroxybutyrate on functions of mononuclear cells obtained from ewes. Am. J. Vet. Res. 2002, 63, 414–418. [Google Scholar] [CrossRef] [PubMed]
- Morey, S.D.; Mamedova, L.K.; Anderson, D.E.; Armendariz, C.K.; Titgemeyer, E.C.; Bradford, B.J. Effects of encapsulated niacin on metabolism and production of periparturient dairy cows. J. Dairy Sci. 2011, 94, 5090–5104. [Google Scholar] [CrossRef] [PubMed]
- Kenez, A.; Locher, L.; Rehage, J.; Dänicke, S.; Huber, K. Agonists of the G protein-coupled receptor 109A-mediated pathway promote antilipolysis by reducing serine residue 563 phosphorylation of hormone-sensitive lipase in bovine adipose tissue explants. J. Dairy Sci. 2014, 97, 3626–3634. [Google Scholar] [CrossRef] [PubMed]
- Tienken, R.; Kersten, S.; Frahm, J.; Meyer, U.; Locher, L.; Rehage, J.; Huber, K.; Kenez, A.; Sauerwein, H.; Mielenz, M.; et al. Effects of an energy-dense diet and nicotinic acid supplementation on production and metabolic variables of primiparous or multiparous cows in late pregnancy and early lactation. Arch. Anim. Nutr. submitted.
- GfE. Empfehlungen zur Energie- und Nährstoffversorgung der Milchkühe und Aufzuchtrinder (recommendations of energy and nutrient supply for dairy cows and breeding cattle); DLG-Verlag GmbH: Frankfurt am Main, Germany, 2001. [Google Scholar]
- Renner, L.; Schwabe, A.; Doll, S.; Holtershinken, M.; Danicke, S. Effect of rare earth elements on beef cattle growth performance, blood clinical chemical parameters and mitogen stimulated proliferation of bovine peripheral blood mononuclear cells in vitro and ex vivo. Toxicol. Lett. 2011, 201, 277–284. [Google Scholar] [CrossRef] [PubMed]
- O’Brien, J.; Wilson, I.; Orton, T.; Pognan, F. Investigation of the alamar blue (resazurin) fluorescent dye for the assessment of mammalian cell cytotoxicity. Eur. J. Biochem. 2000, 267, 5421–5426. [Google Scholar] [CrossRef] [PubMed]
- Goyarts, T.; Dänicke, S.; Grovel, N.; Tiemann, U.; Rothotter, H.J. Methodical aspects of in vitro proliferation of porcine blood lymphocytes when exposed to deoxynivalenol (don). Landbauforsch. Volk. 2006, 56, 139–148. [Google Scholar]
- Niehoff, I.D.; Hüther, L.; Lebzien, P.; Bigalke, W.; Dänicke, S.; Flachowsky, G. Investigations on the effect of a niacin supplementation to three diets differing in forage-to-concentrate ratio on several blood and milk variables of dairy cows. Arch. Anim. Nutr. 2009, 63, 203–218. [Google Scholar] [CrossRef]
- Rungruang, S.; Collier, J.L.; Rhoads, R.P.; Baumgard, L.H.; de Veth, M.J.; Collier, R.J. A dose-response evaluation of rumen-protected niacin in thermoneutral or heat-stressed lactating holstein cows. J. Dairy Sci. 2014, 97, 5023–5034. [Google Scholar] [CrossRef] [PubMed]
- Anderson, B.H.; Watson, D.L.; Colditz, I.G. The effect of dexamethasone on some immunological parameters in cattle. Vet. Res. Commun. 1999, 23, 399–413. [Google Scholar] [CrossRef] [PubMed]
- Tanaka, T.; Arai, M.; Ohtani, S.; Uemura, S.; Kuroiwa, T.; Kim, S.; Kamomae, H. Influence of parity on follicular dynamics and resumption of ovarian cycle in postpartum dairy cows. Anim. Reprod. Sci. 2008, 108, 134–143. [Google Scholar] [CrossRef] [PubMed]
- Mcgee, M.; Drennan, M.J.; Caffrey, P.J. Effect of age and nutrient restriction pre partum on beef suckler cow serum immunoglobulin concentrations, colostrum yield, composition and immunoglobulin concentration and immune status of their progeny. Irish J. Agric. Food Res. 2006, 45, 157–171. [Google Scholar]
- Mehrzad, J.; Zhao, X. T lymphocyte proliferative capacity and CD4(+)/CD8(+) ratio in primiparous and pluriparous lactating cows. J. Dairy Res. 2008, 75, 457–465. [Google Scholar] [CrossRef] [PubMed]
- Renner, L.; Pappritz, J.; Kramer, R.; Kersten, S.; Jahreis, G.; Dänicke, S. Fatty acid profile and proliferation of bovine blood mononuclear cells after conjugated linoleic acid supplementation. Lipids Health Dis. 2012, 11. [Google Scholar] [CrossRef] [PubMed]
- Watabe, A.; Hanazono, K.; Komatsu, T.; Fu, D.R.; Endo, Y.; Kadosawa, T. Peripheral lymphocyte subsets as a prognostic indicator of mortality and morbidity in healthy dogs. J. Vet. Med. Sci. 2012, 74, 937–943. [Google Scholar] [CrossRef] [PubMed]
- Harp, J.A.; Kehrli, M.E.; Hurley, D.J.; Wilson, R.A.; Boone, T.C. Numbers and percent of lymphocytes-T in bovine peripheral-blood during the periparturient period. Vet. Immunol. Immunop. 1991, 28, 29–35. [Google Scholar] [CrossRef]
© 2015 by the authors; licensee MDPI, Basel, Switzerland. This article is an open access article distributed under the terms and conditions of the Creative Commons Attribution license (http://creativecommons.org/licenses/by/4.0/).
Share and Cite
Tienken, R.; Kersten, S.; Frahm, J.; Hüther, L.; Meyer, U.; Huber, K.; Rehage, J.; Dänicke, S. Effects of Prepartum Dietary Energy Level and Nicotinic Acid Supplementation on Immunological, Hematological and Biochemical Parameters of Periparturient Dairy Cows Differing in Parity. Animals 2015, 5, 910-933. https://doi.org/10.3390/ani5030391
Tienken R, Kersten S, Frahm J, Hüther L, Meyer U, Huber K, Rehage J, Dänicke S. Effects of Prepartum Dietary Energy Level and Nicotinic Acid Supplementation on Immunological, Hematological and Biochemical Parameters of Periparturient Dairy Cows Differing in Parity. Animals. 2015; 5(3):910-933. https://doi.org/10.3390/ani5030391
Chicago/Turabian StyleTienken, Reka, Susanne Kersten, Jana Frahm, Liane Hüther, Ulrich Meyer, Korinna Huber, Jürgen Rehage, and Sven Dänicke. 2015. "Effects of Prepartum Dietary Energy Level and Nicotinic Acid Supplementation on Immunological, Hematological and Biochemical Parameters of Periparturient Dairy Cows Differing in Parity" Animals 5, no. 3: 910-933. https://doi.org/10.3390/ani5030391
APA StyleTienken, R., Kersten, S., Frahm, J., Hüther, L., Meyer, U., Huber, K., Rehage, J., & Dänicke, S. (2015). Effects of Prepartum Dietary Energy Level and Nicotinic Acid Supplementation on Immunological, Hematological and Biochemical Parameters of Periparturient Dairy Cows Differing in Parity. Animals, 5(3), 910-933. https://doi.org/10.3390/ani5030391