1. Introduction
Animal mistreatment is a complex issue that affects countless animals worldwide [
1]. Differences exist in the literature and the common vernacular regarding the use and meaning of terms such as cruelty, neglect, abuse and maltreatment. As such, here we will use the term ‘animal mistreatment’ to refer to all instances of significant animal suffering caused by a human, including both neglect and cruelty, regardless of intent. In Australia, around 55,000–60,000 reports of animal mistreatment are made each year to the RSPCA [
2], approximately 11,000 of which are made in the state of Victoria [
3]. While this is a substantial number, it is likely that, similar to other related social issues such as domestic violence and child abuse [
4,
5,
6], these reports are just the ‘tip of the iceberg’ [
7]. Taking the lead from more developed fields of prevention and intervention such as interpersonal violence and public health, understanding the extent of such an issue is the first crucial step in developing informed intervention strategies [
8]. Previous research has investigated the prevalence of overt animal cruelty in non-representative samples of various subpopulations (e.g., adolescents [
9], domestic violence perpetrators [
10], and prison inmates [
11]). Additionally, one study examined the prevalence of self-reported intentional animal abuse in two cities in Russia and Ukraine [
12]. However, to date, there has been no empirical investigation of the prevalence of animal mistreatment (including both neglect and cruelty) in the general community and it is unknown how accurate a reflection official case data (reports made by the community) are of what is actually occurring in the community. Consequently, it is likely that the true scale of the problem has been largely overlooked. It is crucial to understand this for informed and effective policy and resourcing decisions to be made.
Using the only information available to them, animal welfare organisations and researchers have taken to analysing case data and even more limiting, prosecution records, for various trends [
13,
14,
15]. Analysis of the Victorian (Australia) data has found that the number of cases differ significantly between Local Government Areas (LGAs). That is, some LGAs have consistently high numbers of cases, while others have low numbers of cases. These results are often communicated in the mainstream media, identifying ‘cruelty hot spots’ [
16,
17,
18,
19,
20,
21,
22]. However, it is also found that the majority of complaints relate to issues of neglect rather than intentional cruelty. The observed differences between LGAs have also prompted interest in region specific intervention programs where there are high numbers of cases [
23]. However, it is unknown if these differences in the number of cases between LGAs represent a true difference in prevalence of animal mistreatment, or merely differences in reporting. Indeed, many factors may influence reporting behaviour and an alternate explanation of these trends is that people in areas with high numbers of cases actually care
more about animals and are therefore more likely to report when they see something wrong.
Consequently, in order to understand how case data trends relate to the actual prevalence of mistreatment, it is also important to understand how and why members of the community respond to witnessing instances of mistreatment; what do they do and why do they do it? Of particular interest is why people choose to report (or not) to authorities. While factors influencing reporting have been examined in other criminal situations [
24], only one study that we are aware of has investigated this with regard to animal mistreatment. Taylor and Signal [
25] investigated the relationships between several, mainly demographic, factors and people’s propensity to report mistreatment. They found that individuals who identified as female, those working in ‘white collar jobs’, and those with an awareness of the link between animal cruelty and family violence, had a greater propensity to report mistreatment. While these are interesting findings, only one of these factors is open to change (awareness of the link between animal cruelty and family violence) and it would be beneficial for prevention initiatives to understand more about the attitudinal factors that influence reporting.
Therefore, the aim of this study was to gain a more objective understanding of the prevalence and types of animal mistreatment in Victoria, as well as how the community responds to witnessing mistreatment and why. Specifically, we aimed to determine how areas with high numbers of RSPCA Victoria cases differed with respect to these factors (prevalence, types, actions, and attitudes) to similar areas with low numbers of cases. Not only will this information prove valuable for decision making and planning of prevention activities in Victoria, it will also serve as an indicator of the accuracy of case data and trends for organisations worldwide.
2. Materials and Methods
2.1. Human Ethics Approval
This project was conducted in accordance with the National Statement on Ethical Conduct in Human Research (2007) guidelines and regulations. Ethics approval for both the formative focus groups (ID: 1853397) and survey (ID: 1954263) was granted by the University of Melbourne Veterinary and Agricultural Sciences Human Ethics Advisory Group. All participants provided informed consent prior to partaking and were given the opportunity to withdraw their data upon completion of the task.
2.2. Focus Groups
Four focus groups, consisting of between six and twelve participants, were conducted in February 2019. The aim of the focus groups was to elicit common attitudes and beliefs from the general community to inform item development for the subsequent Computer Assisted Telephone Interview (CATI) questionnaire. The sessions were conducted in person at community spaces (library and a neighbourhood house) in the City of Latrobe region. The City of Latrobe region was used because a separate project, for which it was the focal site, provided the opportunity to conduct this work. Adult members of the general community were recruited through advertisements in social media groups (buy/swap/sell groups and community noticeboard groups) and provided with a financial incentive ($60) to attract a range of views. The final sample consisted of 37 individuals, 26 female, 10 male, and 1 gender non-binary, aged from 18 to 65 years. No recruits were refused participation. Key themes discussed included attitudes towards animals, what constitutes mistreatment, and perceived prevalence of mistreatment. Common themes and attitudes were identified for inclusion in the questionnaire.
2.3. Survey Questionnaire
The questionnaire was designed to investigate (1) the prevalence of mistreatment, (2) the actions taken after witnessing mistreatment and, (3) people’s attitudes towards reporting mistreatment. Demographic questions (age, education, country of birth, income bracket) were also included.
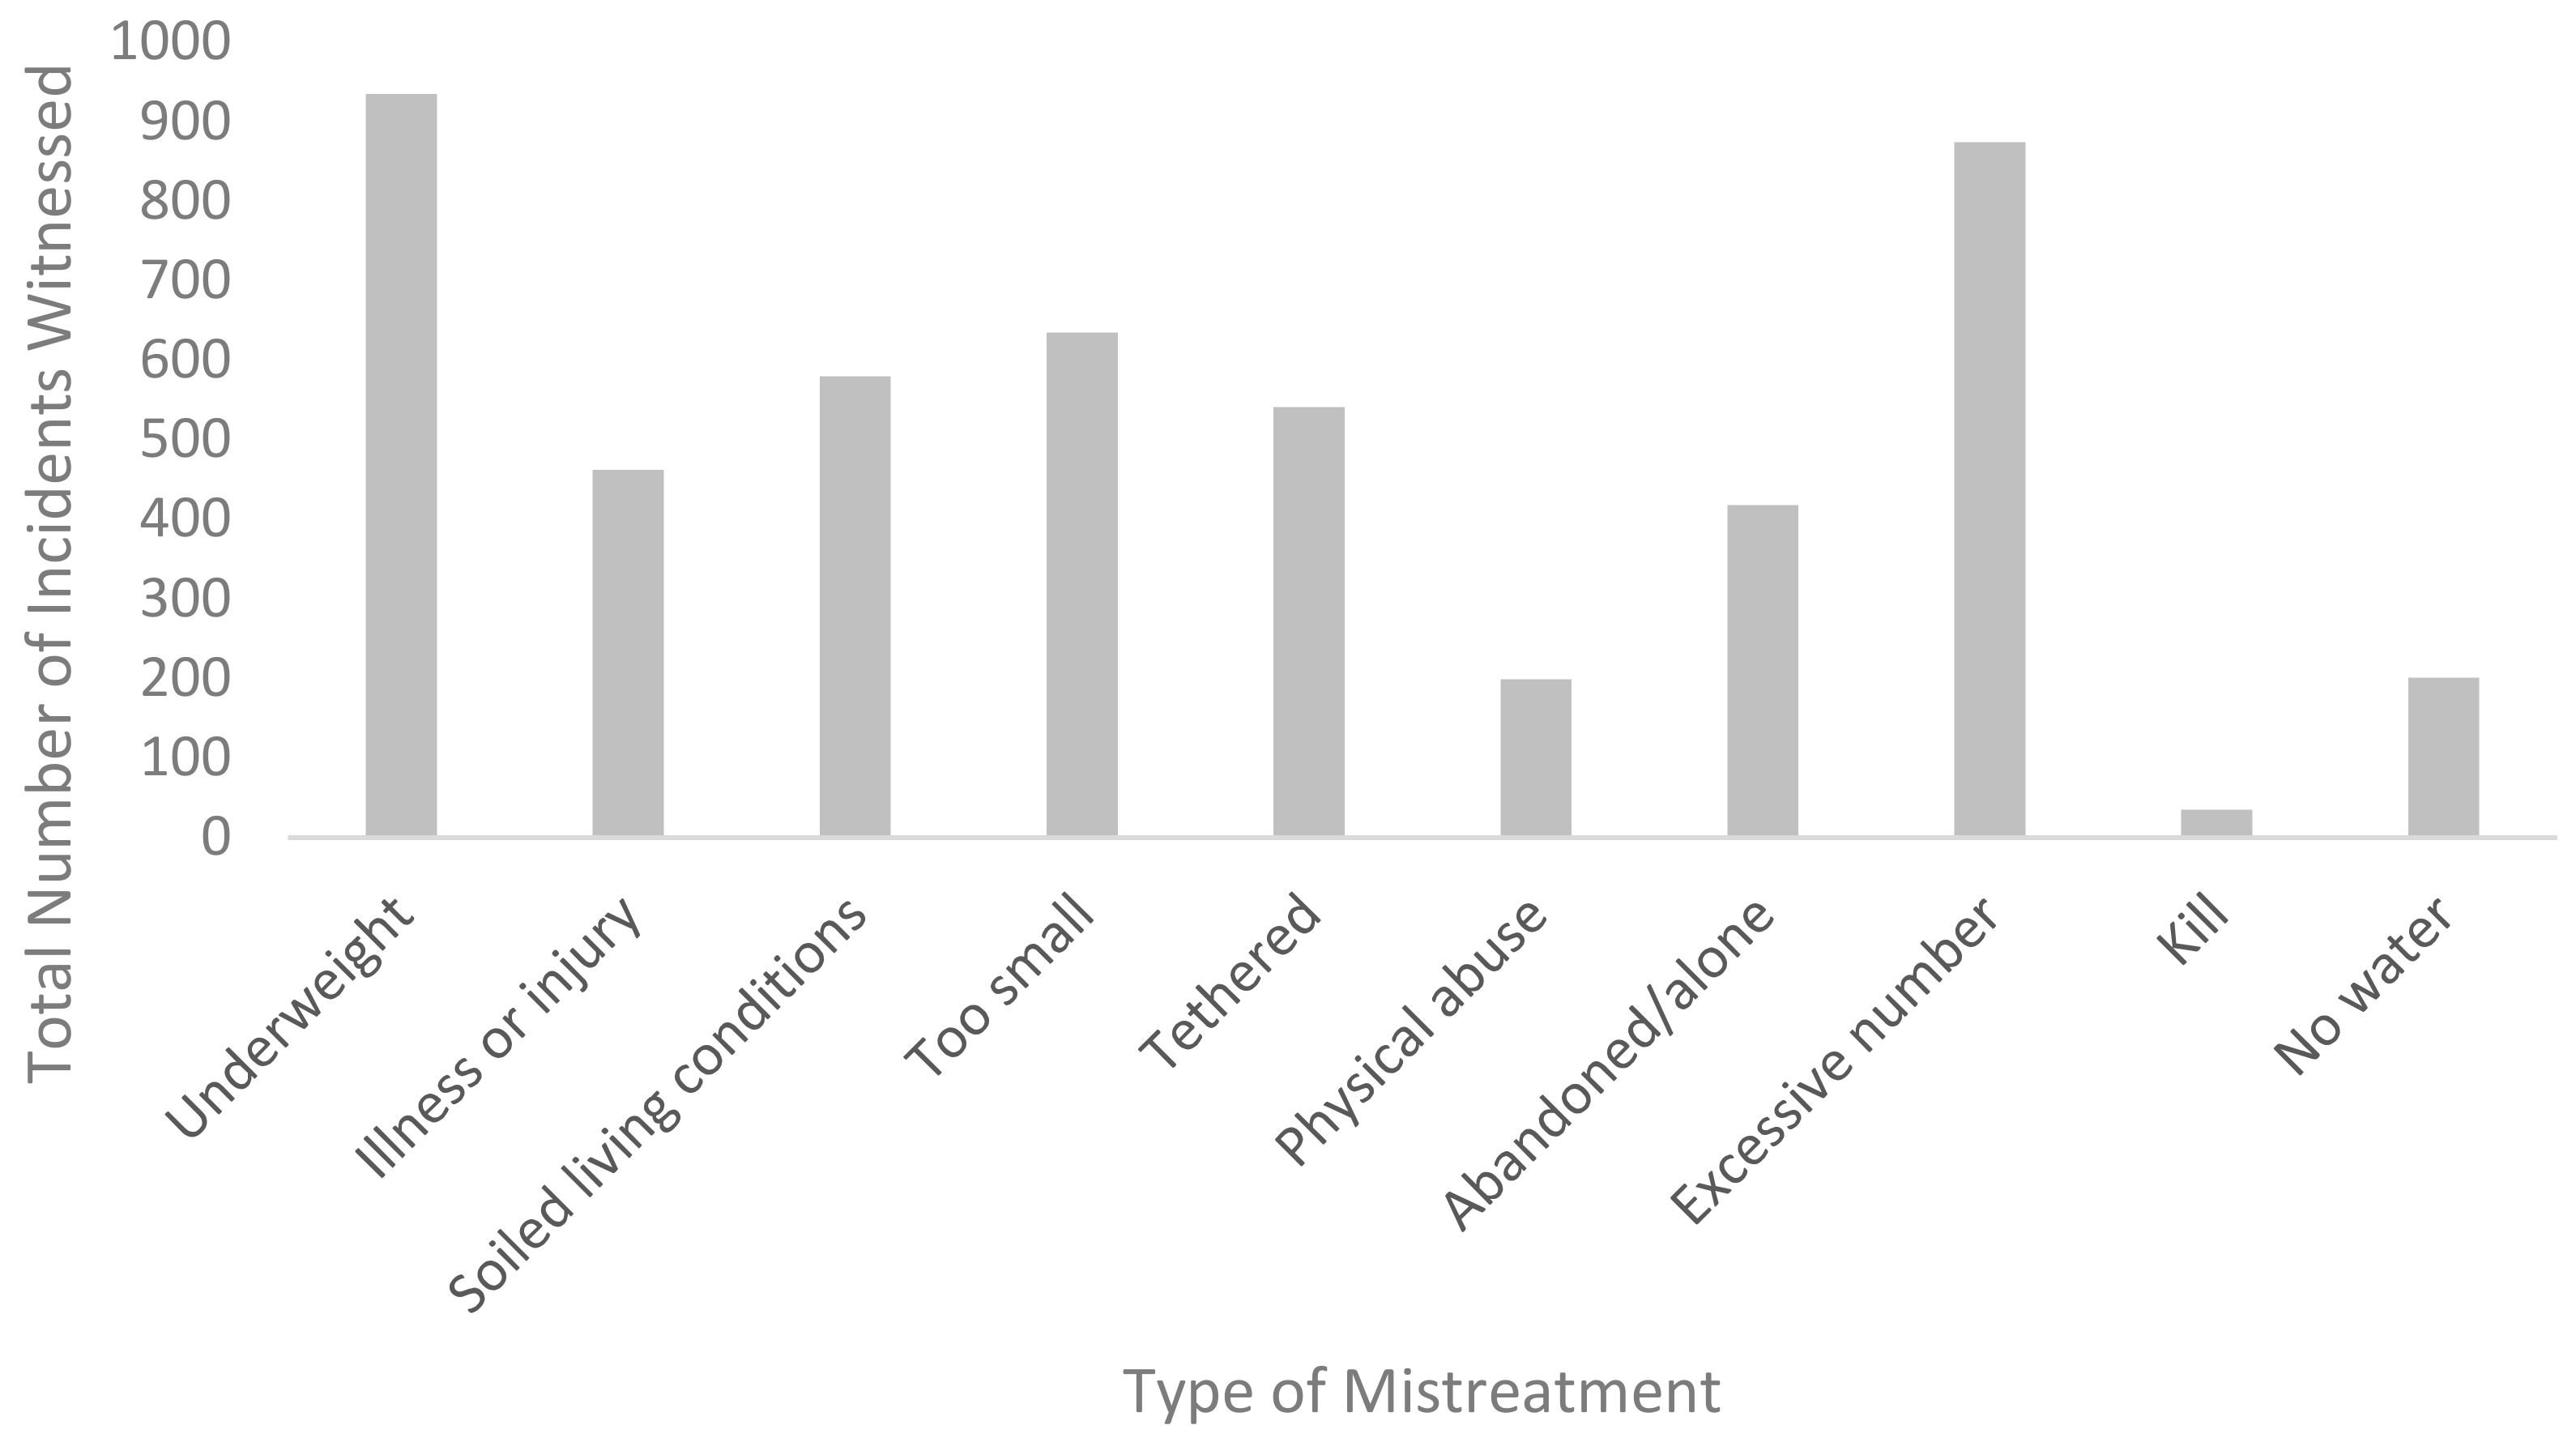
To estimate the prevalence of animal mistreatment, we investigated the number of incidents of mistreatment participants could recall witnessing in the past 12 months. However, animal mistreatment is a subjective topic; what one person considers to be mistreatment, another may not. As such, instead of simply asking whether a person had witnessed ‘mistreatment’, participants were asked ‘In the last 12 months have you seen in your neighbourhood:’ and then explicit descriptions of ten common types of animal mistreatment (as identified from RSPCA Victoria cases) were read out (see
Table 1). If they answered yes to any of these, they were asked on how many separate occasions (i.e., involving different animals) they had seen this and the numeric value was recorded. These descriptions were based on commonly used descriptors or guidelines used by RSPCA employees when determining whether a situation likely involves mistreatment.
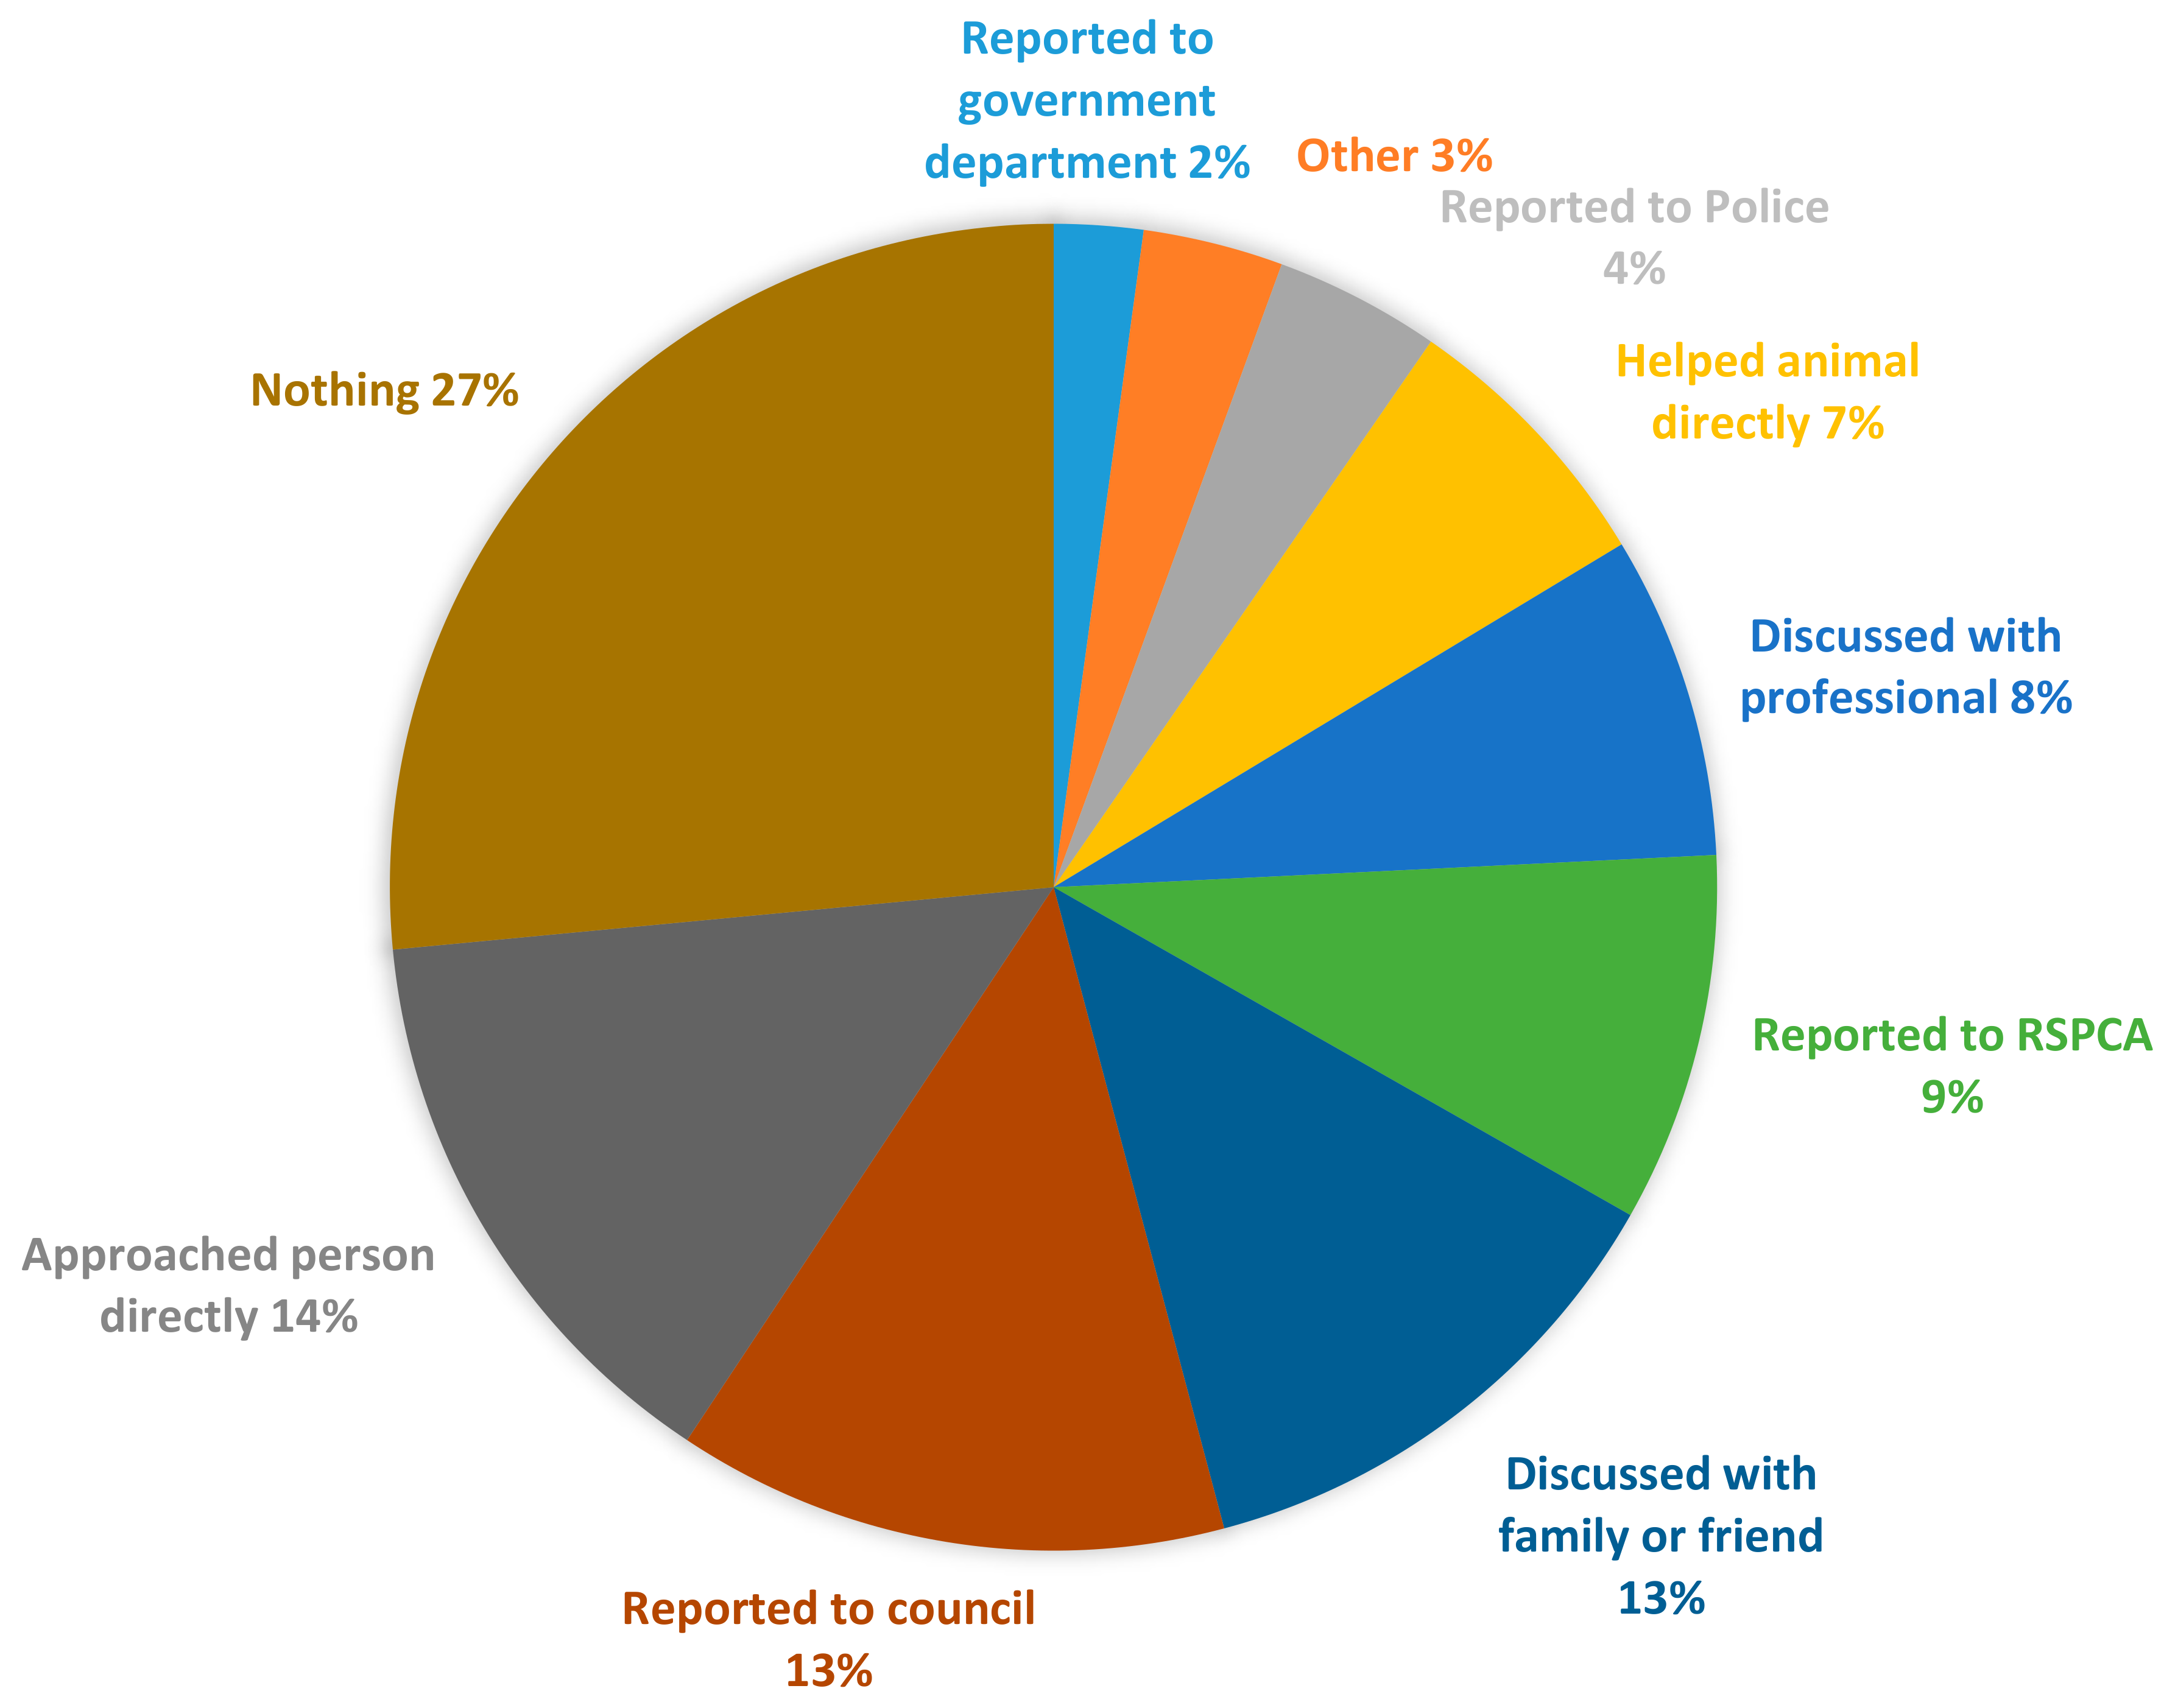
For each type of mistreatment that a participant had witnessed, they were then asked what they did, or most recently did if there were multiple occasions, after witnessing it. Participants selected one option for each type of mistreatment they had witnessed from the following list: 1. Made a report to RSPCA, 2. Made a report to the local council, 3. Made a report to a government department or other statutory authority, 4. Made a report to Police, 5. Discussed your concern with a professional, e.g., vet, animal welfare worker, 6. Sought advice from a family member or friend, 7. Other, (please specify), 8. Nothing. The response options were randomised in order to prevent response bias.
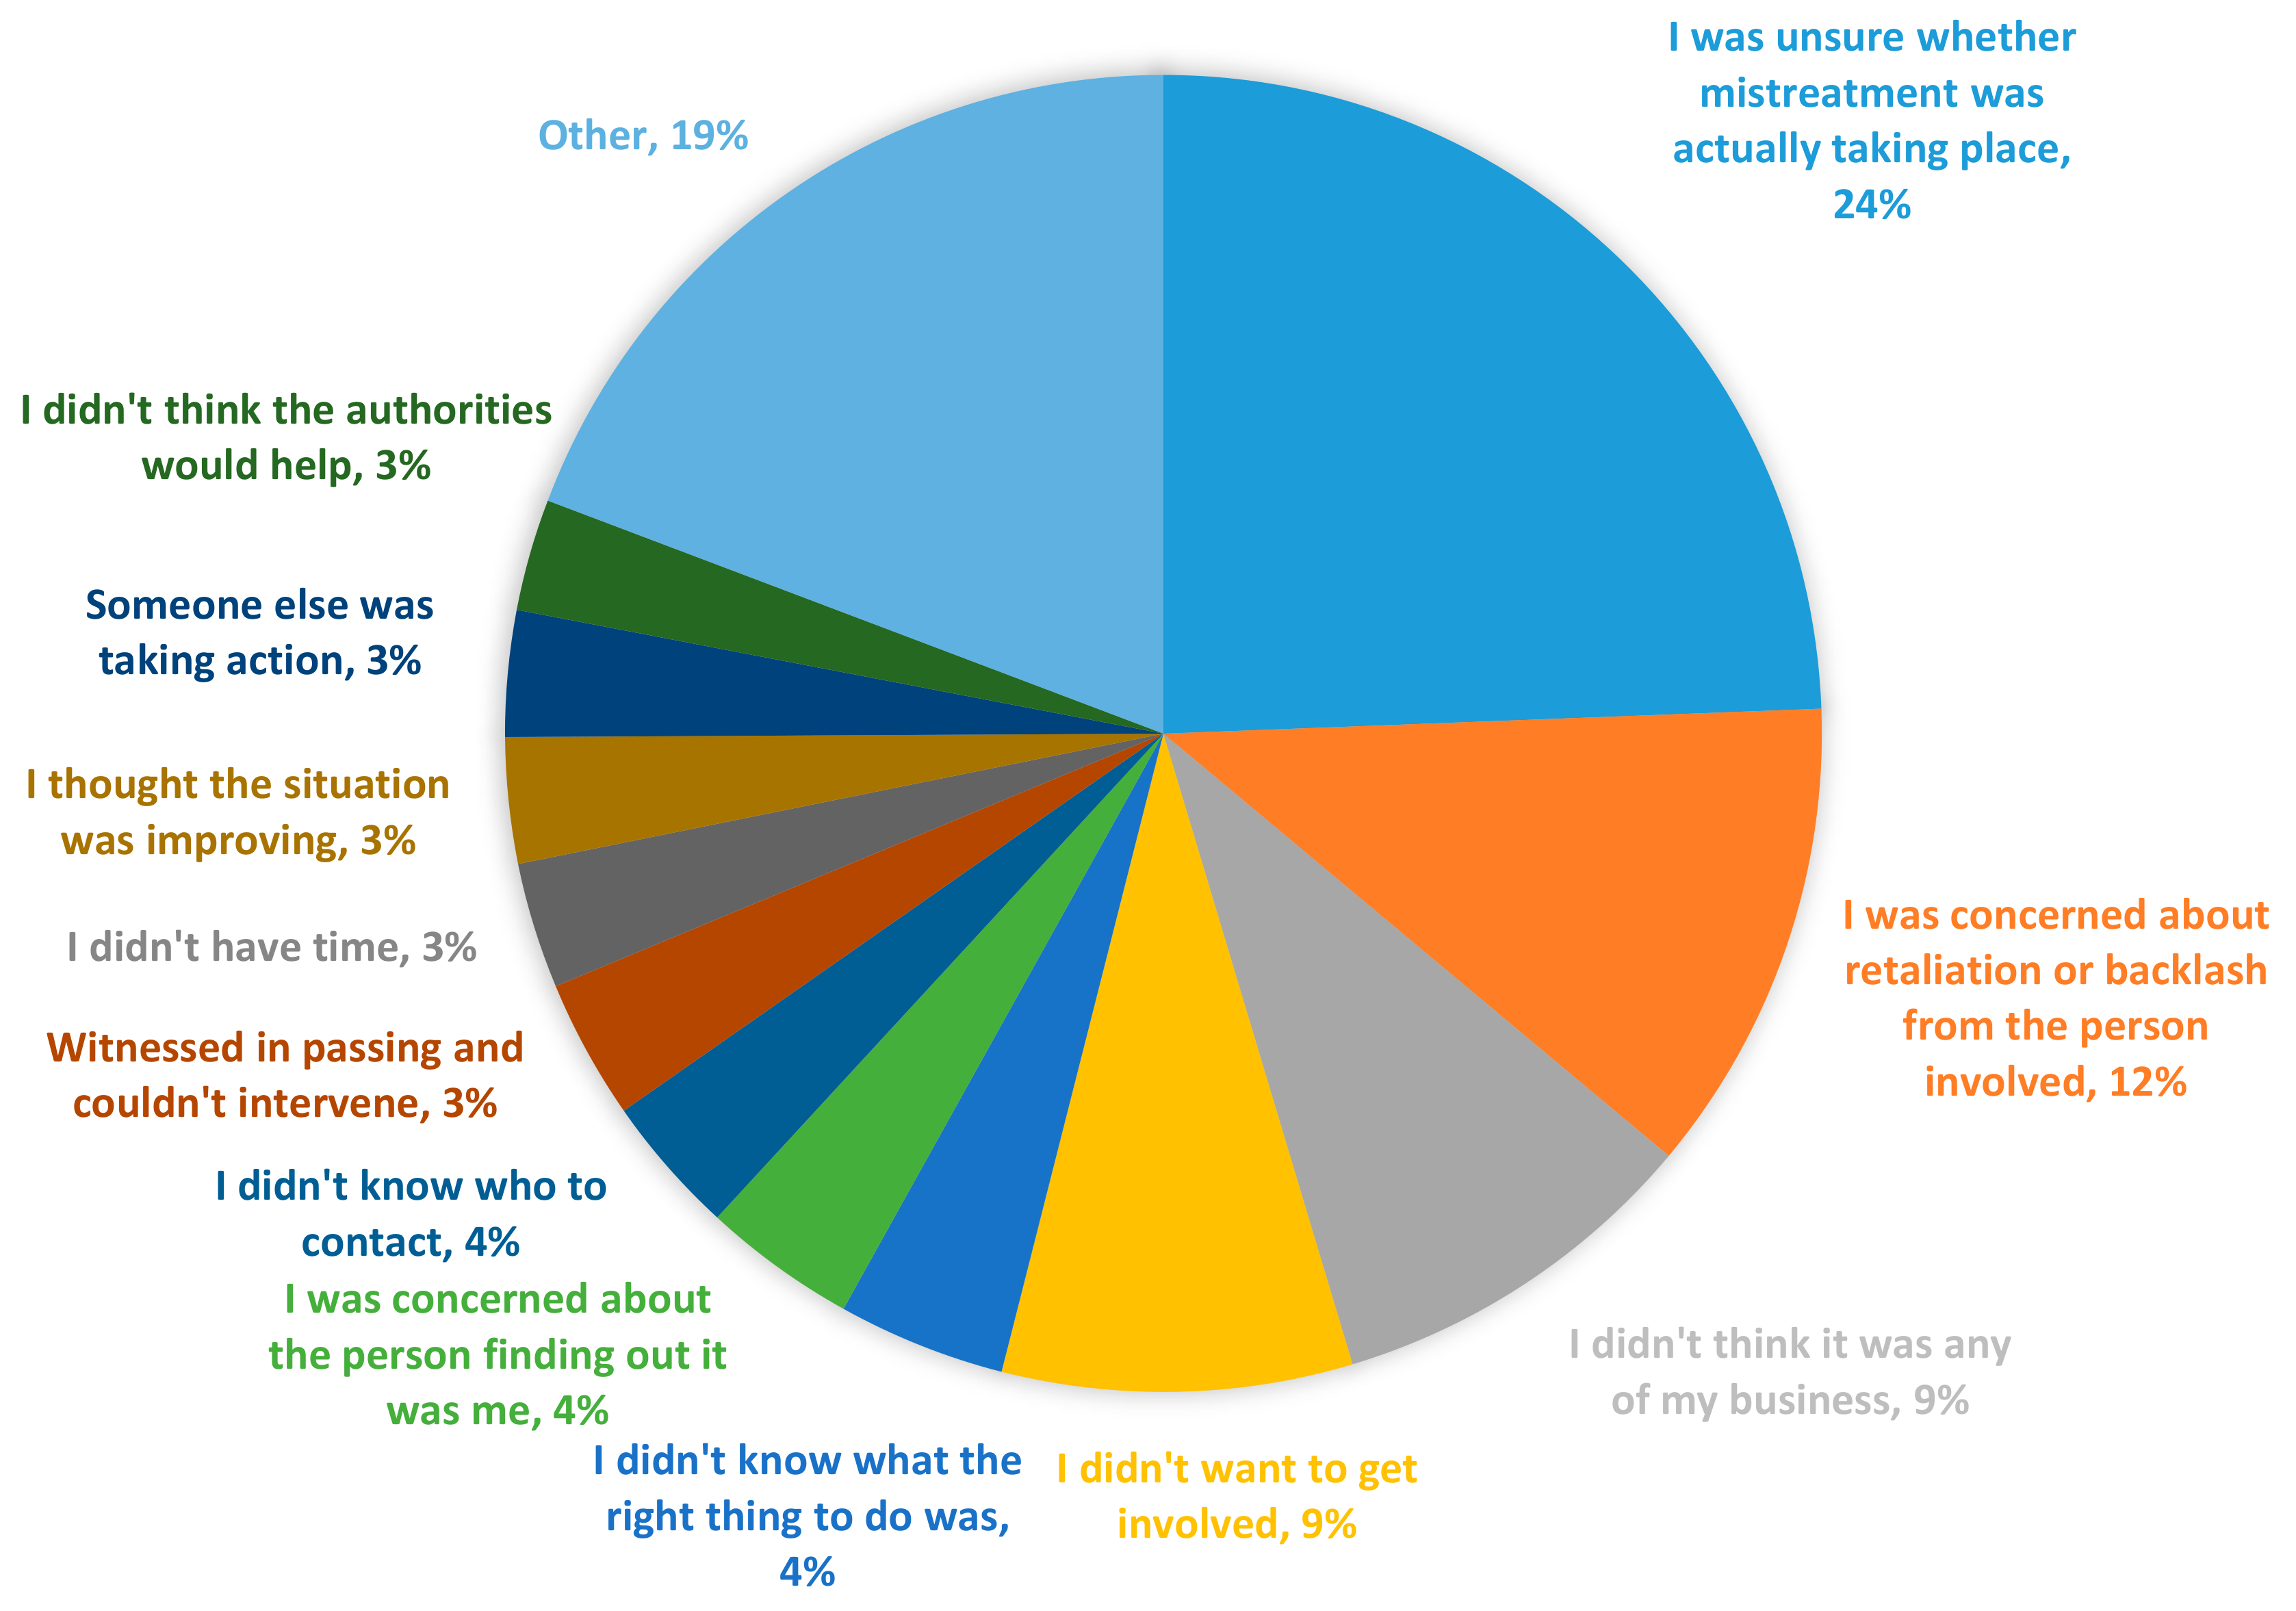
For each type of mistreatment witnessed that the participant had not acted upon (responded ‘nothing’ to the previous question), they were asked to describe in a few words why they had not acted. Their responses were then categorised by the telephone interviewer to pre-programmed responses: 1. I was unsure whether mistreatment was actually taking place, 2. I was not sure whether it was against the law, 3. I didn’t know what the right thing to do was, 4. I didn’t want to get involved, 5. I didn’t know who to contact, 6. I didn’t think it was any of my business, 7. I thought I might make the situation worse for the animal, 8. Someone else told me not to, 9. I was concerned about the person finding out it was me, 10. I was concerned about retaliation or backlash from the person involved, 11. I didn’t think the authorities would help, 12. I was worried the animal would be euthanized, 13. I didn’t have time, 14. Other (Specify), 15. There were no such situations (I always did something). After data collection was complete, five additional categories that were frequently noted in the ‘Other (Specify)’ response were added and back-coded: 16. I thought the situation was improving, 17. Stray or feral animal, 18. Witnessed in passing and couldn’t intervene, 19. Someone else was taking action, 21. Wildlife.
Participants were also asked a series of attitudinal questions related to reporting animal mistreatment. These items were modelled off the Theory of Planned Behaviour (TPB), one of the most widely used models of human behaviour [
26]. The TPB identifies behaviour as an outcome of three attitudinal elements: (1) attitudes towards the behaviour itself, (2) subjective norms, and (3) perceived behavioural control [
27]. While attitudes are difficult to measure directly, they can be inferred by responses to belief statements related to these three elements; (1) beliefs about the behaviour itself and its outcomes, (2) normative beliefs about how significant others would expect the individual to behave, and (3) beliefs about the degree of control the individual has over performing the behaviour [
27]. Relevant beliefs were identified through the focus groups and in consultation with industry experts. Two additional belief statements that did not clearly fall into these categories were also incorporated as they were commonly expressed by focus group participants. Attitudinal items were scored on five-point Likert-type scales (
Table 2) and randomised in order.
2.4. Local Government Area Selection
As one of the key aims of the study was to determine the accuracy of case data with regard to observed trends between LGAs, select LGAs were chosen for sampling as opposed to a state-wide representative survey. A representative survey of Victoria would not allow for comparison of LGAs or identification of trends, because, unless the sample size was very large, the number of participants from each area would be small and provide unreliable estimates. Six LGAs were chosen for inclusion in the survey; three with high numbers of RSPCA reported cases and three with low numbers of cases (
Table 3). To do this, all 79 Victorian LGAs were ranked based on the raw numbers of reported cases and per capita cases over the preceding 3 years (2015–2018). The ten highest ranked (high numbers of cases) and ten lowest ranked (low number of cases) LGAs were considered for selection. Of the ten highest ranked (HR) LGAs, a regional city (City of Latrobe) was selected, being the highest ranked, along with an inner-city region (City of Melbourne) and an interface (peri-urban) region (Yarra Ranges Shire), to gain a better representation of the various region types that exist within Victoria. These three HR LGAs were then paired with similar low ranked (LR) regions based on Local Government Comparator Groups (standardised categories of councils developed to enable meaningful comparison of data and services between Victorian councils [
28]), population, and Social Economic Index for Area (SEIFA) scores. The City of Latrobe was matched with Mildura Rural City and City of Melbourne with City of Stonnington. No interface councils appeared in the ten lowest ranked LGAs. Consequently, the interface councils with the lowest rank were considered, despite them not appearing in the bottom ten. While Nillumbik Shire had the lowest rank of the interface councils, Wyndham City was selected as it better matched the demographics (population and SEIFA ranking) of the chosen HR LGA (Yarra Ranges). This pairing of HR and LR LGAs allowed for more meaningful interpretation of results by limiting the number of variables between comparators.
2.5. Questionnaire Delivery and Sampling
Questionnaire delivery was contracted to the Social Research Centre, a data collection subsidiary of the Australian National University specialising in social and health research. The questionnaire was delivered as a Computer Assisted Telephone Interview (CATI) using random digit dialing. Telephone number lists were acquired by the Social Research Centre from a commercial provider with a mixture of 80% mobile numbers and 20% landlines. For mobile numbers, a pre-notification SMS message was sent prior to phoning to provide the opportunity to opt-out and improve the likelihood people would answer the phone.
To facilitate a more representative sample, in each call the operator requested to speak to the person living in the household aged 18 years or over who was to have the next birthday. Population representative quotas were set for gender and age.
Data collection spanned four weeks from 29 April to 27 May 2019. The AAPOR Response Rate 3 [
30] was 9.4% and the overall cooperation rate was 19.5%, with significant variation between landline (31.8%) and mobile (18.1%) frames.
2.6. Data Analysis
All data analyses were conducted using IBM SPSS Statistics for Windows, version 25 (IBM Corp., Armonk, N.Y., USA), except for the Rodgerian analyses which were conducted in the Simple Powerful Statistics application [
31]. All variables were screened using descriptive analyses. Extreme outliers (z > 3.29) were removed for the variables related to the number of separate incidents witnessed; each of these values was greater than 300 and it was likely the participant had misunderstood the question. While the distributions of responses were often skewed, given the large sample size (
n = 1801), normality of sampling distribution was assumed in most cases.
Rodger’s method of decision-based contrasts was used to compare between LGAs both the proportion of people who had witnessed mistreatment and the proportion who had reported to RSPCA Victoria. Rodger’s method was utilised as it is the most powerful post-hoc statistical procedure for detecting differences in proportions between groups owing to its use of decision-based type 1 error rates as opposed to experiment-wise error rates [
32,
33]. Two-way factorial Analysis of Variance (ANOVA) was used to compare the mean number of incidents witnessed between HR/LR LGAs and the different region types (regional, interface, metro).
Correlations between attitudinal variables were low (<0.3) and hence, not suitable for dimension reduction techniques [
34] (p. 685). As such, all attitude items were used in the analyses reported here. The relationship between attitudes towards reporting and reporting behaviour was first examined with biserial correlations. Correlations were only run on cases where the participant had witnessed mistreatment and had the opportunity to report (
n = 462). The correlations between attitude items and reporting behaviour were weak and while logistic regression and discriminant function analysis were trialed, they yielded poor results accordingly. As such, these analyses were not appropriate and have not been reported. The relationship between reporting and other demographic variables was examined using chi-square tests.
4. Discussion
This study aimed to gain a more objective understanding of animal mistreatment in Victoria and how this relates to previously relied on RSPCA Victoria case data. To do so, it is important to examine both the prevalence of witnessing mistreatment and the actions taken by witnesses. Collectively, our results suggest that there is a much larger problem of animal mistreatment in Victoria than previously considered and that official case data trends are not an accurate reflection of the prevalence of mistreatment within individual LGAs.
Overall, witnessing animal mistreatment was common with 25.7% of participants having witnessed at least one incident in the past year, often many more. As we only sampled six of the 79 LGAs in Victoria, generalisations are limited. However, given that the three main region types were represented (regional, interface, metro), it is reasonable to suggest that the average proportion of people who had witnessed mistreatment would be of a similar magnitude across the state. Of particular note is that only 9% of the people witnessing mistreatment reported what they had seen to RSPCA Victoria, the main regulatory body in Victoria for such reports. If this figure is consistent across the state, then it follows that the 11,000 reports made to RSPCA Victoria each year may only represent 9% of the true problem.
The differences in prevalence between LGAs found in RSPCA Victoria case data are likely more reflective of reporting propensity than of true differences in prevalence. When LGAs with high numbers of RSPCA cases (HR) and low numbers of RSPCA cases (LR) were matched based on socioeconomic index, population, and local government comparator groups, they did not differ in either the number of people who had witnessed at least one incident of mistreatment or the average number of separate incidents witnessed. This interpretation is also supported by the differences between the stated actions of participants in the regional and metro HR and LR LGAs; those in HR areas indicated that they reported to RSPCA Victoria more than those in LR areas. Not only do these results indicate that so-called ‘hot spots’ are falsely labelled, but also that a closer examination of areas with low reports may be required as they are likely to have a similar prevalence of mistreatment, but given their low reporting, the animals are not receiving the assistance they need.
However, it is important to note that this trend was not maintained with the interface pair; no statistically significant difference was found between the reporting behaviour of people in the LR Wyndham and HR Yarra Ranges. While it is unclear exactly why this may be, it is possible that this is because the interface LR LGA selected for the study (Wyndham) was not actually in the lowest 10 ranked LGAs (refer to methods for explanation). However, this provides a potentially interesting insight; being the only LGA surveyed that was not at the extreme ends of the case data rankings and given that it demonstrated the lowest prevalence rates combined with a similar propensity to report mistreatment as the HR LGAs, it suggests that those LGAs in the middle of the rankings may actually have the lowest true prevalence. Further investigation of other middle ranked LGAs would be required to elucidate this theory.
While the majority of participants who had witnessed mistreatment took some form of action, our results suggest that there may be uncertainty or conflicting motivations with regards to what the most appropriate course of action is. This is evidenced by the range of different actions taken and that reporting to the primary enforcement body (RSPCA Victoria) was low. That the single most common response to witnessing mistreatment was no action (27%) is also concerning. However, it is consistent with what is known as the ‘bystander effect’ which is well documented in other areas such as sexual harassment [
36], sexual assault [
37], and shoplifting [
38]. These findings raise significant questions about what influences whether and how a witness will act, specifically whether they will report. In this study, reporting behaviour was difficult to predict. Unlike Taylor and Signal [
25], we found no relationship between demographic variables and reporting behaviour (other than location). While there are well documented relationships between demographic factors such as age and gender and attitudes towards animals [
39,
40,
41], given our findings that attitudes themselves had poor relationships with reporting, this is logical. Indeed, most people surveyed had relatively positive attitudes towards reporting mistreatment; they thought it was the right thing to do and that it would help the animal, yet still did not report. Reasons given for not acting in general were largely related to uncertainty (not being sure that mistreatment was taking place) and concern for personal consequences (fear of retaliation or not wanting to get involved). However, the uncertainty of witnesses was likely not a result of not knowing what mistreatment looks like, but rather a result of other contextual factors; most people who said that they did not act because they were unsure mistreatment was taking place, stated in the attitudinal questions that they were confident they could recognise mistreatment. Additionally, given the level of concern for personal consequences, the relationship with the offender and the characteristics of the offender are also likely to be important considerations in the decision to report [
38]. Incidents involving friends, family, neighbours, or individuals who are volatile, would likely reduce an individual’s propensity to report. Additionally, in situations where the witness is the only person likely to have seen the incident, making it easy to identify who made the report, it is likely that this would impact reporting behaviour due to potential negative consequences. Another influential factor that has been identified in other fields is the seriousness of the offence [
24]. This was reflected to some degree by the differences in actions given the type of mistreatment occurring. In more serious situations, such as when an animal was killed, participants were most likely to report to police, whereas in simple situations like an animal with no water, they helped the animal directly. The only factor that was found to have a significant association with reporting to RSPCA Victoria was where the participant lived, i.e., their LGA. Hence, factors related to the social environment and potentially service provisions in individual areas, like the visibility or availability of RSPCA in that area may be influential. Mistrust or perceived powerlessness of authorities is a significant factor in other fields [
42], though only 3% of people in this study identified this as their reason for not acting. Consistent with other bystander intervention work [
36,
43], these findings indicate that responding to mistreatment, specifically reporting, is a complex behaviour with a range of external or contextual factors not accounted for here playing a significant role.
While individual LGAs with similar socio-economic contexts did not differ in prevalence, significant differences were found between region types. Participants in the regional cities surveyed recalled witnessing approximately 2.5 and 3 times more separate incidents than participants in the metro and interface regions respectively. This is not reflected in the RSPCA Victoria case data and without further information we cannot say definitively why this would occur. However, one possible explanation is that both regional cities surveyed were areas of significant social and economic disadvantage, ranked 3rd and 5th most disadvantaged in the state [
29]. Financial difficulties and low education rates have previously been identified as predictors of animal neglect [
14,
44]. As such, support and educational strategies as opposed to punitive approaches may be most appropriate in these areas.
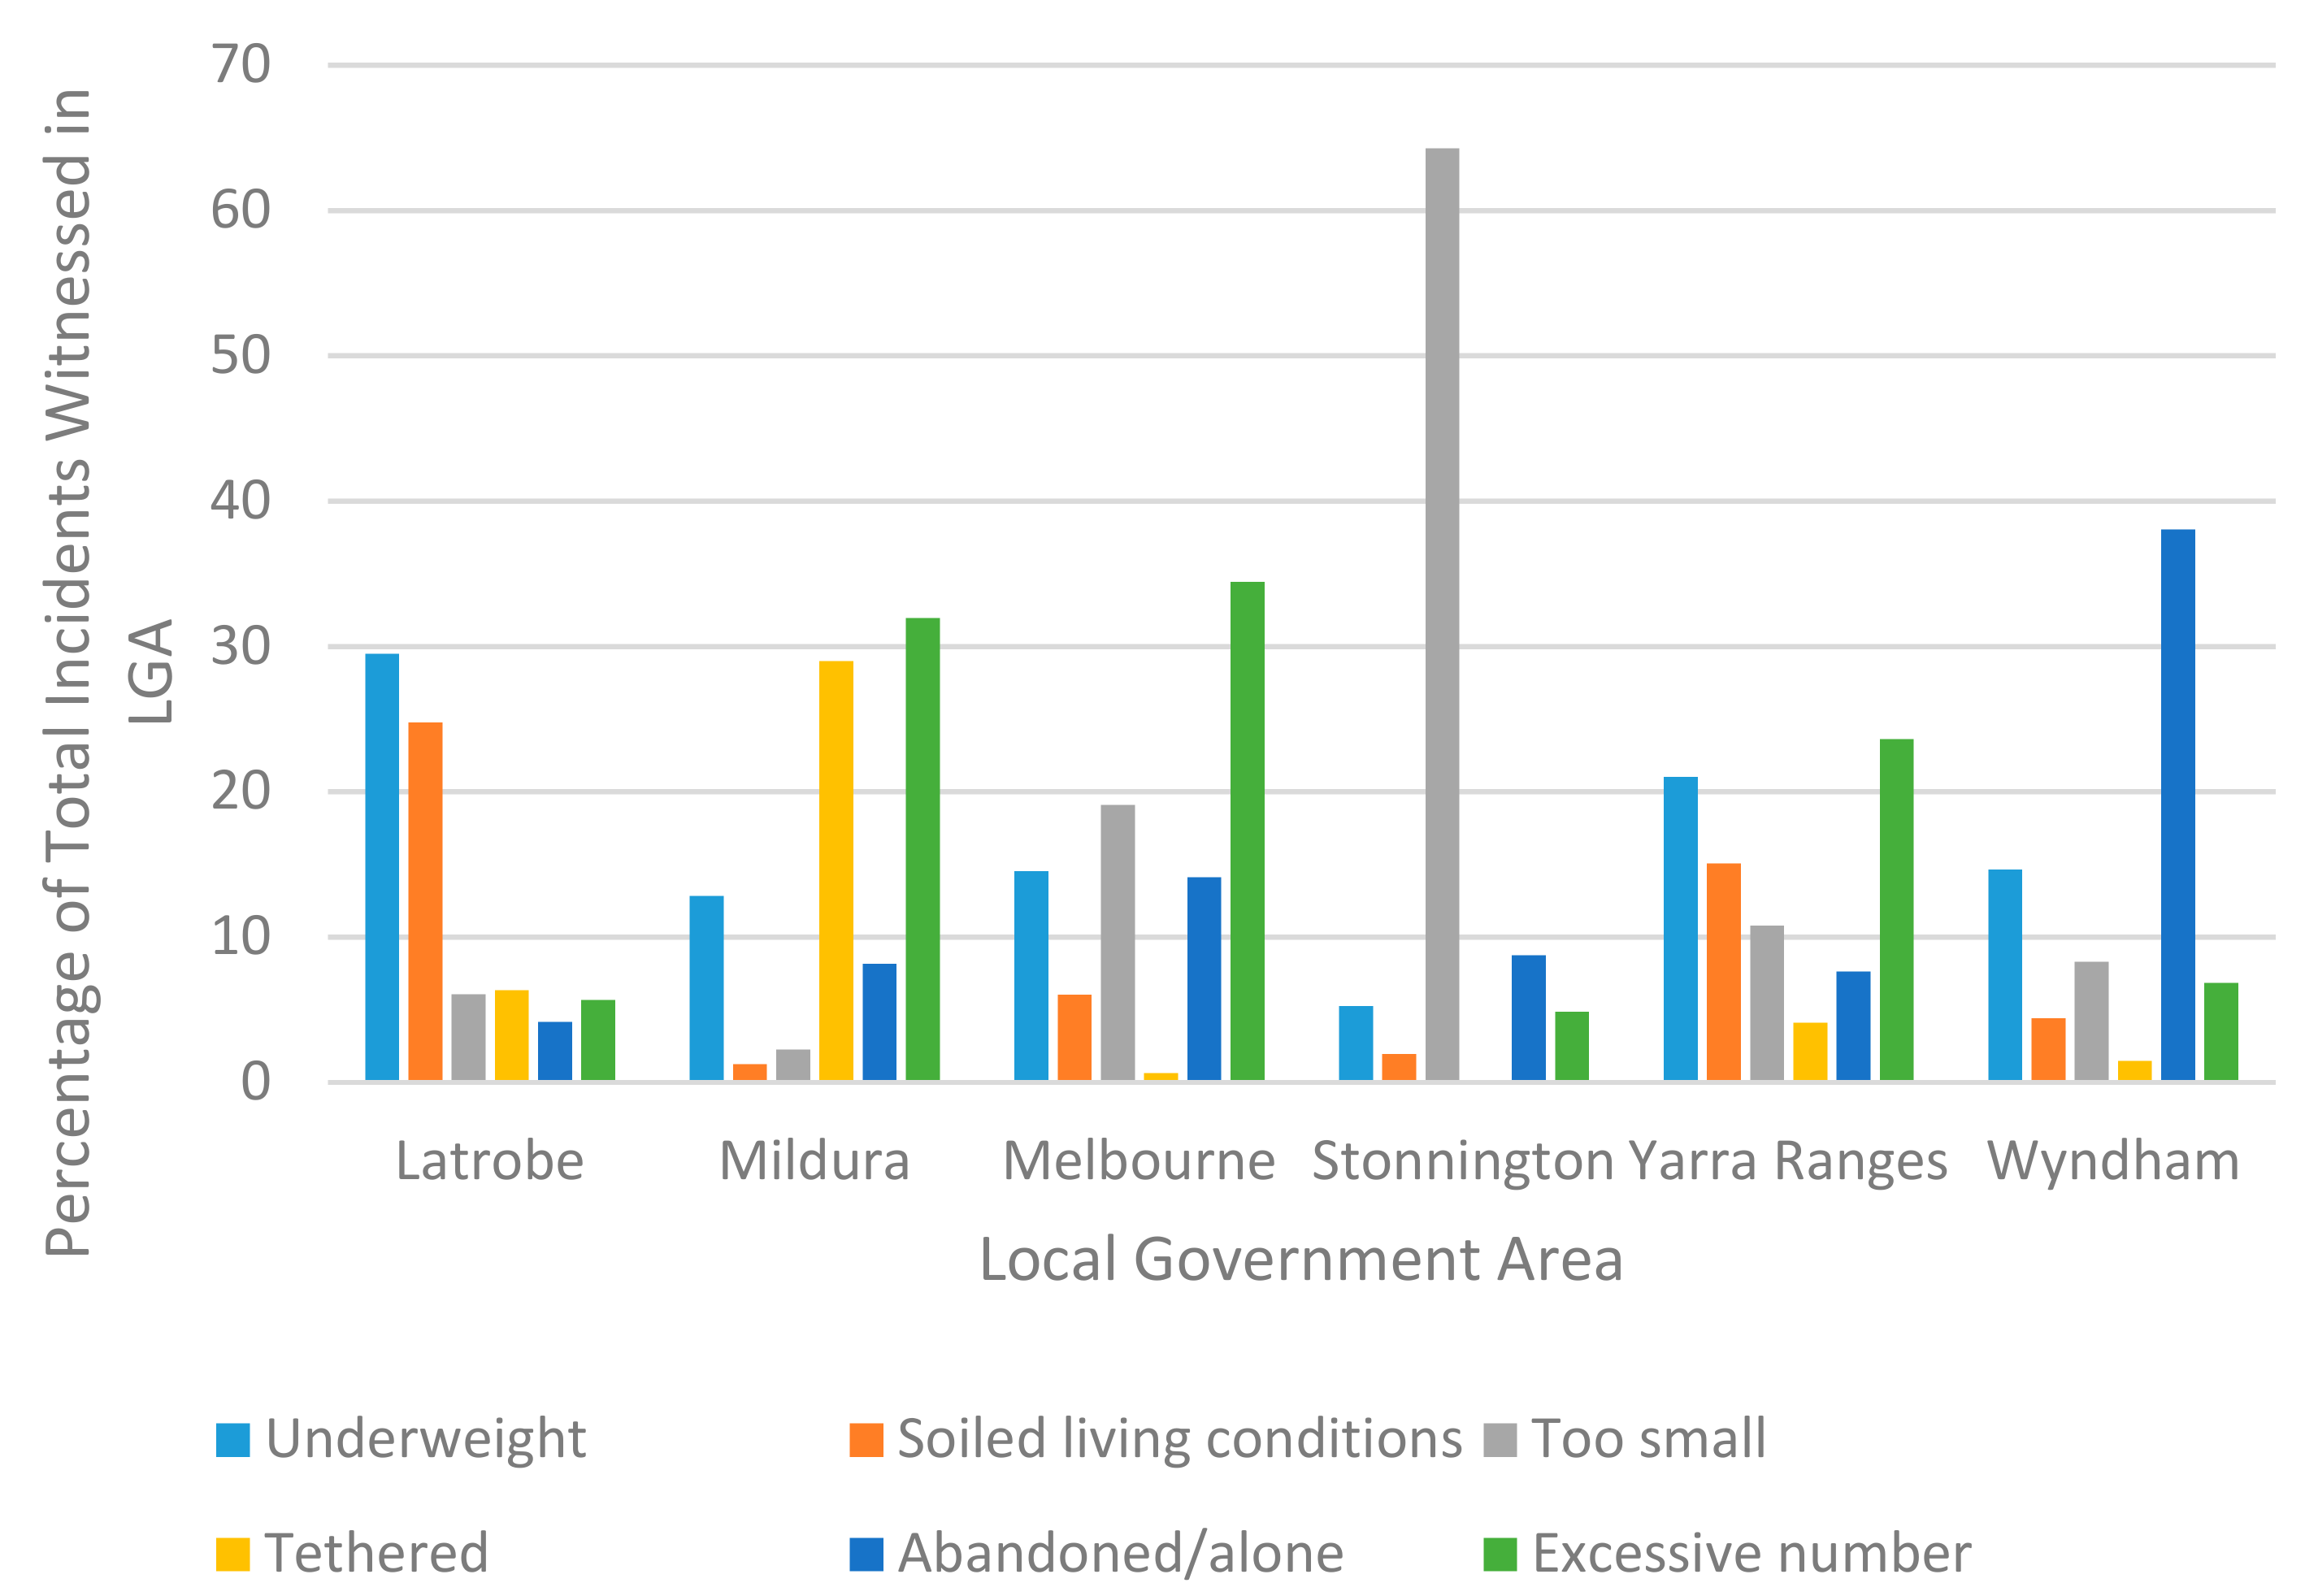
Neglect-based issues, failing to provide for the animal’s basic needs, were the most common types of mistreatment witnessed. This is consistent with trends in RSPCA cases in Victoria [
45] as well as those in Queensland [
13] and America [
14,
15,
46]. The differences between LGAs in the most common types of mistreatment likely reflect the different lifestyles and pressures experienced in those areas. For example, the most common issue witnessed in Stonnington was animals being kept in areas they could not move around freely in. This is understandable given that Stonnington is a high density metropolitan area with large numbers of apartment blocks. In contrast, the most common issue in Latrobe was underweight animals, which likely reflects the economic difficulties faced in this area. Consequently, when considering targeted prevention strategies, it would be beneficial to consider these contextual challenges in order to tailor programs to the needs of that community.
As a whole, these findings raise significant questions about prevention messaging and the current trend of mass communications calling out areas with high numbers of reports. In multiple states of Australia, so-called ‘cruelty hotspots’ are highlighted in the mainstream media with pejorative headlines like ‘Caboolture named and shamed over cruelty’ [
16,
17,
47]. Not only is this likely to be inaccurate given the present research, such descriptions may have unintended negative consequences. Studies of mass communications and interventions in a range of other fields suggest that such consequences could include ‘boomerang effects’, social norming, or desensitisation leading to apathy [
48,
49,
50,
51,
52], all of which work against prevention aims. In addition, the use of the term ‘cruelty’ is likely to have certain connotations with the public that are not reflective of the majority neglect cases. One particular concern is the potential for these messages to marginalise individuals who are at-risk of neglecting animals as a result of their social and economic circumstances. In these instances, the most desirable behaviour is for them to seek help. Yet, by shaming or isolating individuals this may result in a reluctance to do so for fear of judgement or persecution [
51].
As the first study of its kind, we recognise its limitations. Firstly, in the absence of being able to either ask animal owners about their experiences (i.e., whether they mistreat their animals) or directly observe the treatment of animals, we must rely on mistreatment being witnessed by others. Given that mistreatment largely occurs in the home environment, there are significant barriers to this and likely much that goes unnoticed. As a participant in one of our preliminary focus groups noted, ‘It’s the ones you don’t see that you need to worry about’. Additionally, the accuracy with which an individual can recount the number of separate occasions they had witnessed mistreatment in the last year is questionable. Hence, we did not use those particular figures to make generalisations about mistreatment, they were simply used to compare averages between LGAs. In doing so, we assume that any error of measurement would be consistent across regions; we have no reason to believe that people in one region would have a more accurate recollection than those in another. As the questionnaire was presented in English and translation into other languages was beyond the scope of this study, there is potential for sampling bias. However, of the total number of individuals contacted to participate, only 0.8% were excluded as they did not speak English. With the questionnaire delivered by CATI and the participant interacting by phone with an interviewer, there is also potential for social desirability bias, particularly with regards to questions about attitudes and actions taken. However, other methods of survey delivery that would reduce this (e.g., online or mail) would not have been suitable; online surveys cannot facilitate random sampling (no sampling frame) and mail out surveys have low and slow response rates. Finally, as with any survey of this nature, there is the potential for those who are more concerned about animals and animal welfare to be more likely to agree to participate. This has the potential to bias the sample, but short of studying those who refuse to participate and comparing them to our sample, it is impossible to quantify this.


