3.1. Friction Coefficient
In this study, the influence of working temperature, upsetting speed, compression amount, and lubricant on the grain size were studied by using ring compression test. However, the friction coefficient for each experiment setup can be determined by computing the ratio of diameter to thickness of the specimen [
5] as shown in
Table 3.
Although the friction coefficients shown in
Table 3 are almost the same, if they are regarded as quality characteristics
y as per Taguchi method, they possess the smaller-the-better property, which indicates the idea that the lower the friction coefficient, the more uniform the deformation. By means of signal-to-noise (S/N) ratio, which is also shown in
Table 3 and defined as
it can be observed that they are a little bit different. Based on Taguchi method, if the S/N ratios shown in
Table 3 are averaged for each level of each factor, a response table can be obtained (
Table 4) that describes the influence of each level of each factor on the quality characteristics. The greater the effect or the difference of S/N ratios between the levels of the same factor, the greater the influence of that factor on the quality characteristics. From
Table 4, it can be observed that the effect of lubricant on the friction coefficient is the most significant (3.2 dB), followed by the working temperature (1.0 dB). The weakest effect is the upsetting speed (0.1 dB).
Although the response table described above can exhibit how qualitatively significant the influence of the factor is on the quality characteristics, it is still not easy to quantitatively determine their influence strength. A statistical analysis of variance (ANOVA) is therefore needed. From
Table 4, the mean value of the S/N ratio for each factor can be calculated at the same time. The sum of squares (SS) of deviations of each level from the mean of the factor can then be obtained as the variance for the factor. If the sum of squares is divided by degree of freedom (DF), which is the number of levels minus 1, the mean square (MS) or variance for the factor can be determined. The contribution (% C) of each factor to the quality characteristics was calculated by means of ANOVA, and the importance of each factor was also determined, as shown in
Table 5.
Since the factors with low variance could be considered random background noise, their SS and MS could then be pooled to error. Speed and compression have been determined to be part of the random background noise, as their contributions are as low as 0.11% and 1.92%, respectively. The resulting error calculation is as shown in the extra row with brackets in
Table 5. Based on this pooling, it can be further noted that the contribution % C’ of the lubricant is 92.46% and the working temperature has only 7.54% of contribution, approximately 12:1, which is not 3:1 as described in the response table.
If the null hypothesis that there is no significant difference of the variance caused by the working temperature from errors is to be rejected, the F value required for the 95% confidence level is 6.94. The
F value calculated from
Table 5 (ratio of MS’s from factor and error) exceeds the critical value. It means that the variation caused by the working temperature is significantly different to the random background. The variation caused by speed and compression could still be regarded as random variation or error, because their F values shown in parentheses are relative small in regard to the critical value 6.94, which means that there is no significant difference to the random background noise.
In addition, it can be seen that the impact of the friction coefficient is indeed only the lubricant in this study. Thus the lubricants assigned in this study could accurately describe the frictional boundary condition for the study of grain size.
3.2. Grain Size after Compression Test
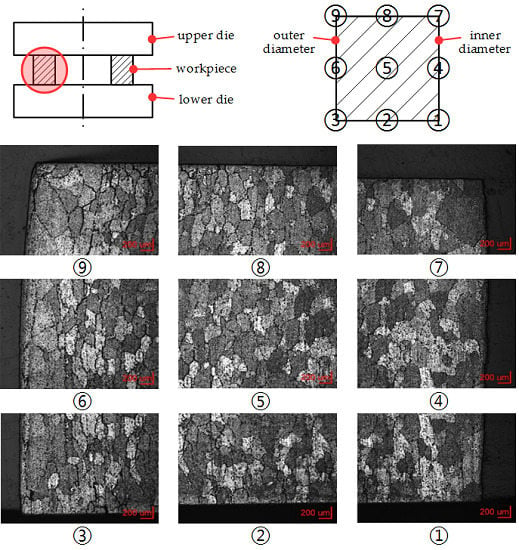
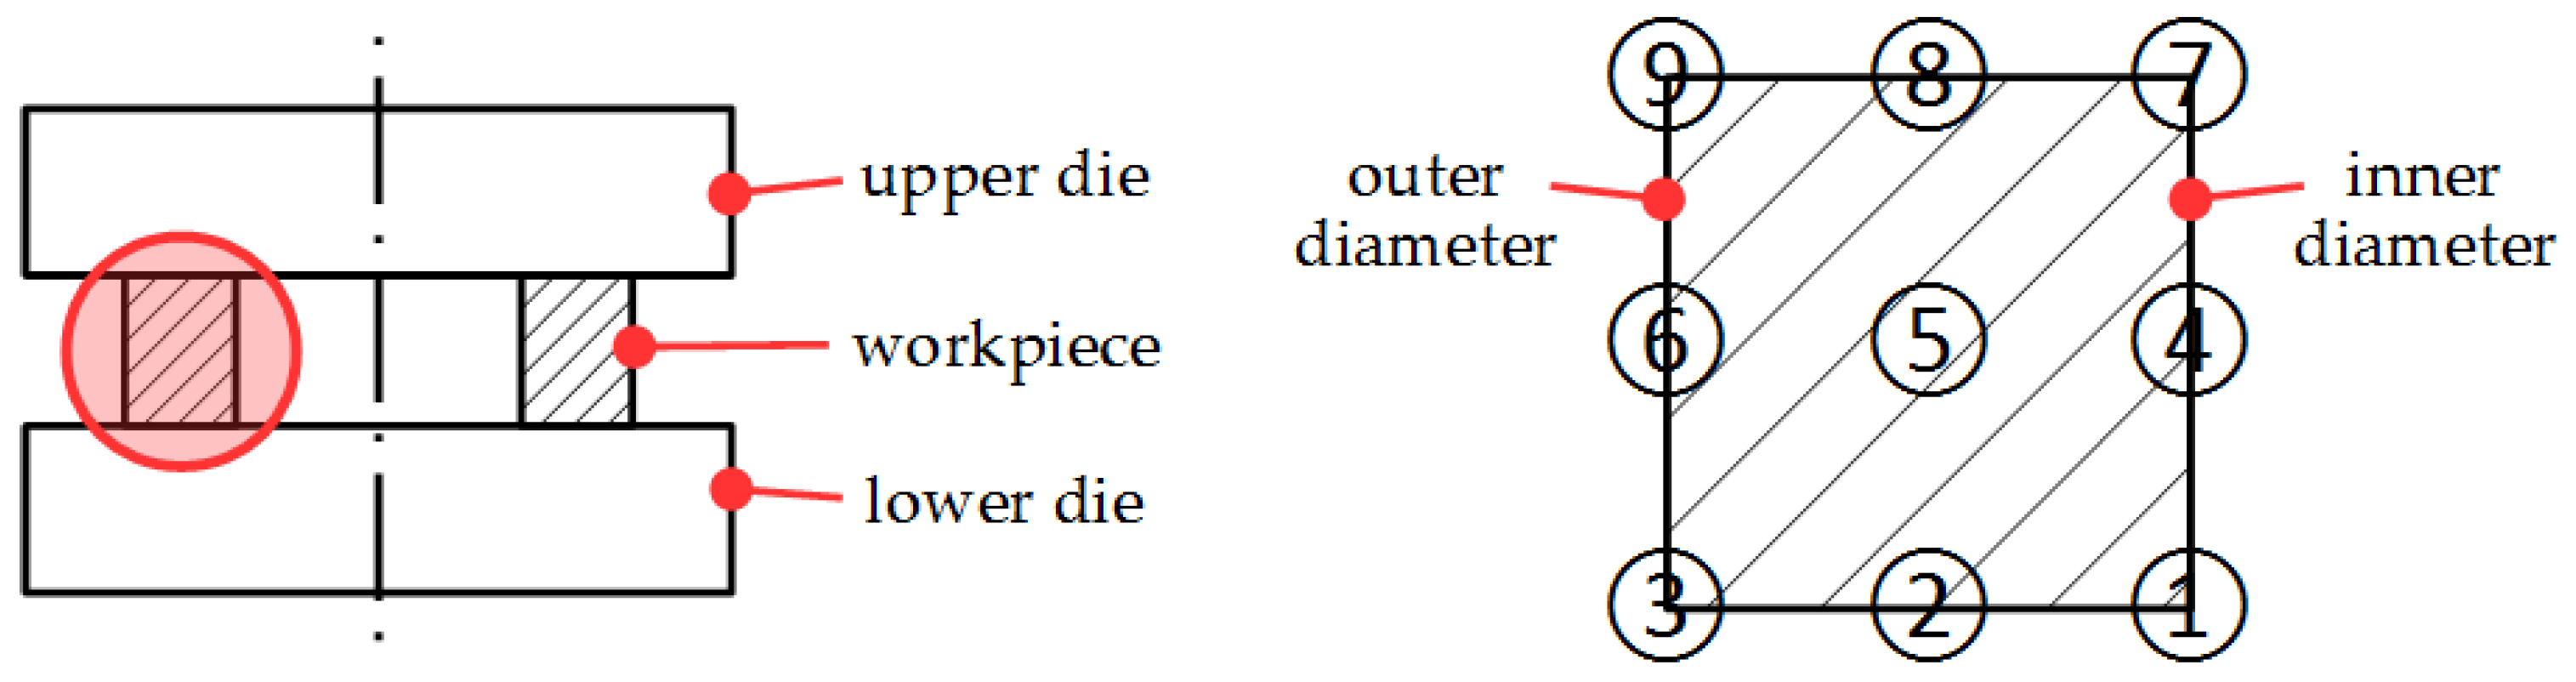
The grain sizes measured from the ring compression test are shown in
Table 6. The positions shown in
Table 6 are defined in
Figure 5. The sampling positions 1 to 3 are assigned to the region where the specimen contacts to the lower die, while positions 7 to 9 are assigned to the upper die. The sampling positions 4 to 6 are located in the middle part of the specimen without any contact to either to the upper die or to the lower die. The grain sizes shown in
Table 6 are the average from the readings of five specimens tested under the same setting. The grain sizes shown with a footer 1 in
Table 6 are larger than that measured from the incoming alloy.
Although
Figure 5 shows that the positions where the specimen contacts the upper and lower die should be vertically symmetrical and their grain sizes should be comparably similar, the results shown in
Table 6, however, are quite different. The reason for this is that the specimen is placed on the lower die first and then contacts to the upper die, so that positions 1 to 3 are early brought into contact with die and therefore cooled. Thus their grain size is different to that on the upper boundary.
Among the mean grain sizes for each experiment setup, it can be observed that the mean grain size was obtained from experiment 3, which reaches the minimum as 207 μm, while experiment 9 can cause the maximum one in 246 μm. Furthermore, only experiment 9 can cause a mean grain size larger than that obtained from the incoming alloy. The remaining experiments only have smaller mean grain sizes. Among those experiments, the grain size in experiment 2 and 3 becomes smaller at all sampling positions. In view of the standard deviation, it can be further seen that experiment 1 has the largest standard deviation, 35 μm, which means that the sampling position in this case might significantly influence grain size. On the other hand, the standard deviation in experiment 2 is the smallest, only 13 μm, suggesting that this experiment setup might cause a relatively homogeneous distribution of grain size.
If the grain size is observed at individual position, the grains at position 9 from experiment 1 are the coarsest, 317 μm in average, while position 4 and 5 from experiment 4 have the smallest grain size, 188 μm in average. Furthermore, position 4 has the smallest mean grain size as well, 209 μm, while position 3 has the largest one, 244 μm. In addition to position 3, position 1 has a mean grain size larger than that from the incoming alloy as well. The remaining positions have grains smaller than that of the incoming alloy. Position 4 of the specimen under all 9 experiment setups has a smaller grain size than that from the incoming alloy. In view of standard deviation of grain size at a certain position obtained under different experiment setups, position 9 has the largest standard deviation of grain sizes, 34 μm, which means that this position might demonstrate the influence of setups designed by Taguchi method, while position 4 shows the smallest one, only 12 μm, which means that at this position the grain size is less sensitive to the settings designed by Taguchi method.
It is still hard to observe the influence of individual level of each factor on the grain size from
Table 6. Based on Taguchi method, the grain size at each sampling position is regarded as the quality characteristic value
y having the smaller-the-better property. This suggests that the finer the grain, the better the property, so that it can be converted into S/N ratio according to Equation (1). After averaging the S/N ratios for each level of each factor, a response table for each position can be established
Table 7. As mentioned above, the larger the effect or the S/N difference among the levels of the same factor, the more significant the influence of the factor on the quality characteristic. From the response listed in the rightmost column of
Table 7, which is calculated from the mean grain size in
Table 6, it can be observed that the effect of the lubricant on the mean grain size was the most significant (0.86 dB), followed by the working temperature (0.59 dB), and the weakest is then the upsetting speed (only 0.02 dB).
Comparing the S/N ratios responded from each level of each factor, their largest one has a footer of 2, while their smallest one has a footer of 3, to highlight them. It can be seen that the setting with footer 2 in the rightmost column of
Table 7 corresponds a working temperature 400 °C with a speed of 36 mm/min and a compression amount of 3 mm with lubricant of molybdenum disulfide. This coincides with the setting of experiment 3 (see
Table 2), and provides the smallest mean grain size, which is again consistent with the foregoing description of
Table 6. The largest mean grain size would be obtained with a setting with footer 3 as a temperature of 500 °C, a speed of 3.6 mm/min and a compression amount of 1 mm without lubricant. No corresponding set is listed in
Table 2, thus experiment 9 with a speed of 36 mm/min and a compression of two millimeters still could be taken as the setting for the largest mean grain size, as the two most significant factor, lubricant (no lubricant) and temperature (500 °C) are already considered. This again is confirmed by the foregoing description of
Table 6.
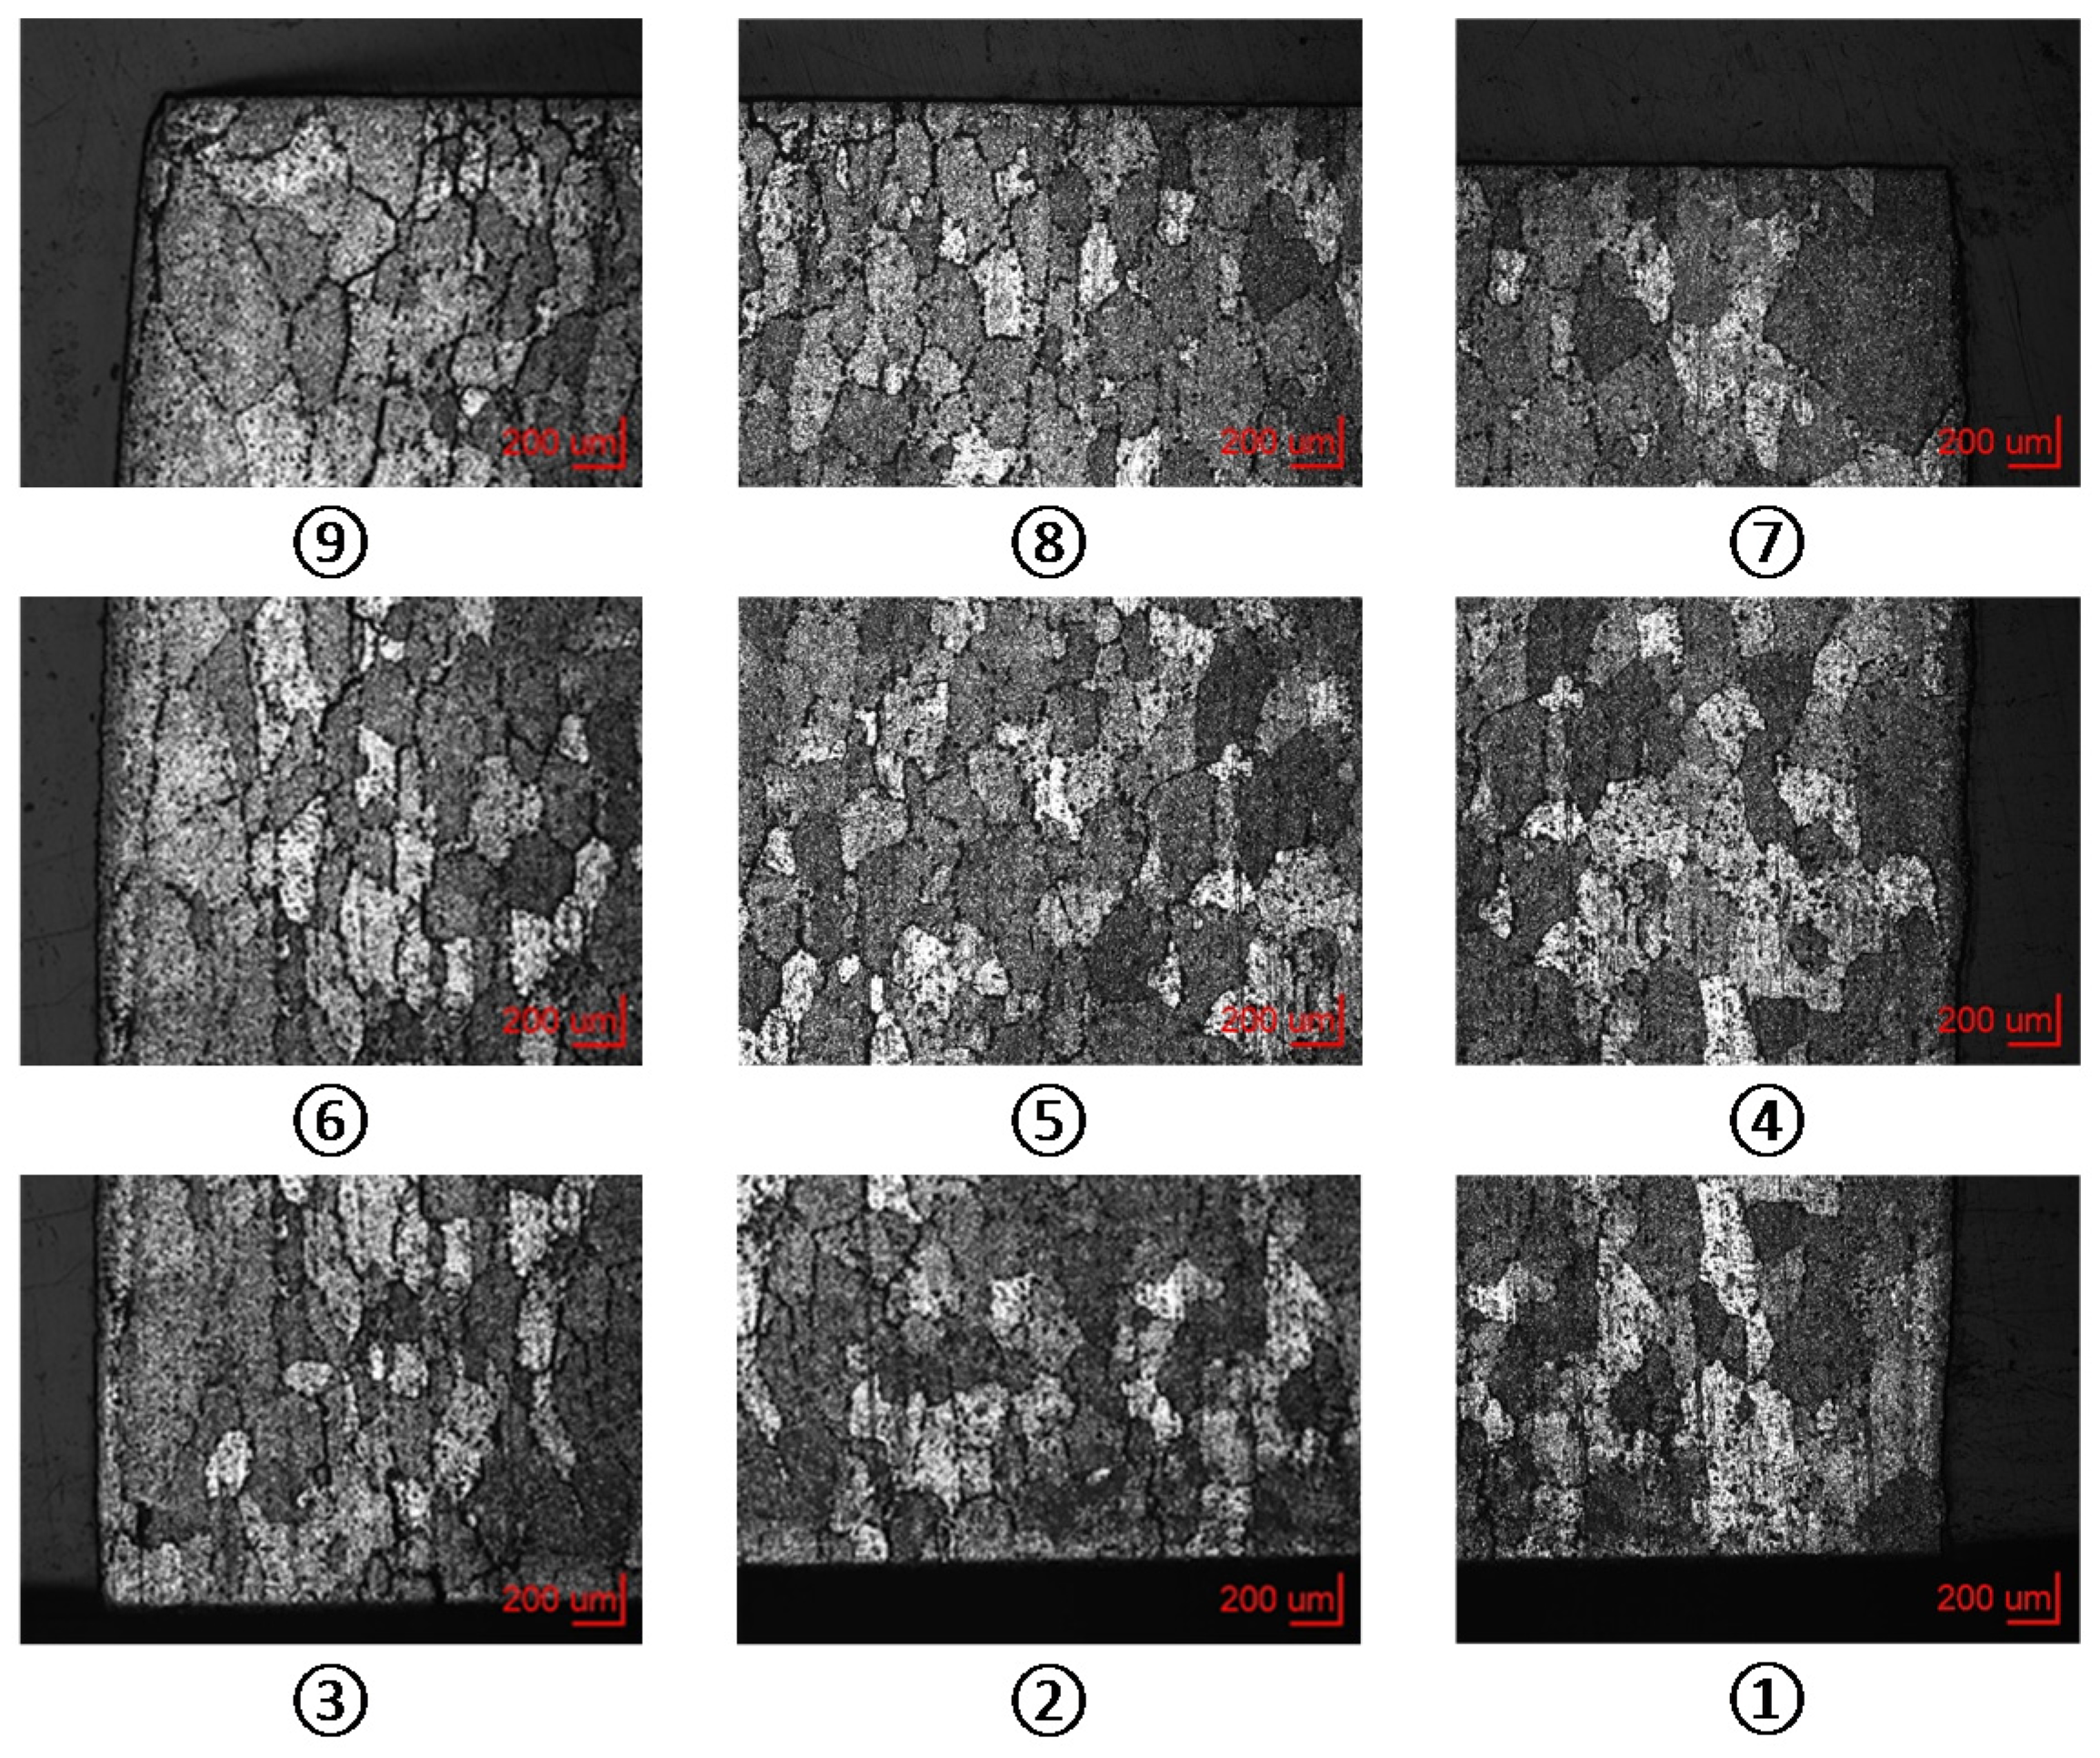
Figure 6 shows the microstructure images taken at each sampling position in experiment 1, in which the grains on the top inner corner are coarser.
In addition, it can be seen in
Table 7 that the lubricant has a significant effect on the grain size. The setting without lubricant can generate large grains at most (8) positions, while the setting with molybdenum disulfide can generate small grains at most (8) positions. In addition, the working temperature has the second significant effect on the grain size. The setting at 500 °C can let most (8) positions have large grains, while the setting at 400 °C can produce small grains at some (6) positions. The factors with less effect on grain sizes, such as speed and compression amount have no fixed level to the output of large or small grains, which matches that shown in the response table in the rightmost column of
Table 7. Regarding the response to the grain size at each position, the most significant factor is again either the working temperature or the lubricant. For positions 1, 3, 4, 5, and 7, the working temperature is the factor with the most significant influence on the grain size at that position, while the lubricant has the impact on the grain size only at positions 2, 6, 8, and 9.
As discussed above, ANOVA is still needed to figure out how strongly the factors affect the quality characteristics in the response tables.
Table 8 is the ANOVA for the mean grain size calculated by the method mentioned in
Section 3.1. The same measures in
Table 5 can be also applied to
Table 8, in which the variances from the factors with relatively low variances, such as speed and compression, are pooled to that of error. It further can be pointed out that the contribution % C’ of lubricant is 64.67%, while the working temperature has a 35.33% contribution. The ratio of both them is nearly 2:1, not as described in the response table in
Table 7—about 7:5. Regarding to the F test, same as described in the previous section, at a more than 95% confidence level, variations caused by upsetting speed and compression can be regarded as random variation or error.
3.3. Grain Size after T6 Temper
After T6 heat treatment, in which the specimens were solid-solutioned at 530 °C for two hours, then quenched in water, and thereafter artificially aged at 170 °C for eight hours, the grain sizes were measured as listed in
Table 9.
The average grain size was 183 μm, which is smaller than the average value of 226 μm after the compression test. This means that the T6 heat treatment can generally refine the grain size further after compression. Experiment 5 could refine the grain size to 137 μm from 233 μm and achieved 41% refinement. However, there were also a couple of coarsening setups: experiment 1, 6, and 8, among which experiment 8 had an average grain size of 246 μm and a coarsening of 8% from 229 μm. In view of the standard deviation, the grain sizes in sampling positions formed by experiment 2 were significantly different and had a standard deviation of 33 μm, while the standard deviation of the grain size in the positions formed by experiment 3 is only 8 μm. It seems that it is difficult to distinguish the differences between the positions formed by experiment 3. In fact, a similar situation could be found in experiments 4 and 9, in which the standard deviations were only 9 μm and 12 μm. With regard to the average grain size calculated for each sampling position, the mostly refined grains from compression to aging were found in position 1, in which a 25% refinement from 241 μm to 181 μm could be achieved. Even in the worst case, such as the grain size in position 6, there was still 6% refinement achieved by aging. However, the standard deviation of the grain size there among the experiments was 59 μm, which means that there was a significant difference among the experiment setups.
From the mean S/N ratio listed in the rightmost column of
Table 10, the smallest grain size might be achieved according to Taguchi method by setting the level of each factor, which had the largest S/N ratio, namely, the operating temperature at 450 °C, the speed at 36 mm/min, the compression at three millimeters and no lubricant used. However, no such experiment setup listed in
Table 2 could be found. Nevertheless, experiment 5 has the most similar setup, which had just one alternation in speed, 3.6 mm/min instead of 36 mm/min (
Table 2), and whose response shown in
Table 9 really had the smallest among the nine experiment setups.
Similarly, the largest grain size might be accordingly achieved by setting temperature at 400 °C, speed at 3.6 mm/min, compression at one millimeter and with lubricant of graphite. The most comparable settings fall onto experiment 2, which only changes the compression at two millimeters (see
Table 2). However, this setting could not achieve the largest grain size as described in
Table 9. If temperature were changed to 500 °C and the lubricant to molybdenum disulfide as in the setting in experiment 8, or speed to 0.36 mm/min without lubricant as in experiment 1, or temperature to 450 °C and speed to 36 mm/min as in experiment 6, a larger grain could be achieved than by experiment 2. Among these experiments, the very same setting is the compression at one millimeter. This fact could also be found from the result not only in the rightmost column but also in the column of each individual position listed in
Table 10. The most significant effect on the grain size is the compression, and its level at one millimeter has the lowest S/N ratio as well, while three millimeters has the highest S/N ratio (in 8 of all 9 positions). Furthermore, the second significant effect on the grain size is the temperature, in which 400 °C had a strong tendency (lowest in mean S/N ratio and all 9 positions) to have coarse grain, while 450 °C relatively easily (highest in mean S/N ration and only six positions) causes fine grain. Within the factors, lubricant and speed, their levels having larger or smaller grain, are very irregular among individual positions and therefore they had less effect on grain size.
Resulting from the ANOVA,
Table 11 shows that factors mentioned above with relative low difference of S/N ratio, such as temperature, lubricant, and speed, have also a low contribution (%C). The variation caused by them can then be regarded as random background and can be pooled to error, which is correct in view of F value, because their F values are relatively small when compared to the critical value 6.94. Thus, only compression is the remaining factor to grain sizes after T6 temper.
It can be seen that T6 temper could further make grains finer and this refinement has an absolute relationship to the amount of compression. This can be attributed to the fact that at elevated temperature, severe ongoing plastic deformation beyond the critical strain can cause recrystallization, which is called dynamic recrystallization. If the plastic deformation is terminated, the larger retaining plastic strain will undergo further metadynamic recrystallization, while the smaller retaining plastic strain will undergo static recrystallization. These three recrystallizations will refine the grains. In the meantime, at such elevated temperatures, grain growth coarsens the grains to reduce their number and to release the grain surface energy as well as to lower the free energy [
10]. Usually, the hot forging process takes place within a relatively short span of time, frequently less than one second. The dynamic recrystallization can be just initiated and take place in a short duration. Furthermore, some of the experiments had relative small amount of compression, which might restrict the initiation of dynamic recrystallization during the compression test. This caused the grain refinement to not be efficient. The subsequent heat treatments, such as solid solution (two hours) and aging (eight hours), had sufficient time for grains to have full recrystallization either by metadynamic recrystallization or by static recrystallization, so that finer grains could be obtained. Additionally, experiments 1, 6, and 8, which had small amounts of compression, had relatively coarse grains, which was due to their small plastic deformation amount. At the same time, grain growth still occurred and made grains coarser.


