Analysis of Dairy Product Price Transmission in Hungary: A Nonlinear ARDL Model


Abstract
:1. Introduction
2. The Dairy Sector in Hungary
3. Materials and Methods
NARDL Model
4. Results
5. Discussion
6. Conclusions
Author Contributions
Funding
Conflicts of Interest
References
- Vőneki, É.; Mándi-Nagy, D.; Stark, A. Prospects for the European Union and Hungarian dairy sectors after the abolition of the milk quota system. Stud. Agric. Econ. 2015, 117, 1–9. [Google Scholar] [CrossRef] [Green Version]
- Acosta, A.; Ihle, R.; Von Cramon-Taubadel, S. Combining market structure and econometric methods for pricetransmission analysis. Food Secur. 2019, 11, 941–951. [Google Scholar] [CrossRef] [Green Version]
- Bronnmann, J.; Bittmann, T. Asymmetric adjustment of retail cod and herring prices in Germany: A NARDL approach. Mar. Policy 2019, 106, 103513. [Google Scholar] [CrossRef]
- Grau, A.; Hockmann, H. Market power in the German dairy value chain. Agribusiness 2017, 34, 93–111. [Google Scholar] [CrossRef]
- Fousekis, P.; Katrakilidis, C.; Trachanas, E. Vertical price transmission in the US beef sector: Evidence from the nonlinear ARDL model. Econ. Model. 2016, 52, 499–506. [Google Scholar] [CrossRef]
- Acosta, A.; Valdés, A. Vertical price transmission of milk prices: Are small dairy producers efficiently integrated into markets? Agribusiness 2014, 30, 56–63. [Google Scholar] [CrossRef]
- Serra, T.; Goodwin, B.K. Price transmission and asymmetric adjustment in the Spanish dairy sector. Appl. Econ. 2003, 35, 1889–1899. [Google Scholar] [CrossRef] [Green Version]
- Dong, X.; Brown, C.; Waldron, S.; Zhang, J. Asymmetric price transmission in the Chinese pork and pig market. Br. Food J. 2018, 120, 120–132. [Google Scholar] [CrossRef]
- Bakucs, Z.; Brümmer, B.; Von Cramon-Taubadel, S.; Fertő, I. Wheat market integration between Hungary and Germany. Appl. Econ. Lett. 2011, 19, 785–788. [Google Scholar] [CrossRef]
- Jeremić, M.; Zekić, S.; Matkovski, B.; Kleut, Ž. Spatial price transmission in pork market in Serbia. Custos E Agronegocio 2019, 15, 328–346. [Google Scholar]
- Bakucs, Z.; Benedek, Z.; Fertő, I. Spatial price transmission and trade in the European dairy sector. Agris On-line Pap. Econ. Inform. 2019, 11, 13–20. [Google Scholar] [CrossRef] [Green Version]
- Meyer, J.; von Cramon-Taubadel, S. Asymmetric price transmission: A survey. J. Agric. Econ. 2004, 55, 581–611. [Google Scholar] [CrossRef] [Green Version]
- Frey, G.; Manera, M. Econometric models of asymmetric price transmission. J. Econ. Surv. 2007, 21, 349–415. [Google Scholar] [CrossRef]
- Kharin, S. Vertical price transmission along the diary supply chain in Russia. Stud. Agric. Econ. 2015, 117, 80–85. [Google Scholar] [CrossRef] [Green Version]
- Ahn, D.H.; Boudoukh, J.; Richardson, M.; Whitelaw, R.F. Partial adjustment or stale prices? Implications from stock index and futures return autocorrelations. Rev. Financ. Stud. 2002, 15, 655–689. [Google Scholar] [CrossRef]
- Fernández-Amador, O.; Baumgartner, J.; Crespo-Cuaresma, J. Milking the prices: The role of asymmetries in the price transmission mechanism for milk products in Austria. In WIFO Working Papers 378; WIFO: Wien, Austria, 2010. [Google Scholar]
- Rezitis, A.N.; Tsionas, M.G. Modeling asymmetric price transmission in the European food market. Econ. Model. 2019, 76, 216–230. [Google Scholar] [CrossRef] [Green Version]
- Davies, A. Testing for international equity market integration using regime switching cointegration techniques. Rev. Financ. Econ. 2006, 15, 305–321. [Google Scholar] [CrossRef]
- Bor, Ö.; Ismihan, M.; Bayaner, A. Asymmetry in farm-retail price transmission in the Turkish fluid milk market. New Medit 2014, 13, 2–8. [Google Scholar]
- Awokuse, T.O.; Wang, X. Threshold effects and asymmetric price adjustments in US dairy markets. Can. J. Agric. Econ. Rev. Can. 2009, 57, 269–286. [Google Scholar] [CrossRef]
- Weldesenbet, T. Asymmetric price transmission in the Slovak liquid milk market. Agric. Econ. 2013, 59, 512–524. [Google Scholar] [CrossRef] [Green Version]
- Meyer, D.F.; Sanusi, K.A.; Hassan, A. Analysis of the asymmetric impacts of oil prices on food prices in oil-exporting developing countries. J. Int. Stud. 2018, 11, 82–94. [Google Scholar] [CrossRef] [PubMed]
- Hockmann, H.; Vöneki, É. Collusion in the Hungarian market for raw milk. Outlook Agric. 2009, 38, 39–45. [Google Scholar] [CrossRef]
- Buleca, J.; Kováč, V.; Šubová, N. Milk production related to price of raw cow’s milk in selected european countries. Potravin. Slovak J. Food Sci. 2018, 12, 798–805. [Google Scholar] [CrossRef] [Green Version]
- Vargova, L.; Rajcaniova, M. spatial price transmission of milk prices among tHevisegrad countries. Visegr. J. Bioecon. Sustain. Dev. 2017, 6, 79–83. [Google Scholar] [CrossRef] [Green Version]
- Szucs, I.; Szollosi, L. Problems of the Hungarian dairy sector in connection with the abolition of the milk quota system. Rocz. Nauk. StowarzyszeniaEkon. Rol. I Agrobiz. 2015, 17, 379–385. [Google Scholar]
- Kovacs, K.; Pandey, R. Hungarian Dairy And Beef Production Sector Technical Efficiency Comparsion Using Dea. Apstract Appl. Stud. Agribus. Commer. 2017, 11, 131–140. [Google Scholar] [CrossRef]
- Research Institute of Agricultural Economics. Market Price and Information SystemURL. 2019. Available online: https://pair.aki.gov.hu/web_public/general/home.do (accessed on 1 October 2019).
- Bruszt, L.; Karas, D. Diverging developmental strategies beyond “lead sectors” in the EU’s periphery: The politics of developmental alliances in the Hungarian and Polish dairy sectors. Rev. Int. Political Econ. 2019, 1–21, (this special issue, published online 7 August 2019). [Google Scholar] [CrossRef] [Green Version]
- Pesaran, M.H.; Shin, Y. An autoregressive distributed-lag modelling approach to cointegration analysis. Econom. Soc. Monogr. 1998, 31, 371–413. [Google Scholar]
- Pesaran, M.H.; Shin, Y.; Smith, R.J. Bounds testing approaches to the analysis of level relationships. J. Appl. Econom. 2001, 16, 289–326. [Google Scholar] [CrossRef]
- Shin, Y.; Yu, B.; Greenwood-Nimmo, M. Modelling asymmetric cointegration and dynamic multipliers in a nonlinear ARDL framework. In InFestschrift in Honor of Peter Schmidt 2014; Springer: New York, NY, USA, 2014; pp. 281–314. [Google Scholar]
- Phillips, P.C.; Perron, P. Testing for a unit root in time series regression. Biometrika 1988, 75, 335–346. [Google Scholar] [CrossRef]
- Zivot, E.; Andrews, D.W. Further evidence on the great crash, the oil-price shock, and the unit-root hypothesis. J. Bus. Econ. 2002, 20, 25–44. [Google Scholar] [CrossRef]
- Rezitis, A.N. Investigating price transmission in the Finnish dairy sector: An asymmetric NARDL approach. Empir. Econ. 2019, 57, 861–900. [Google Scholar] [CrossRef]


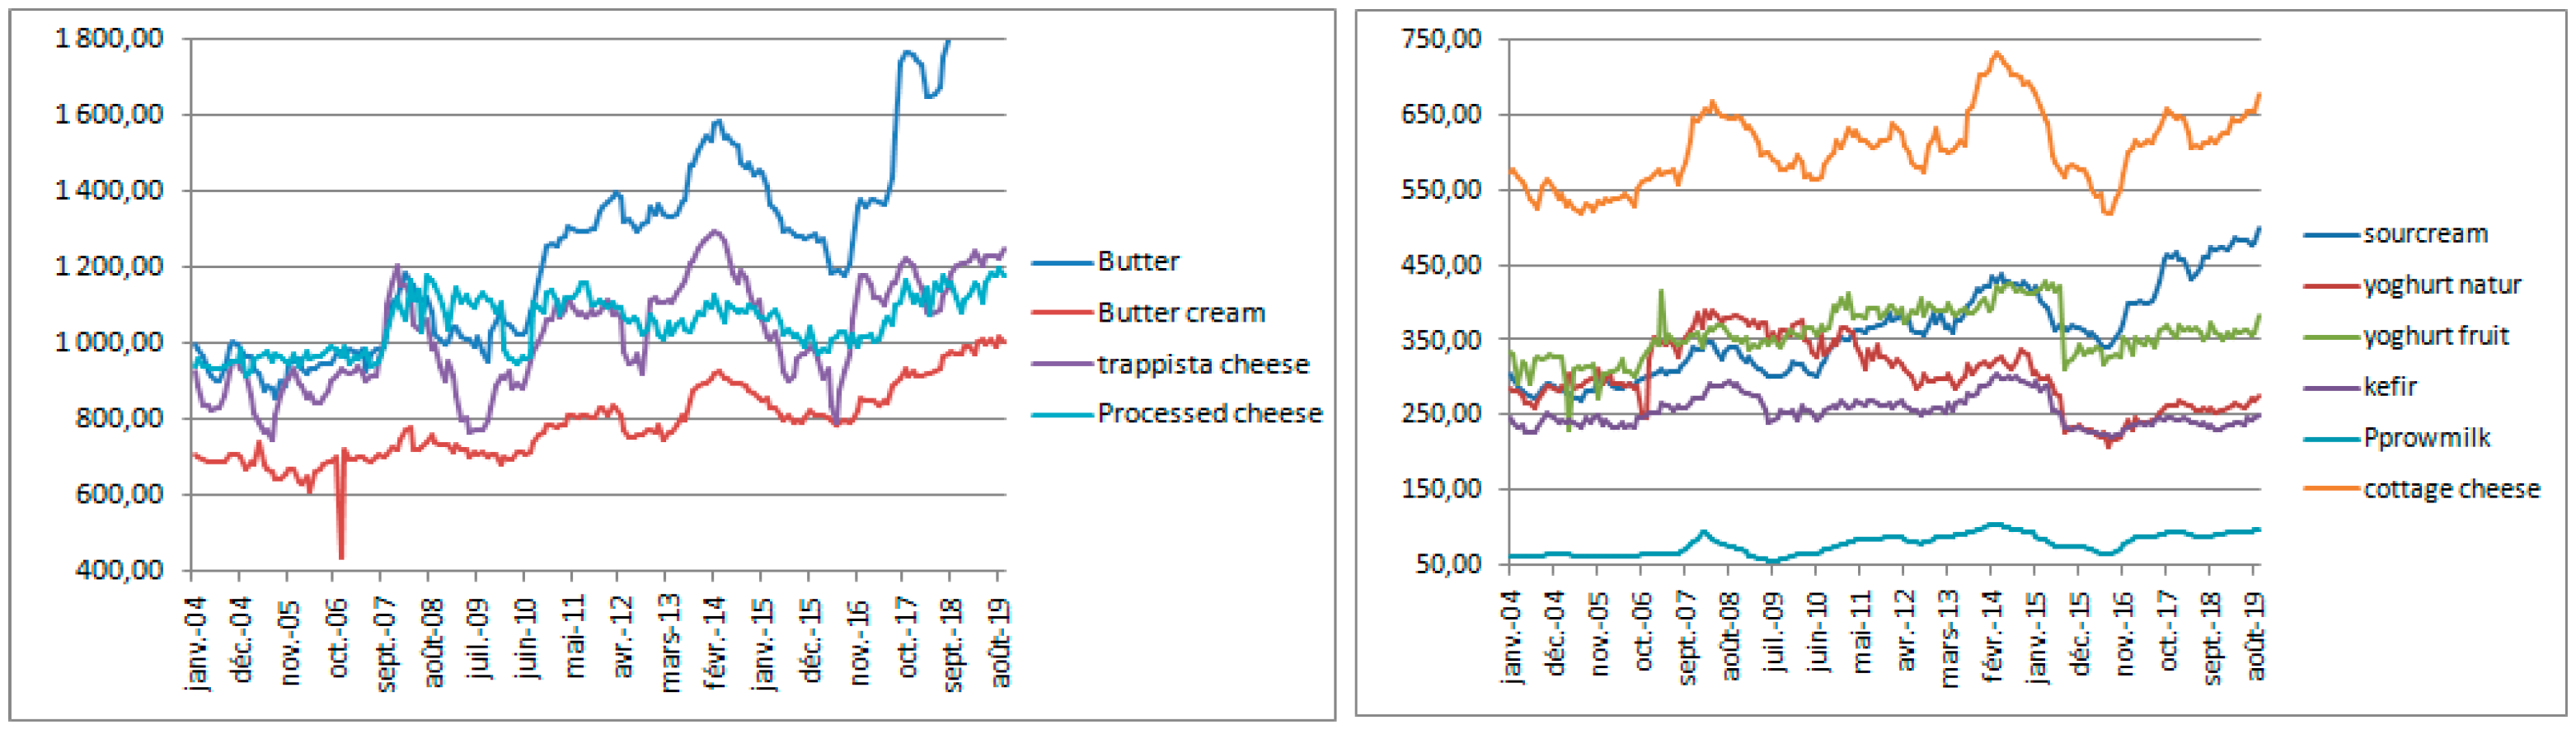
| Min | Max | Mean | Standard Deviation | |
|---|---|---|---|---|
| Butter (BU) | 856.20 | 1885.40 | 1260.40 | 278.94 |
| Butter cream (BCREAM) | 432.80 | 1018.80 | 787.10 | 100.07 |
| Cottage cheese (CCHEESE) | 517.80 | 733.90 | 604.30 | 49.50 |
| Sour cream (SCREAM) | 268.10 | 499.90 | 360.70 | 59.66 |
| Natural yogurt (YOGNAT) | 209.20 | 390.60 | 303.20 | 45.86 |
| Fruit yogurt (YOGFRUIT) | 229.80 | 427.70 | 359.40 | 34.22 |
| Kefir (KEFIR) | 221.00 | 305.80 | 255.40 | 20.41 |
| Trappistacheese (TCHEESE) | 746.50 | 1294.80 | 1020.80 | 141.65 |
| Processed cheese (PCHEESE) | 916.00 | 1195.90 | 1051.40 | 72.61 |
| Raw milk (PPRM) | 54.99 | 105.33 | 77.81 | 13.39 |
| PP Statistics | ZA Statistics | Break Point | PP Statistics | ZA Statistics | PP Statistics | |
|---|---|---|---|---|---|---|
| Intercept | Intercept and Trend | |||||
| LPPRM | −1.36 | −4.21 | 12/2014 | −2.00 | −3.37 | 10/2012 |
| LBU | −0.26 | −3.67 | 10/2014 | −2.51 | −3.35 | 08/2016 |
| LBCREAM | −1.84 | −3.44 | 06/2017 | −6.53 *** | −3.39 | 09/2016 |
| LCCHEESE | −1.88 | −4.21 | 01/2015 | −2.35 | −3.33 | 10/2007 |
| LSCREAM | −0.28 | −3.83 | 01/2015 | −2.72 | −3.47 | 02/2017 |
| LYOGNAT | −1.71 | −5.01 ** | 11/2006 | −2.25 | −3.28 | 10/2007 |
| LYOGFRUIT | −3.30 ** | −7.73 *** | 07/2015 | −3.82 ** | −3.82 | 12/2011 |
| LKEFIR | −2.04 | −4.81 ** | 04/2015 | −2.07 | −2.58 | 11/2007 |
| LTCHEESE | −1.98 | −4.43 | 08/2014 | −2.97 | −3.82 | 03/2018 |
| LPCHEESE | −2.82 * | −3.76 | 08/2007 | −3.60 | −3.30 | 12/2007 |
| Intercept | Intercept and Trend | |||||
| ΔLPPRM | −5.16 *** | −5.00 ** | 12/2007 | −5.15 *** | −4.63 ** | 03/2015 |
| ΔLBU | −10.09 *** | −7.05 *** | 07/2016 | −10.11 *** | −6.76 *** | 05/2015 |
| ΔLBCREAM | −26.45 *** | −9.69 *** | 02/2014 | −26.48 | −9.48 *** | 01/2007 |
| ΔLCCHEESE | −11.08 *** | −6.34 *** | 06/2016 | −11.07 *** | −6.06 *** | 07/2015 |
| ΔLSCREAM | −12.28 *** | −7.36 *** | 07/2016 | −12.31 *** | −7.04 *** | 05/2015 |
| ΔlYOGNAT | −15.25 *** | −11.05 *** | 06/2016 | −15.23 *** | −10.83 *** | 07/2015 |
| ΔlYOGFRUIT | −19.61 *** | −10.51 *** | 03/2005 | −19.55 *** | −10.24 *** | 06/2004 |
| ΔlKEFIR | −15.77 *** | −6.83 *** | 02/2014 | −15.75 *** | −6.73 *** | 06/2004 |
| ΔlTCHEESE | −9.87 *** | −6.41 *** | 06/2016 | −9.85 *** | −6.19 *** | 08/2004 |
| ΔLPCHEESE | −18.40 *** | −9.79 *** | 07/2008 | −18.35 *** | −9.64 *** | 05/2015 |
| Cointegration Hypothesis | F Statistic |
|---|---|
| F (LBU/PPRM+, PPRM−) | 6.74 *** |
| F (LBCREAM/PPRM+, PPRM−) | 12.40 *** |
| F (LCCHEESE/PPRM+, PPRM−) | 5.87 *** |
| F (LSCREAM/PPRM+, PPRM−) | 7.78 *** |
| F (LYOGNAT/PPRM+, PPRM−) | 2.56 ** |
| F (LYOGFRUIT/PPRM+, PPRM−) | 7.16 *** |
| F (LKEFIR/PPRM+, PPRM−) | 6.65 *** |
| F (LTCHEESE/PPRM+, PPRM−) | 17.02 *** |
| F (LPCHEESE/PPRM+, PPRM−) | 5.34 *** |
| Butter | Butter Cream | Kefir | Sour Cream | ||||
|---|---|---|---|---|---|---|---|
| Variable | Coefficient | Variable | Coefficient | Variable | Coefficient | Variable | Coefficient |
| C | 0.45 *** | C | 1.03 *** | C | 0.27 *** | C | 0.34 *** |
| LBUt−1 | −0.15 *** | LBCREAMt−1 | −0.36 *** | LKEFIRt−1 | −0.11 *** | LSCREAMt−1 | −0.14 *** |
| LPPRMt−1+ | 0.11 *** | LPPRMt−1+ | 0.14 *** | LPPRMt−1+ | 0.06 *** | LPPRMt−1+ | 0.09 *** |
| LPPRMt−1− | 0.07 *** | LPPRMt−1− | 0.08 ** | LPPRMt−1− | 0.08 *** | LPPRMt−1− | 0.06 *** |
| ΔLBUt−1 | 0.13 * | ΔLBCREAMt−1 | −0.39 *** | ΔLKEFIRt−1 | −0.21 *** | ΔLSCREAMt−1 | −0.07 |
| ΔLBUt−2 | 0.13 * | ΔLBCREAMt−2 | −0.16 ** | ΔLKEFIRt−2 | 0.00 | ΔLSCREAMt−2 | 0.15 ** |
| ΔLPPRMt−1+ | 0.69 *** | ΔLPPRMt−1+ | −0.19 | ΔLPPRMt−1+ | 0.30 ** | ΔLPPRMt−1+ | 0.62 *** |
| ΔLPPRMt−2+ | −0.36 ** | ΔLPPRMt−1− | 0.61 * | ΔLPPRMt−1− | 0.44 *** | ΔLPPRMt−1− | 0.53 *** |
| LM | 3.65 (0.37) | LM | 0.50 (0.60) | LM | 3.51 (0.53) | LM | 7.01 (0.27) |
| ARCH (4) | 5.48 (0.24) | ARCH (2) | 2.09 (0.35) | ARCH (2) | 0.92 (0.62) | ARCH (4) | 7.25 (0.12) |
| Long run coefficients | |||||||
| LPPRMt−1+ | 0.74 *** | LPPRMt−1+ | 0.39 *** | LPPRMt−1+ | 0.57 *** | LPPRMt−1+ | 0.65 *** |
| LPPRMt−1− | 0.48 *** | LPPRMt−1− | 0.24 *** | LPPRMt−1− | 0.76 *** | LPPRMt−1− | 0.48 *** |
| F stat | 15.68 *** | F stat | 13.97 *** | F stat | 16.06 *** | F stat | 8.96 *** |
| Cottage Cheese | TrappistaCheese | Processed Cheese | Natural Yogurt | Yogurt Fruit | |||||
|---|---|---|---|---|---|---|---|---|---|
| Variable | Coefficient | Variable | Coefficient | Variable | Coefficient | Variable | Coefficient | Variable | Coefficient |
| C | 0.25 *** | C | 0.98 *** | C | 0.47 *** | C | 0.15 ** | C | 0.56 *** |
| LCCHEESEt−1 | −0.09 *** | LTCHEESEt−1 | −0.33 *** | LPCHEESEt−1 | −0.16 *** | LYOGNATt−1 | −0.06 ** | LYOFRUITt−1 | −0.22 *** |
| LPPRMt−1+ | 0.05 *** | LPPRMt−1+ | 0.20 *** | LPPRMt−1+ | 0.04 ** | LPPRMt−1+ | 0.02 | LPPRMt−1+ | 0.09 *** |
| LPPRMt−1− | 0.06 *** | LPPRMt−1− | 0.19 *** | LPPRMt−1− | 0.03 * | LPPRMt−1− | 0.04 | LPPRMt−1− | 0.09 *** |
| ΔLCCHEESEt−1 | 0.00 | ΔLTCHEESEt−1 | 0.24 *** | ΔLPCHEESEt−1 | −0.21 *** | ΔLYOGNATt−1 | −0.11 | ΔLYOFRUITt−1 | −0.21 *** |
| ΔLCCHEESEt−2 | 0.12 | ΔLTCHEESEt−2 | - | ΔLPCHEESEt−2 | - | ΔLYOGNATt−2 | ΔLYOGNATt−2 | ||
| ΔLPPRMt−1+ | 0.70 *** | ΔLPPRMt−1+ | 0.74 *** | ΔLPPRMt−1+ | 0.21 | ΔLPPRMt−1+ | 0.35 * | ΔLPPRMt−1+ | 0.37 |
| ΔLPPRMt−2+ | −0.42 ** | ΔLPPRMt−1− | 0.93 *** | ΔLPPRMt−1− | −0.17 | ΔLPPRMt−1− | 0.14 | ΔLPPRMt−1− | −0.33 |
| LM | 10.48 (0.23) | LM | 0.50 (0.60) | LM | 1.47 (0.43) | LM | 2.88 (0.33) | LM | 2.66 (0.35) |
| ARCH (5) | 7.81 (0.16) | ARCH (1) | 9.51 (0.00) | ARCH (1) | 6.06 (0.01) | ARCH (1) | 4.25 (0.03) | ARCH (1) | 18.32 (0.00) |
| Long run coefficients | |||||||||
| LPPRMt−1+ | 0.58 *** | LPPRMt−1+ | 0.62 *** | LPPRMt−1+ | 0.25 *** | LPPRMt−1+ | 0.41 *** | LPPRMt−1+ | 0.41 *** |
| LPPRMt−1− | 0.65 *** | LPPRMt−1− | 0.58 *** | LPPRMt−1− | 0.25 *** | LPPRMt−1− | 0.77 *** | LPPRMt−1− | 0.43 *** |
| F stat | 3.39 * | F stat | 4.11 ** | F stat | 0.27 (0.59) | F stat | 4.77 ** | F stat | 0.14 (0.70) |
© 2020 by the authors. Licensee MDPI, Basel, Switzerland. This article is an open access article distributed under the terms and conditions of the Creative Commons Attribution (CC BY) license (http://creativecommons.org/licenses/by/4.0/).
Share and Cite
Ben Abdallah, M.; Fekete Farkas, M.; Lakner, Z. Analysis of Dairy Product Price Transmission in Hungary: A Nonlinear ARDL Model. Agriculture 2020, 10, 217. https://doi.org/10.3390/agriculture10060217
Ben Abdallah M, Fekete Farkas M, Lakner Z. Analysis of Dairy Product Price Transmission in Hungary: A Nonlinear ARDL Model. Agriculture. 2020; 10(6):217. https://doi.org/10.3390/agriculture10060217
Chicago/Turabian StyleBen Abdallah, Marwa, Maria Fekete Farkas, and Zoltan Lakner. 2020. "Analysis of Dairy Product Price Transmission in Hungary: A Nonlinear ARDL Model" Agriculture 10, no. 6: 217. https://doi.org/10.3390/agriculture10060217
APA StyleBen Abdallah, M., Fekete Farkas, M., & Lakner, Z. (2020). Analysis of Dairy Product Price Transmission in Hungary: A Nonlinear ARDL Model. Agriculture, 10(6), 217. https://doi.org/10.3390/agriculture10060217