
Nutritional Value of Jerusalem Artichoke Tubers (Helianthus tuberosus L.) Grown in Organic System under Lithuanian and Polish Conditions

 ,
,  ,
,  , ,
, , 
Abstract
:1. Introduction
2. Materials and Methods
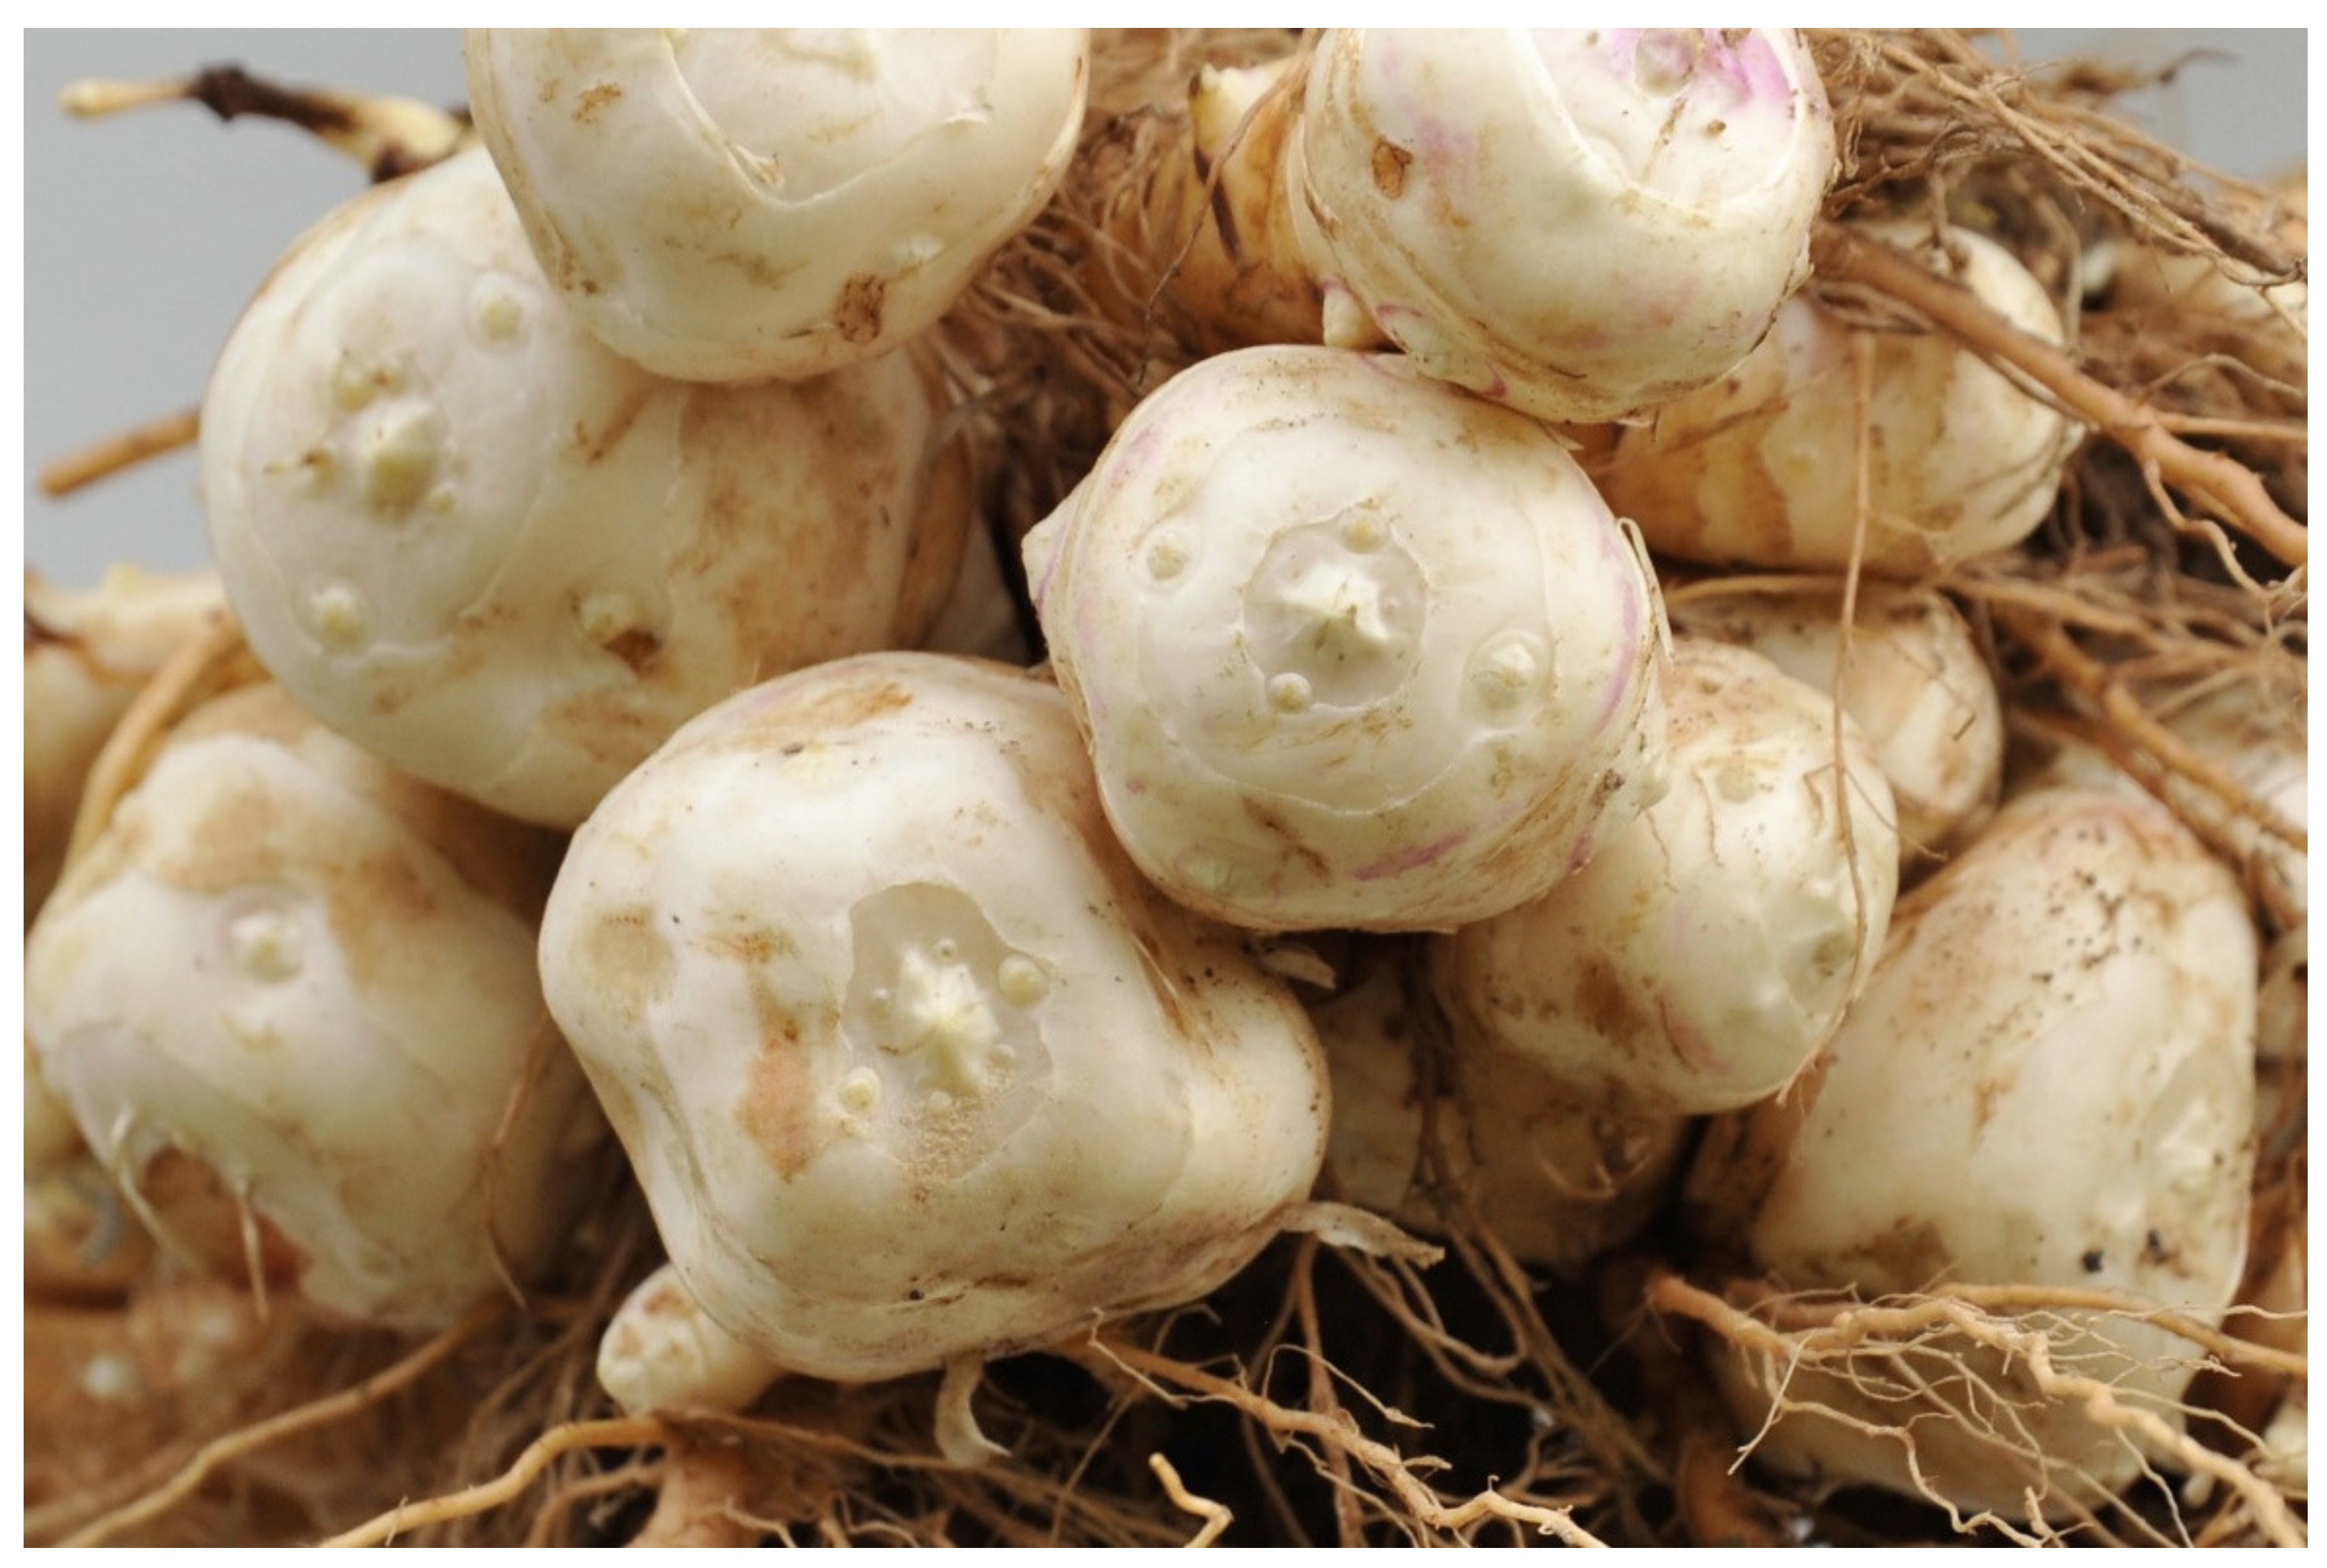
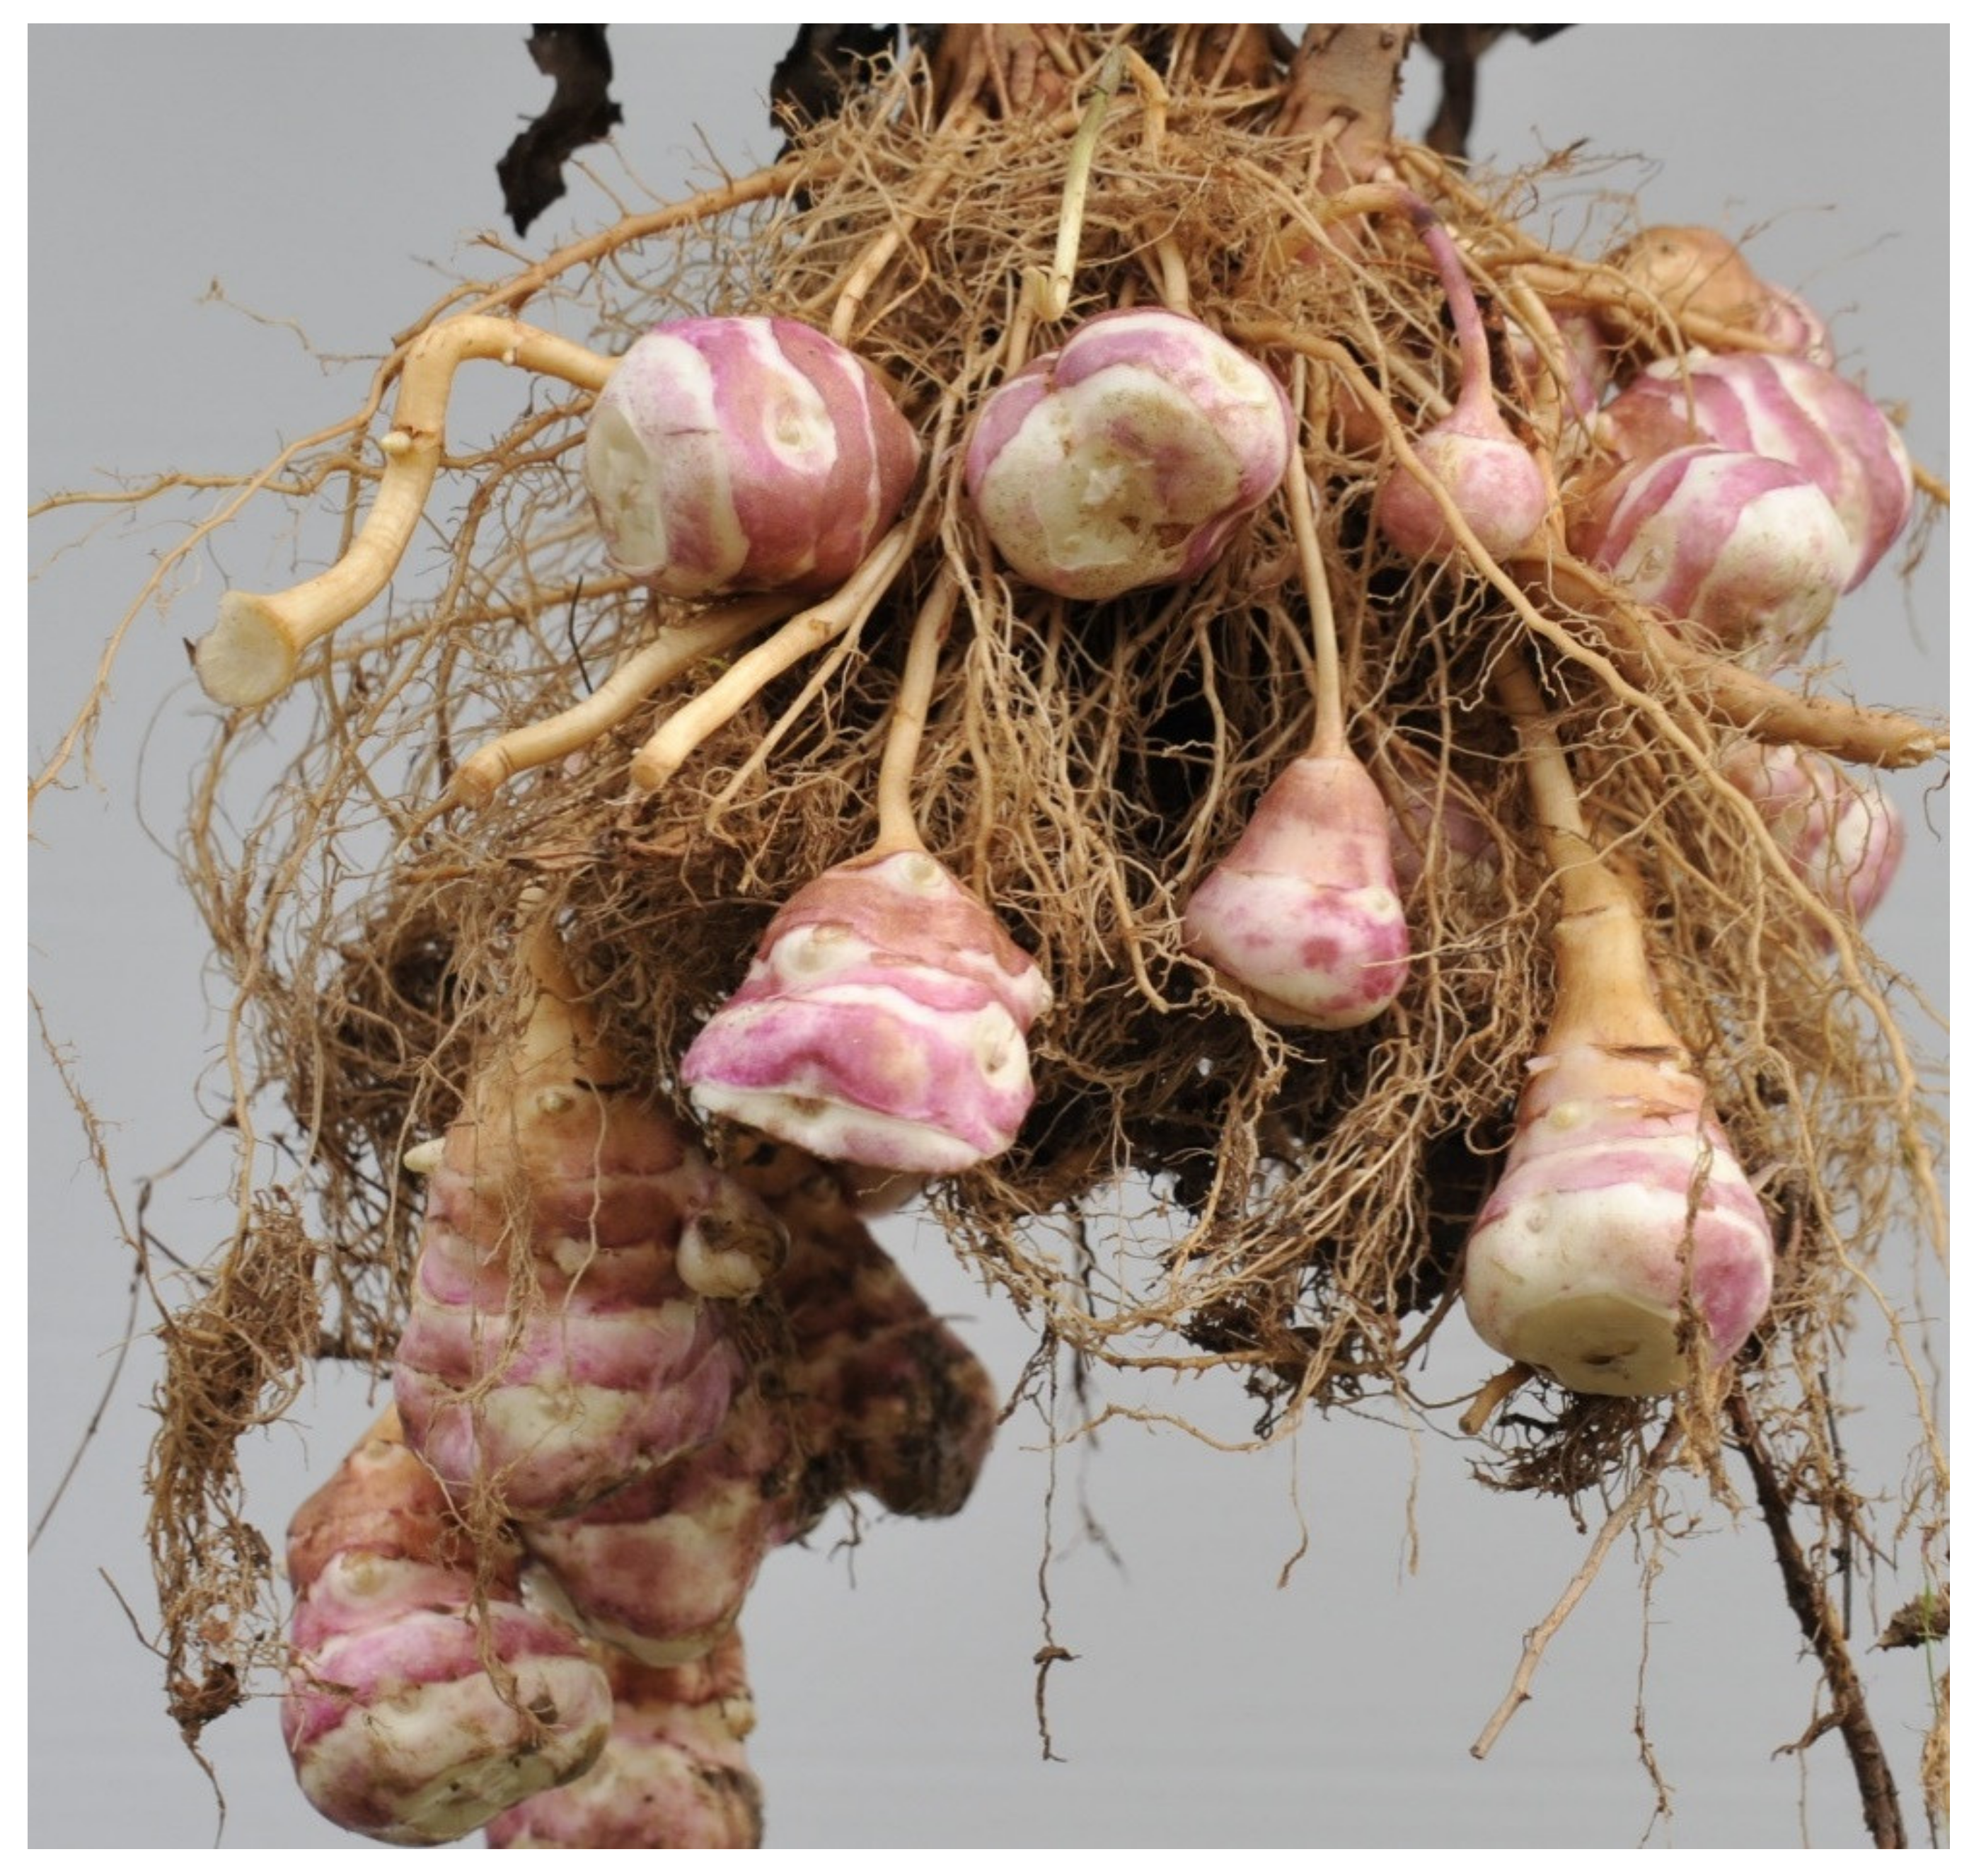
2.1. Characteristic of Cultivars
2.2. Methodology of Soil Testing
2.3. Methodology of Tuber Sampling
2.4. Methods for Research and Analysis
2.5. Statistical Analyses
- –
- σe2 is the estimation of environmental variation associated with the repeating of observations or measurements over time;
- –
- σL2 is the estimation of locality variation;
- –
- σp2 is the estimation of (total) phenotypic variation [31].
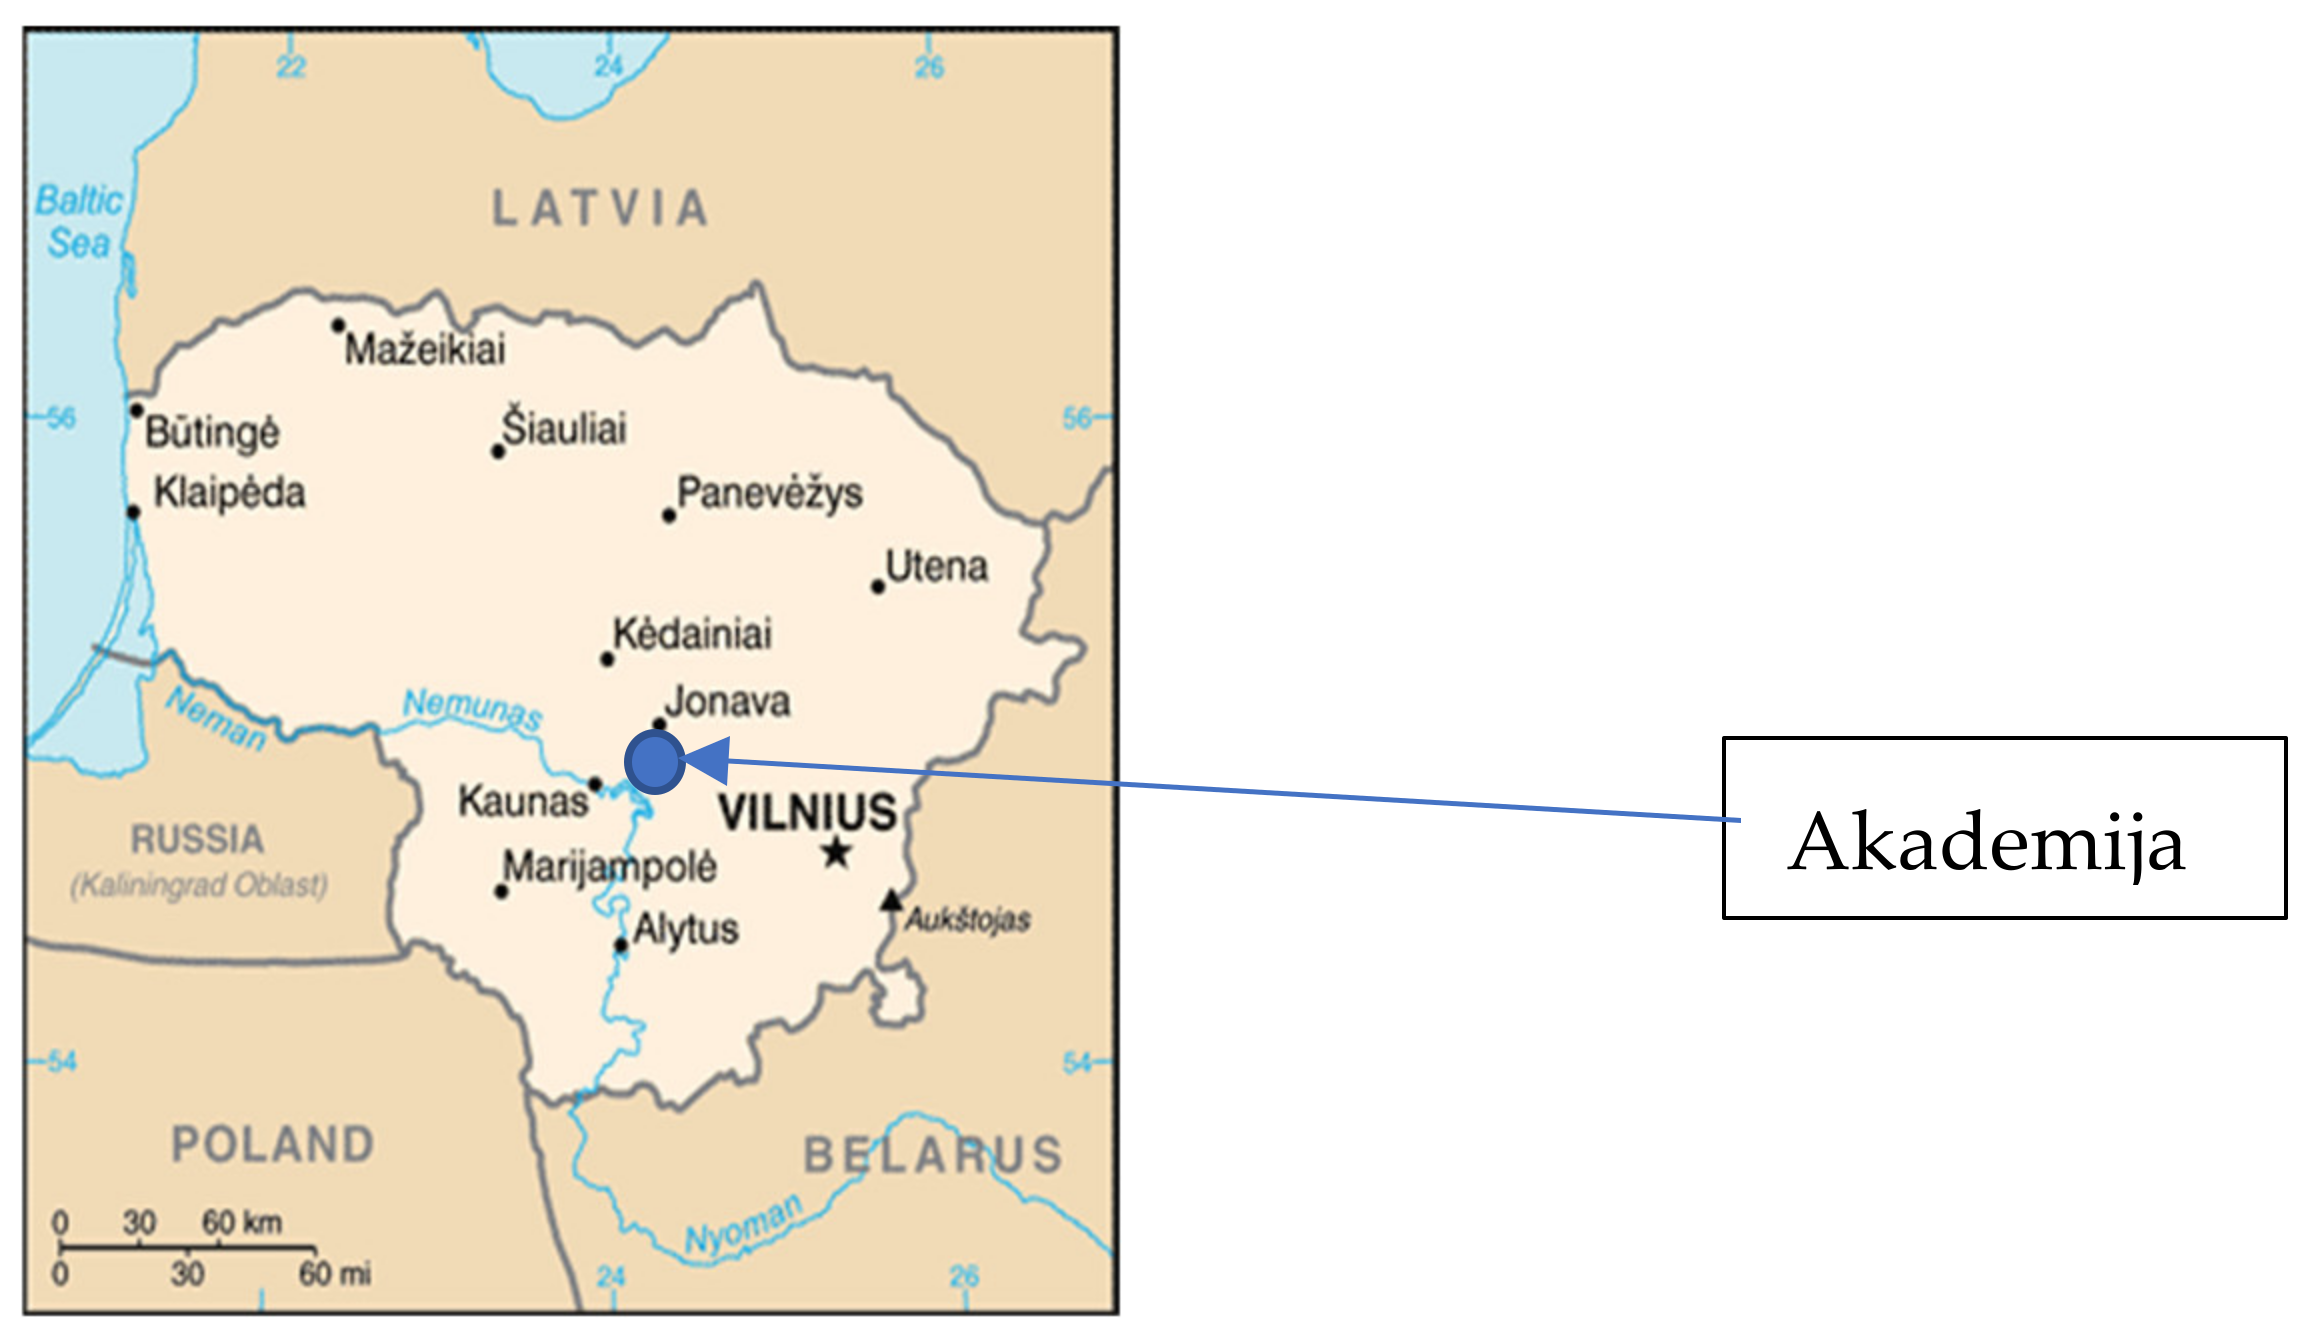
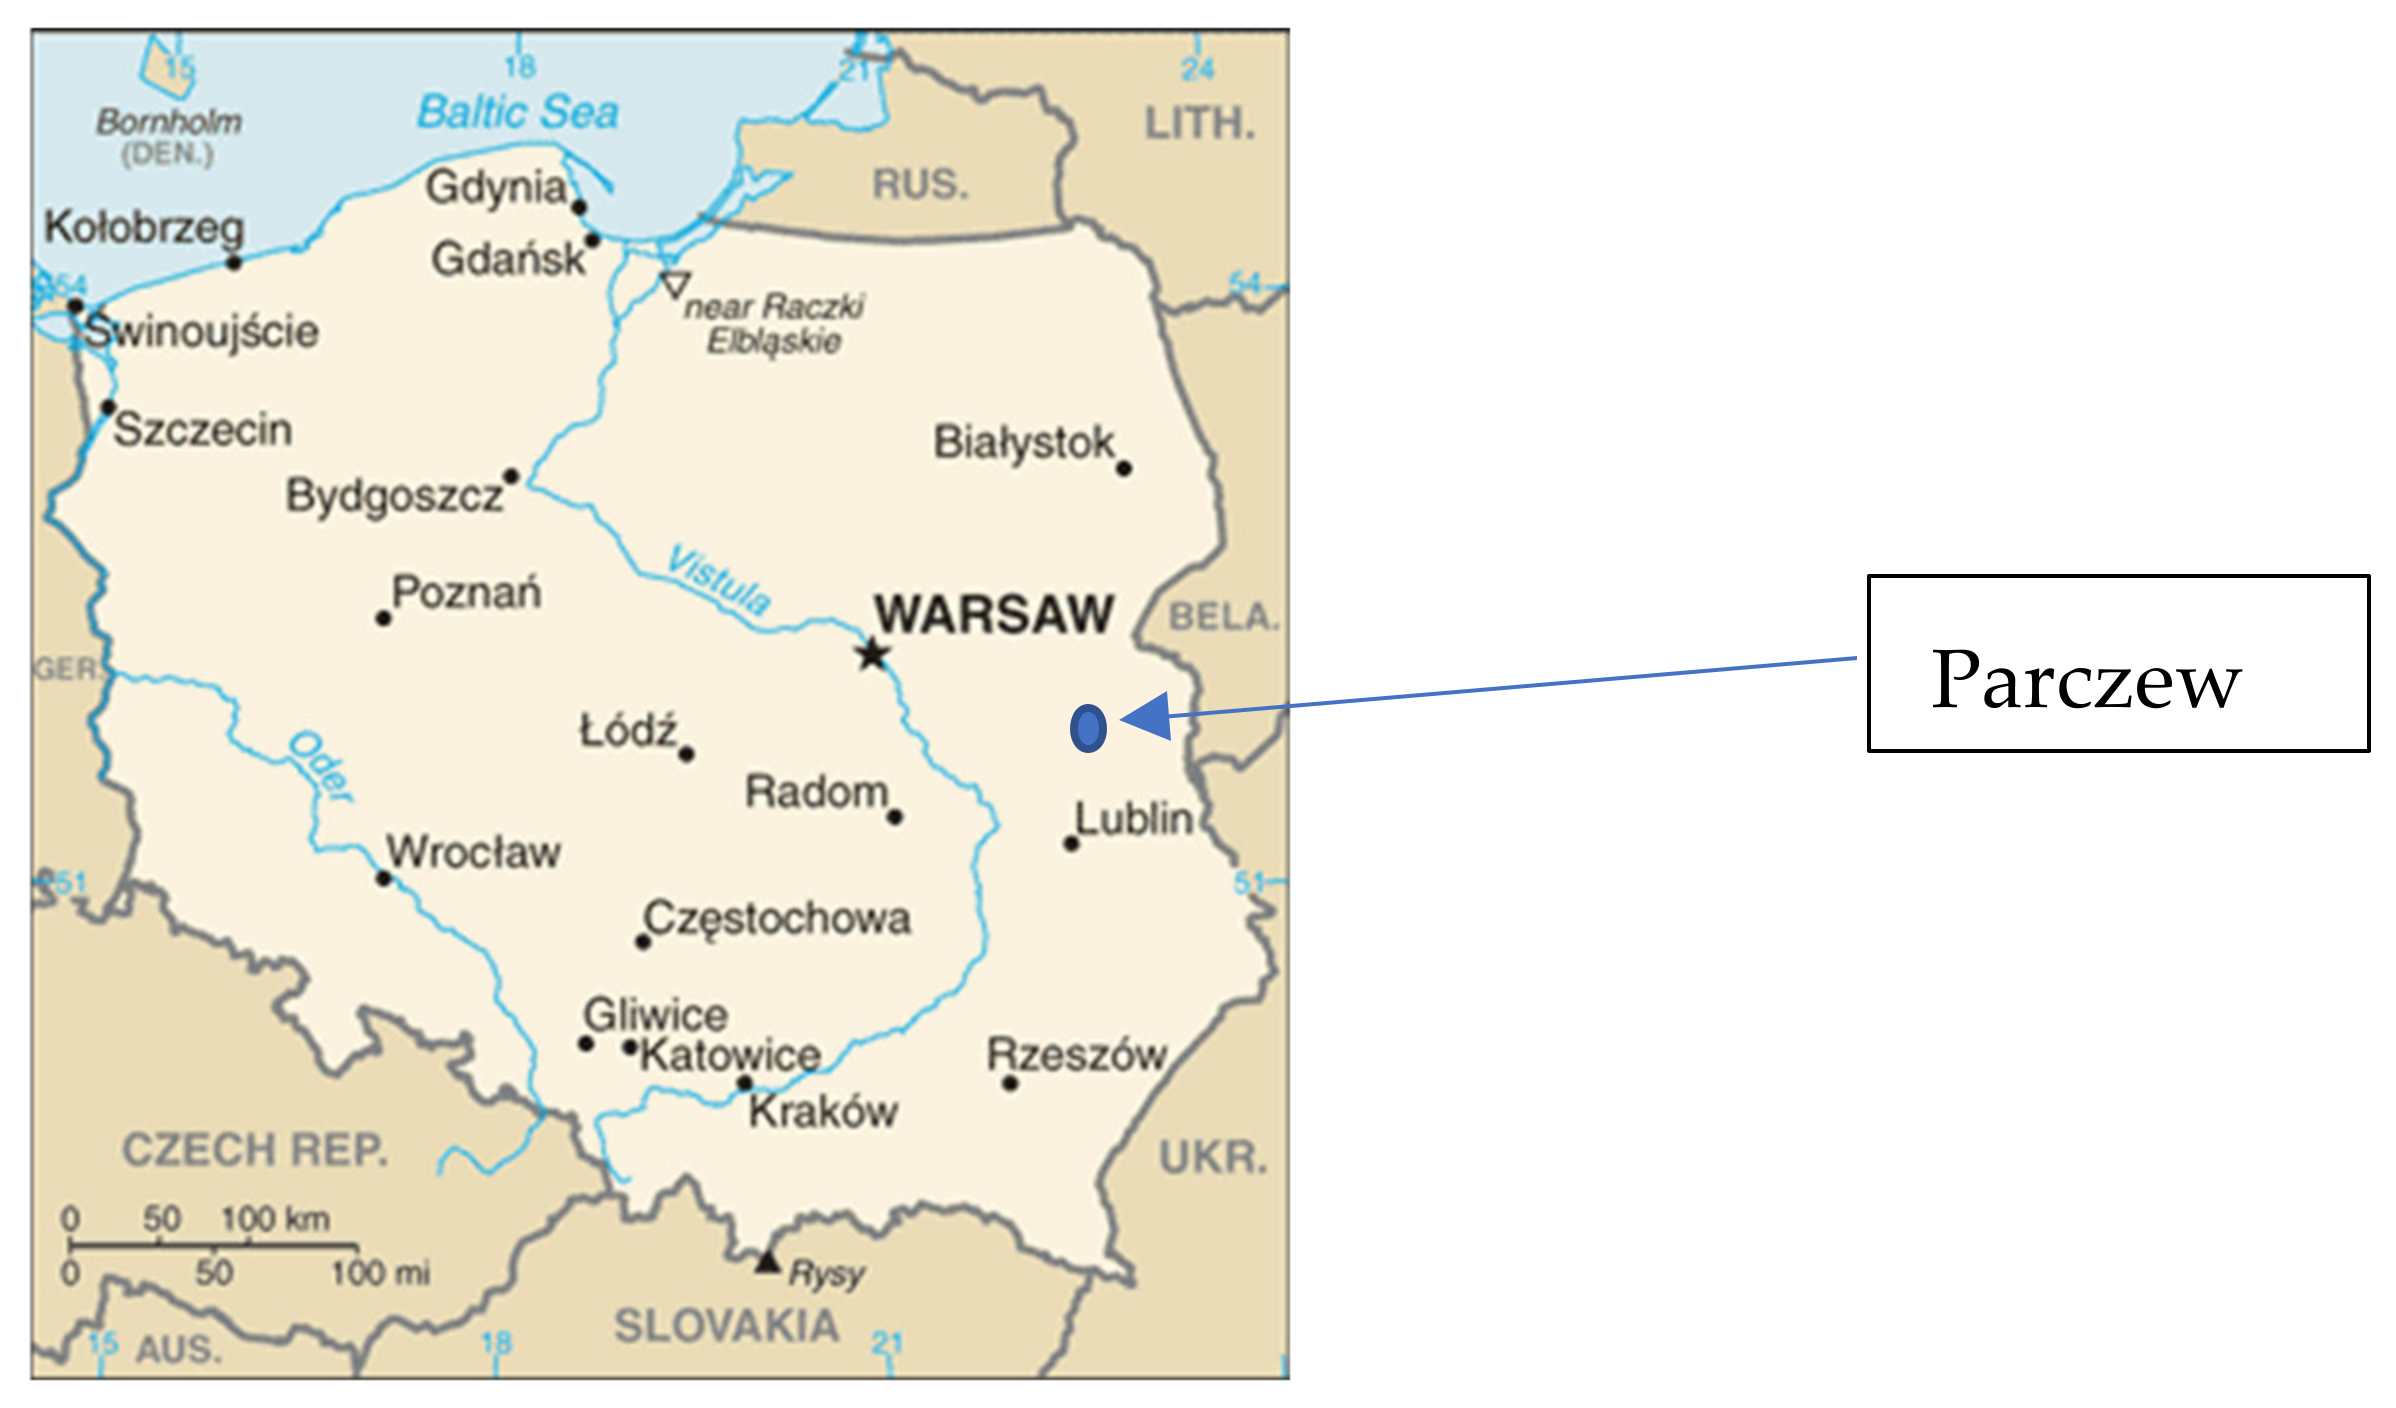
2.6. Geographic Location
3. Results
3.1. Soil Conditions
3.2. Meteorological Conditions
3.3. Chemical Composition of Tubers
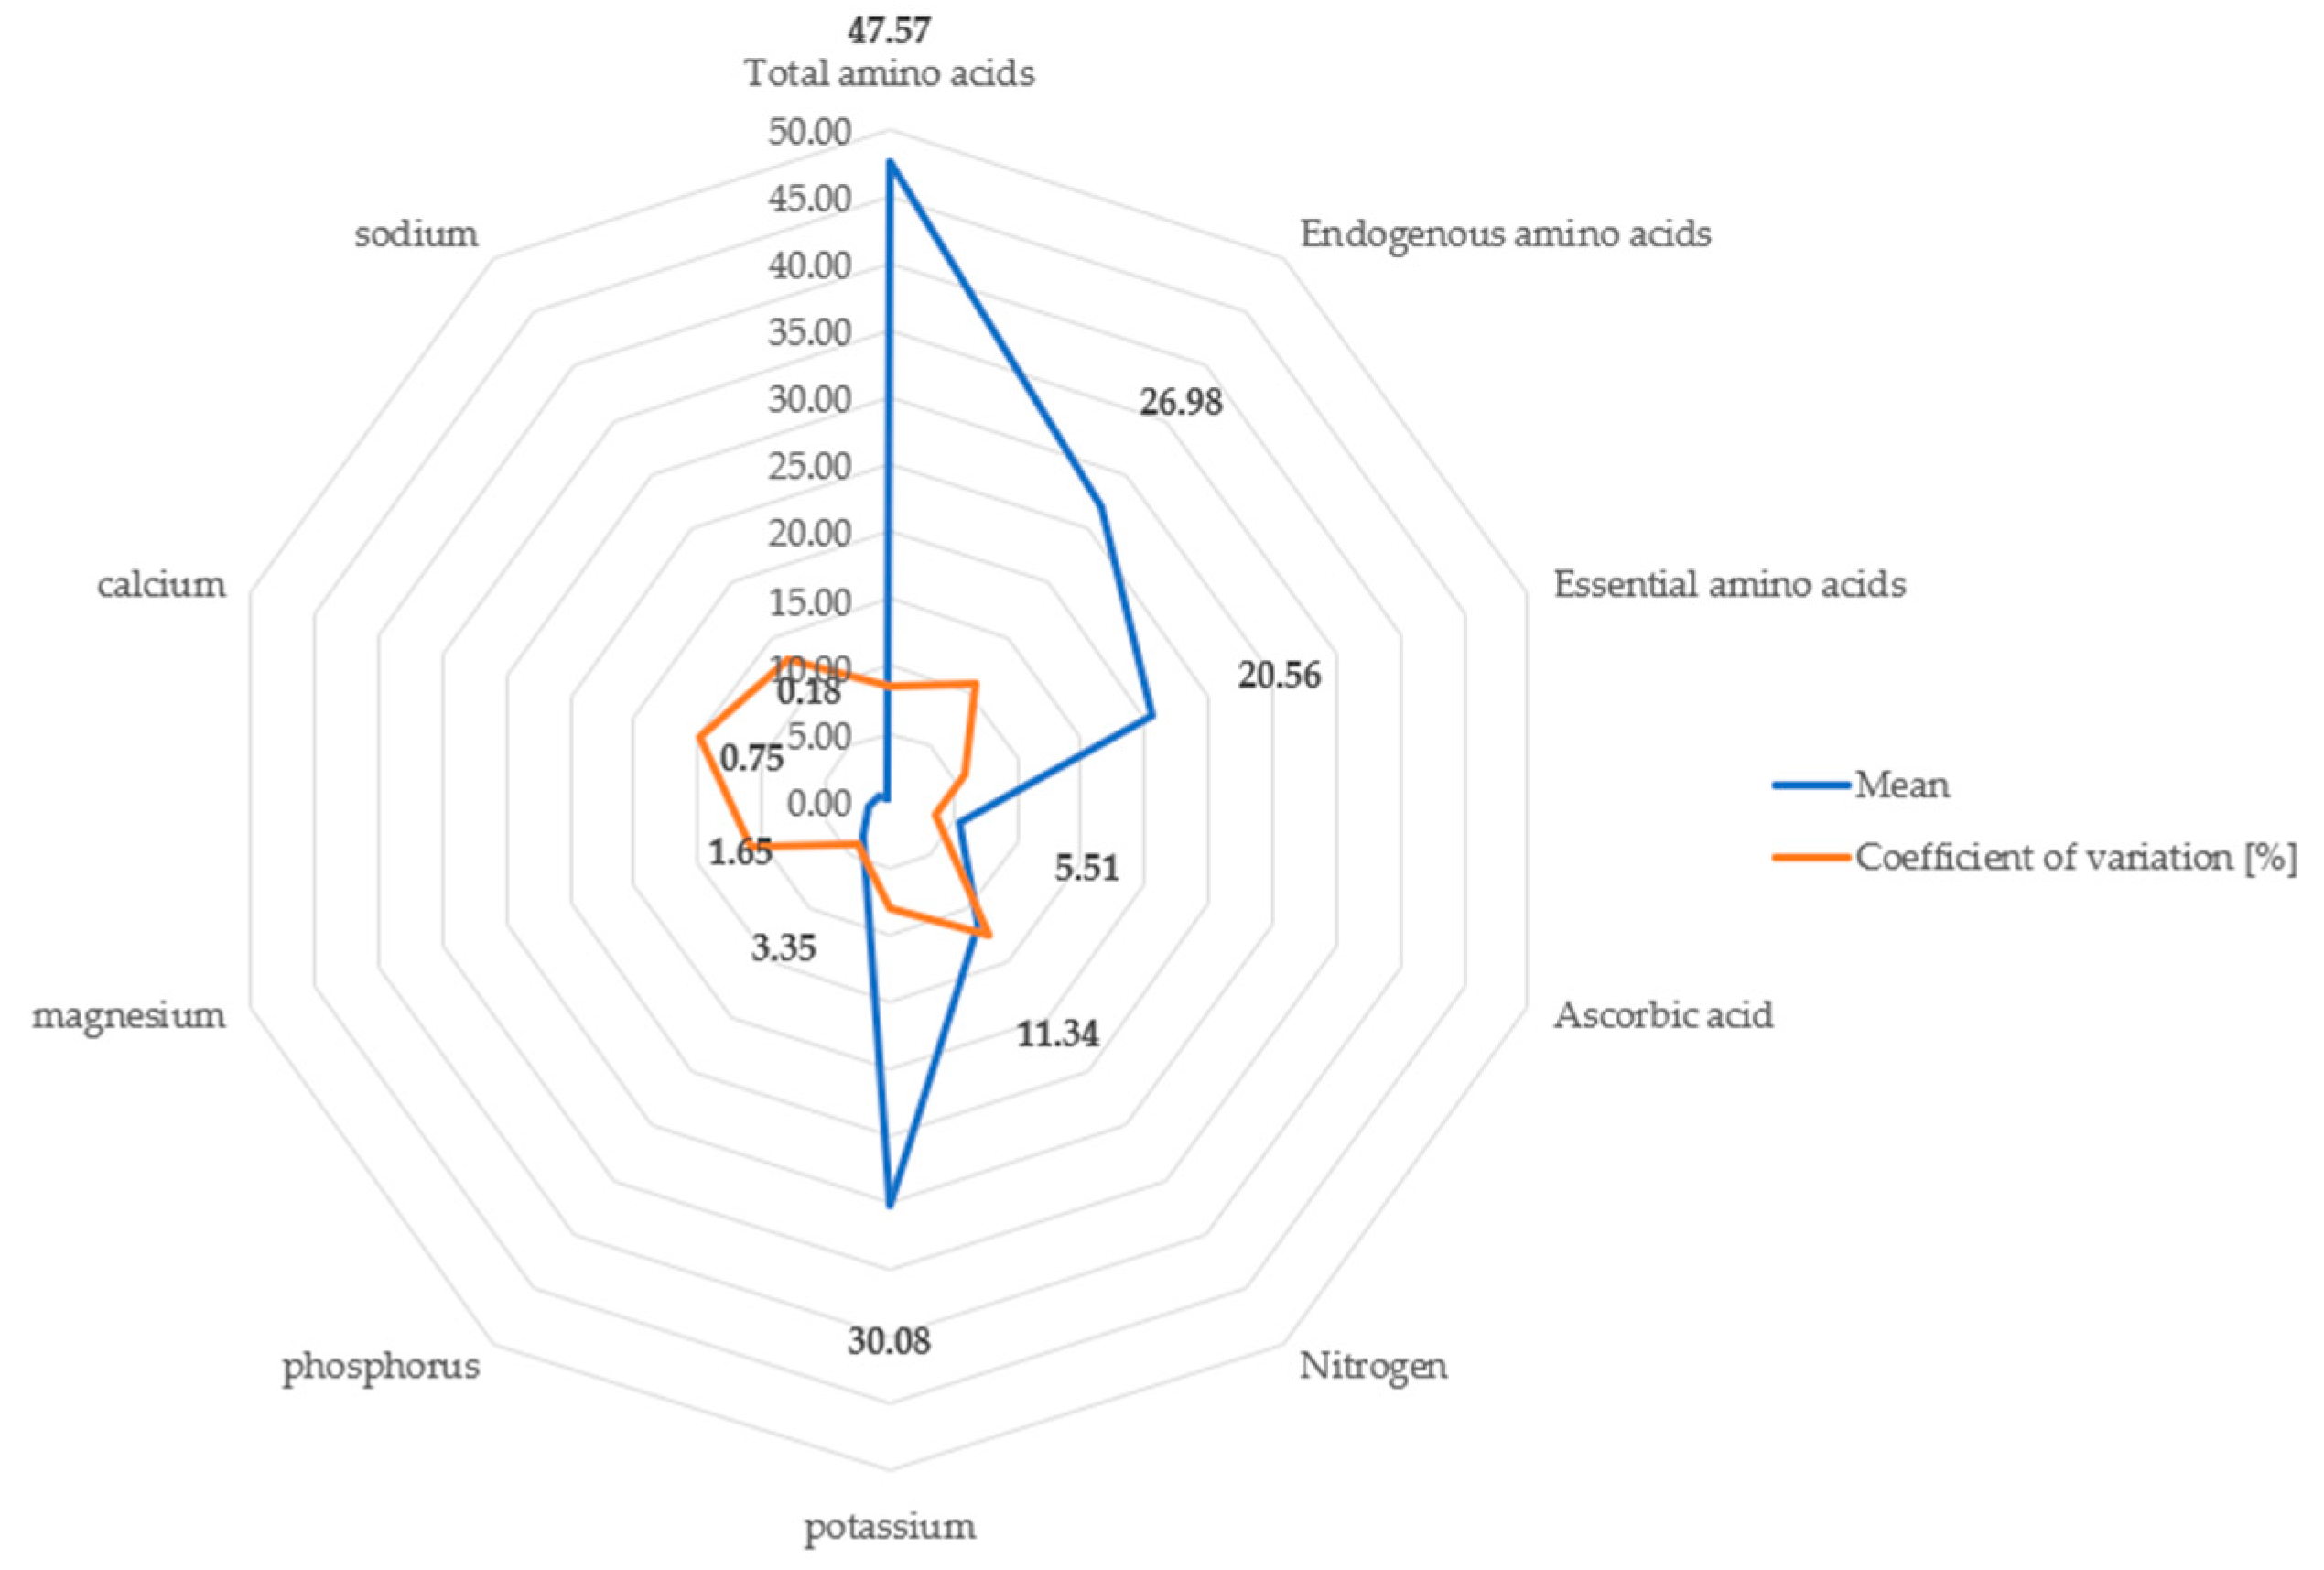
3.4. Variabilities of Chemical Composition Characteristics of Tubers
4. Discussion
5. Conclusions
Author Contributions
Funding
Institutional Review Board Statement
Data Availability Statement
Conflicts of Interest
Abbreviations
| C | carbon |
| Ca | calcium |
| Corg | organic carbon |
| DAP | days after planting |
| ES | The European Union |
| GCA | General Combining Ability |
| H. tuberosus | Helianthus tuberosus |
| JA | Jerusalem artichoke |
| K | potassium |
| Mg | magnesium |
| N | nitrogen |
| NPK | fertilizer mixture |
| P | phosphorus |
| P2O5 | mobile phosphorus |
| pH | a measure of acidity or alkalinity |
| r | correlation coefficient |
| SCA | the Specific Combining Ability |
| SCN | standard climatic norm |
| SHC | Sielyaninov Hydrothermal Coefficient |
References
- Danilčenko, H.; Jarienė, E.; Tarasevičienė, Ž.; Aleknavičienė, P.; Kulaitienė, J.; Kita, A.; Gajewski, M.; Bliznikas, S.; Lukšienė, Ž. Quality and safety aspects of some new generation food products in Lithuania. In Food Quality and Safety; Life Science University: Wrocław, Poland, 2009; pp. 55–64. [Google Scholar]
- Danilčenko, H.; Jarienė, E.; Gajewski, M.; Cerniauskiene, J.; Kulaitiene, J.; Sawicka, B.; Aleknaviciene, P. Accumulation of elements in some organically grown alternative horticultural crops in Lithuania. Acta Sci. Pol. Hortorum Cultus 2011, 10, 23–31. [Google Scholar]
- Sawicka, B.; Skiba, D.; Pszczółkowski, P.; Aslan, I.; Sharifi-Rad, J.; Krochmal-Marczak, B. Jerusalem artichoke (H. tuberosus L.) as a medicinal plant and its natural products. Cell. Mol. Biol. 2020. [Google Scholar] [CrossRef]
- Bogucka, B.; Pszczółkowska, A.; Okorski, A.; Jankowski, K. The Effects of Potassium Fertilization and Irrigation on the Yield and Health Status of Jerusalem artichoke (Helianthus tuberosus L.). Agronomy 2021, 11, 234. [Google Scholar] [CrossRef]
- Sawicka, B. Jerusalem artichoke (Helianthus tuberosus L.). Biology, Breeding, Useful Meaning; University of Life Sciences: Lublin, Poland, 2016; p. 241. ISBN 978-83-72-59-251-2. (In Polish) [Google Scholar]
- Qiu, Y.; Lei, P.; Zhang, Y.; Sha, Y.; Zhan, Y.; Xu, Z.; Li, S.; Xu, H.; Ouyang, P. Recent advances in bio-based multi-products of agricultural Jerusalem artichoke resources. Biotechnol. Biofuels 2018, 11, 151. [Google Scholar] [CrossRef]
- Žaldarienė, S. Chemical Composition of Different Genotypes of Organic Jerusalem Artichoke (Helianthus tuberosus L.) along the Ontogenesis Cycle. Doctoral Thesis, Aleksandras Stulginskis University, Akademija, Lithuania, 2017; p. 178. [Google Scholar]
- Danilčenko, H.; Jarienė, E.; Slepetiene, A.; Sawicka, B.; Zaldariene, S. The distribution of bioactive compounds in the tubers of organically grown Jerusalem artichoke (Helianthus tuberosus L.) during the growing period. Acta Sci. Pol. Hortorum Cultus 2017, 16, 97–107. [Google Scholar] [CrossRef] [Green Version]
- Kays, S.J.; Kultur, F. Genetic Variation in Jerusalem Artichoke (Helianthus tuberosus L.) Flowering Date and Duration. HortScience 2005, 40, 1675–1678. [Google Scholar] [CrossRef] [Green Version]
- Kays, S.J.; Nottingham, S.F. Biology and Chemistry of Jerusalem Artichoke Helianthus tuberosus L.; CRC Press, Taylor and Francis Group: Boca Raton, FL, USA; Abingdon, UK; Oxford, UK; New York, NY, USA, 2008; p. 478. ISBN 10-1-4200-4495-8. [Google Scholar]
- Abashkin, O.; Bojko, P.; Podobedov, V.I.; Masuk, A.; Aleksyutina, O.A.; Abrosimov, D.V.; Zeyruk, V.N. Development of callus implants potatoes and artichoke. In Proceedings of the International Conference on Jerusalem Artichoke, Moskva, Russia, 24–25 November 2011. (In Russian). [Google Scholar]
- WRB. World reference database for soil resources. In World Soil Resources Reports; FAO: Rome, Italy, 2014; Volume 106, p. 192. [Google Scholar]
- Gacek, E. List of Cultivars; COBORU Publishing House: Słupia Wielka, Poland, 1998; p. 27. (In Polish) [Google Scholar]
- Góral, S. Morphological variability and yielding of selected clones of Jerusalem artichoke—Jerusalem artichoke (Helianthus tuberosus L.). Hodowla Roślin Nasiennictwo 1998, 2, 6–10. (In Polish) [Google Scholar]
- Piskier, T. The energy potential of Jerusalem artichoke. Probl. Agric. Eng. 2009, 1, 133–136. (In Polish) [Google Scholar]
- Rząsa, S.; Owczarzak, W. Methods for the granulometric analysis of soil for science and practice. Pol. J. Soil Sci. 2013, 46, 1. [Google Scholar]
- Warzyński, H.; Sosnowska, A.; Harasimiuk, A. Effect of variable content of organic matter and carbonates on results of determination of granulometric composition by means of Casagrande’s aerometric method in modification by Prószyński. Soil Sci. Annu. 2018, 69, 39–48. [Google Scholar] [CrossRef]
- ISO 10694: Soil Quality—Determination of Organic and Total Carbon after Dry Combustion (Elemental Analysis). Publishes in Switzerland, Technical Committee: ISO/TC 190/SC 3 Chemical Characterization of Soils. Edition: 1. 1995, p. 7. Available online: https://www.iso.org/standard/18782.html (accessed on 4 May 2021).
- ISO 2859-10: Sampling Plans Indexed by Acceptable Quality Level. ISO Copyright Web www.iso.org. Published in Switzerland. 2007. Available online: https://www.sis.se/api/document/preview/907598/ (accessed on 11 May 2021).
- LST ISO 6557-2: Fruits, Vegetables and Their Products. Determination of Ascorbic acid Content. 2 Part. Conventional Methods (ISO 6557-2: 1984 [E]); Technical Committee: ISO/TC 34/SC 3 Fruit and Vegetables and Their Derivatives ICS: 67.080.01 Fruit, Vegetables and Products There of in General. Published in Lithuania. 2000. Available online: https://www.iso.org/standard/12957.html (accessed on 11 May 2021).
- AOAC. Official Methods of Analysis of AOAC International, 18th ed.; Association of Analytical Communities: Gaithersburg, MD, USA, 2005. [Google Scholar]
- Naumann, C.; Bassler, R.; Seibold, R.; Barth, C. Methodenbuch–VDLUFA. In Band III. Die chemische Untersuchung von Futtermitteln; VDLUFA–Verlag: Darmstadt, Germany, 1997. [Google Scholar]
- AOAC. Official Methods of Analysis of AOAC International, 16th ed.; Association of Analytical Communities: Washington, DC, USA, 1995. [Google Scholar]
- Mariotti, F.; Tome, D.; Mirand, P.P. Converting nitrogen into protein-beyond 6.25 and jones’ factors. Crit. Rev. Food Sci. Nutr. 2008, 48, 177–184. [Google Scholar] [CrossRef] [PubMed]
- Saengkanuk, A.; Nuchadomrong, S.; Jogloy, S.; Patanothai, A.; Srijaranai, S. A simplified spectrophotometric method for the determination of inulin in Jerusalem artichoke (Helianthus tuberosus L.) tubers. Eur. Food Res. Technol. 2011, 233, 609–616. [Google Scholar] [CrossRef]
- Simpson, R.J.; Neuberger, M.R.; Lin, T.Y. Complete amino acid analysis of proteins from a single hydrolysate. J. Biol. Chem. 1976, 251, 1936–1940. [Google Scholar] [CrossRef]
- Spackman, D.H.; Stein, W.H.; Moore, S. Automatic recording apparatus for use in chromatography amino acid. Anal. Chem. 1958, 30, 1190–1206. [Google Scholar] [CrossRef]
- LST EN 15510:2017. Feed: Sampling and Analysis Methods—Determination of Calcium, Sodium, Phosphorus, Magnesium, Potassium, iron, Zinc, Copper, Manganese, Cobalt, Molybdenum and Lead Using ICP-AES; Polish Committee for Standardization (PCS): Warsaw, Poland, 2017; p. 31. [Google Scholar]
- ISO 2173:2003. Specifies a Refractometric Method for the Determination of the Soluble Solids in Fruit and Vegetable Products. 2017. Available online: https://www.iso.org/obp/ui/#iso:std:iso:2173:ed-2:v1:en (accessed on 11 May 2021).
- ISO 6557-2:1984. Fruits, Vegetables And derived Products—Determination of Ascorbic Acid Content—Part 2: Routine Methods. This Standard Was Last Reviewed and Confirmed in 2017. Therefore, This Version Remains Current. Available online: https://www.iso.org/obp/ui/#iso:std:iso:6557:-2:ed-1:v1:en (accessed on 11 May 2021).
- Crossa, J.; Franco, J. Statistical methods for classifying genotypes. Euphytica 2004, 153, 19–37. [Google Scholar] [CrossRef]
- SAS Institute Inc. SAS/STAT®9.2 User’s Guide; SAS Institute Inc.: Cary, NC, USA, 2008. [Google Scholar]
- Taparauskienė, L.; Lukševičiūtė, V. Drought Occurrence under Lithuanian Climatic Conditions. In Proceedings of the 7th International Scientific Conference Rural Development 2015, Kaunas, Lithuania, 19–20 November 2015; pp. 1–4. [Google Scholar] [CrossRef]
- Chojnacka-Ożga, L.; Lorenc, H. Contemporary Problems of the Polish Climate; Chojnackiej-Ożga, L., Lorenz, H., Eds.; Institute of Meteorology and Water Management-National Research Institute (IMWM-PIB): Warszawa, Poland, 2019; p. 260. ISBN 978-83-64979-33-0. [Google Scholar]
- Sawicka, B.; Kalembasa, D. Fluctuations of selected microelements in Helianthus tuberosus L. tubers due to diverse nitrogen nutrition. Adv. Food Sci. 2011, 33, 166–173. [Google Scholar]
- Carputo, D.; Alioto, D.; Aversano, R.; Garramone, R.; Miraglia, V.; Villano1i, C.; Frusciante, L. Genetic diversity among potato species as revealed by phenotypic resistances and SSR markers. Plant Genet. Resour. 2013, 11, 131–139. [Google Scholar] [CrossRef] [Green Version]
- Bhandari, H.R.; Bhanu, A.N.; Srivastava, K.; Singh, M.N.; Shreya, I. Assessment of Genetic Diversity in Crop Plants—An Overview. Adv. Plants Agric. Res. 2017, 7, 00255. [Google Scholar] [CrossRef]
- Arvanitoyannis, I.S.; Mavromatis, A.G.; Vaitsi, O.; Korkovelos, A.; Golia, E. Effect of genotype and geographical origin on potato properties (physical and sensory) for authenticity purposes. J. Agric. Sci. 2012, 4, 63–74. [Google Scholar] [CrossRef]
- Pszczółkowski, P.; Sawicka, B. Phenotypic variability of the yield and structure of mid-early potato cultivars. Acta Sci. Pol. Agric. 2017, 16, 147–161. [Google Scholar]
- Rymuza, K. Application of Multidimensional Statistical Methods for the Evaluation and Comparison of Table Potato Cultivars. Habilitation Dissertation, UPH Publishing House, Siedlce, Poland, 2015; p. 115. (In Polish). [Google Scholar]
- Balzarini, M.; Teich, I.; Bruno, C.; Peña, A. Making genetic biodiversity measurable: A review of statistical multivariate methods to study variability at gene level. Rev. Fac. Cienc. Agrar. 2011, 43, 261–275. [Google Scholar]
- Stefańczyk, E.; Śliwka, J. The influence of photoperiod on potato biology. Bull. Plant Breed. Acclim. Inst. 2013, 267, 58–67. [Google Scholar]
- Sawicka, B.; Michałek, W.; Sawicka, B.; Michałek, W. Photosynthetic activity of Helianthus tuberosus L. depending on a soil and mineral fertilization. Pol. J. Soil Sci. 2008, 41, 209–222. [Google Scholar]
- Živčák, M.; Olšovská, K.; Slamka, P.; Galambošová, J.; Rataj, V.; Shao, H.B.; Brestič, M. Application of chlorophyll fluorescence performance indices to assesses the withe phothosyntetic functions influenced by nitrogen deficiency. Plant Soil Environ. 2014, 60, 210–215. [Google Scholar] [CrossRef] [Green Version]
- Paungbut, D.; Jogloy, S.; Vorasoot, N.; Patanothai, A. Growth and Phenology of Jerusalem Artichoke (Helianthus tuberosus L.). Pak. J. Bot. 2015, 47, 2207–2214. [Google Scholar]
- Skiba, D. Variability of Yielding and Quality of Selected Features of Several Varieties of Helianthus tuberosus L. in Conditions of Differentiated Mineral Fertilization. Ph.D. Thesis, University of Life Sciences, Lublin, Poland, 2014; p. 224. (In Polish). [Google Scholar]
- Lakić, Ž.; Balalić, I.; Nožinić, M. Genetic variability for yield and yield components in Jerusalem artichoke (Helianthus tuberosus L.). Genetica 2018, 50, 45–57. [Google Scholar]
- Luis, G.; Rubio, C.; Gonzalez-Weller, D.; Gutierrez, A.J.; Revert, C.; Hardiss, A. Comparative study of the mineral composition of several varieties of potatoes (Solanum tuberosum L.) from different countries cultivated in Canary Islands (Spain). Int. J. Food Sci. Technol. 2011, 46, 774–780. [Google Scholar] [CrossRef]
- Ma, X.Y.; Zhang, L.H.; Shao, H.B.; Xu, G.; Zhang, F.; Ni, F.T.; Brestic, M. Jerusalem artichoke (Helianthus tuberosus), a medicinal salt-resistant plant has high adaptability and multiple-use values. J. Med. Plants Res. 2011, 5, 1272–1279. [Google Scholar]
- Madhavi, K.J.; Sujatha, M.; Raja Ram Reddy, D.; Rao, C. Biochemical characterization of resistance against Alternaria helianthi in cultivated and wild sunflowers. Helia 2005, 28, 13–24. [Google Scholar]
- Cieślik, E.; Gębusia, A.; Florkiewicz, A.; Mickowska, B. The content of protein and of amino acids in Jerusalem artichoke tubers (Helianthus tuberosus L.) of red variety Rote Zonenkugel. Acta Sci. Pol. Technol. Aliment. 2011, 10, 433–441. [Google Scholar]
- Cieślik, E.; Kopeć, A.; Pražnik, W. Healthy properties of Jerusalem artichoke flour (Helianthus tuberosus L.). Electron. J. Pol. Agric. Univ. Food Sci. Technol. 2005, 8, 2. Available online: http://ejpau.media.pl/volume8/issue2/art-37.html (accessed on 1 May 2021).
- Danilčenko, H.; Jarienė, E.; Gajewski, M.; Sawicka, B.; Kulaitien, J.; Cerniauskiene, J.; Aleknaviciene, P. Changes in amino acids content in tubers of Jerusalem artichoke (Helianthus tuberosus L.) Cultivars during storage. Acta Sci. Pol. Hortorum Cultus 2013, 12, 97–105. [Google Scholar]
- Sawicka, B.; Kalembasa, S. Fluctuation of Protein Nitrogen Level in Tubers of Helianthus tuberosus L. Caused by Varying Levels of Nitrogen Fertilisation. Ecol. Chem. Eng. A 2013, 20, 213–223. [Google Scholar]
- Rossini, F.; Provenzano, M.E.; Kuzmanović, L.; Ruggeri, R. Jerusalem Artichoke (Helianthus tuberosus L.): A Versatile and Sustainable Crop for Renewable Energy Production in Europe. Agronomy 2019, 9, 528. [Google Scholar] [CrossRef] [Green Version]
- Sawicka, B.; Kalembasa, D. Variability in macroelement content in tubers of Helianthus tuberosus L. at different nitrogen fertilization levels. Acta Sci. Pol. Agric. 2008, 7, 67–82. [Google Scholar]
- USDA. United States Department of Agriculture Agricultural Research Service Food Composition Databases. 2018. Available online: https://ndb.nal.usda.gov/ndb/ (accessed on 1 May 2021).
- Ahmed, M.S.; El-Sakhawy, F.S.; Soliman, S.N.; Abou-Hussein, D.M. Phytochemical and biological study of Helianthus tuberosus L. Egypt. J. Biomed. Sci. 2005, 18, 134–147. [Google Scholar]


| Year | Content of Assimilable Macronutrients (mg·100 g−1 Soil) | Humus Content (%) | pH (KCl) | Micronutrient Content (mg·1 kg−1 Soil) | ||||||
|---|---|---|---|---|---|---|---|---|---|---|
| P2O5 | K2O | Mg | Cu | Mn | Zn | Fe | B | |||
| Akademija | ||||||||||
| 2015 | 20.1 | 19.3 | 8.1 | 1.6 | 6.9 | 8.8 | 332.0 | 58.7 | 3876.0 | 7.8 |
| 2016 | 22.3 | 21.1 | 7.9 | 1.9 | 6.4 | 7.1 | 346.0 | 54.3 | 3697.0 | 6.7 |
| 2017 | 19.9 | 21.6 | 7.3 | 1.7 | 6.5 | 6.5 | 321.0 | 49.9 | 3801.0 | 7.1 |
| Average | 21.2 | 20.7 | 7.8 | 1.8 | - | 7.5 | 333.0 | 54.3 | 3791.0 | 7.2 |
| Parczew | ||||||||||
| 2015 | 20.1 | 13.1 | 7.8 | 0.9 | 5.9 | 7.51 | 318.0 | 40.1 | 3760 | 7.2 |
| 2016 | 18.9 | 10.9 | 7.0 | 1.1 | 5.8 | 4.92 | 337.0 | 56.7 | 3925 | 5.3 |
| 2017 | 24.0 | 11.8 | 6.3 | 1.0 | 6.6 | 8.99 | 166.0 | 41.1 | 3600 | 6.0 |
| Average | 21.0 | 11.9 | 7.03 | 1.0 | - | 7.02 | 274.0 | 46.0 | 3762 | 6.2 |
| Year | Temperature/Rainfall | Months | Average/Sum | ||||||||
|---|---|---|---|---|---|---|---|---|---|---|---|
| March | April | May | June | July | August | September | October | November | |||
| Akademija | |||||||||||
| 2015 | Temperature (°C) | 0.3 | 5.7 | 12.2 | 15.6 | 17.2 | 16.6 | 12.8 | 6.8 | 1.1 | 9.8 |
| Rainfall (mm) | 40.0 | 37.2 | 52.5 | 61.3 | 73.6 | 73.6 | 51.7 | 49.3 | 44.2 | 483.3 | |
| 2016 | Temperature (°C) | 0.3 | 6.7 | 12.6 | 15.6 | 17.6 | 17.1 | 12.2 | 7.1 | 1.9 | 10.1 |
| Rainfall (mm) | 41.3 | 38.1 | 47.2 | 66.7 | 83.0 | 73.2 | 53.8 | 54.8 | 48.2 | 506.3 | |
| 2017 | Temperature (°C) | 0.5 | 6.7 | 12.6 | 15.6 | 17.6 | 16.9 | 12.2 | 7.2 | 1.9 | 10.1 |
| Rainfall (mm) | 40.4 | 38.0 | 48.4 | 67.2 | 83.7 | 74.0 | 52.7 | 55.2 | 47.6 | 507.2 | |
| SCN (1974–2013) | Temperature (°C) | 1.0 | 7.4 | 13.0 | 16.3 | 18.0 | 17.2 | 12.6 | 7.6 | 2.6 | 10.6 |
| Rainfall (mm) | 28.0 | 39.0 | 60.7 | 65.9 | 82.0 | 70.7 | 53.7 | 40.1 | 38.2 | 478.3 | |
| Parczew | |||||||||||
| 2015 | Temperature (°C) | 5.2 | 6.9 | 13.5 | 17.6 | 17.2 | 18.7 | 12.2 | 7.7 | 1.7 | 11.2 |
| Rainfall (mm) | 31.4 | 15.8 | 98.2 | 61.6 | 118.1 | 50.8 | 49.1 | 40.4 | 60.2 | 525.2 | |
| 2016 | Temperature (°C) | 2.5 | 8.8 | 12.3 | 16.0 | 18.1 | 17.9 | 12.2 | 8.7 | 3.3 | 11.1 |
| Rainfall (mm) | 60.9 | 32.1 | 35.5 | 83.2 | 43.0 | 99.3 | 27.0 | 69.8 | 30.3 | 481.1 | |
| 2017 | Temperature (°C) | 0.9 | 8.6 | 12.6 | 14.8 | 18.4 | 16.9 | 13.8 | 5.4 | 3.9 | 10.6 |
| Rainfall (mm) | 47.4 | 38.0 | 42.0 | 107.4 | 83.8 | 87.5 | 28.3 | 101.0 | 75.3 | 610.7 | |
| SCN * (1951–2010) | Temperature (°C) | 0.5 | 6.7 | 12.6 | 15.6 | 17.6 | 16.9 | 12.2 | 7.2 | 1.9 | 10.1 |
| Rainfall (mm) | 40.4 | 38.0 | 48.4 | 67.2 | 83.7 | 74.0 | 52.7 | 55.2 | 47.6 | 507.2 | |
| Month | Years | |||||
|---|---|---|---|---|---|---|
| 2015 | 2016 | 2017 | 2015 | 2016 | 2017 | |
| Akademija | Parczew | |||||
| April | 2.2 | 1.9 | 1.9 | 0.8 | 1.2 | 1.5 |
| May | 1.4 | 1.2 | 1.2 | 2.3 | 0.9 | 1.1 |
| June | 1.3 | 1.4 | 1.4 | 1.2 | 1.7 | 2.4 |
| July | 1.4 | 1.5 | 1.5 | 2.2 | 0.8 | 1.5 |
| August | 1.5 | 1.4 | 1.5 | 0.9 | 1.8 | 1.7 |
| September | 1.3 | 1.5 | 1.4 | 1.3 | 0.7 | 0.7 |
| October | 2.3 | 2.5 | 2.5 | 1.7 | 1.8 | 3.4 |
| Average | 1.6 | 1.6 | 1.5 | 1.5 | 1.3 | 1.7 |
| Average 1974–2013 | 1.5 | 1.6 | ||||
| Features | Akademija | Parczew | Cultivars | |||||
|---|---|---|---|---|---|---|---|---|
| Albik | Rubik | Average | Albik | Rubik | Average | Albik | Rubik | |
| Dry mass (%) | 24.08 a* | 21.10 b | 22.59 a | 23.53 a | 21.52 b | 22.53 a | 23.81 a | 21.31 b |
| Soluble dry mass (%) | 22.18 a | 15.40 b | 18.79 a | 21.34 a | 16.60 b | 18.97 a | 21.76 a | 16.00 b |
| Inulin (FM) (%) | 17.71 b | 13.49 b | 15.60 b | 19.29 a | 18.15 a | 18.72 a | 18.50 a | 15.82 b |
| Crude fibre (%) | 3.70 a | 3.24 b | 3.47 b | 5.20 b | 6.03 a | 5.62 a | 4.45 b | 4.64 a |
| Crude fat (%) | 0.19 b | 0.24 a | 0.22 a | 0.17 b | 0.21 a | 0.19 b | 0.18 b | 0.22 a |
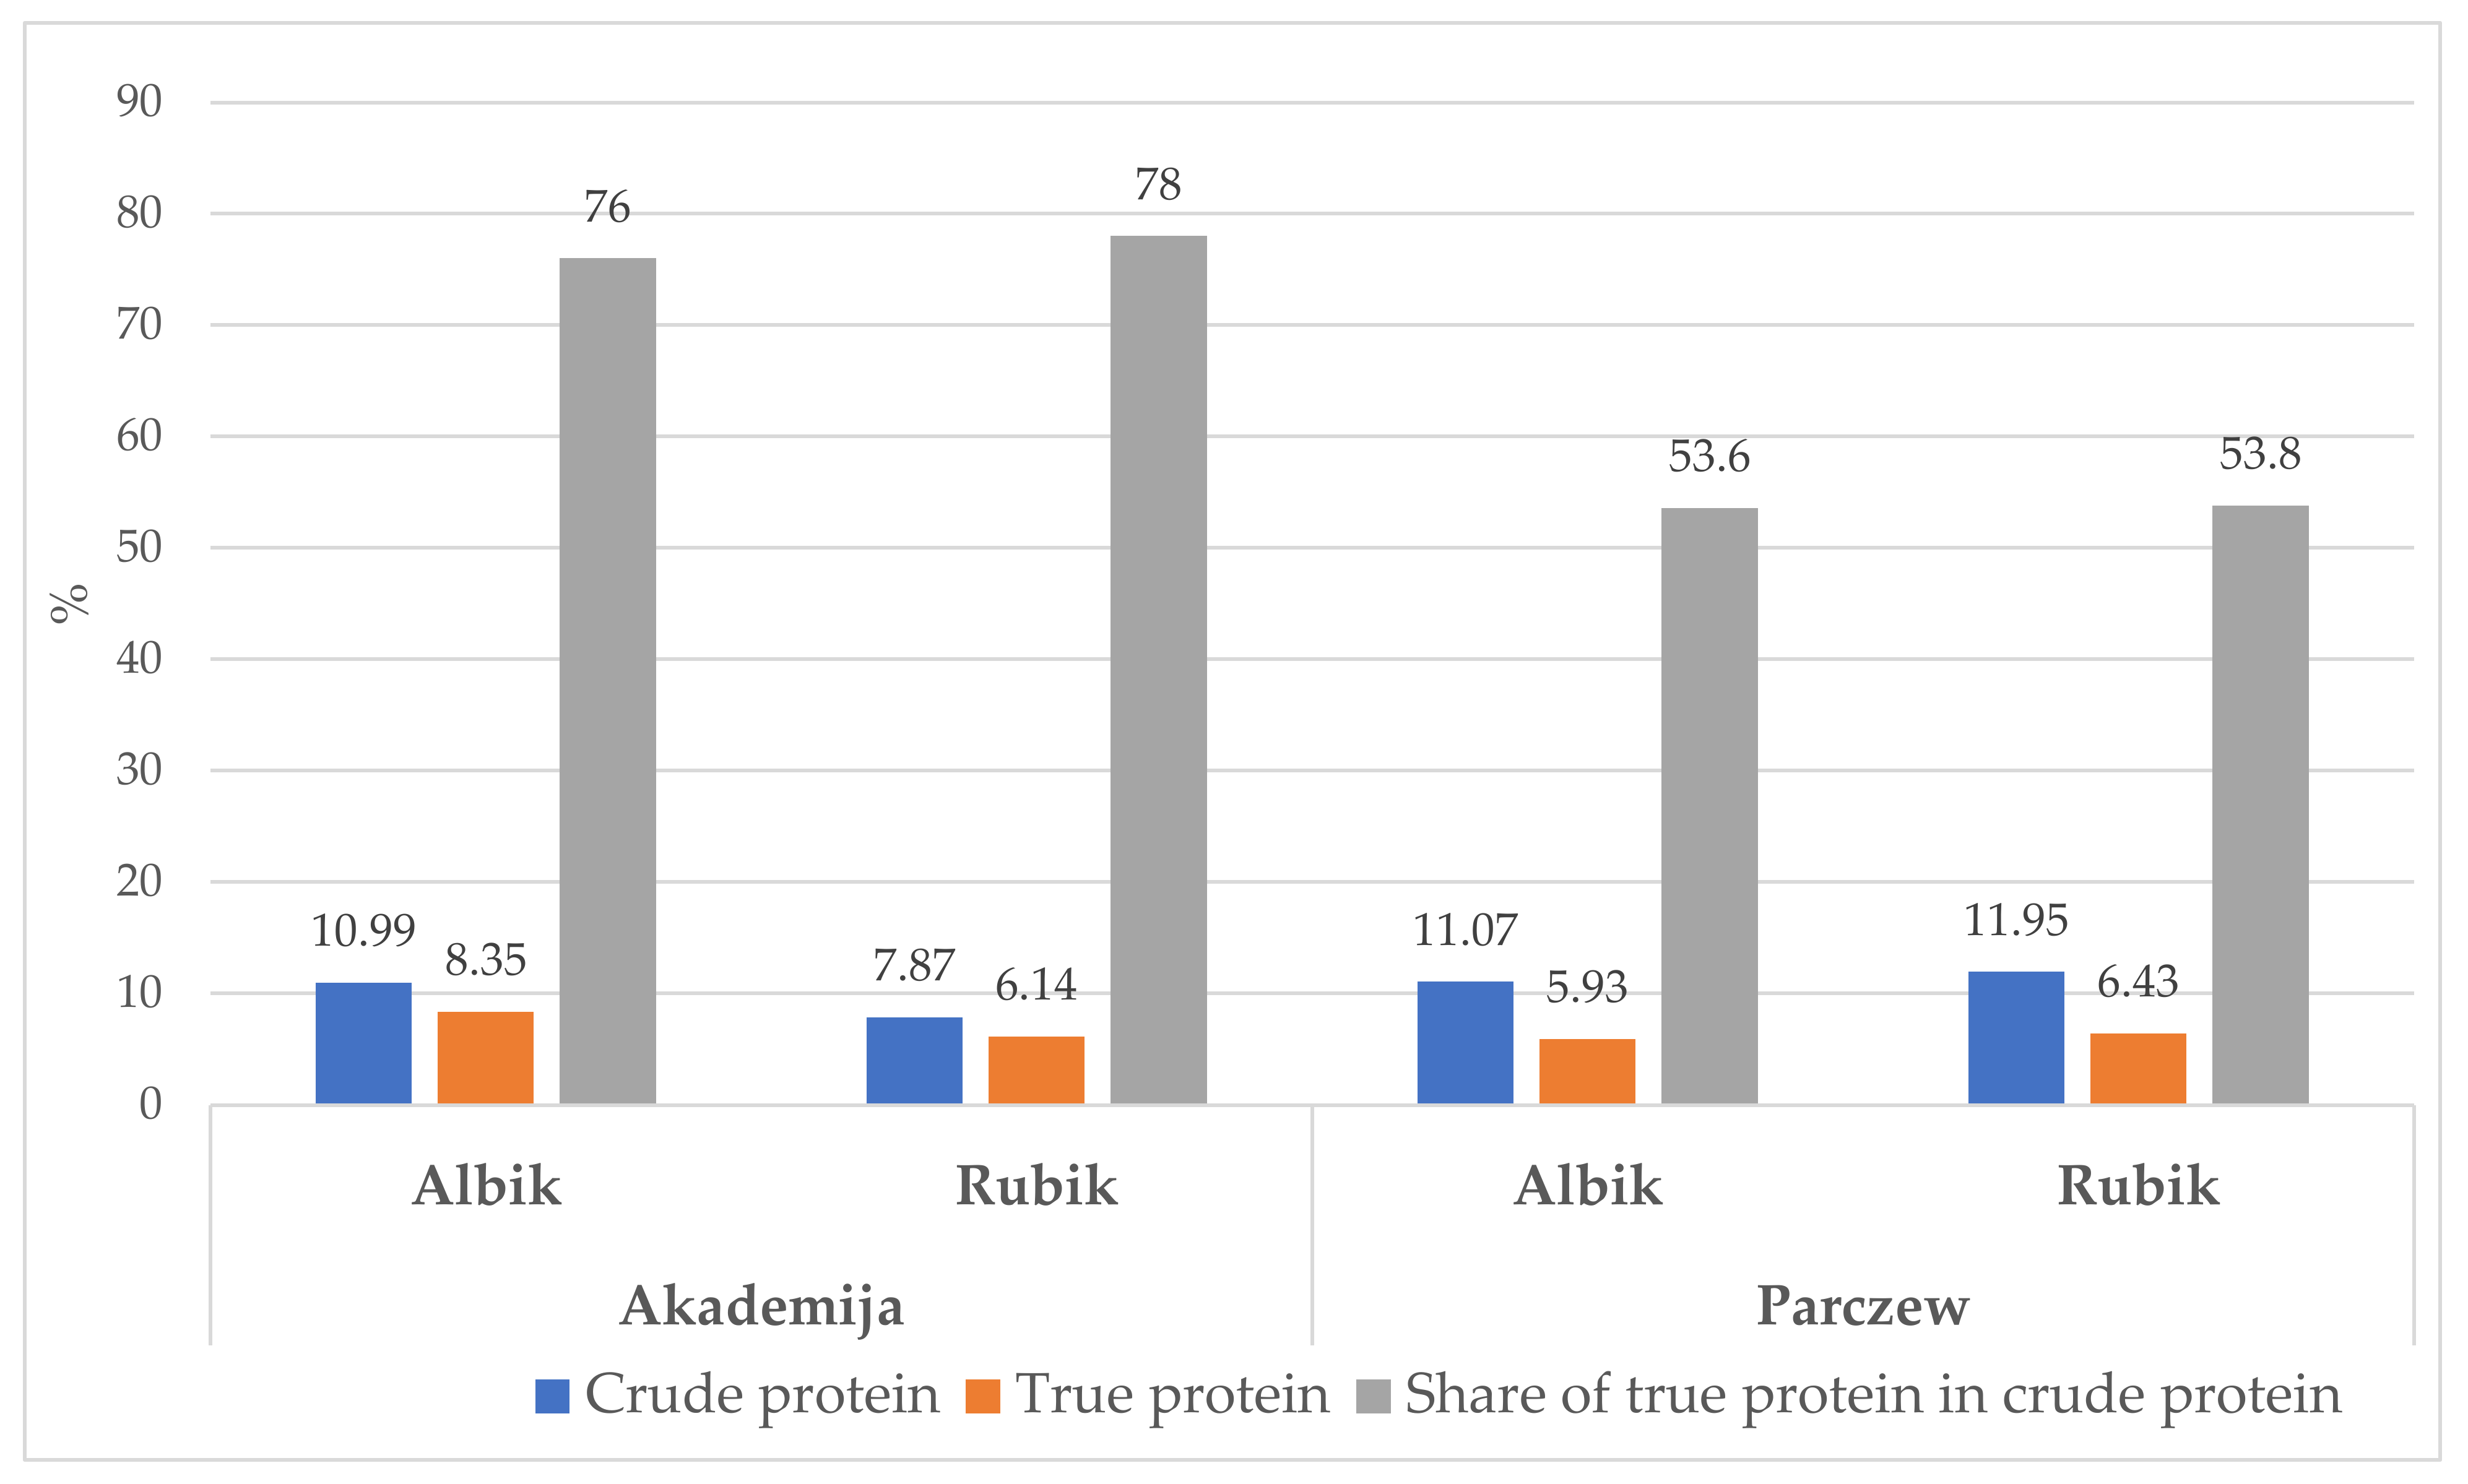
| Crude protein (%) | 10.99 a | 7.87 b | 9.43 b | 11.07 b | 11.95 a | 11.51 a | 11.03 a | 9.91 b |
| True protein (%) | 8.35 a | 6.14 b | 7.25 a | 5.93 b | 6.43 a | 6.18 b | 7.14 a | 6.29 b |
| Total amino acids (g·kg−1) | 51.95 a | 41.38 b | 46.67 b | 52.27 a | 44.69 b | 48.48 a | 52.11 a | 43.04 b |
| Endogenous amino acids (g·kg−1) | 29.92 a | 22.26 b | 26.09 b | 30.31 a | 25.44 b | 27.88 a | 30.12 a | 23.85 b |
| Exogenous amino acids (g·kg−1) | 22.03 a | 19.01 b | 20.52 a | 21.96 a | 19.25 b | 20.61 a | 22.00 a | 19.13 b |
| Ascorbic acid (FM) (mg·100 g−1) | 5.60 a | 5.20 b | 5.40 a | 5.81 a | 5.43 b | 5.62 a | 5.71 a | 5.32 b |
| N (g·kg−1) | 13.36 a | 11.60 b | 12.48 a | 11.07 a | 9.31 b | 10.19 b | 12.22 a | 10.46 b |
| P (g·kg−1) | 3.56 a | 3.27 b | 3.42 a | 3.42 a | 3.16 a | 3.29 b | 3.49 a | 3.22 b |
| K (g·kg−1) | 34.24 a | 29.38 b | 31.81 a | 29.30 a | 27.41 a | 28.36 b | 31.77 a | 28.40 b |
| Mg (g·kg−1) | 1.44 b | 1.56 a | 1.50 b | 1.64 b | 1.94 a | 1.79 a | 1.54 b | 1.75 a |
| Ca (g·kg−1) | 0.85 a | 0.86 a | 0.85 a | 0.63 b | 0.65 a | 0.64 b | 0.74 a | 0.75 a |
| Na (g·kg−1) | 0.23 a | 0.17 b | 0.20 a | 0.17 a | 0.15 b | 0.16 b | 0.20 a | 0.16 b |
| Features | Akademija | Parczew | Years | ||||||||
|---|---|---|---|---|---|---|---|---|---|---|---|
| 2015 | 2016 | 2017 | Average | 2015 | 2016 | 2017 | Average | 2015 | 2016 | 2017 | |
| Dry mass (%) | 24.18 a* | 22.23 a | 21.36 b | 22.59 a | 23.63 a | 22.56 a | 21.40 a | 22.53 a | 23.91 a | 21.38 b | 22.64 a |
| Soluble dry mass (%) | 22.37 a | 15.60 b | 15.20 b | 18.79 a | 21.31 a | 19.00 a | 16.59 b | 18.97 a | 21.84 a | 15.90c | 18.87 b |
| Inulin (FM) (%) | 16.90 a | 15.45 a | 14.45 b | 15.60 b | 19.34 a | 18.65 a | 18.18 a | 18.72 a | 18.12 a | 16.32 b | 17.22 a |
| Crude fibre (%) | 3.59 a | 3.48 a | 3.34 b | 3.47 b | 5.41 a | 5.54 a | 5.92 a | 5.62 a | 4.50 b | 4.63 a | 4.57 a |
| Crude fat (%) | 0.21 a | 0.25 a | 0.20 b | 0.22 a | 0.16 b | 0.21 a | 0.20 a | 0.19 b | 0.19 b | 0.20 a | 0.19 b |
| Crude protein (%) | 11.03 a | 9.11 b | 8.15 b | 9.43 b | 11.94 a | 11.55 a | 11.02 a | 11.50 a | 11.49 a | 9.59c | 10.54 b |
| True protein (%) | 8.06 a | 7.24 b | 6.46 b | 7.25 a | 6.34 a | 6.05 a | 6.16 a | 6.18 b | 7.20 a | 6.31 b | 6.76 b |
| Total amino acids (g·kg−1) | 51.99 | 46.60 | 41.43 | 46.67 a | 52.01 a | 48.18 a | 45.26 b | 48.48 a | 52.00 a | 43.35 b | 47.67 b |
| Endogenous amino acids (g·kg−1) | 28.57 a | 25.24 a | 24.45 b | 26.09 b | 31.23 a | 26.87 b | 25.53 b | 27.88 a | 29.90 a | 24.99c | 27.45 b |
| Exogenous amino acids (g·kg−1) | 22.01 a | 20.56 a | 18.98 b | 20.52 a | 21.43 a | 20.90 a | 19.51 a | 20.61 a | 21.72 a | 19.25 b | 20.48 a |
| Ascorbic acid (FM) (mg·100 g−1) | 5.56 a | 5.29 a | 5.34 b | 5.40 a | 5.91 a | 5.56 a | 5.39 a | 5.62 a | 5.74 a | 5.37 b | 5.55 a |
| N (g·kg−1) | 13.20 a | 12.34 a | 11.89 b | 12.48 a | 11.09 a | 10.40 a | 9.08 a | 10.19 b | 12.15 a | 10.49 b | 11.32 a |
| P (g·kg−1) | 3.44 a | 3.60 a | 3.23 a | 3.42 a | 3.51 a | 3.21 a | 3.16 a | 3.29 a | 3.48 a | 3.20 b | 3.34 a |
| K (g·kg−1) | 33.86 a | 31.65 a | 29.91 b | 31.81 a | 29.58 a | 28.40 a | 27.10 a | 28.36 b | 31.72 a | 28.51 b | 30.11 a |
| Mg (g·kg−1) | 1.39 b | 1.59 a | 1.51 a | 1.50 a | 1.61 b | 1.91 a | 1.85 a | 1.79 a | 1.50 b | 1.68 a | 1.59 a |
| Ca (g·kg−1) | 0.87 a | 0.82 a | 0.86 a | 0.85 a | 0.61 a | 0.65 a | 0.67 a | 0.64 b | 0.74 b | 0.76 a | 0.75 a |
| Na (g·kg−1) | 0.21 a | 0.22 a | 0.16 b | 0.20 a | 0.18 a | 0.17 a | 0.14 b | 0.16 a | 0.20 a | 0.15 b | 0.17 b |
| Specification | x1 | x2 | x3 | x4 | x5 | x6 | x7 | x8 | x9 | x10 | x11 | x12 | x13 | x14 | x15 | x16 | x17 |
|---|---|---|---|---|---|---|---|---|---|---|---|---|---|---|---|---|---|
| Mean | 21.35 | 18.88 | 17.16 | 4.54 | 0.20 | 10.45 | 6.71 | 47.57 | 26.98 | 20.56 | 5.51 | 11.34 | 3.35 | 30.08 | 1.65 | 0.75 | 0.17 |
| Median | 22.06 | 18.88 | 17.93 | 4.45 | 0.20 | 10.98 | 6.31 | 47.57 | 26.98 | 20.56 | 5.52 | 11.34 | 3.35 | 29.34 | 1.60 | 0.75 | 0.17 |
| SD * | 3.03 | 2.50 | 2.10 | 1.16 | 0.02 | 1.46 | 0.88 | 4.03 | 2.89 | 1.22 | 0.20 | 1.41 | 0.13 | 2.39 | 0.18 | 0.11 | 0.02 |
| Kurtosis | 1.30 | −1.36 | −0.52 | −2.07 | −0.52 | −0.45 | 0.07 | −1.18 | −0.87 | −1.62 | −0.69 | −1.09 | −0.82 | −0.50 | −0.95 | −2.42 | 4.25 |
| Slant | −1.49 | −0.04 | −0.92 | 0.11 | 0.48 | −0.93 | 1.18 | −0.25 | −0.42 | −0.01 | −0.07 | 0.00 | 0.14 | 0.83 | 0.61 | −0.01 | 2.07 |
| Range | 8.79 | 6.78 | 5.80 | 2.79 | 0.07 | 4.08 | 2.42 | 10.89 | 8.05 | 3.02 | 0.61 | 4.05 | 0.40 | 6.83 | 0.50 | 0.23 | 0.08 |
| Minimum | 15.29 | 15.40 | 13.49 | 3.24 | 0.17 | 7.87 | 5.93 | 41.38 | 22.26 | 19.01 | 5.20 | 9.31 | 3.16 | 27.41 | 1.44 | 0.63 | 0.15 |
| Maximum | 24.08 | 22.18 | 19.29 | 6.03 | 0.24 | 11.95 | 8.35 | 52.27 | 30.31 | 22.03 | 5.81 | 13.36 | 3.56 | 34.24 | 1.94 | 0.86 | 0.23 |
| V ** (%) | 14.20 | 13.22 | 12.21 | 25.45 | 11.03 | 14.00 | 13.12 | 8.48 | 10.72 | 5.95 | 3.67 | 12.46 | 4.01 | 7.96 | 10.95 | 14.92 | 12.99 |
| Specification | Significance of Effect | Percentage Contribution of the Variance to the Total Variance | ||||||||||||
|---|---|---|---|---|---|---|---|---|---|---|---|---|---|---|
| Years | Cultivars | Locality | Years × Cultivars | Years × Locality | Locality × Cultivars | Years × Cultivars × Locality | Years | Cultivars | locality | Years × Cultivars | Years ×x Locality | Locality × Cultivars | Years × Cultivars × Locality | |
| Dry mass (%) | ** | ** | ns | ns | ** | ** | ns | 54.9 | 13.6 | 1.1 | 4.4 | 13.7 | 9.1 | 3.2 |
| Soluble dry mass (%) | ** | ** | ns | ** | ** | * | * | 36.9 | 17.7 | 2.1 | 15.7 | 11.5 | 8.8 | 7.3 |
| Inulin (FM) (%) | ** | ** | ** | ** | ** | * | ns | 29.6 | 9.2 | 15.2 | 29.0 | 9.9 | 7.1 | 1.1 |
| Crude fibre (%) | ** | ** | ns | ns | ** | ns | * | 51.2 | 12.3 | 0.5 | 14.8 | 12.3 | 1.2 | 8.1 |
| Crude fat (%) | ** | ** | ** | ** | ** | ns | * | 54.2 | 6.4 | 7.1 | 14.2 | 9.2 | 4.1 | 6.1 |
| Crude protein (%) | ** | ns | ns | ** | ** | ** | ns | 55.1 | 0.9 | 2.2 | 22.7 | 11.4 | 6.8 | 2.0 |
| True protein (%) | ** | ** | * | ** | ns | ns | * | 18.5 | 29.5 | 5.8 | 31.5 | 1.1 | 3.5 | 12.1 |
| Total amino acids (g·kg−1) | ** | ** | * | ** | ** | ** | ns | 31.1 | 13.2 | 2.1 | 25.8 | 17.7 | 9.8 | 0.9 |
| Endogenous amino acids (g·kg−1) | ** | ** | * | ** | ** | ** | ns | 27.9 | 15.2 | 9.0 | 34.2 | 9.0 | 4.1 | 2.1 |
| Exogenous amino acids (g·kg−1) | ** | ** | ns | ** | ** | ** | ns | 34.6 | 19.1 | 1.0 | 27.2 | 11.1 | 6.5 | 0.9 |
| Ascorbic acid (FM) (mg·100 g−1) | ** | ** | ns | ** | ** | ** | * | 24.6 | 12.4 | 1.8 | 34.2 | 9.7 | 13.5 | 5.0 |
| N (g·kg−1) | ** | ** | ** | ns | ** | ** | * | 34.2 | 11.9 | 12.1 | 2.3 | 23.4 | 11.1 | 5.0 |
| P (g·kg−1) | ** | ** | ns | ** | ** | ** | * | 33.6 | 17.5 | 2.0 | 21.6 | 9.0 | 12.1 | 4.4 |
| K (g·kg−1) | ** | ** | ** | ** | ** | * | ns | 35.9 | 12.7 | 9.9 | 18.7 | 11.8 | 9.9 | 1.2 |
| Mg (g·kg−1) | ** | * | ns | ** | ** | ** | ** | 29.5 | 9.2 | 1.8 | 17.1 | 21.1 | 11.4 | 10.3 |
| Ca (g·kg−1) | ** | ns | ** | ** | ** | * | ns | 27.3 | 7.9 | 12.1 | 23.4 | 21.7 | 7.2 | 1.4 |
| Na (g·kg−1) | ** | ** | * | ** | ns | ** | ** | 23.5 | 21.1 | 8.8 | 11.2 | 1.7 | 23.2 | 12.1 |
| Average | 35.4 | 13.0 | 5.6 | 21.0 | 12.1 | 8.8 | 4.9 | |||||||
| y1 | x1 | x2 | x3 | x4 | x5 | x6 | x7 | x8 | x9 | x10 | x11 | x12 | x13 | x14 | x15 | x16 | x17 | |
|---|---|---|---|---|---|---|---|---|---|---|---|---|---|---|---|---|---|---|
| y1 | 1.00 | |||||||||||||||||
| x1 | −0.43 | 1.00 | ||||||||||||||||
| x2 | 0.04 | 0.34 | 1.00 | |||||||||||||||
| x3 | 0.78 | −0.12 | 0.62 | 1.00 | ||||||||||||||
| x4 | 0.97 | −0.42 | 0.01 | 0.79 | 1.00 | |||||||||||||
| x5 | −0.64 | 0.00 | −0.79 | −0.95 | −0.60 | 1.00 | ||||||||||||
| x6 | 0.76 | −0.18 | 0.43 | 0.94 | 0.85 | −0.81 | 1.00 | |||||||||||
| x7 | −0.63 | 0.46 | 0.50 | −0.06 | −0.48 | 0.00 | 0.02 | 1.00 | ||||||||||
| x8 | 0.23 | 0.25 | 0.98 | 0.76 | 0.20 | −0.90 | 0.57 | 0.35 | 1.00 | |||||||||
| x9 | 0.32 | 0.20 | 0.96 | 0.82 | 0.30 | −0.93 | 0.65 | 0.31 | 0.99 | 1.00 | ||||||||
| x10 | 0.04 | 0.34 | 0.99 | 0.59 | −0.02 | −0.78 | 0.37 | 0.43 | 0.97 | 0.94 | 1.00 | |||||||
| x11 | 0.57 | 0.05 | 0.83 | 0.90 | 0.50 | −0.99 | 0.70 | 0.00 | 0.93 | 0.95 | 0.84 | 1.00 | ||||||
| x12 | −0.85 | 0.55 | 0.49 | −0.37 | −0.86 | 0.14 | −0.48 | 0.75 | 0.31 | 0.22 | 0.50 | −0.04 | 1.00 | |||||
| x13 | −0.49 | 0.52 | 0.85 | 0.11 | −0.52 | −0.35 | −0.07 | 0.70 | 0.73 | 0.66 | 0.86 | 0.44 | 0.88 | 1.00 | ||||
| x14 | −0.75 | 0.55 | 0.61 | −0.18 | −0.71 | −0.01 | −0.24 | 0.90 | 0.44 | 0.37 | 0.59 | 0.07 | 0.96 | 0.90 | 1.00 | |||
| x15 | 0.84 | −0.52 | −0.42 | 0.45 | 0.90 | −0.20 | 0.61 | −0.60 | −0.25 | −0.14 | −0.45 | 0.07 | −0.98 | −0.83 | −0.88 | 1.00 | ||
| x16 | −1.00 | 0.42 | −0.06 | −0.78 | −0.95 | 0.65 | −0.74 | 0.65 | −0.25 | −0.34 | −0.06 | −0.59 | 0.83 | 0.46 | 0.75 | −0.82 | 1.00 | |
| x17 | −0.59 | 0.39 | 0.37 | −0.19 | −0.53 | 0.08 | −0.19 | 0.70 | 0.24 | 0.19 | 0.34 | −0.05 | 0.69 | 0.60 | 0.73 | −0.61 | 0.60 | 1.00 |
Publisher’s Note: MDPI stays neutral with regard to jurisdictional claims in published maps and institutional affiliations. |
© 2021 by the authors. Licensee MDPI, Basel, Switzerland. This article is an open access article distributed under the terms and conditions of the Creative Commons Attribution (CC BY) license (https://creativecommons.org/licenses/by/4.0/).
Share and Cite
Sawicka, B.; Danilčenko, H.; Jariene, E.; Skiba, D.; Rachoń, L.; Barbaś, P.; Pszczółkowski, P. Nutritional Value of Jerusalem Artichoke Tubers (Helianthus tuberosus L.) Grown in Organic System under Lithuanian and Polish Conditions. Agriculture 2021, 11, 440. https://doi.org/10.3390/agriculture11050440
Sawicka B, Danilčenko H, Jariene E, Skiba D, Rachoń L, Barbaś P, Pszczółkowski P. Nutritional Value of Jerusalem Artichoke Tubers (Helianthus tuberosus L.) Grown in Organic System under Lithuanian and Polish Conditions. Agriculture. 2021; 11(5):440. https://doi.org/10.3390/agriculture11050440
Chicago/Turabian StyleSawicka, Barbara, Honorata Danilčenko, Elvyra Jariene, Dominika Skiba, Leszek Rachoń, Piotr Barbaś, and Piotr Pszczółkowski. 2021. "Nutritional Value of Jerusalem Artichoke Tubers (Helianthus tuberosus L.) Grown in Organic System under Lithuanian and Polish Conditions" Agriculture 11, no. 5: 440. https://doi.org/10.3390/agriculture11050440
APA StyleSawicka, B., Danilčenko, H., Jariene, E., Skiba, D., Rachoń, L., Barbaś, P., & Pszczółkowski, P. (2021). Nutritional Value of Jerusalem Artichoke Tubers (Helianthus tuberosus L.) Grown in Organic System under Lithuanian and Polish Conditions. Agriculture, 11(5), 440. https://doi.org/10.3390/agriculture11050440