

An Empirical Investigation of the “Mezzogiorno Trap” in China’s Agricultural Economy: Insights from Data Envelopment Analysis (2015–2021)


Abstract
:1. Introduction
1.1. The “Mezzogiorno Trap” in Economic Development
1.2. Examples of “Mezzogiorno Trap” in Other Areas
1.3. How to Tell If the “Mezzogiorno Trap” Exists
- 1.
- Economic development gap: if a region lags significantly behind other regions or countries in its level of economic development, it may be at risk of the “Mezzogiorno Trap”.
- 2.
- Dependence on external aid or investment: if a region’s economic development heavily relies on external aid or investment, rather than on internal economic activities, then it might be susceptible to the “Mezzogiorno Trap”.
- 3.
- Internal economic activity level: if a region’s internal economic activities, such as industrial production and commercial activities, appear inactive or small-scale compared to the magnitude of external aid or investment, then it could potentially face the risk of the “Mezzogiorno Trap”.
- 4.
- Changes in external aid or investment: if there is a decrease or disappearance in external aid or investment in a region, and this leads to a significant downturn in the local economy, the region may have already fallen into the “Mezzogiorno Trap”.
- 5.
- Continuity of policy support: if a region’s economic development largely depends on policy support, which may change for various reasons (e.g., regime changes, shifts in economic policy), then it too could be at risk of the “Mezzogiorno Trap”.
1.4. Objectives and Contributions of This Paper
- 1.
- By studying the research process and findings, a more reasonable approach to assessing the “Mezzogiorno Trap” is summarized, which can be extended to further investigate regional disparities in a wider range of areas and regions.
- 2.
- By employing quantitative methods derived from operations research, management science, and economics, an assessment is conducted to determine the presence of the “Mezzogiorno Trap” in China’s agricultural economy.
- 3.
- Constructive policy proposals and adjustments are put forward to address the “Mezzogiorno Trap”. By studying the “Mezzogiorno Trap”, the achievements of regional economic disparity research from various countries worldwide can be introduced into the relevant policy research for rural development in China.
2. Literature Review
2.1. The Possible Existence of the “Mezzogiorno Trap” in China
2.2. A Review of Relevant Studies on China’s Agricultural Support Policies and Regional Differences
- 1.
- Agricultural subsidy policy: since 2004, the Chinese government has implemented direct agricultural subsidy policies, including grain planting subsidies and agricultural machinery purchase subsidies, aiming to enhance agricultural productivity and safeguard farmers’ interests.
- 2.
- Abolition of the agricultural tax: the agricultural tax was a levy on farmers’ income from planting grains and other agricultural products. In 2006, China completely abolished this tax, significantly reducing farmers’ burden, increasing their income, and stimulating the zeal for agricultural production [25].
- 3.
- Agricultural insurance system: to mitigate farmers’ losses due to natural disasters and other factors, the Chinese government introduced an agricultural insurance system, subsidizing part of the insurance costs for insured farmers.
- 4.
- New rural cooperative medical system: this policy, aimed at improving rural medical conditions, provides basic medical security for farmers through government subsidies and social fundraising [26].
- 5.
- Rural land system reform: the government relaxed restrictions on the transfer of rural land use rights, allowing farmers to gain income through leasing or transferring land, creating conditions for the modernization and scaling of agriculture.
- 6.
- Agricultural technological advancement policy: the government increased support for agricultural scientific research and promotion, to enhance agricultural productivity and yield, including the promotion of quality seeds and agricultural mechanization.
- 7.
- Rural infrastructure construction: this involves building rural roads, water supplies, and power supplies to improve rural living conditions and the production environment.
- 8.
- Rural poverty alleviation work: this includes offering low-interest loans, vocational training, rural labor transfer, and other poverty alleviation methods to decrease rural poverty.
2.3. Possible Problems with the Study of Regional Disparities in the Agricultural Economy
3. Materials and Methods
3.1. Data Sources
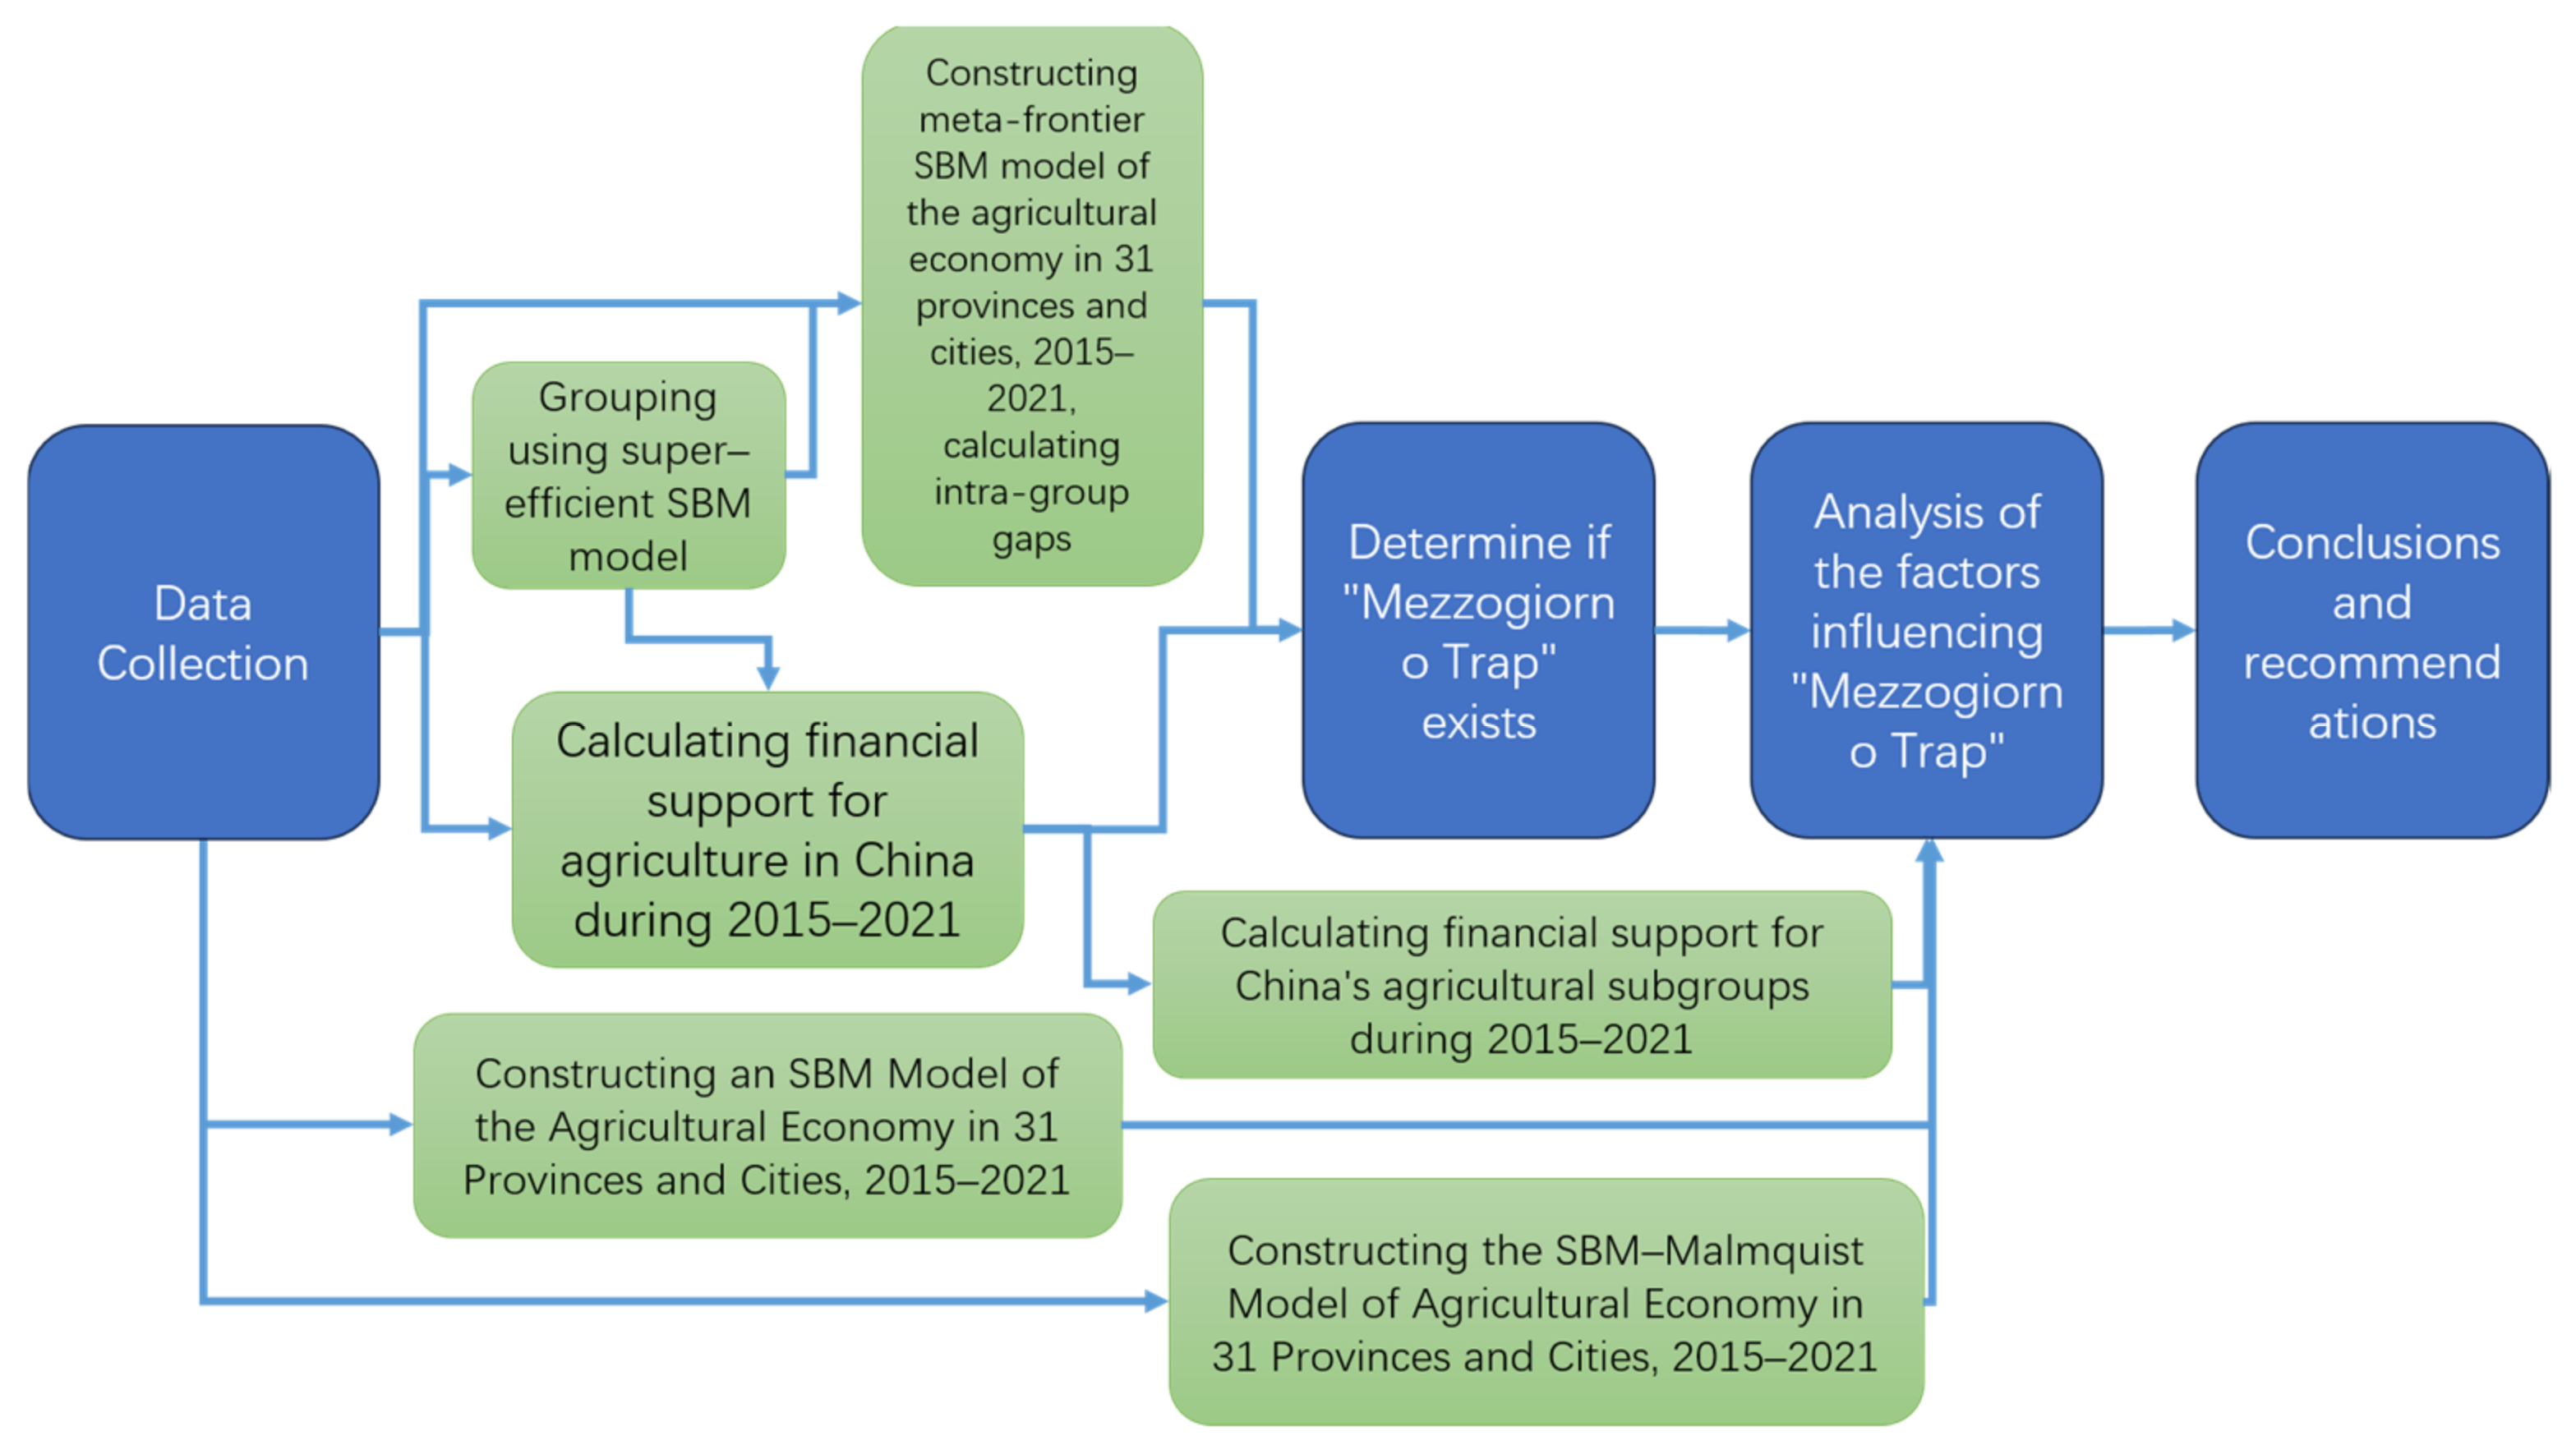
3.2. Research Process
- 1.
- Data collection.
- Grouping using the super-efficient SBM model.
- Constructing a meta-frontier SBM model of the agricultural economy in 31 provinces and cities, 2015–2021, calculating intra-group gaps.
- Calculating financial support for agriculture in China during 2015–2021.
- 2.
- Determine if the “Mezzogiorno Trap” exists.
- Calculating financial support for China’s agricultural subgroups during 2015–2021.
- Constructing an SBM Model of the Agricultural Economy in 31 Provinces and Cities, 2015–2021 We compute the intensity of financial support for agricultural groups in China from 2015 to 2021.
- Constructing the SBM-Malmquist Model of Agricultural Economy in 31 Provinces and Cities, 2015–2021.
- 3.
- Analysis of the factors influencing the “Mezzogiorno Trap”.
- 4.
- Conclusions and recommendations.
3.3. Research Methods
4. Results
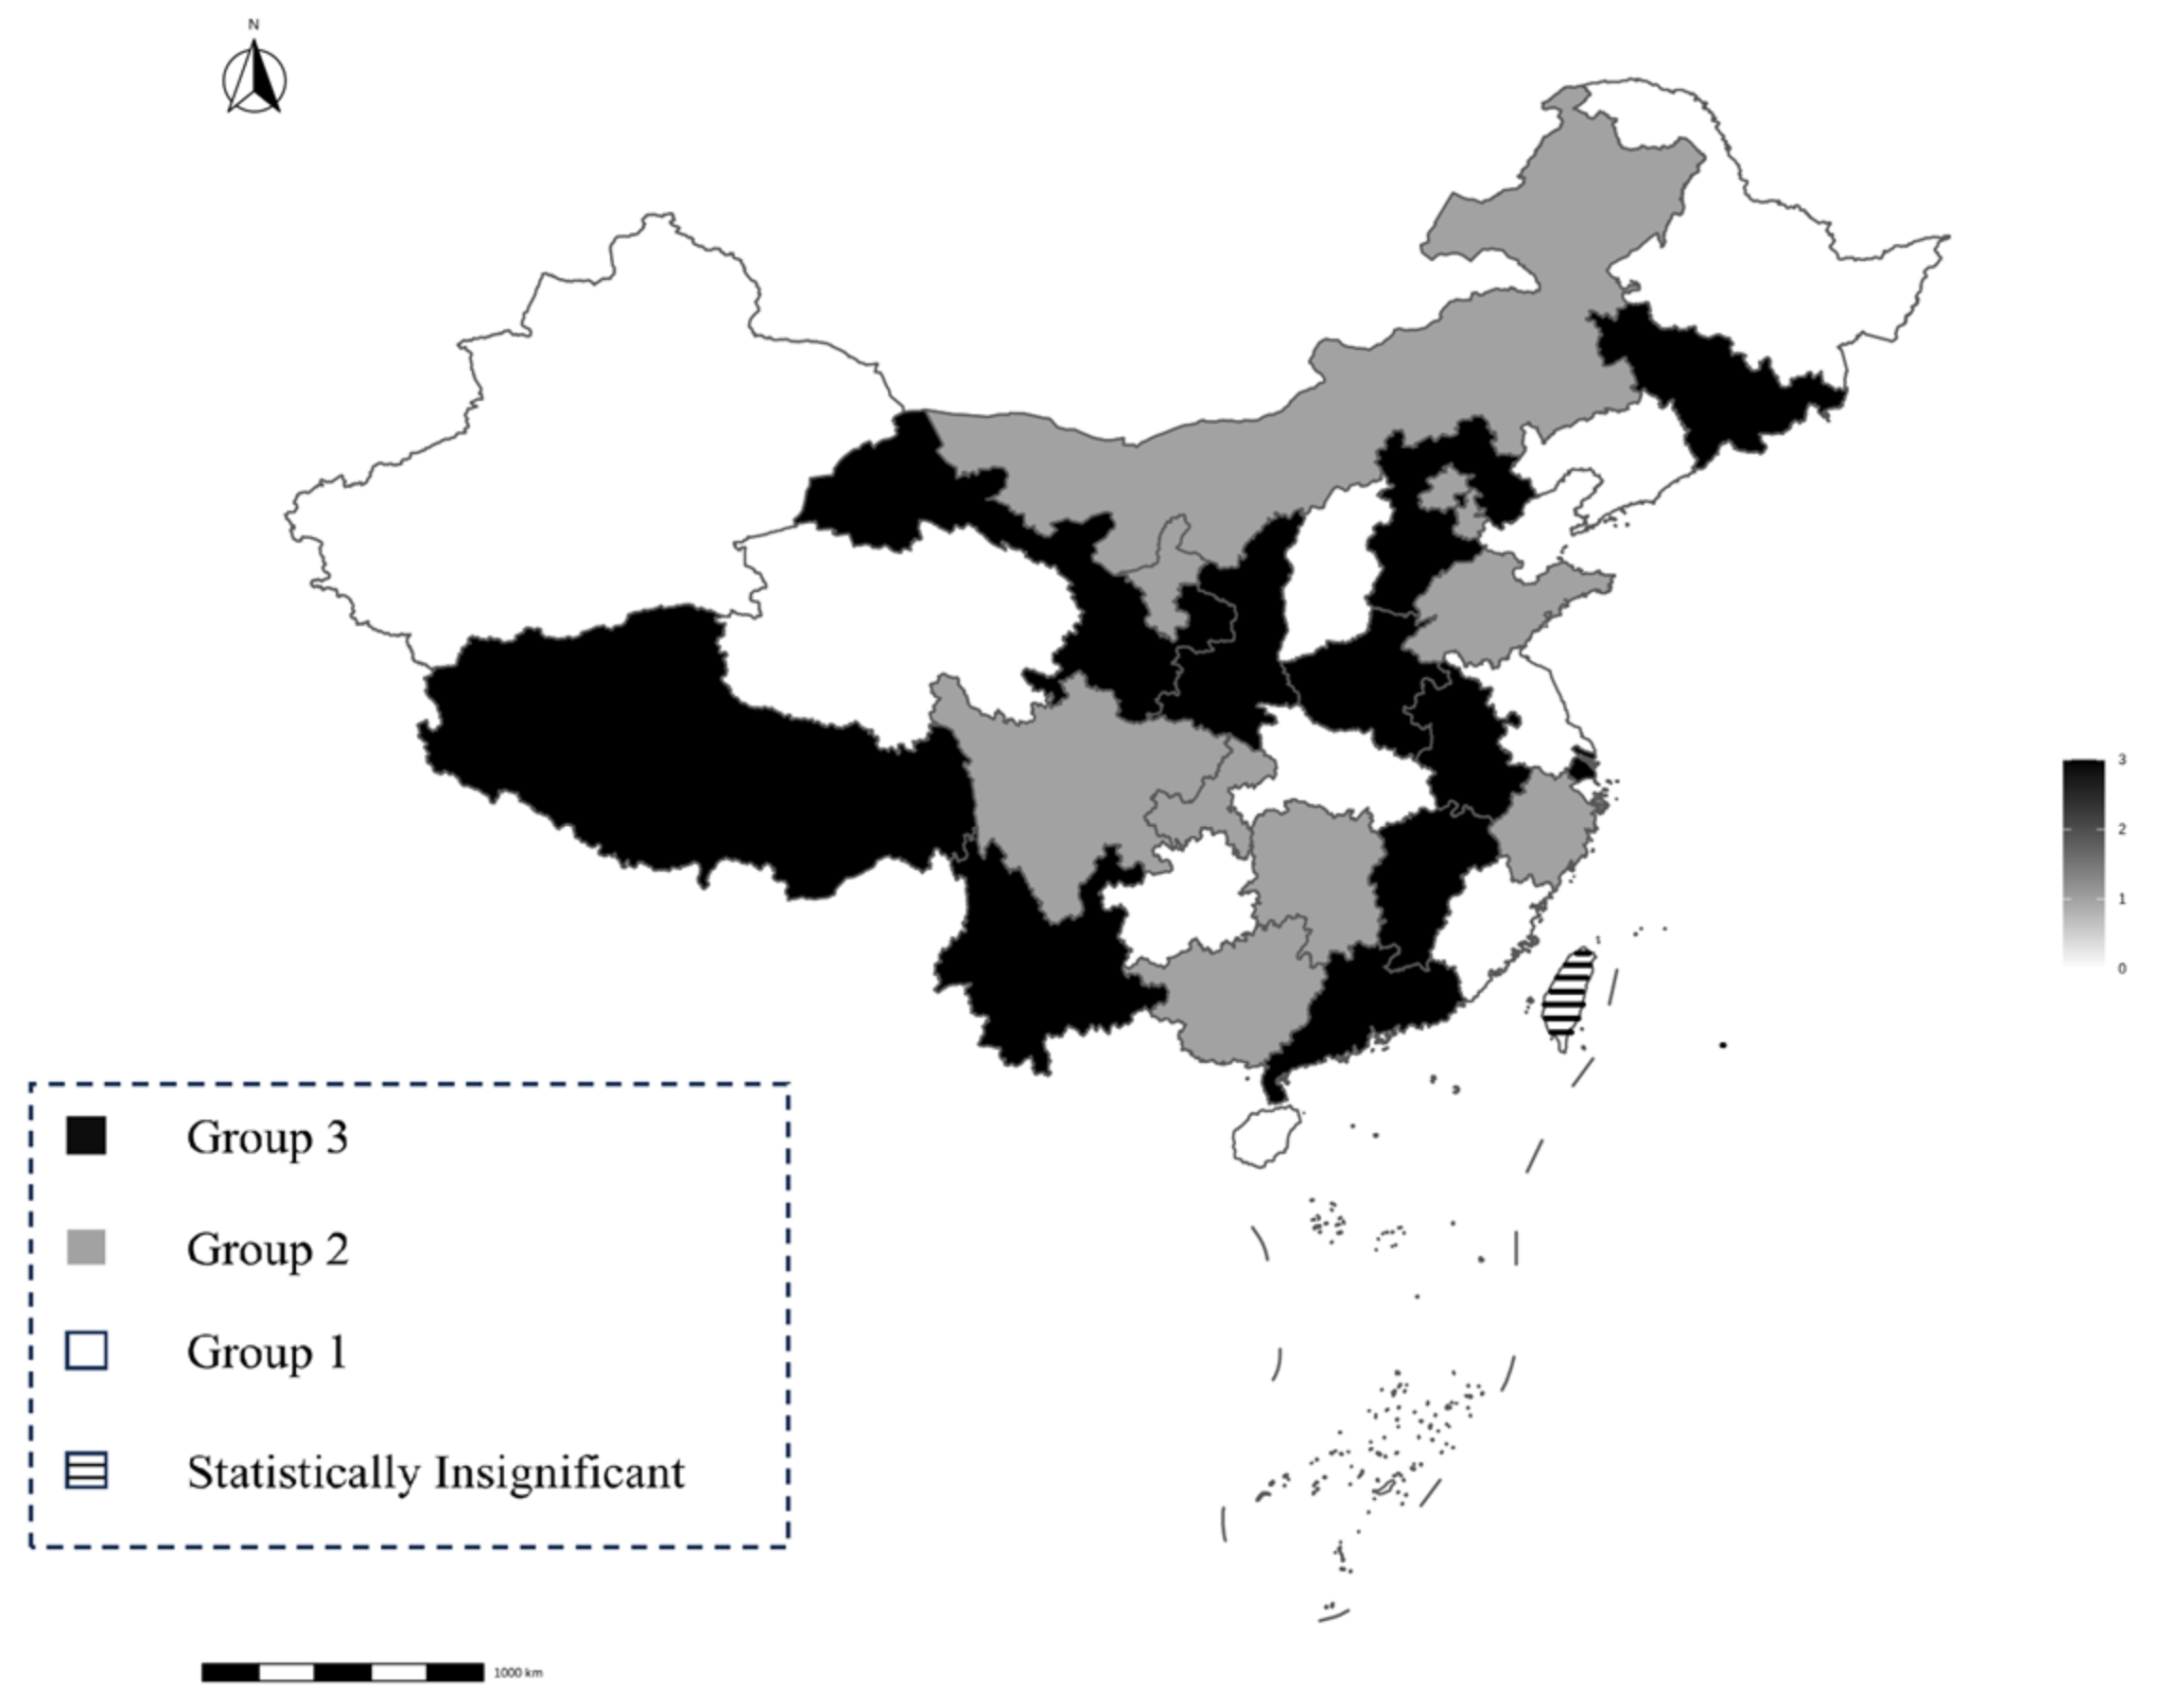
4.1. Constructing a Super-Efficient SBM Model of the Agricultural Economy in 31 Provinces and Cities in 2017 and Grouping Them According to Rankings
4.2. Constructing the Meta-Frontier SBM-DEA Efficiency Model for the Agricultural Economy of 31 Provinces and Cities in China from 2015 to 2021
4.3. Constructing the 2015–2021 SBM-Malmquist Index Model for Agricultural Economics across the 31 Provinces in China
5. Discussion
5.1. Surprising Grouping
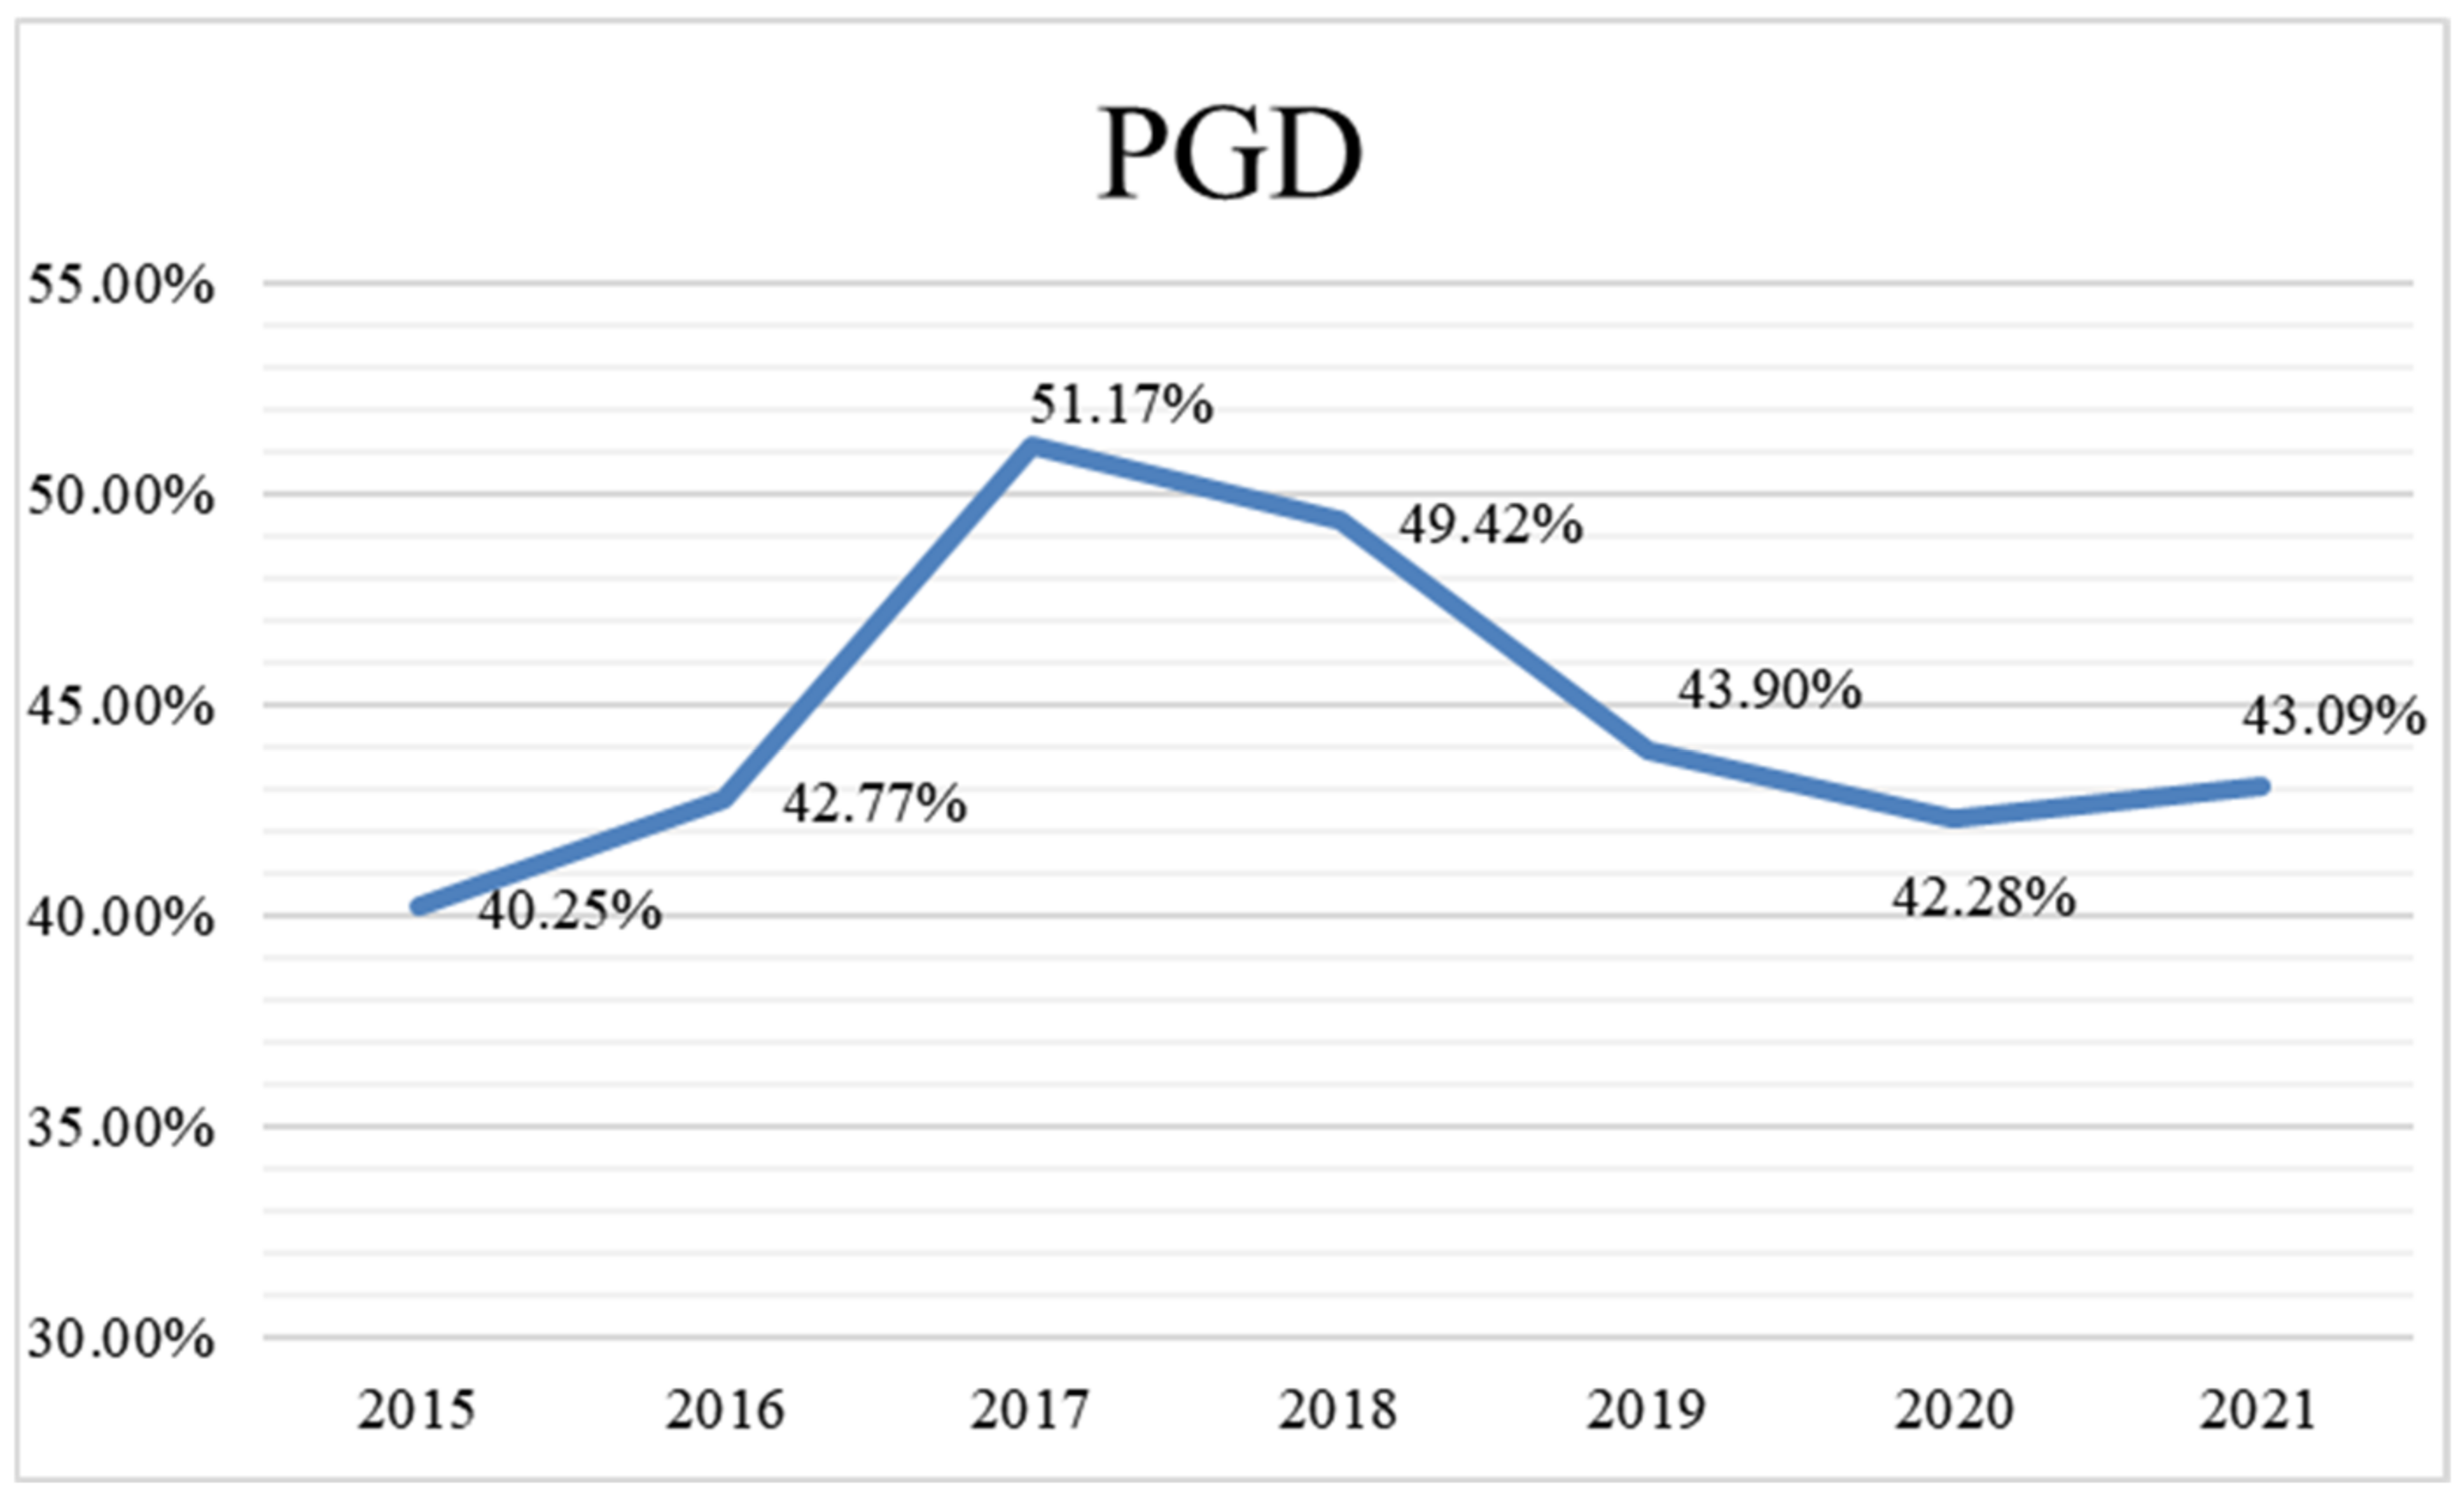
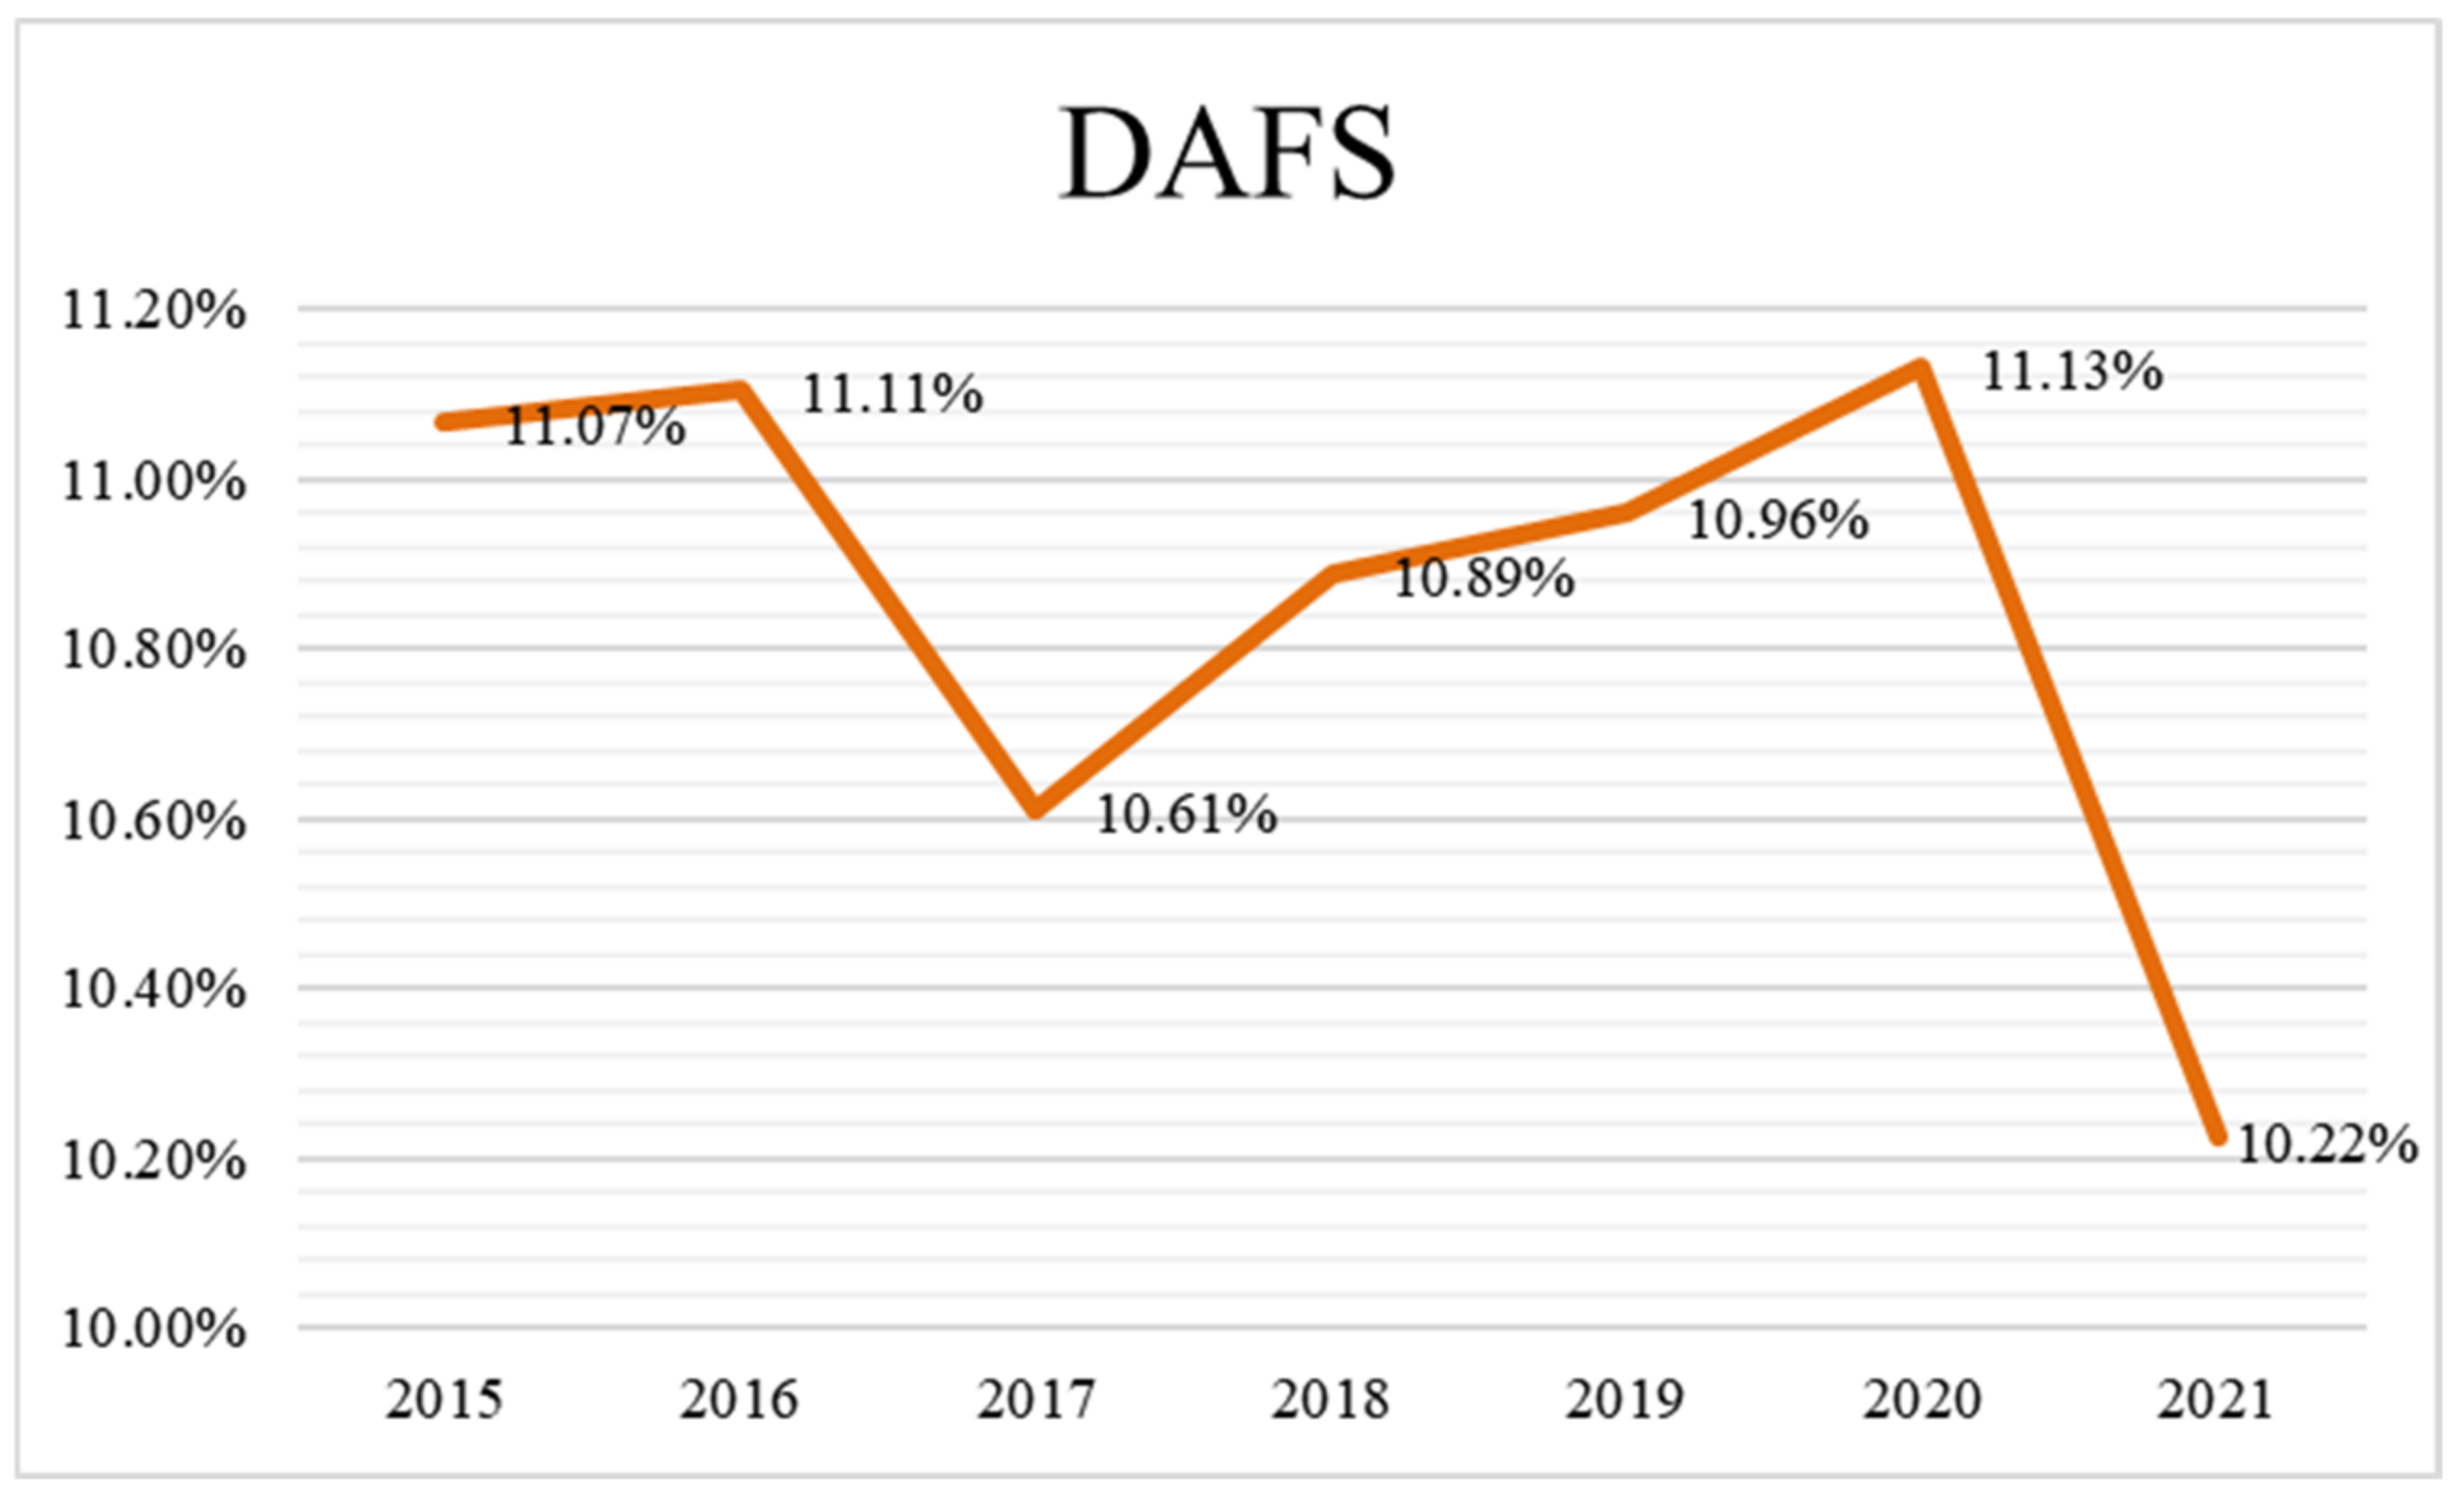
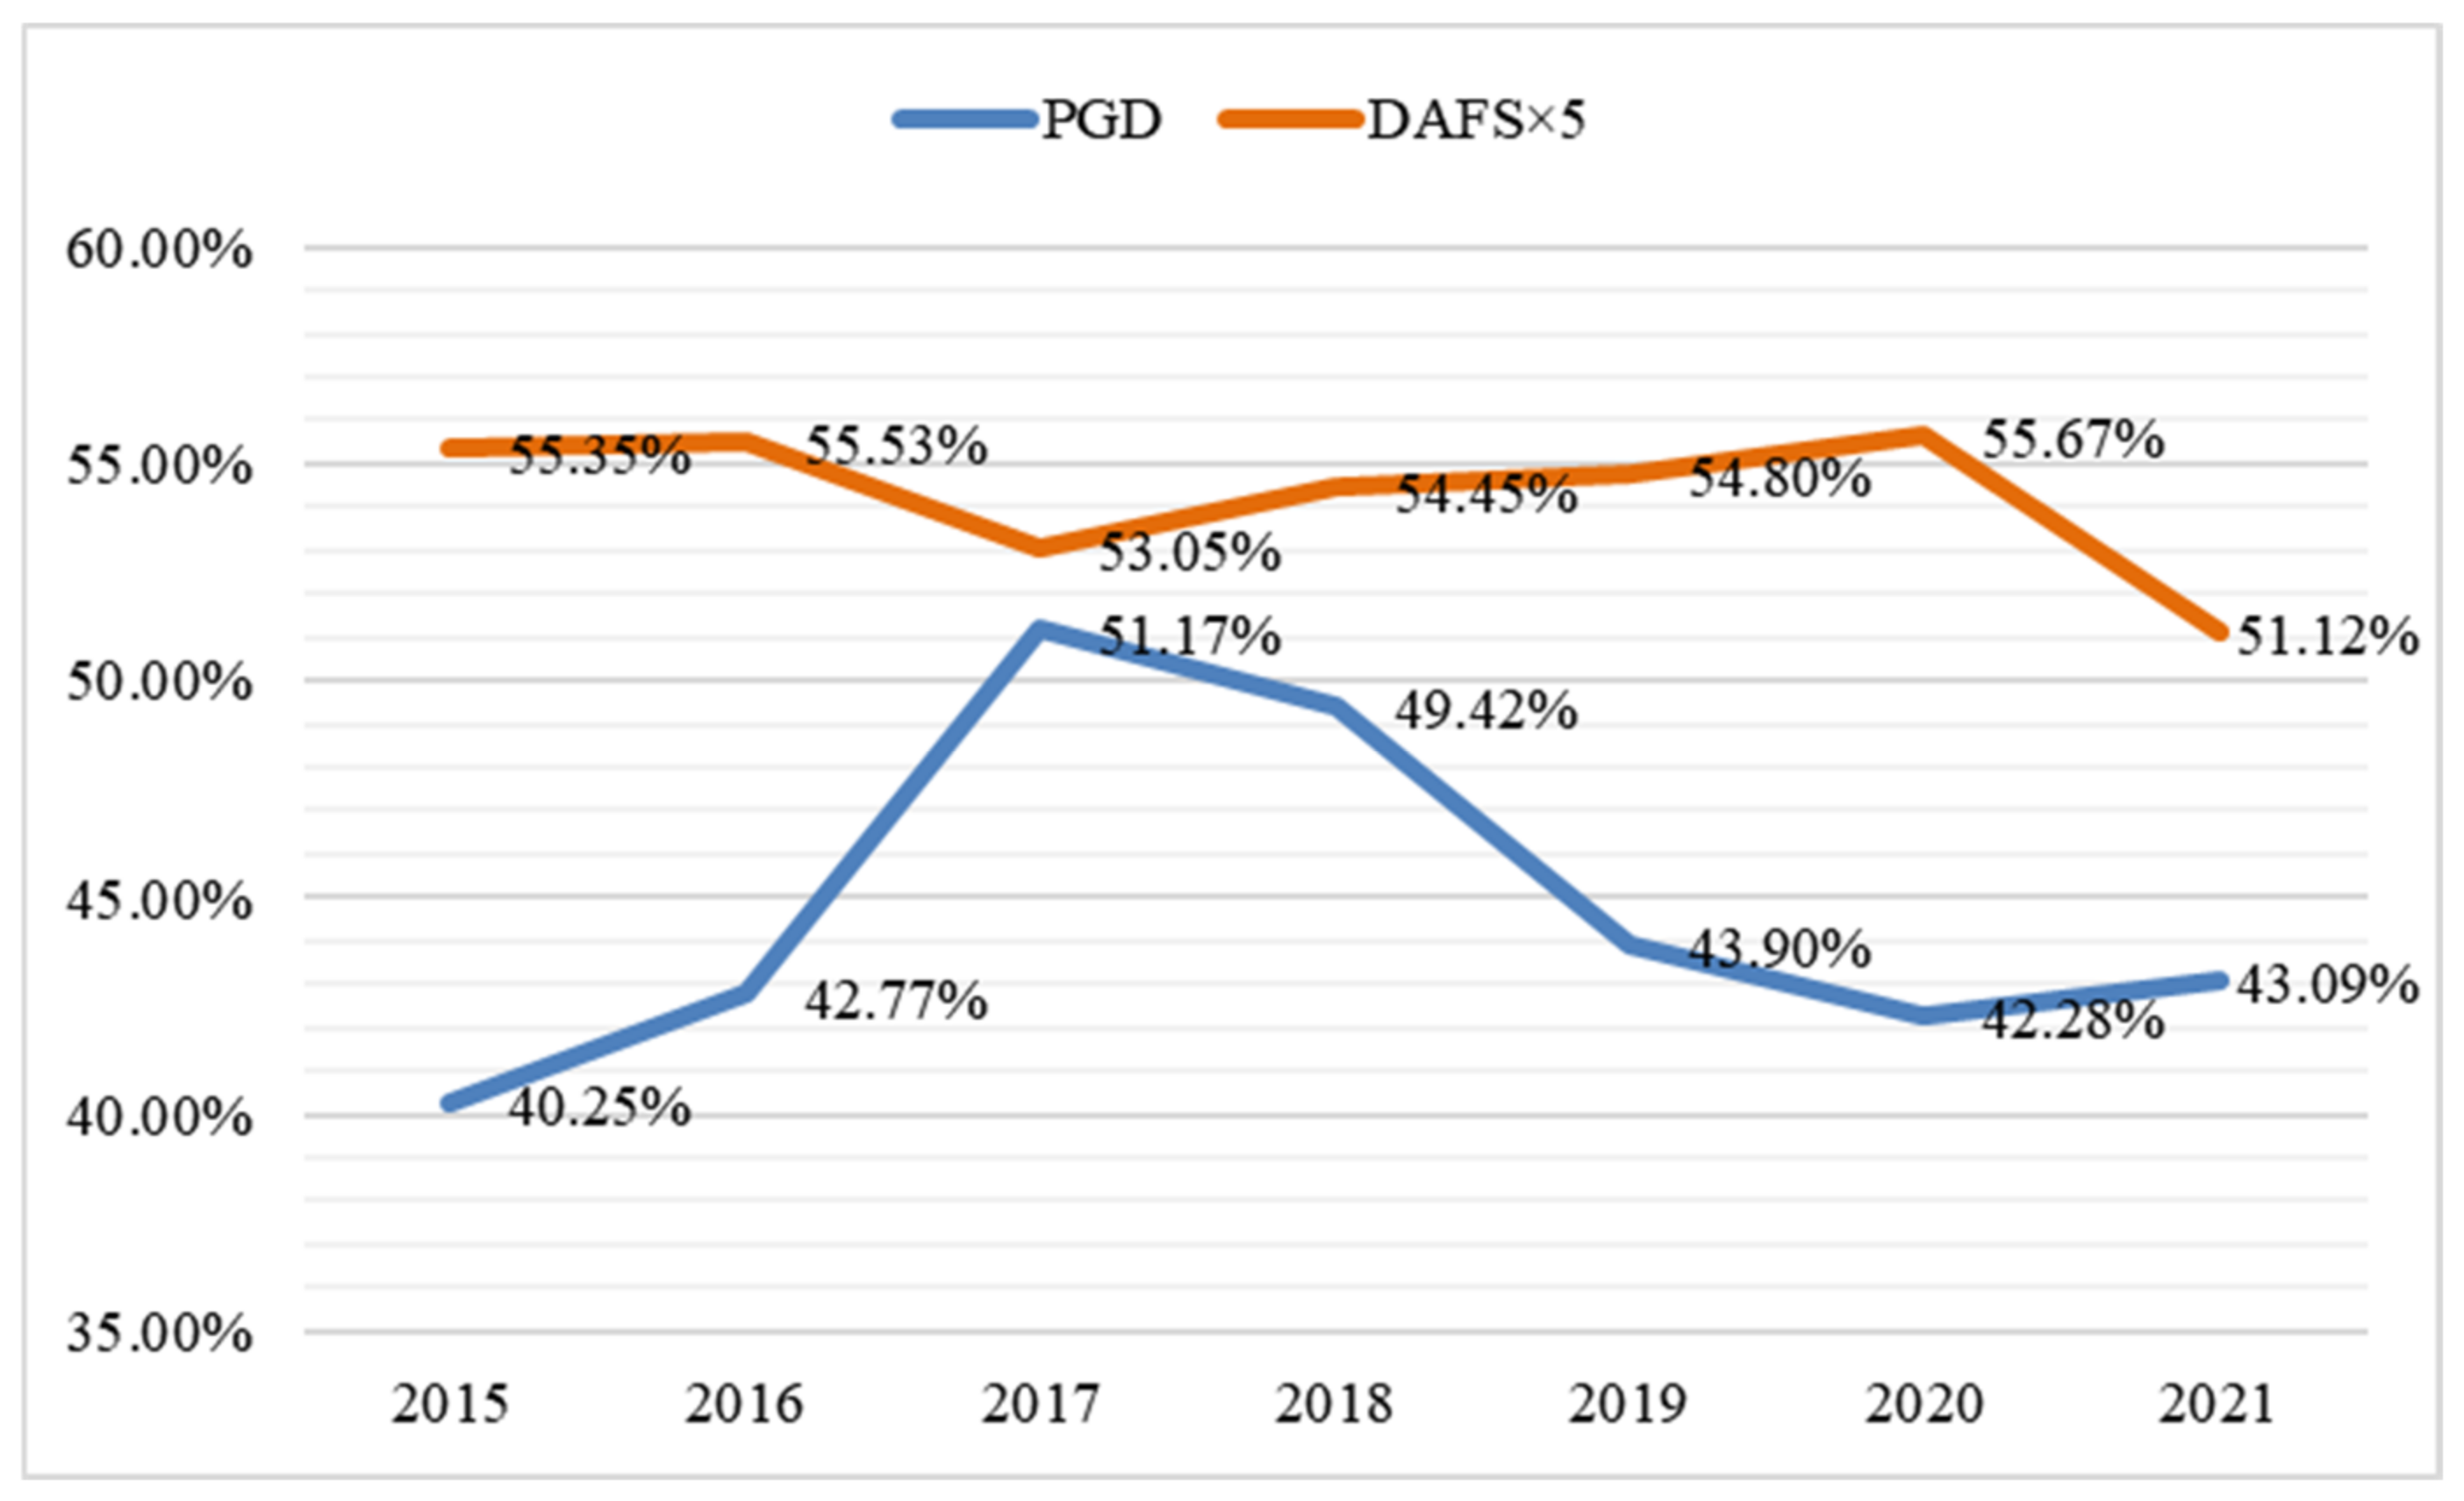
5.2. China’s Agricultural Economy Does Have a “Mezzogiorno Trap” for the Period 2015–2021
- 1.
- Significant disparities exist between agriculturally lagging regions and agriculturally advanced regions.
- 2.
- This disparity remains relatively stable. While the magnitude of the gap may fluctuate, the composition of the lagging and advanced areas remains largely unchanged.
- 3.
- This gap correlates with variations in governmental support. When support intensifies, the disparity narrows. Conversely, as support diminishes, the gap widens.
5.3. Analysis of the Causes of “Mezzogiorno Trap”
5.4. Trend of Overall Agricultural Economic Efficiency Development in China from 2015 to 2021
6. Conclusions, Recommendations, and Shortcomings
6.1. Conclusions
- 1.
- This paper introduces a methodology tailored for investigating the “Mezzogiorno Trap”, particularly within specific industries. Initially, a quantitative analysis is employed to identify underperforming regions. As an example, the super-efficiency SBM model is adopted in this paper to rank and categorize the subjects under study. Subsequently, the disparity between lagging and advanced regions is examined, exemplified in this research by the deployment of a meta-frontier SBM model to compute PGD values. Factors influencing these disparities are then scrutinized to ascertain the presence of the “Mezzogiorno Trap”. In this context, a comparative analysis between PGD and DAFS values is utilized to discern additional characteristics of the trap.
- 2.
- Utilizing this approach, we identified the presence of the “Mezzogiorno Trap” in China’s agricultural economy from 2015 to 2021. Even during periods characterized by consistently rising overall economic levels, this methodology effectively detected the existence of the “Mezzogiorno Trap”. Integrating findings from the SBM-Malmquist index model for the same years, we further corroborated the covert nature of the “Mezzogiorno Trap”: even when the overall economic efficiency is on an uptrend, the trap persists and is easily overlooked.
- 3.
- Through the decomposable DEA-SBM model, integrated with the unique characteristics of agricultural production, we posit that the primary reason for the “Mezzogiorno Trap” in China’s agricultural economy is the insufficiency in scale efficiency. This lack of scale efficiency is not only evident in provinces and cities with relatively lagging agricultural economic efficiency but is also prevalent among those with a moderate performance. Additionally, provinces and cities with a lagging agricultural economic efficiency exhibit deficiencies in pure technical efficiency, marking a significant difference from other regions. The issue of low scale efficiency is a common challenge faced by developing countries, often attributable to an imbalanced industrial structure, as demonstrated by the research conducted by Karimov et al. [76].
- 4.
- Fundamentally, regions mired in the “Mezzogiorno Trap” suffer from outdated industrial structures, inferior infrastructure, subpar technological standards, inefficiencies in capital utilization, and talent deficiencies, among others. The gaps present in these areas cannot be fully bridged solely through basic support policies such as financial subsidies. When such support wanes, the disparities swiftly widen once more.
6.2. Recommendations
- 1.
- Maintaining support strength, including fiscal support, is crucial for resolving the “Mezzogiorno Trap”. Data analysis reveals a certain correlation between strong support and the “Mezzogiorno Trap”, and prematurely weakening support could widen the gap. Several studies have likewise highlighted the significance of government support, including Mutlu’s study on Japan’s regional economic differentiation [77], Das et al.’s research on the Indian regional economy [78], and Chen et al.’s studies on regional differences in China and Henan Province’s agricultural economy [22,79]. These studies show that government support is a material basis and necessary condition for resolving regional differences.
- 2.
- However, the essence of addressing the “Mezzogiorno Trap” hinges on structural adjustments tailored to the realities of underdeveloped regions. Fiscal subsidies from the government must be dispensed judiciously; sheer direct capital allocations may inadvertently yield adverse consequences. Integrating the findings from this paper, the primary strategy for China to rectify its agricultural economic “Mezzogiorno Trap” centers on enhancing scale efficiency. Predicated on the characteristics of agricultural production, the emphasis on boosting scale efficiency necessitates a prudent reshaping of the industrial structure, specifically in Group 3 and Group 2 provinces and cities, representing immediate challenges to address.
- 3.
- Our preceding analysis indicates that enhancing pure technical efficiency is crucial for provinces entrapped in the “Mezzogiorno Trap”. Pure technical efficiency can be understood as the exclusion of scale-related factors, capturing elements such as technological advancement, managerial improvement, and increased capital efficiency. These distinctions underscore the fundamental differences between modern and traditional agriculture, further highlighting the urgency for industrialization within China’s agricultural sector.
- 4.
- Advanced provinces should take measures to assist less-developed provinces. Provinces in Group 3 should look to their counterparts in Group 1 for the adoption of advanced agricultural technologies and more efficient policies for agricultural industrialization. This would substantially contribute to the improvement of both pure technical efficiency and scale efficiency. In fact, enhancements in pure technical efficiency and scale efficiency are not mutually exclusive. Due to constraints such as land, climate, and water resources, agricultural production cannot simply optimize through arbitrary expansion or contraction of its scale. Advanced provinces often operate within more efficient production cycles, characterized by robust technological innovation, comprehensive policy formulation, and timely evaluation systems. These best practices offer valuable lessons for provinces that are lagging behind.
- 5.
- Provinces in Group 3 should pay particular attention to the heterogeneity of agricultural economies across different regions when formulating localized policies. This notion of diversification has been emphasized in earlier sections. For economically advanced regions like Shanghai and Guangdong, the focus should be on precision agriculture and the corporatization of agriculture. In contrast, less developed regions such as Gansu and Tibet should explore additional revenue streams. For instance, Gansu, which is predominantly characterized by desert and barren landscapes, has made notable strides in the development of solar and wind energy as well as agro-photovoltaic complementation. Recent studies indicate that these initiatives offer opportunities for ameliorating regional disparities [84,85].
6.3. Shortcomings and Improvements
Supplementary Materials
Author Contributions
Funding
Institutional Review Board Statement
Informed Consent Statement
Data Availability Statement
Conflicts of Interest
References
- Watson, M.M. Regional Development Policy and Administration in Italy; Longman Group Ltd.: London, UK, 1970. [Google Scholar]
- Daniele, V. Territorial disparities in labour productivity, wages and prices in Italy: What does the data show? Eur. Urban Reg. Stud. 2021, 28, 431–449. [Google Scholar] [CrossRef]
- Salvati, L.; Zitti, M.; Carlucci, M. In-between regional disparities and spatial heterogeneity: A multivariate analysis of territorial divides in Italy. J. Environ. Plan. Manag. 2017, 60, 997–1015. [Google Scholar] [CrossRef]
- Giarda, E.; Moroni, G. The Degree of Poverty Persistence and the Role of Regional Disparities in Italy in Comparison with France, Spain and the UK. Soc. Indic. Res. 2018, 136, 163–202. [Google Scholar] [CrossRef]
- Castelnovo, P.; Morretta, V.; Vecchi, M. Regional disparities and industrial structure: Territorial capital and productivity in Italian firms. Reg. Stud. 2020, 54, 1709–1723. [Google Scholar] [CrossRef]
- Iuzzolino, G.; Pellegrini, G.; Viesti, G. Convergence among Italian regions, 1861–2011. In Bank of Italy Economic History Working Paper; Bank of Italy Economic Research Department: Rome, Italy, 2011. [Google Scholar]
- Terrasi, M. Convergence and divergence across Italian regions. Ann. Reg. Sci. 1999, 33, 491–510. [Google Scholar] [CrossRef]
- Torrisi, G.; Pike, A.; Tomaney, J.; Tselios, V. (Re-)exploring the link between decentralization and regional disparities in Italy. Reg. Stud. Reg. Sci. 2015, 2, 123–140. [Google Scholar] [CrossRef]
- Bruzzi, S.; Ivaldi, E.; Santagata, M. Measuring Regional Performance in the Italian NHS: Are Disparities Decreasing? Soc. Indic. Res. 2022, 159, 1057–1084. [Google Scholar] [CrossRef]
- Fazio, G.; Piacentino, D.; Vassallo, E. Regional Disparities and Public Policies in Italy: Some considerations in light of a performance analysis. In Proceedings of the ERSA 2006—46th Congress of the European Regional Science Association, Volos, Greece, 30 August–3 September 2006. [Google Scholar]
- Geppert, K.; Stephan, A. Regional disparities in the European Union: Convergence and agglomeration. Pap. Reg. Sci. 2008, 87, 193–217. [Google Scholar] [CrossRef]
- Ruan, M.; Zhao, X. Fiscal pressure, policy choices and regional economic disparity: Evidence from a natural experiment in China. Sustainability 2022, 14, 12402. [Google Scholar] [CrossRef]
- López-Villuendas, A.M.; del Campo, C. Regional Economic Disparities in Europe: Time-Series Clustering of NUTS 3 Regions. Int. Reg. Sci. Rev. 2023, 46, 265–298. [Google Scholar] [CrossRef]
- Harrison, A.; Immergluck, D. The Battle of the Belts: Comparing Housing Vacancy in Larger Metros in the Sun Belt and the Rust Belt since the Mortgage Crisis, 2012 to 2019; Andrew Young School of Policy Studies, Georgia State University: Atlanta, GA, USA, 2020. [Google Scholar]
- Hegerty, S.W. The rust belt, the sunbelt, and the concentration of poverty within large US cities. Rev. Reg. Stud. 2019, 49, 474–494. [Google Scholar]
- Herrschel, T. Economic transformation, locality and policy in eastern Germany: A comparison of two Länder. Appl. Geogr. 1997, 17, 267–281. [Google Scholar] [CrossRef]
- Berentsen, W.H. Changing Regional Inequalities in United Germany. Eurasian Geogr. Econ. 2006, 47, 462–477. [Google Scholar] [CrossRef]
- Dörr, M.; Riemer, U.; Christ, M.; Bauersachs, J.; Bosch, R.; Laufs, U.; Neumann, A.; Scherer, M.; Störk, S.; Wachter, R. Hospitalizations for heart failure: Still major differences between East and West Germany 30 years after reunification. Wiley Online Libr. 2021, 8, 2546–2555. [Google Scholar] [CrossRef]
- Birthal, P.S.; Singh, H.; Kumar, S. Agriculture, economic growth and regional disparities in India. J. Int. Dev. 2011, 23, 119–131. [Google Scholar] [CrossRef]
- Jose, A. India’s regional disparity and its policy responses. J. Public Aff. 2019, 19, e1933. [Google Scholar] [CrossRef]
- State Council of China. The Eleventh Five-Year Plan for National Economic and Social Development of the People’s Republic of China. Available online: https://www.gov.cn/gongbao/content/2006/content_268766.htm (accessed on 15 July 2023).
- Chen, Z.; Song, S. Efficiency and technology gap in China’s agriculture: A regional meta-frontier analysis. China Econ. Rev. 2008, 19, 287–296. [Google Scholar] [CrossRef]
- Fan, S.; Kanbur, R.; Zhang, X. China’s regional disparities: Experience and policy. Rev. Dev. Financ. 2011, 1, 47–56. [Google Scholar] [CrossRef]
- Zhang, Y. The regional disparity of influencing factors of technological innovation in China: Evidence from high-tech industry. Technol. Econ. Dev. Econ. 2021, 27, 811–832. [Google Scholar] [CrossRef]
- State Council of China. Circular of the State Council on Deepening the Pilot Reform of Rural Taxes and Fees in 2005. Available online: https://www.gov.cn/gongbao/content/2005/content_64331.htm (accessed on 1 August 2023).
- State Council of China. Approval Reply of the State Council on Agreeing to Establish the New Rural Cooperative Medical Treatment Approval of the Inter-Ministerial Joint Conference System. Available online: https://www.gov.cn/gongbao/content/2003/content_62401.htm (accessed on 1 August 2023).
- The Central Committee of the Communist Party of China and the State Council. The Central Committee of the Communist Party of China and the State Council Opinions on Implementing the Rural Revitalization Strategy. Available online: https://www.gov.cn/gongbao/content/2018/content_5266232.htm (accessed on 1 September 2023).
- Chan, H.L.; Chan, K.T. The analysis of rural regional disparity in China. Asian Econ. J. 2000, 14, 23–38. [Google Scholar] [CrossRef]
- Li, H.; Haynes, K.E. Economic structure and regional disparity in China: Beyond the Kuznets transition. Int. Reg. Sci. Rev. 2011, 34, 157–190. [Google Scholar] [CrossRef]
- Chen, Y.; Li, X.; Tian, Y.; Tan, M. Structural change of agricultural land use intensity and its regional disparity in China. J. Geogr. Sci. 2009, 19, 545–556. [Google Scholar] [CrossRef]
- Liu, X.; Wang, X.; Xin, X. Did agricultural technological changes affect China’s regional disparity? China Agric. Econ. Rev. 2012, 4, 440–449. [Google Scholar] [CrossRef]
- National Bureau of Statistics of China. China Statistical Yearbook. Available online: http://www.stats.gov.cn/english/Statisticaldata/yearbook/ (accessed on 1 August 2023).
- Ministry of Agriculture and Rural Development of China. China Rural Statistical Yearbook. Available online: https://navi.cnki.net/knavi/yearbooks/YMCTJ/detail?uniplatform=NZKPT&language=chs (accessed on 1 August 2023).
- Chen, F.; Yang, K.; Wang, L.; Zhang, Y.; Liu, H. Comprehensive evaluation of power transmission and transformation project based on electric power big data. Energy Rep. 2022, 8, 733–741. [Google Scholar] [CrossRef]
- Chen, M.; Zheng, Y. China’s regional disparity and its policy responses. China World Econ. 2008, 16, 16–32. [Google Scholar] [CrossRef]
- Schmookler, J. The changing efficiency of the American economy, 1869–1938. Rev. Econ. Stat. 1952, 34, 214–231. [Google Scholar] [CrossRef]
- Bukarica, V.; Tomšić, Ž. Energy efficiency policy evaluation by moving from techno-economic towards whole society perspective on energy efficiency market. Renew. Sustain. Energy Rev. 2017, 70, 968–975. [Google Scholar] [CrossRef]
- Bravo-Ureta, B.E.; Pinheiro, A.E. Efficiency analysis of developing country agriculture: A review of the frontier function literature. Agric. Resour. Econ. Rev. 1993, 22, 88–101. [Google Scholar] [CrossRef]
- Paul, C.; Nehring, R.; Banker, D.; Somwaru, A. Scale economies and efficiency in US agriculture: Are traditional farms history? J. Product. Anal. 2004, 22, 185–205. [Google Scholar] [CrossRef]
- Charnes, A.; Cooper, W.W.; Rhodes, E. Measuring the efficiency of decision making units. Eur. J. Oper. Res. 1978, 2, 429–444. [Google Scholar] [CrossRef]
- Banker, R.D.; Charnes, A.; Cooper, W.W. Some models for estimating technical and scale inefficiencies in data envelopment analysis. Manag. Sci. 1984, 30, 1078–1092. [Google Scholar] [CrossRef]
- Tone, K. A slacks-based measure of efficiency in data envelopment analysis. Eur. J. Oper. Res. 2001, 130, 498–509. [Google Scholar] [CrossRef]
- Chang, Y.-T.; Park, H.-s.; Jeong, J.-b.; Lee, J.-w. Evaluating economic and environmental efficiency of global airlines: A SBM-DEA approach. Transp. Res. Part D Transp. Environ. 2014, 27, 46–50. [Google Scholar] [CrossRef]
- Lin, X.; Zhu, X.; Han, Y.; Geng, Z.; Liu, L. Economy and carbon dioxide emissions effects of energy structures in the world: Evidence based on SBM-DEA model. Sci. Total Environ. 2020, 729, 138947. [Google Scholar] [CrossRef] [PubMed]
- Tone, K. Slacks-based measure of efficiency. In Handbook on Data Envelopment Analysis; Springer: Boston, MA, USA, 2011; pp. 195–209. [Google Scholar]
- Andersen, P.; Petersen, N.C. A procedure for ranking efficient units in data envelopment analysis. Manag. Sci. 1993, 39, 1261–1264. [Google Scholar] [CrossRef]
- O’Donnell, C.J.; Rao, D.P.; Battese, G.E.J.E.E. Metafrontier frameworks for the study of firm-level efficiencies and technology ratios. Empir. Econ. 2008, 34, 231–255. [Google Scholar] [CrossRef]
- Li, L.-B.; Liu, B.-L.; Liu, W.-L.; Chiu, Y.-H.J.S.-E.P.S. Efficiency evaluation of the regional high-tech industry in China: A new framework based on meta-frontier dynamic DEA analysis. Econ. Plan. Sci. 2017, 60, 24–33. [Google Scholar] [CrossRef]
- Yu, Y.; Huang, J.; Zhang, N. Industrial eco-efficiency, regional disparity, and spatial convergence of China’s regions. J. Clean. Prod. 2018, 204, 872–887. [Google Scholar] [CrossRef]
- Malmquist, S. Index numbers and indifference surfaces. Trab. Estadística 1953, 4, 209–242. [Google Scholar] [CrossRef]
- Färe, R.; Grosskopf, S.; Lindgren, B.; Roos, P.J.J.o.p.A. Productivity changes in Swedish pharamacies 1980–1989: A non-parametric Malmquist approach. J. Product. Anal. 1992, 3, 85–101. [Google Scholar] [CrossRef]
- National Bureau of Statistics of China. Statistical Bulletin of the People’s Republic of China on National Economic and Social Development. 2022. Available online: https://www.gov.cn/xinwen/2023-02/28/content_5743623.htm (accessed on 1 August 2023).
- Tang, C.; Zhao, L.; Zhao, Z. Child labor in China. China Econ. Rev. 2018, 51, 149–166. [Google Scholar] [CrossRef]
- Gong, P.; Liang, S.; Carlton, E.J.; Jiang, Q.; Wu, J.; Wang, L.; Remais, J.V. Urbanisation and health in China. Lancet 2012, 379, 843–852. [Google Scholar] [CrossRef] [PubMed]
- Zhao, L. Massive return migration emerging in China. East Asian Policy 2018, 10, 75–86. [Google Scholar] [CrossRef]
- Fan, C.C. Economic opportunities and internal migration: A case study of Guangdong Province, China. Prof. Geogr. 1996, 48, 28–45. [Google Scholar] [CrossRef]
- Zhang, L.-Y. Economic development in Shanghai and the role of the state. Urban Stud. 2003, 40, 1549–1572. [Google Scholar] [CrossRef]
- Lo, C.W.-H.; Tang, S.-Y. Institutional reform, economic changes, and local environmental management in China: The case of Guangdong province. In Environmental Governance in China; Routledge: Abingdon, UK, 2013; pp. 42–62. [Google Scholar]
- Gao, Y.; Ma, Y. What is absent from the current monitoring: Idleness of rural industrial land in suburban Shanghai. Habitat Int. 2015, 49, 138–147. [Google Scholar] [CrossRef]
- Liu, Z.; Liu, L. Characteristics and driving factors of rural livelihood transition in the east coastal region of China: A case study of suburban Shanghai. J. Rural. Stud. 2016, 43, 145–158. [Google Scholar] [CrossRef]
- Gu, X.; Xie, B.; Zhang, Z.; Guo, H. Rural multifunction in Shanghai suburbs: Evaluation and spatial characteristics based on villages. Habitat Int. 2019, 92, 102041. [Google Scholar] [CrossRef]
- Choy, L.H.T.; Lai, Y.; Lok, W. Economic performance of industrial development on collective land in the urbanization process in China: Empirical evidence from Shenzhen. Habitat Int. 2013, 40, 184–193. [Google Scholar] [CrossRef]
- Su, Y.; Wu, S.; Kang, S.; Xu, H.; Liu, G.; Qiao, Z.; Liu, L. Monitoring Cropland Abandonment in Southern China from 1992 to 2020 Based on the Combination of Phenological and Time-Series Algorithm Using Landsat Imagery and Google Earth Engine. Remote Sens. 2023, 15, 669. [Google Scholar] [CrossRef]
- Hou, D.; Meng, F.; Prishchepov, A.V. How is urbanization shaping agricultural land-use? Unraveling the nexus between farmland abandonment and urbanization in China. Landsc. Urban Plan. 2021, 214, 104170. [Google Scholar] [CrossRef]
- McRae, S. Infrastructure quality and the subsidy trap. Am. Econ. Rev. 2015, 105, 35–66. [Google Scholar] [CrossRef]
- Dvouletý, O.; Blažková, I. The impact of public grants on firm-level productivity: Findings from the Czech food industry. Sustainability 2019, 11, 552. [Google Scholar] [CrossRef]
- Šipikal, M.; Pisár, P.; Labudová, V. Are subsidies reall y needed? The case of eu regional policy in the czech and slovak republics. In E+ M Ekonomie a Management/E+ M Economics Management Science; EBSCO Industries, Inc.: Alpharetta, GA, USA, 2013; Volume 2013. [Google Scholar]
- Tsiouni, M.; Aggelopoulos, S.; Pavloudi, A.; Siggia, D. Economic and financial sustainability dependency on subsidies: The case of goat farms in greece. Sustainability 2021, 13, 7441. [Google Scholar] [CrossRef]
- Wang, H.; Tong, J.; Su, F.; Wei, G.; Tao, R. To reallocate or not: Reconsidering the dilemma in China’s agricultural land tenure policy. Land Use Policy 2011, 28, 805–814. [Google Scholar] [CrossRef]
- Kendall, H.; Clark, B.; Li, W.; Jin, S.; Jones, G.D.; Chen, J.; Taylor, J.; Li, Z.; Frewer, L.J. Precision agriculture technology adoption: A qualitative study of small-scale commercial “family farms” located in the North China Plain. Precis. Agric. 2022, 23, 319–351. [Google Scholar] [CrossRef]
- Liu, H.; Li, G.; Wang, K. Homestead reduction, economic agglomeration and rural economic development: Evidence from Shanghai, China. China Agric. Econ. Rev. 2022, 14, 274–293. [Google Scholar] [CrossRef]
- Shi, Y.; Yang, Q.; Zhou, L.; Shi, S. Can Moderate Agricultural Scale Operations Be Developed against the Background of Plot Fragmentation and Land Dispersion? Evidence from the Suburbs of Shanghai. Sustainability 2022, 14, 8697. [Google Scholar]
- Li, S.; Yao, Z.; Liu, Z.; Wang, R.; Liu, M.; Adam, J.C. The spatio-temporal characteristics of drought across Tibet, China: Derived from meteorological and agricultural drought indexes. Theor. Appl. Climatol. 2019, 137, 2409–2424. [Google Scholar] [CrossRef]
- Ma, L.; Chen, M.; Fang, F.; Che, X. Research on the spatiotemporal variation of rural-urban transformation and its driving mechanisms in underdeveloped regions: Gansu Province in western China as an example. Sustain. Cities Soc. 2019, 50, 101675. [Google Scholar] [CrossRef]
- Wang, X.; Li, Z.; Shaikh, R.; Ranjha, A.R.; Batala, L.K. Do government subsidies promote financial performance? Fresh evidence from China’s new energy vehicle industry. Sustain. Prod. Consum. 2021, 28, 142–153. [Google Scholar] [CrossRef]
- Karimov, A.; Amoke Awotide, B.; Timothy Amos, T. Production and scale efficiency of maize farming households in South-Western Nigeria. Int. J. Soc. Econ. 2014, 41, 1087–1100. [Google Scholar] [CrossRef]
- Mutlu, S. Regional disparities, industry and government policy in Japan. Dev. Change 1991, 22, 547–586. [Google Scholar] [CrossRef]
- Das, K. Regional disparity in India. ACADEMICIA Int. Multidiscip. Res. J. 2017, 7, 53–69. [Google Scholar] [CrossRef]
- Chen, S.; Yang, J.; Kang, X. Effect of Fiscal Expenditure for Supporting Agriculture on Agricultural Economic Efficiency in Central China—A Case Study of Henan Province. Agriculture 2023, 13, 822. [Google Scholar] [CrossRef]
- Démurger, S. Infrastructure Development and Economic Growth: An Explanation for Regional Disparities in China? J. Comp. Econ. 2001, 29, 95–117. [Google Scholar] [CrossRef]
- Hitka, M.; Ližbetinová, L. Human potential of talents in agriculture and forestry in context of Agriculture 4. 0. Agric. Econ. 2023, 69, 223–233. [Google Scholar] [CrossRef]
- Bhatia, M. Rural infrastructure and growth in agriculture. Econ. Political Wkly. 1999, 34, A43–A48. [Google Scholar]
- Yang, Q.; Zhang, P.; Li, Y.; Ning, J.; Chu, N. Does the Policy of Decoupled Subsidies Improve the Agricultural Economic Resilience?—Evidence from China’s Main Corn Producing Regions. Sustainability 2023, 15, 10164. [Google Scholar]
- Zhang, Y.; Ren, J.; Pu, Y.; Wang, P. Solar energy potential assessment: A framework to integrate geographic, technological, and economic indices for a potential analysis. Renew. Energy 2020, 149, 577–586. [Google Scholar] [CrossRef]
- Sun, Y.; Li, Y.; Wang, R.; Ma, R. Measuring dynamics of solar energy resource quality: Methodology and policy implications for reducing regional energy inequality. Renew. Energy 2022, 197, 138–150. [Google Scholar] [CrossRef]


| Variables | Data Sources | |
|---|---|---|
| Input variables | Rural Population | China Statistical Yearbook |
| Consumption of Chemical Fertilizers | China Rural Statistical Yearbook | |
| Consumption of Pesticides | China Rural Statistical Yearbook | |
| Consumption of Diesel Fuel | China Rural Statistical Yearbook | |
| Output variables | Gross Output Value of Agriculture, Forestry, Animal Husbandry and Fishery | China Rural Statistical Yearbook |
| DMU | Efficiency Score | Ranking | Group |
|---|---|---|---|
| Beijing | 0.673728 | 14 | 2 |
| Tianjin | 0.570652 | 19 | 2 |
| Hebei | 0.443189 | 27 | 3 |
| Shanxi | 0.320583 | 31 | 3 |
| Inner Mongolia | 0.80136 | 11 | 2 |
| Liaoning | 0.915023 | 9 | 1 |
| Jilin | 0.443526 | 26 | 3 |
| Heilongjiang | 1.092438 | 3 | 1 |
| Shanghai | 0.487126 | 24 | 3 |
| Jiangsu | 1.029901 | 7 | 1 |
| Zhejiang | 0.606872 | 17 | 2 |
| Anhui | 0.438897 | 28 | 3 |
| Fujian | 1.064987 | 4 | 1 |
| Jiangxi | 0.50359 | 23 | 3 |
| Shandong | 0.725972 | 12 | 2 |
| Henan | 0.420875 | 29 | 3 |
| Hubei | 0.811924 | 10 | 1 |
| Hunan | 0.548386 | 20 | 2 |
| Guangdong | 0.522385 | 22 | 3 |
| Guangxi | 0.611202 | 16 | 2 |
| Hainan | 1.160764 | 2 | 1 |
| Chongqing | 0.577371 | 18 | 2 |
| Sichuan | 0.719591 | 13 | 2 |
| Guizhou | 1.573564 | 1 | 1 |
| Yunnan | 0.444038 | 25 | 3 |
| Tibet | 0.526058 | 21 | 3 |
| Shaanxi | 1.013779 | 8 | 1 |
| Gansu | 0.360777 | 30 | 3 |
| Qinghai | 1.042648 | 5 | 1 |
| Ningxia | 0.672134 | 15 | 2 |
| Xinjiang | 1.035293 | 6 | 1 |
| Group 1 | Group 2 | Group 3 |
|---|---|---|
| Liaoning | Beijing | Hebei |
| Heilongjiang | Tianjin | Shanxi |
| Jiangsu | Inner Mongolia | Jilin |
| Fujian | Zhejiang | Shanghai |
| Hubei | Shandong | Anhui |
| Hainan | Hunan | Jiangxi |
| Guizhou | Guangxi | Henan |
| Shaanxi | Chongqing | Guangdong |
| Qinghai | Sichuan | Yunnan |
| Xinjiang | Ningxia | Tibet |
| Gansu |
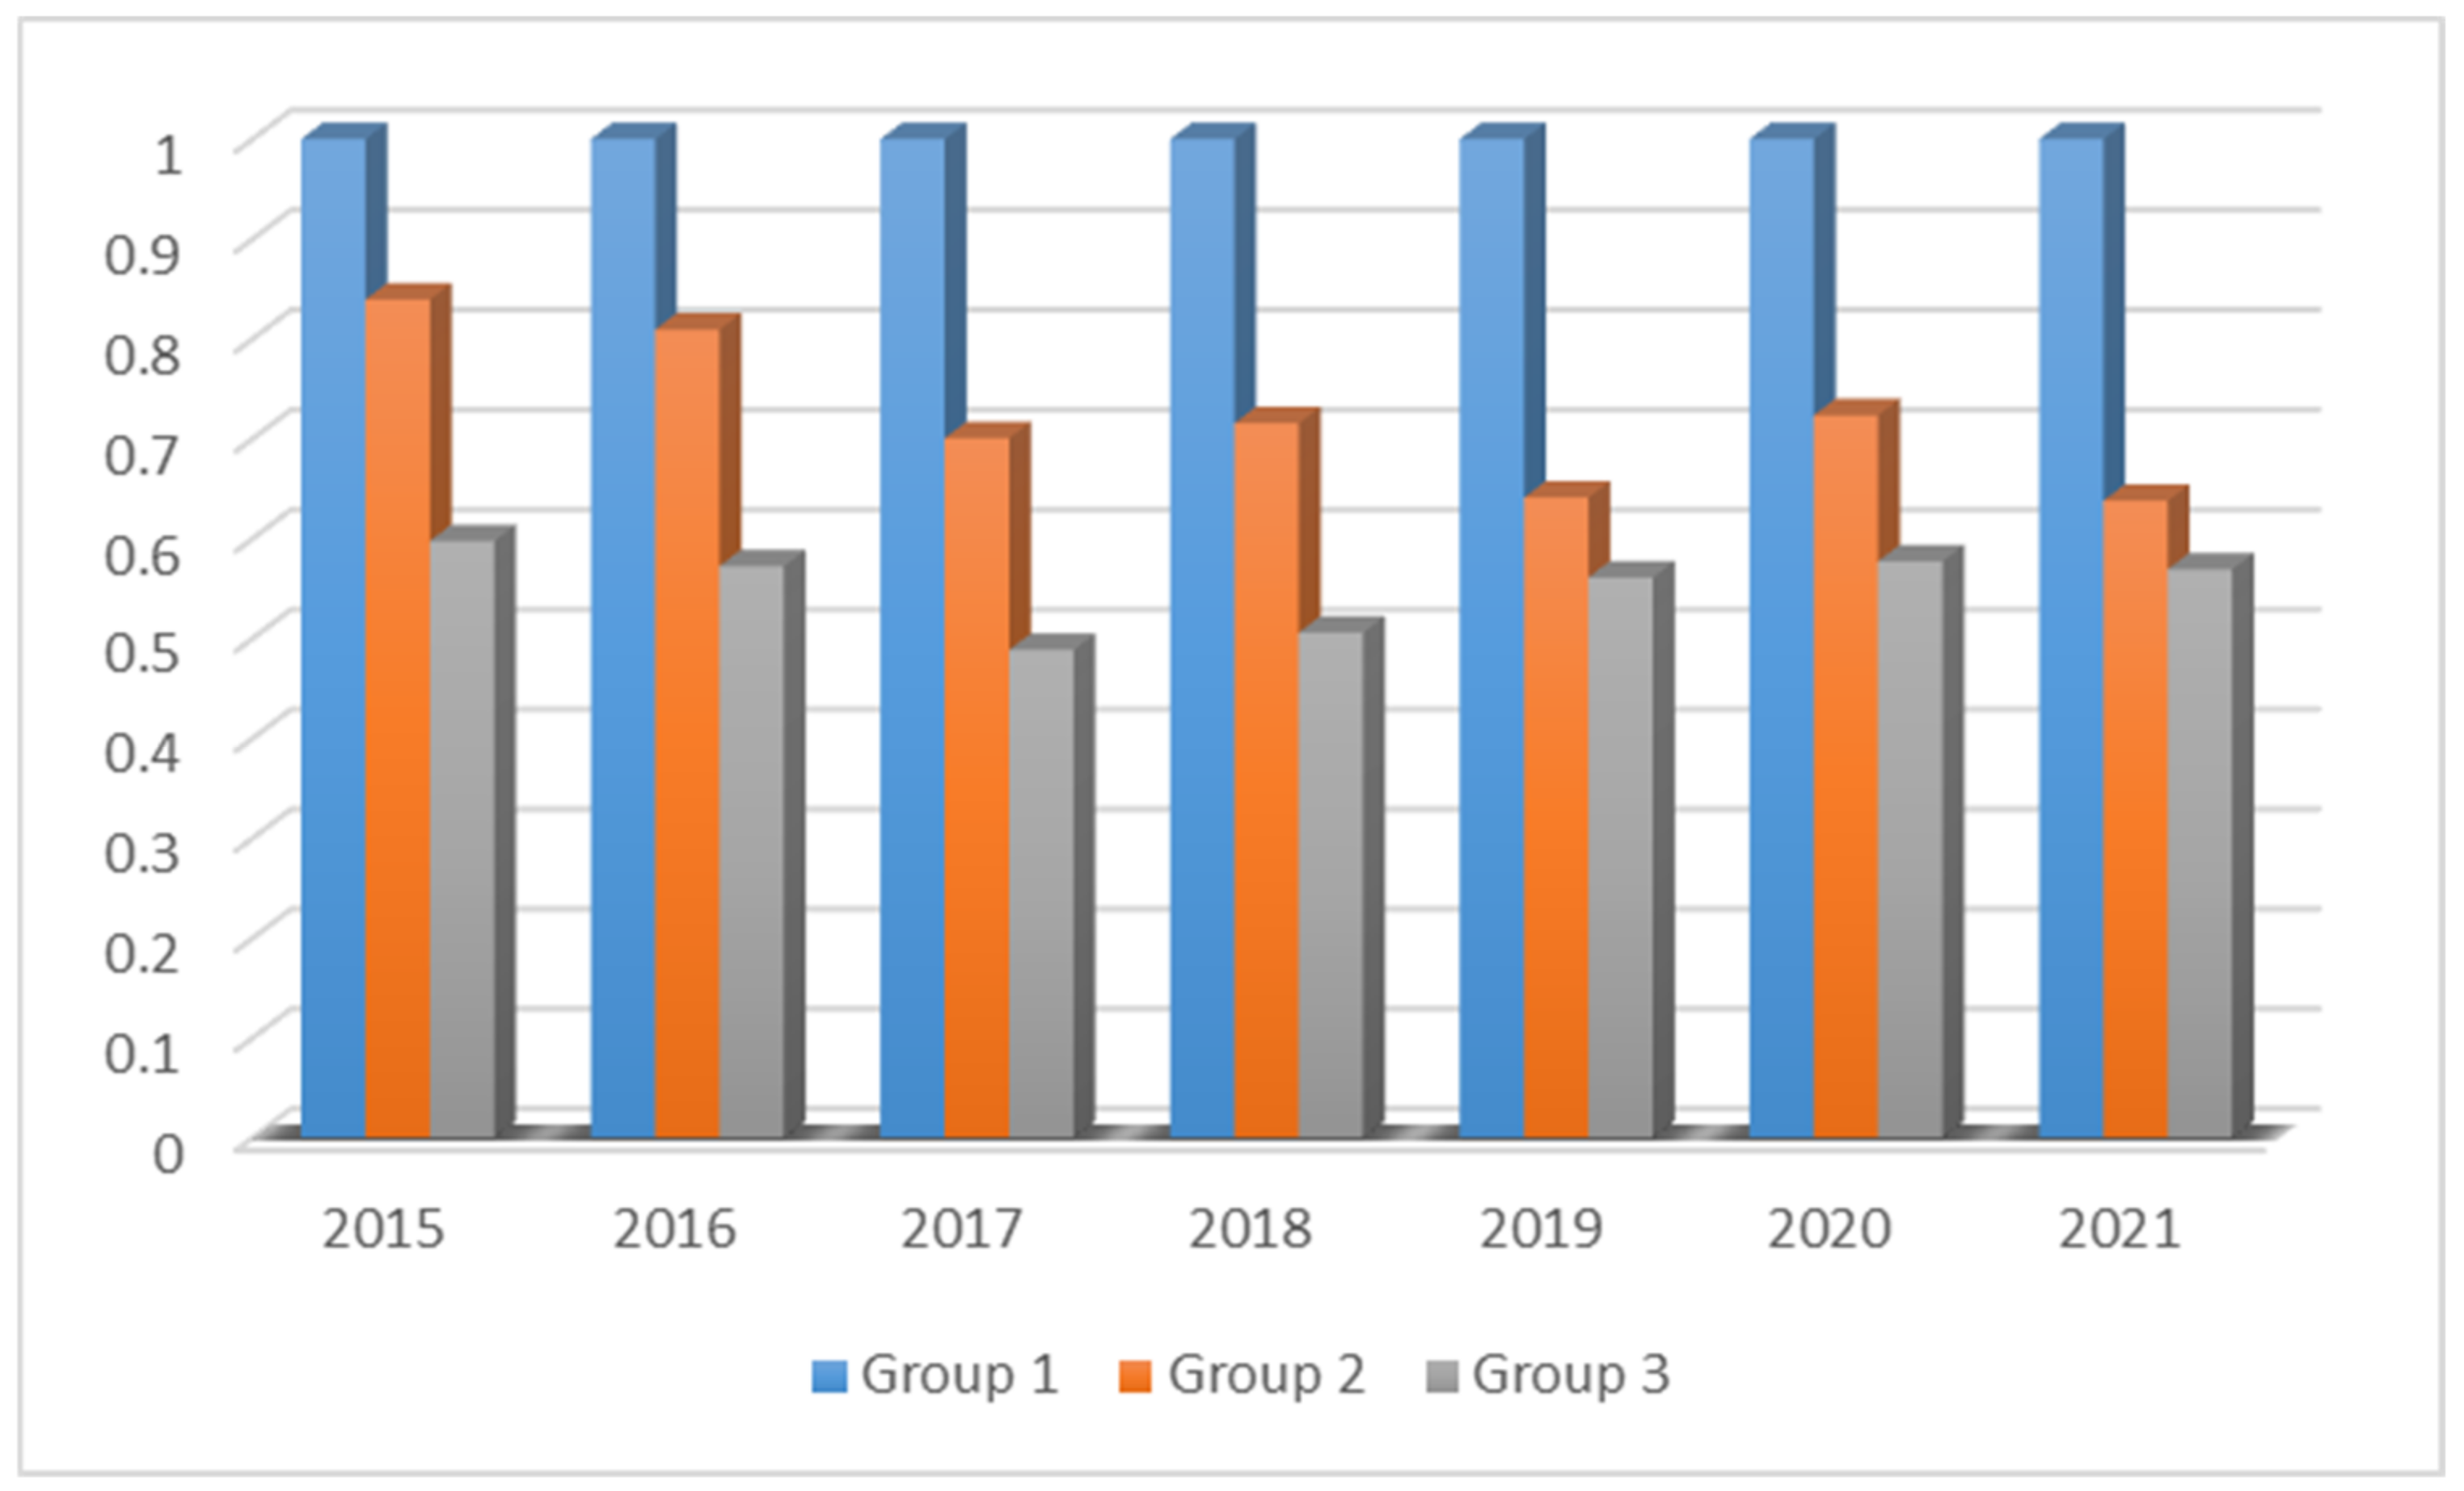
| Group 1 | Group 2 | Group 3 | |
|---|---|---|---|
| 2015 | 1 | 0.839242 | 0.597488 |
| 2016 | 1 | 0.809165 | 0.572281 |
| 2017 | 1 | 0.700432 | 0.488344 |
| 2018 | 1 | 0.71545 | 0.505777 |
| 2019 | 1 | 0.640931 | 0.560976 |
| 2020 | 1 | 0.723399 | 0.577238 |
| 2021 | 1 | 0.637693 | 0.569133 |
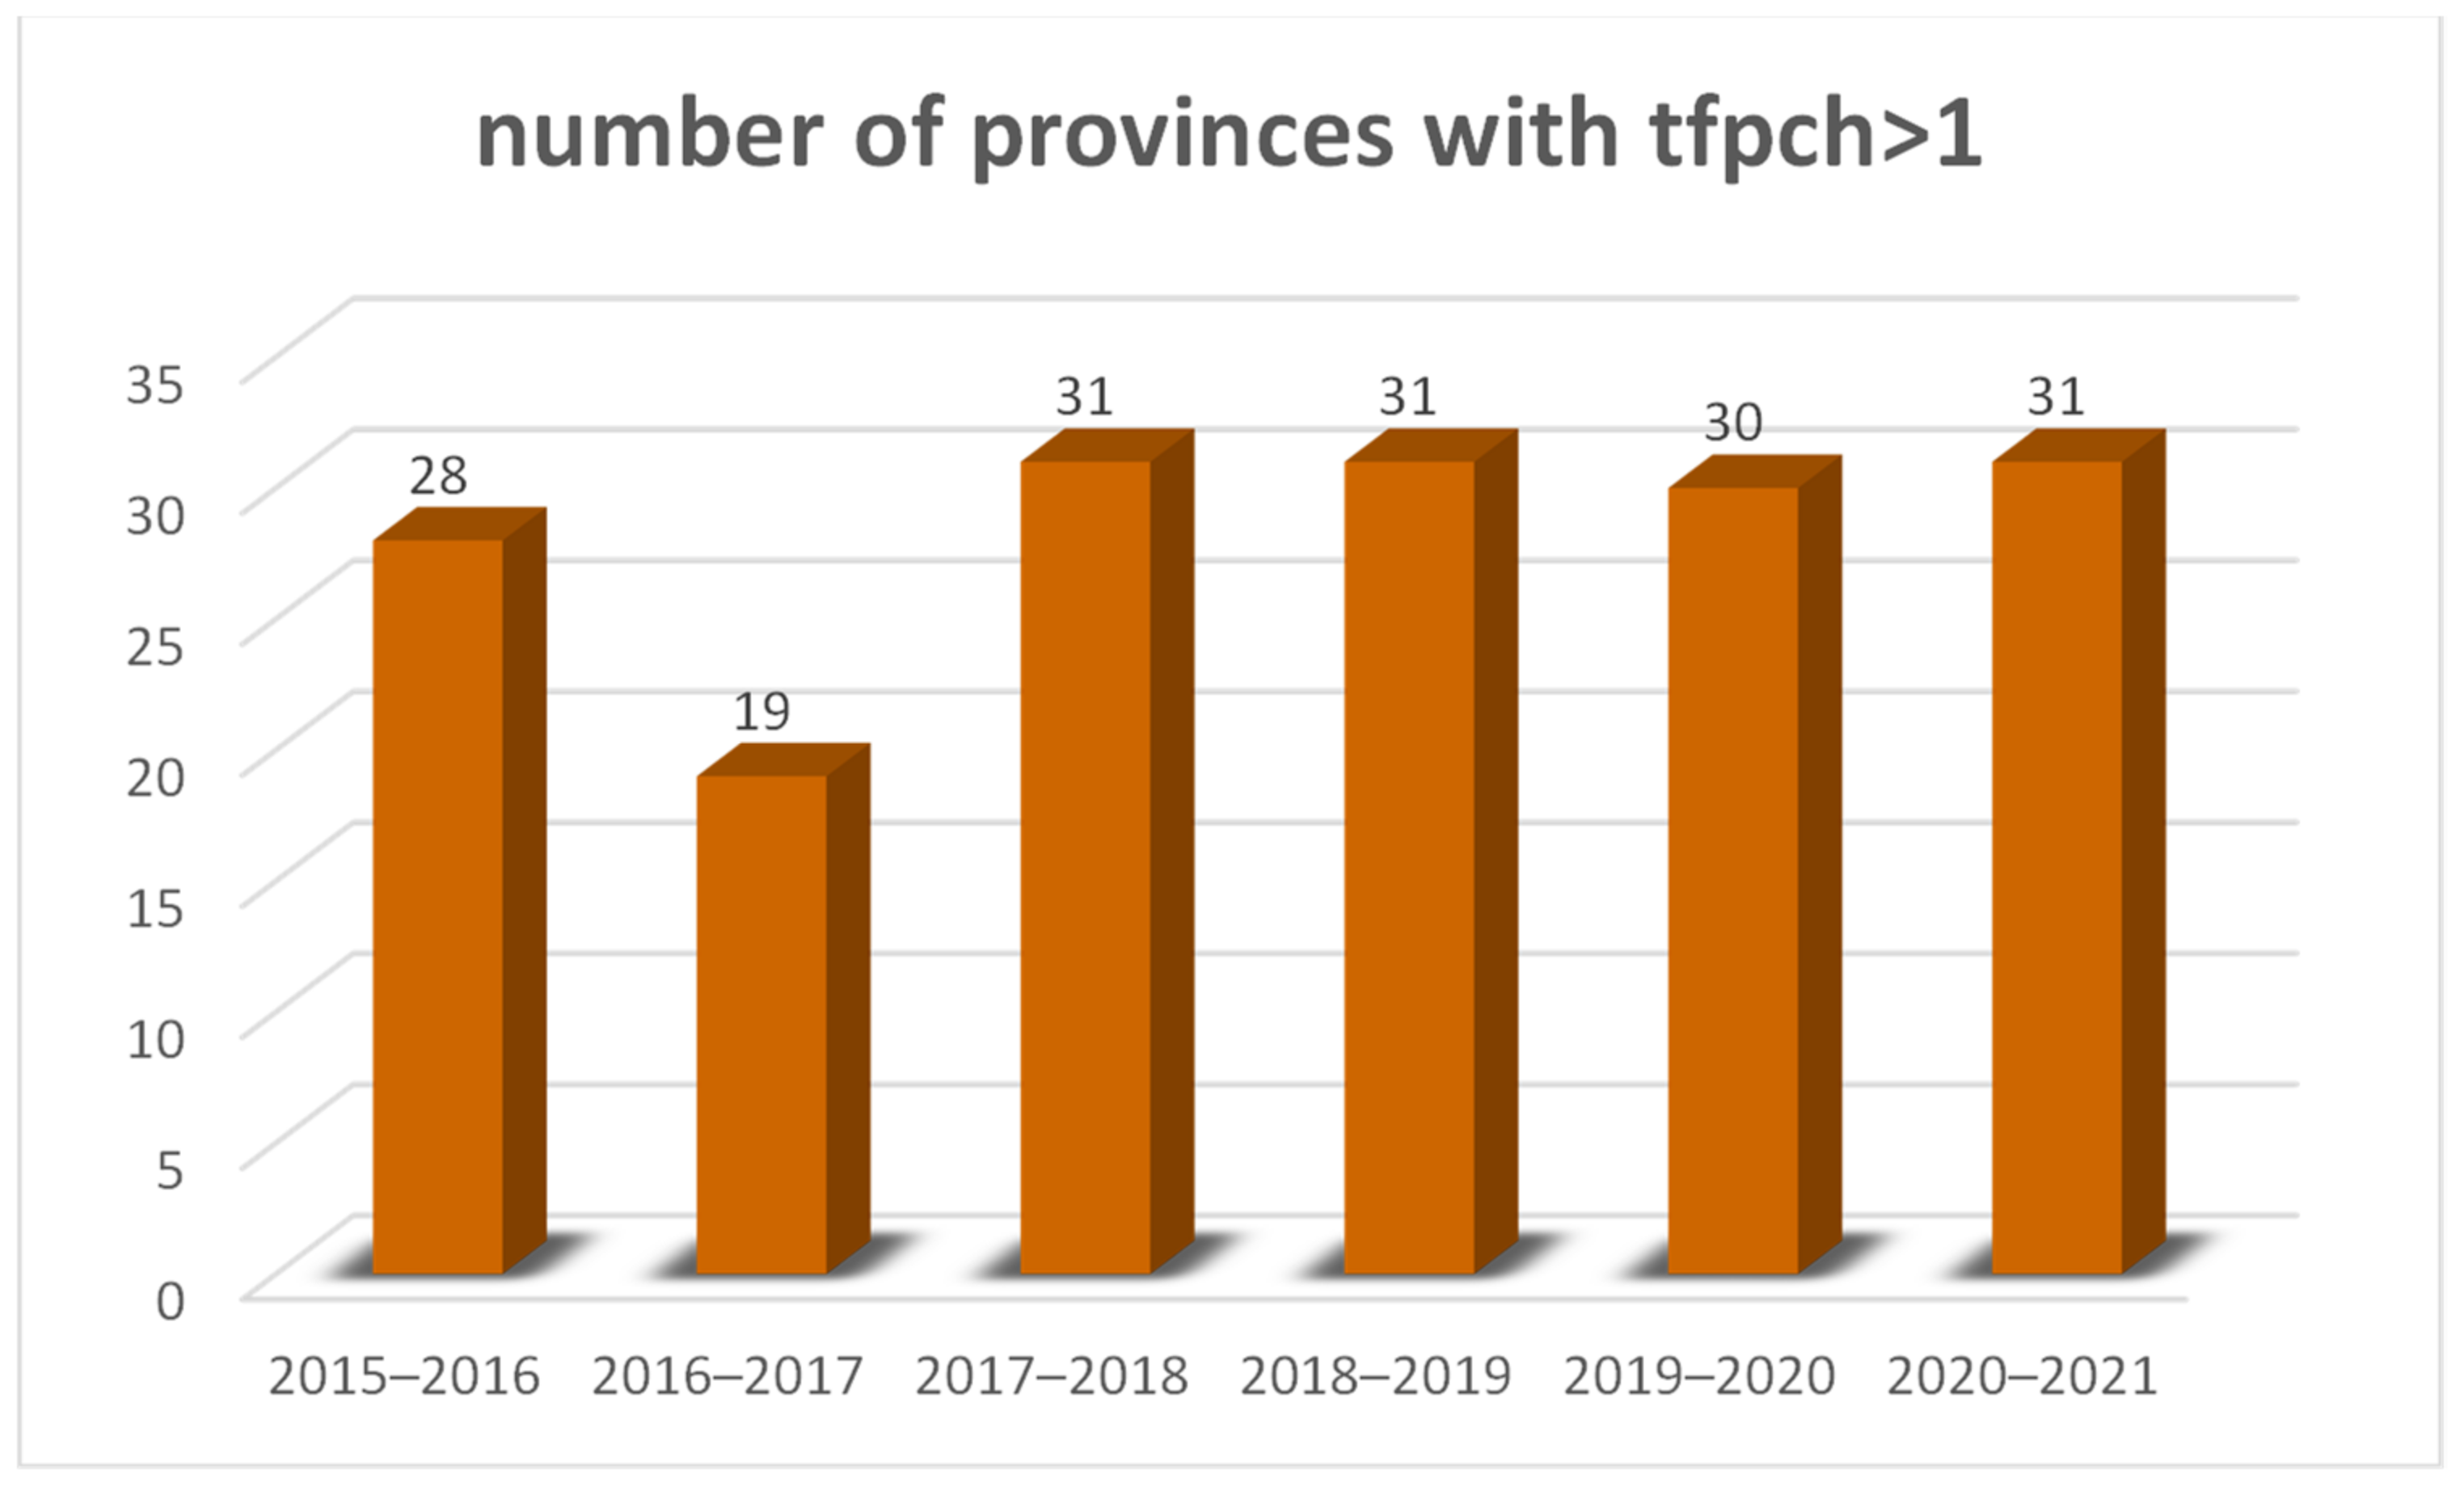
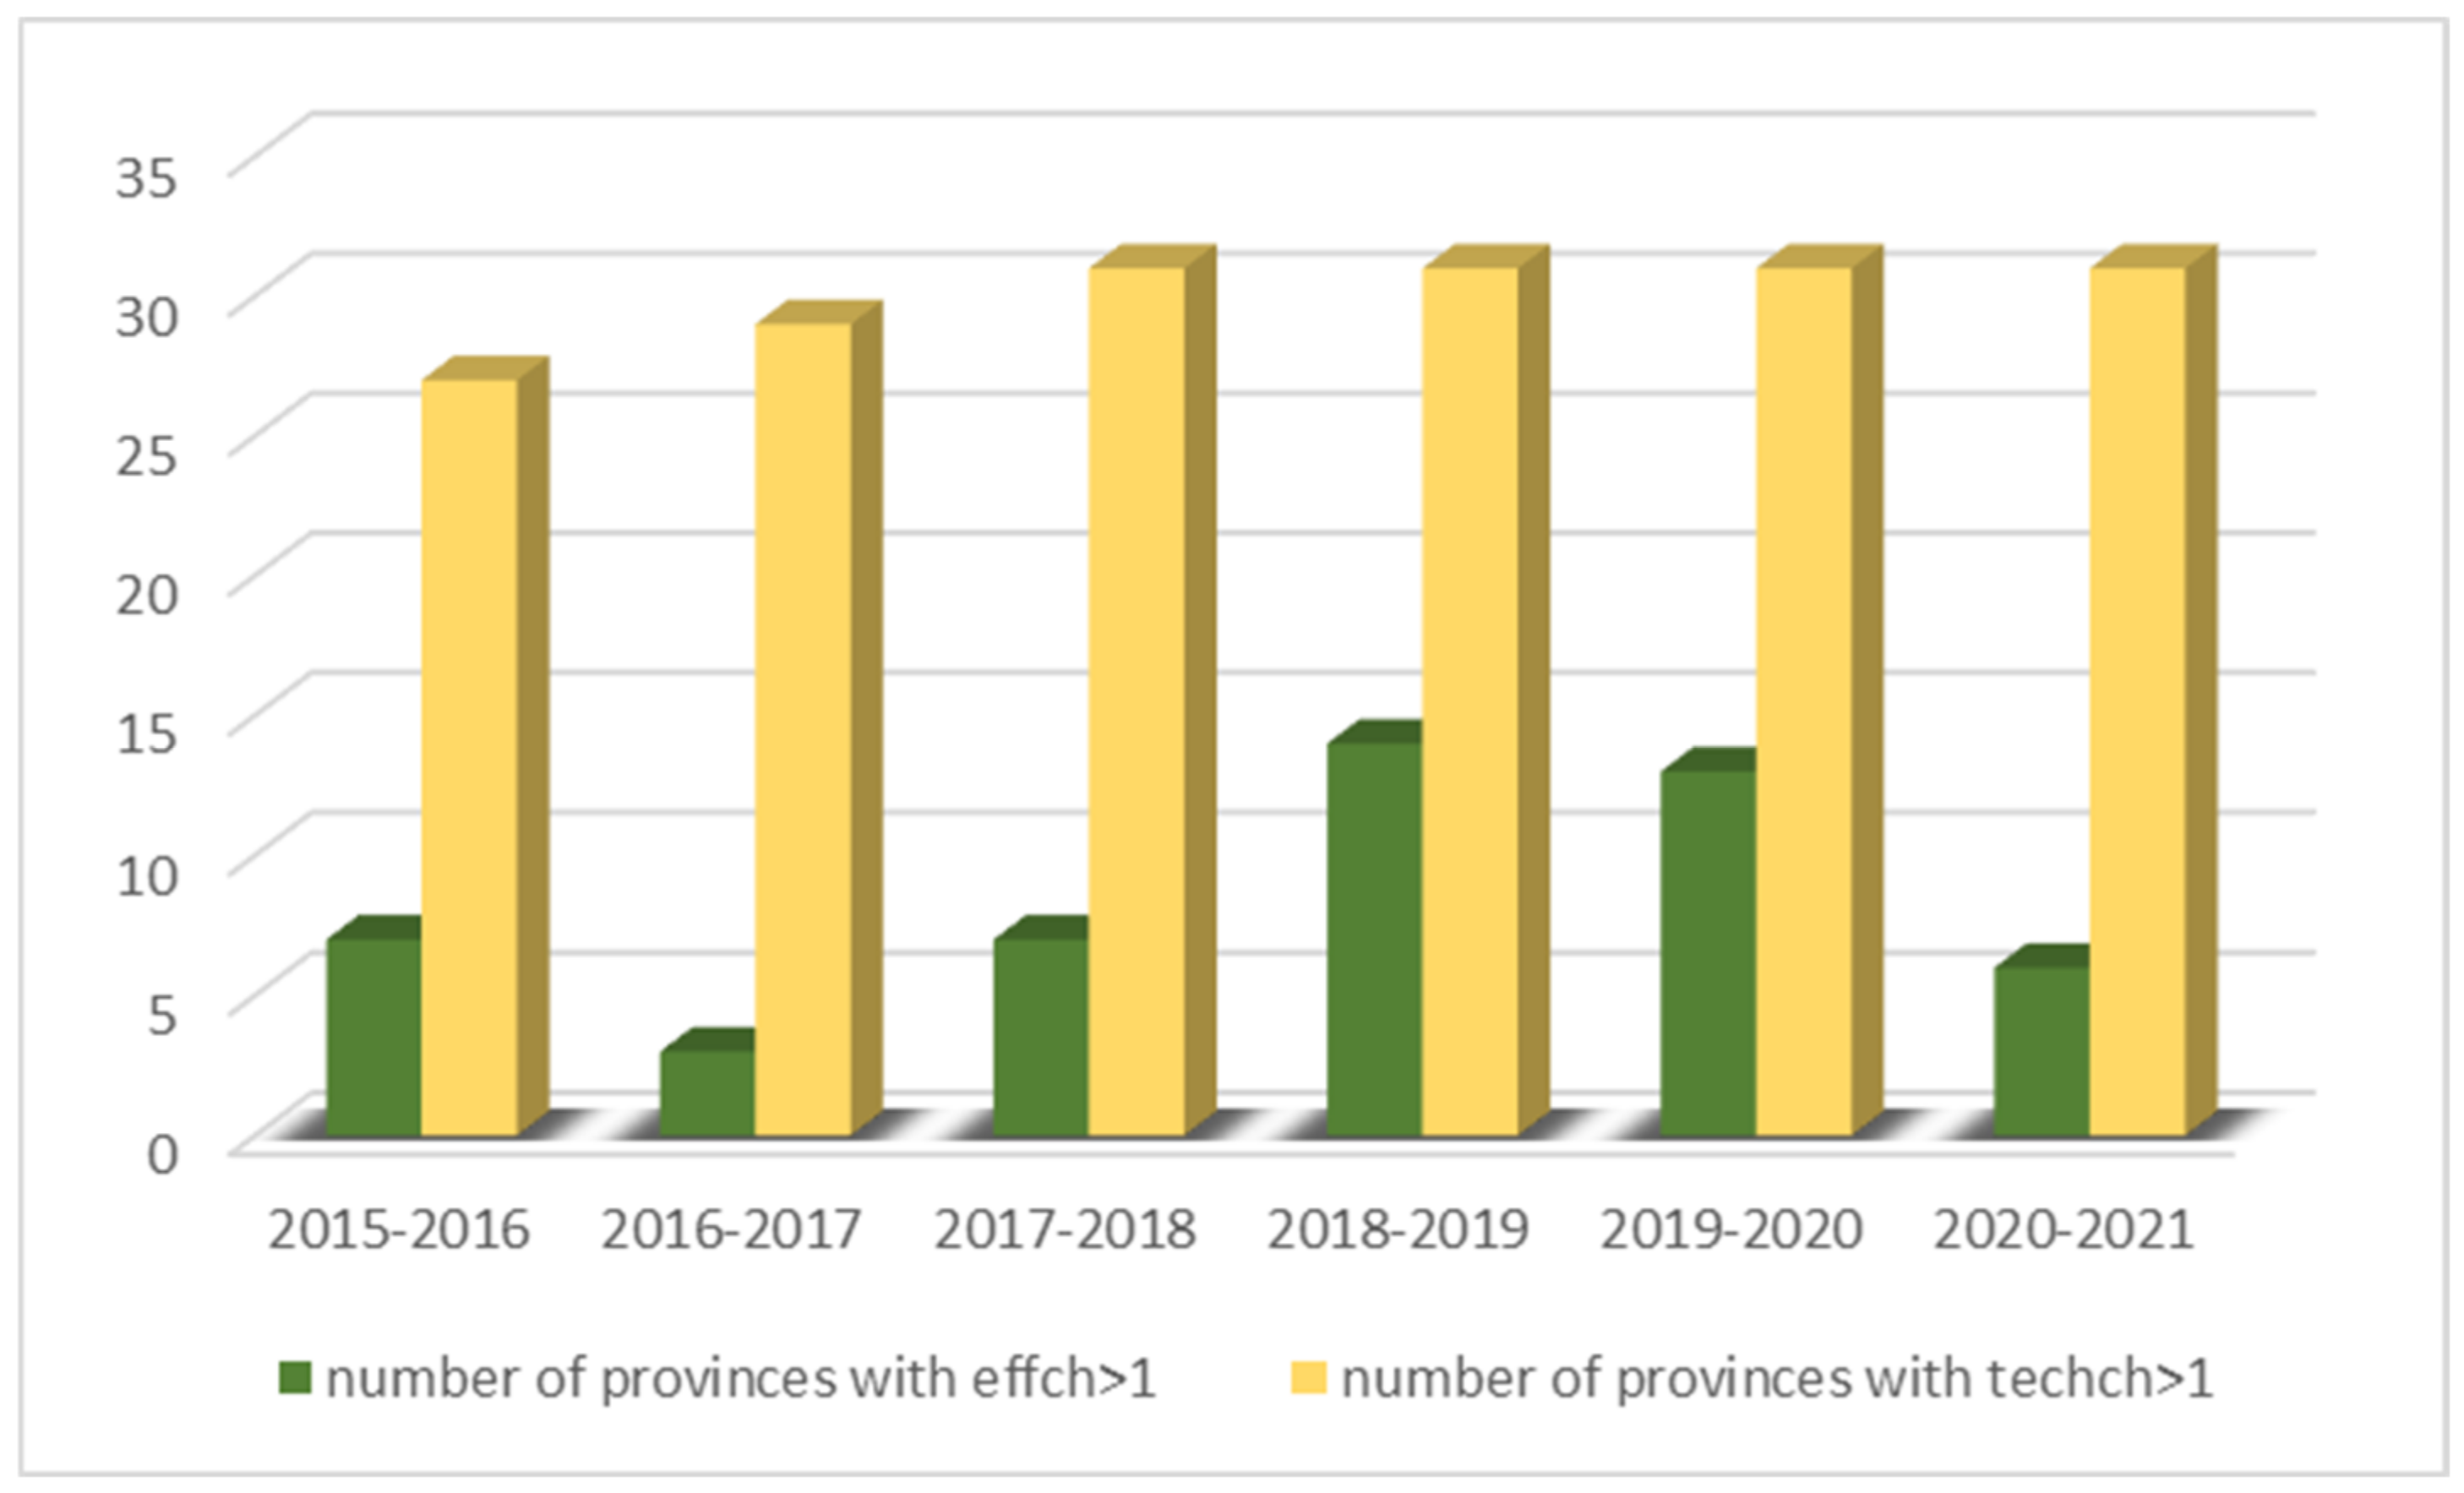
| Number of Provinces with Effch > 1 | Number of Provinces with Techch > 1 | Number of Provinces with Tfpch > 1 | |
|---|---|---|---|
| 2015–2016 | 7 | 27 | 28 |
| 2016–2017 | 3 | 29 | 19 |
| 2017–2018 | 7 | 31 | 31 |
| 2018–2019 | 14 | 31 | 31 |
| 2019–2020 | 13 | 31 | 30 |
| 2020–2021 | 6 | 31 | 31 |
| Gross Regional Product (CNY 100 Millions) | Ranking of Gross Regional Product | Per capita Gross Regional Product (CNY) | Ranking of Per Capita Gross Regional Product | |
|---|---|---|---|---|
| Hebei | 40,391.27 | 12 | 54,231.03 | 27 |
| Shanxi | 22,590.16 | 20 | 64,914.26 | 17 |
| Jilin | 13,235.52 | 26 | 55,728.49 | 26 |
| Shanghai | 43,214.85 | 10 | 173,623.3 | 2 |
| Anhui | 42,959.18 | 11 | 70,275.11 | 13 |
| Jiangxi | 29,619.67 | 15 | 65,573.77 | 15 |
| Henan | 58,887.41 | 5 | 59,584.54 | 22 |
| Guangdong | 124,369.7 | 1 | 98,052.41 | 7 |
| Yunnan | 27,146.76 | 18 | 57,882.23 | 23 |
| Tibet | 2080.173 | 31 | 56,835.32 | 24 |
| Gansu | 10,243.31 | 27 | 41,137.77 | 31 |
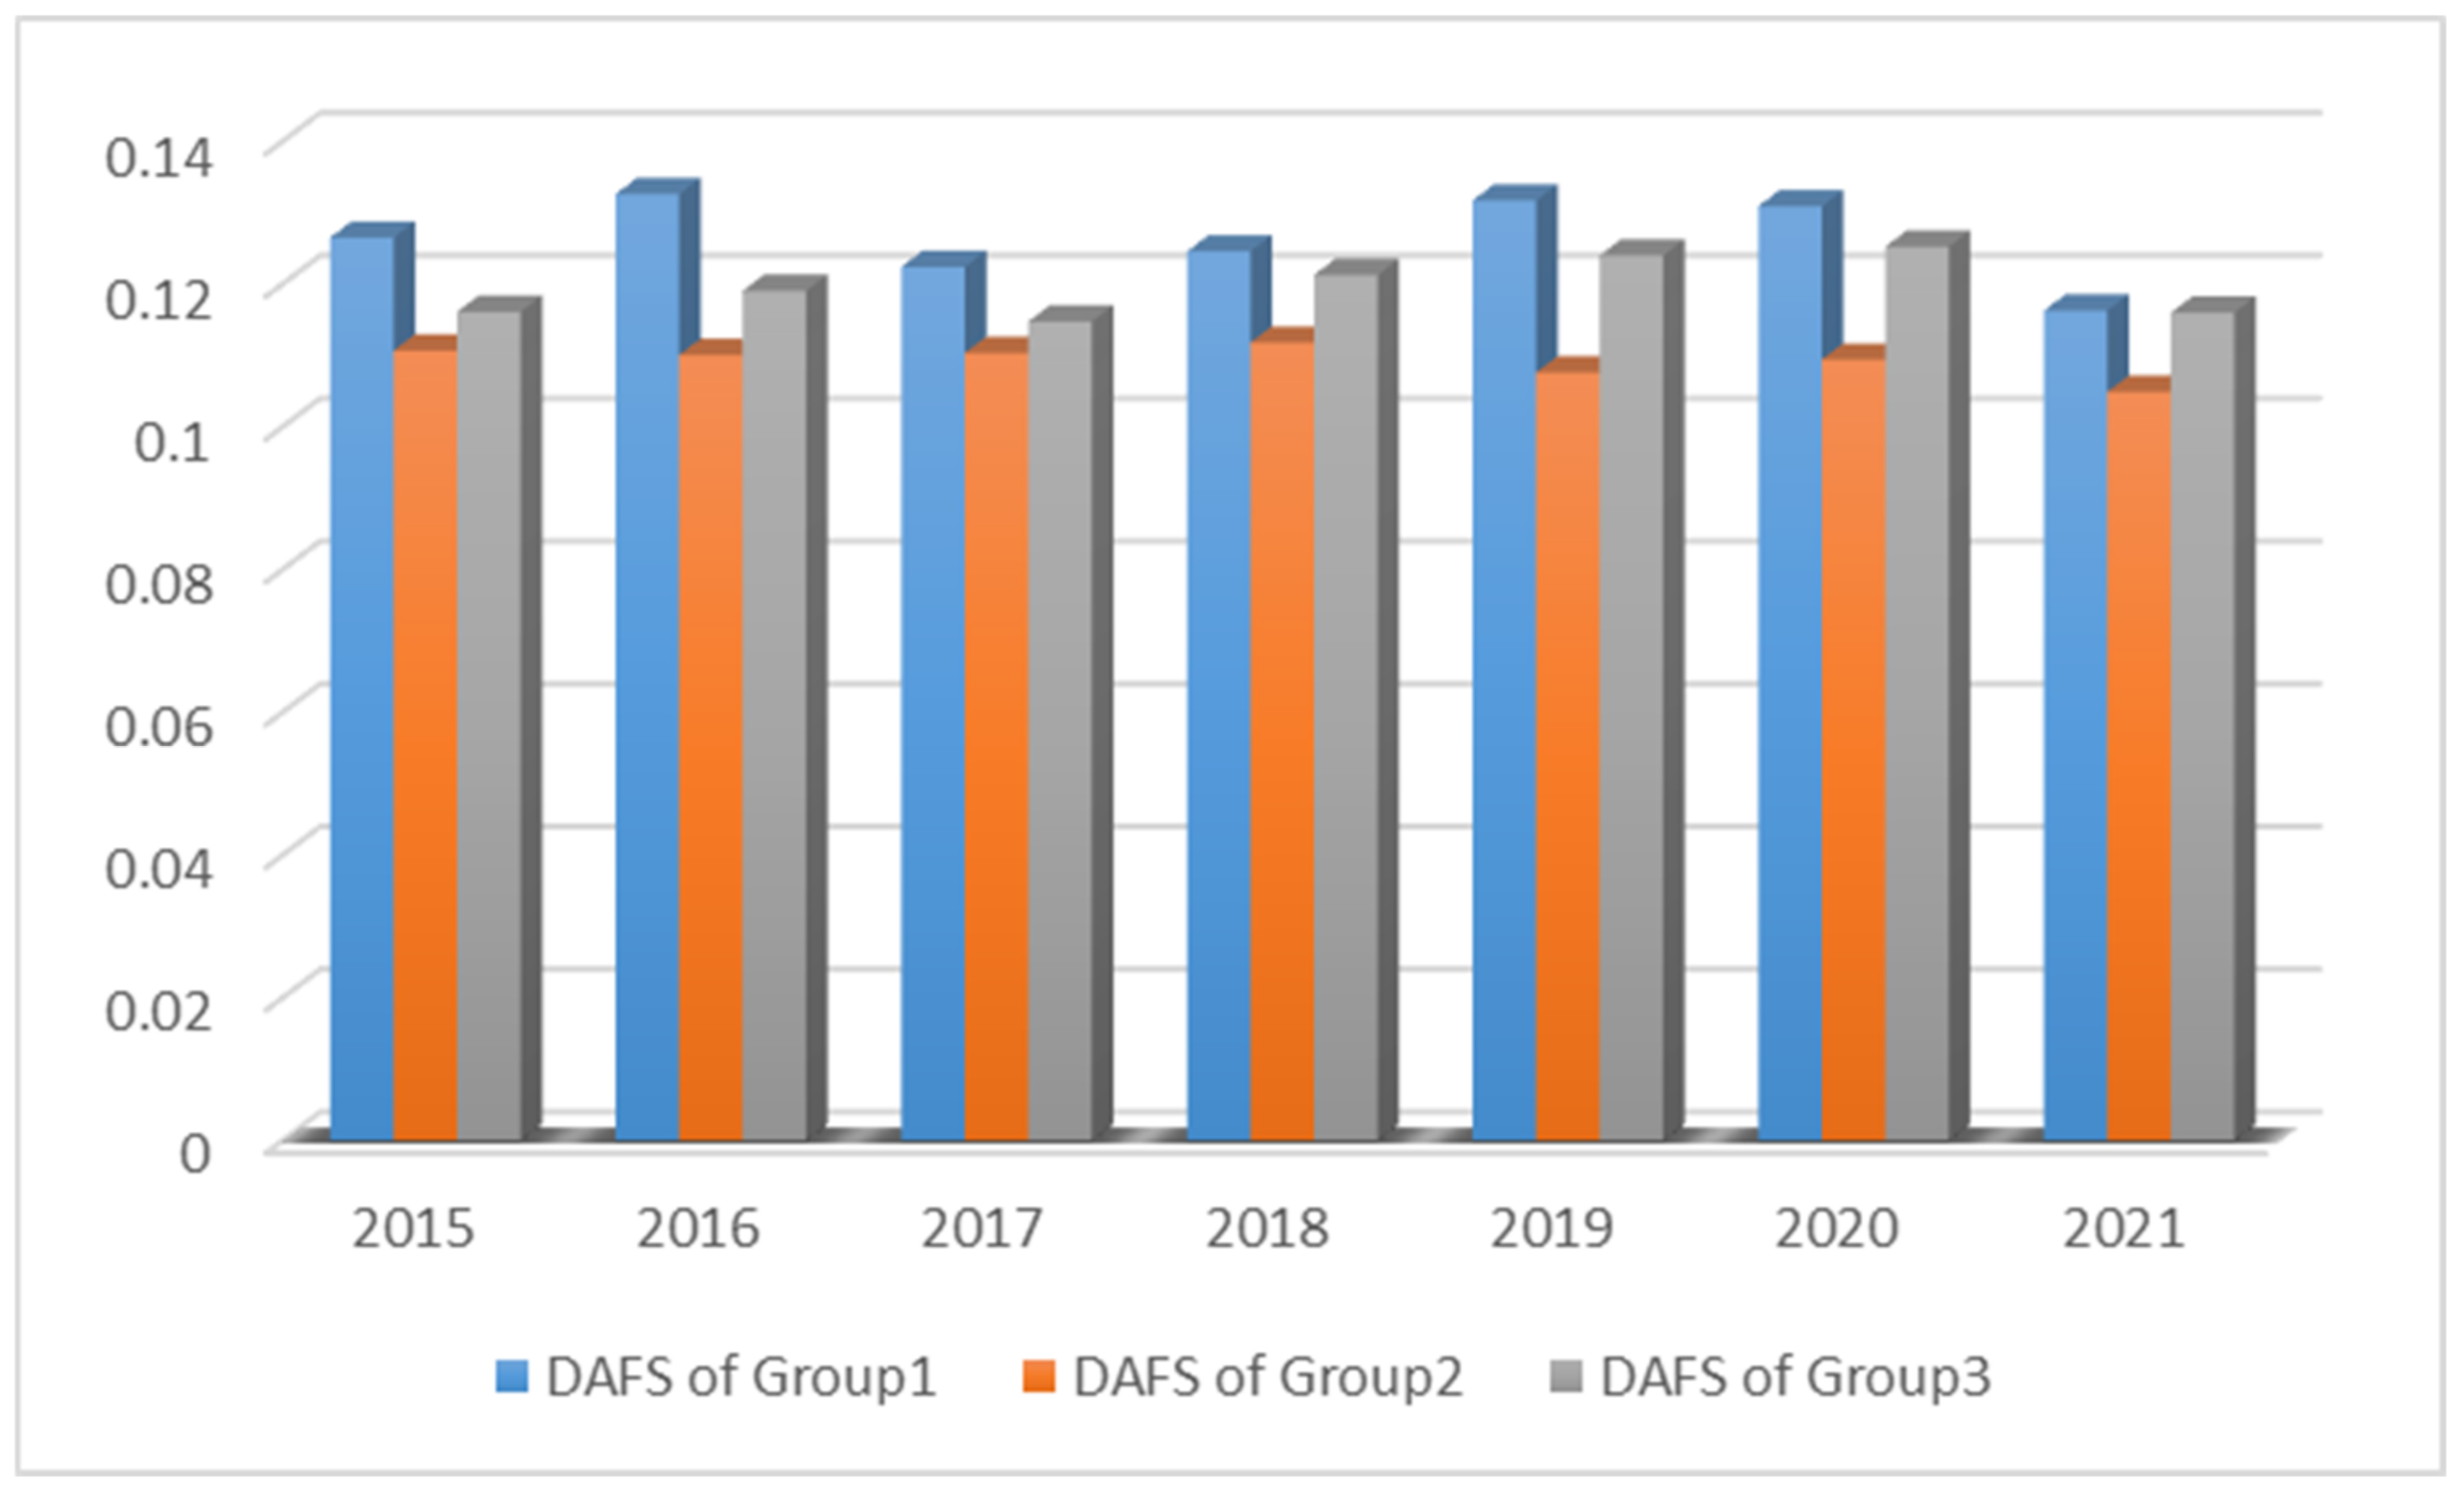
| DAFS of Group 1 | DAFS of Group 2 | DAFS of Group 3 | |
|---|---|---|---|
| 2015 | 0.126519343 | 0.110671251 | 0.116122018 |
| 2016 | 0.132630976 | 0.110073457 | 0.119074741 |
| 2017 | 0.122422637 | 0.110352681 | 0.114762524 |
| 2018 | 0.124583928 | 0.111795782 | 0.121278352 |
| 2019 | 0.131714679 | 0.107610036 | 0.12401321 |
| 2020 | 0.130910846 | 0.109419802 | 0.12523234 |
| 2021 | 0.116297515 | 0.104905896 | 0.116010143 |
| Number of Provinces with Crste Values of 1 | Number of Provinces with Vrste Values of 1 | Number of Provinces with Scale Values of 1 | Number of Provinces with DRS | Number of Provinces with IRS | |
|---|---|---|---|---|---|
| 2015 | 8 | 17 | 8 | 10 | 13 |
| 2016 | 10 | 17 | 10 | 11 | 10 |
| 2017 | 8 | 16 | 9 | 12 | 10 |
| 2018 | 8 | 16 | 8 | 12 | 10 |
| 2019 | 6 | 15 | 6 | 12 | 12 |
| 2020 | 8 | 15 | 7 | 14 | 9 |
| 2021 | 5 | 14 | 5 | 15 | 11 |
| Number of Scale Efficiency Scores of 1 in Group 1 | Number of Scale Efficiency Scores of 1 in Group 2 | Number of Scale Efficiency Scores of 1 in Group 3 | Number of Pure Technical Efficiency Scores of 1 in Group 1 | Number of Pure Technical Efficiency Scores of 1 in Group 2 | Number of Integrated Technical Efficiency Scores of 1 in Group 3 | |
|---|---|---|---|---|---|---|
| 2015 | 6 | 2 | 0 | 9 | 7 | 1 |
| 2016 | 8 | 2 | 0 | 9 | 7 | 1 |
| 2017 | 8 | 0 | 0 | 9 | 6 | 1 |
| 2018 | 7 | 1 | 0 | 9 | 6 | 1 |
| 2019 | 6 | 0 | 0 | 9 | 5 | 1 |
| 2020 | 7 | 1 | 0 | 8 | 6 | 1 |
| 2021 | 5 | 0 | 0 | 8 | 8 | 1 |
| 2015 | 2016 | 2017 | 2018 | 2019 | 2020 | 2021 | |
|---|---|---|---|---|---|---|---|
| Hebei | DRS | DRS | DRS | DRS | DRS | DRS | DRS |
| Shanxi | IRS | IRS | IRS | IRS | IRS | IRS | IRS |
| Jilin | IRS | IRS | IRS | IRS | IRS | DRS | DRS |
| Shanghai | IRS | IRS | IRS | IRS | IRS | IRS | IRS |
| Anhui | DRS | DRS | DRS | DRS | DRS | DRS | DRS |
| Jiangxi | DRS | DRS | CRS | CRS | IRS | IRS | IRS |
| Henan | DRS | DRS | DRS | DRS | DRS | DRS | DRS |
| Guangdong | DRS | DRS | DRS | DRS | DRS | DRS | DRS |
| Yunnan | DRS | DRS | DRS | DRS | DRS | DRS | DRS |
| Tibet | IRS | IRS | IRS | IRS | IRS | IRS | IRS |
| Gansu | IRS | IRS | IRS | IRS | IRS | IRS | IRS |
| Number of Provinces with Effch > 1 | Number of Provinces with Techch > 1 | Number of Provinces with Tfpch > 1 | |
|---|---|---|---|
| 2015–2016 | 7 | 27 | 28 |
| 2016–2017 | 3 | 29 | 19 |
| 2017–2018 | 7 | 31 | 31 |
| 2018–2019 | 14 | 31 | 31 |
| 2019–2020 | 13 | 31 | 30 |
| 2020–2021 | 6 | 31 | 31 |
Disclaimer/Publisher’s Note: The statements, opinions and data contained in all publications are solely those of the individual author(s) and contributor(s) and not of MDPI and/or the editor(s). MDPI and/or the editor(s) disclaim responsibility for any injury to people or property resulting from any ideas, methods, instructions or products referred to in the content. |
© 2023 by the authors. Licensee MDPI, Basel, Switzerland. This article is an open access article distributed under the terms and conditions of the Creative Commons Attribution (CC BY) license (https://creativecommons.org/licenses/by/4.0/).
Share and Cite
Li, X.; Yang, P.; Zou, Y. An Empirical Investigation of the “Mezzogiorno Trap” in China’s Agricultural Economy: Insights from Data Envelopment Analysis (2015–2021). Agriculture 2023, 13, 1806. https://doi.org/10.3390/agriculture13091806
Li X, Yang P, Zou Y. An Empirical Investigation of the “Mezzogiorno Trap” in China’s Agricultural Economy: Insights from Data Envelopment Analysis (2015–2021). Agriculture. 2023; 13(9):1806. https://doi.org/10.3390/agriculture13091806
Chicago/Turabian StyleLi, Xiaotuan, Panfei Yang, and Yuntao Zou. 2023. "An Empirical Investigation of the “Mezzogiorno Trap” in China’s Agricultural Economy: Insights from Data Envelopment Analysis (2015–2021)" Agriculture 13, no. 9: 1806. https://doi.org/10.3390/agriculture13091806
APA StyleLi, X., Yang, P., & Zou, Y. (2023). An Empirical Investigation of the “Mezzogiorno Trap” in China’s Agricultural Economy: Insights from Data Envelopment Analysis (2015–2021). Agriculture, 13(9), 1806. https://doi.org/10.3390/agriculture13091806