1. Introduction
An important step in a standard risk assessment procedure of maritime safety is the evaluation of the safety level of ships in worldwide operation on the basis of the analysis of historical data. Typically, in the maritime industry, this risk analysis is ship type dependent in view of differences in ship design and operation [
1,
2,
3]. Since the elimination of marine accidents is practically unrealistic, a reasonable target is the mitigation of accidents in terms of a reduction in the occurrence’s probability and the associated consequences while taking into consideration both passive (design) and active (operational) measures with efficiency and economic constraints. In this view and focusing on passenger ships, the potential loss of life (PLL) is an important risk metric to focus upon because it may be relatively high in comparison to other ship types in view of the high number of persons on board (POB) [
4].
The present investigation, which builds upon earlier published research work of the authors [
5], was originally motivated by a related study of Det Norske Veritas [
6] and a more recent one of the European Maritime Safety Agency [
7] in which partly contradicting trends of the level of safety of passenger ships were observed.
Systematic statistical analyses of passenger ship accidents were scarce in the past. The disastrous sinking of the Ro-Ro Passenger ship Estonia in September 1994 [
8] mobilized the whole maritime community to respond through an increased scientific effort to analyze and assess the risk of flooding and by the introduction of a series of regulatory measures to improve passenger ship’s damage stability and survivability after an accidental flooding, among them the so-called Stockholm agreement for the consideration of water on deck for Ro-Ro Passenger ships calling at European Ports [
9]. The EU-funded Thematic Network SAFER-EURORO (1997–2001) [
10] was the first to systematically review the stability characteristics of the European passenger ships fleet [
11,
12]. Comprehensive statistics of accidents of both passenger and dry cargo ships were conducted in the frame of the EU-funded project HARDER (2000–2003) [
13] that dealt with a harmonization of the international damage stability regulations for dry cargo and passenger ships on the basis of the probabilistic concept [
14]. These studies led to an amendment of SOLAS with respect to the provisions of Chapter II-1, Part B (Subdivision and Stability) in the year 2009 (SOLAS 2009) [
15] that was later on once more revised in the year 2020 (SOLAS 2020) [
16] with respect to the required subdivision index of passenger ships on the basis of results of the EU-funded project GOALDS (2009–2012) [
17,
18] and EMSA III [
19].
In the above SOLAS amendments [
15,
16], a variety of important statistical parameters was used to set up the probabilistic approach to ship’s damage stability, such as frequencies of occurrence, location, and extent of ship damages, environmental conditions; many of these statistical parameters were defined by using data also from cargo ships due to the lack of sufficient accidental data for passenger ships. The recent EU-funded project FLARE (2019–2022) [
20] confirmed the findings of other recent research projects [
17,
18,
19,
20,
21,
22], although there are notable differences in the ship sample characteristics and time frame of the various studies. On one side, present SOLAS regulations consider the side collision event as the main hazard for assessing a ship’s damage stability, whereas from the other side, the latest research proves that bottom and side grounding events contribute to about 80% of the flooding risk of passenger ships, and only about 20% is attributed to collision events [
17,
18].
This paper presents an analysis of
serious ship casualties on passenger ships in the last two decades (2000–2021). Initial casualty records and ship technical and operational data were extracted from the IHS Sea-web
® database [
23]. The paper is organized as follows: after a brief introduction, the methodology of work is presented along with the statistical sampling plan and operational world fleet at risk; a review of basic risk contributors is elaborated and discussed, namely the annual frequencies of ship accidents’ occurrence; the frequencies and characteristics of the recorded events per accident category and ship subtype; the ship’s total losses and caused fatalities. Finally, the overall outcome is discussed, and conclusions on the current level of safety of the world fleet of passenger ships are drawn.
2. Methodology of Work
The main source of processed casualty data is the IHS Sea-web
® database [
23], and the investigation pertains to all passenger ship subtypes, namely Cruise Ships, Pure Passenger ships, and Passenger Ro-Ro cargo vessels ((RoPax), including Passenger Ro-Ro Rail).
The analysis of relevant records was performed for the period 2000–2021, regardless of ship size (the minimum vessel size was set at 100 GT), and referred to ships built after the year 1980. The exclusion of older ships should support the uniformity of the statistical sample in terms of employed shipbuilding technology, even though some drastic design changes are observed in the decades after 1980, in line with relevant amendments of SOLAS. The present methodology of work is similar to that followed by the authors in an earlier conducted study on the safety level of all types of ships [
5]. However, herein focuses on passenger ships of all subtypes.
Note that processed casualty data, including the associated design and operational data, and environmental conditions, were elaborated as extracted from the IHS database [
23] while considering available textual information in data records. In some cases, however, notably those with a high number of fatalities, there were additional investigations by studying the official accident reports, searching the internet, etc. [
24,
25,
26,
27]. Furthermore, the following assumptions for the processing of raw data of the IHS database [
23] were taken into consideration:
Terminal areas include port, harbor, anchorage, and at berth
Restricted waters include restricted areas, canals, estuaries, rivers, fjords
Coastal waters include the operation in areas of less than 12 miles from the coast
Adverse weather conditions include heavy weather, hurricane, heavy swell, snow, freak seas
2.1. Sampling Plan
The casualty records extracted from the IHS Sea-web
® database while taking into account the prementioned data filtering are shown in
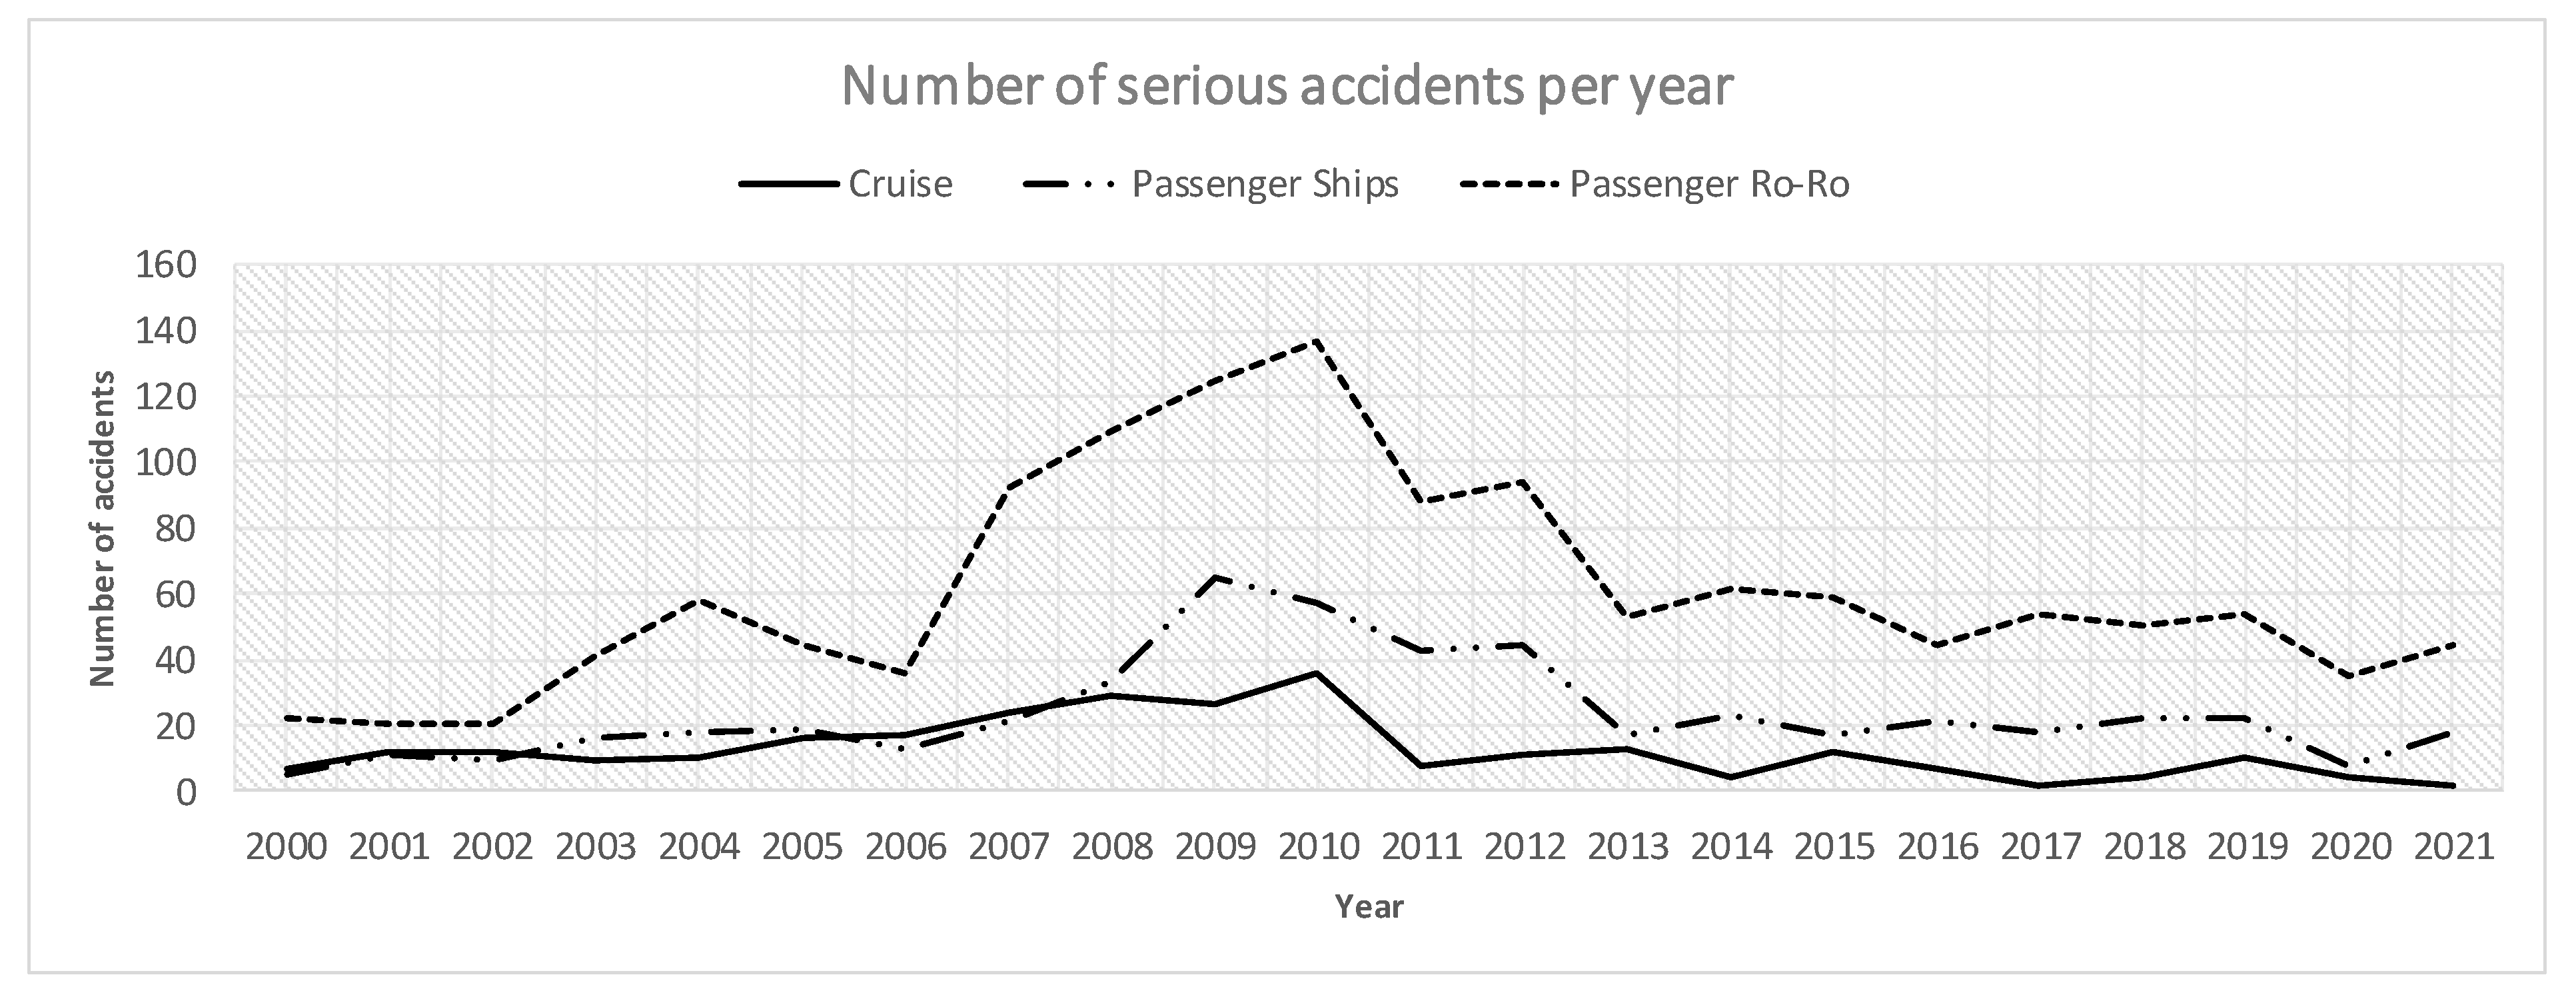
Table 1. With respect to the accident category (and the ensuing type of hazards), only accidents that can potentially lead to loss of watertight integrity were analyzed, namely Collision, Contact, Wrecked/Stranded, Fire/Explosion, Foundered, and Hull and Machinery Damages although the latter category may lead to flooding only in very limited cases. In addition, the initial sampling plan of available accident records was filtered in order to include only accidents of a serious degree of severity resulting in a sample of 2135 serious accidents within the studied period, as shown in
Table 1 and
Figure 1. Note that a
serious marine casualty is by definition a casualty that results in structural damage, rendering the ship unseaworthy or to ship breakdown, actual total loss or any other undefined situation resulting in damage or financial loss considered to be serious (IHS database [
23]). In the present paper, the notions “casualty” and “accident” are assumed to be identical.
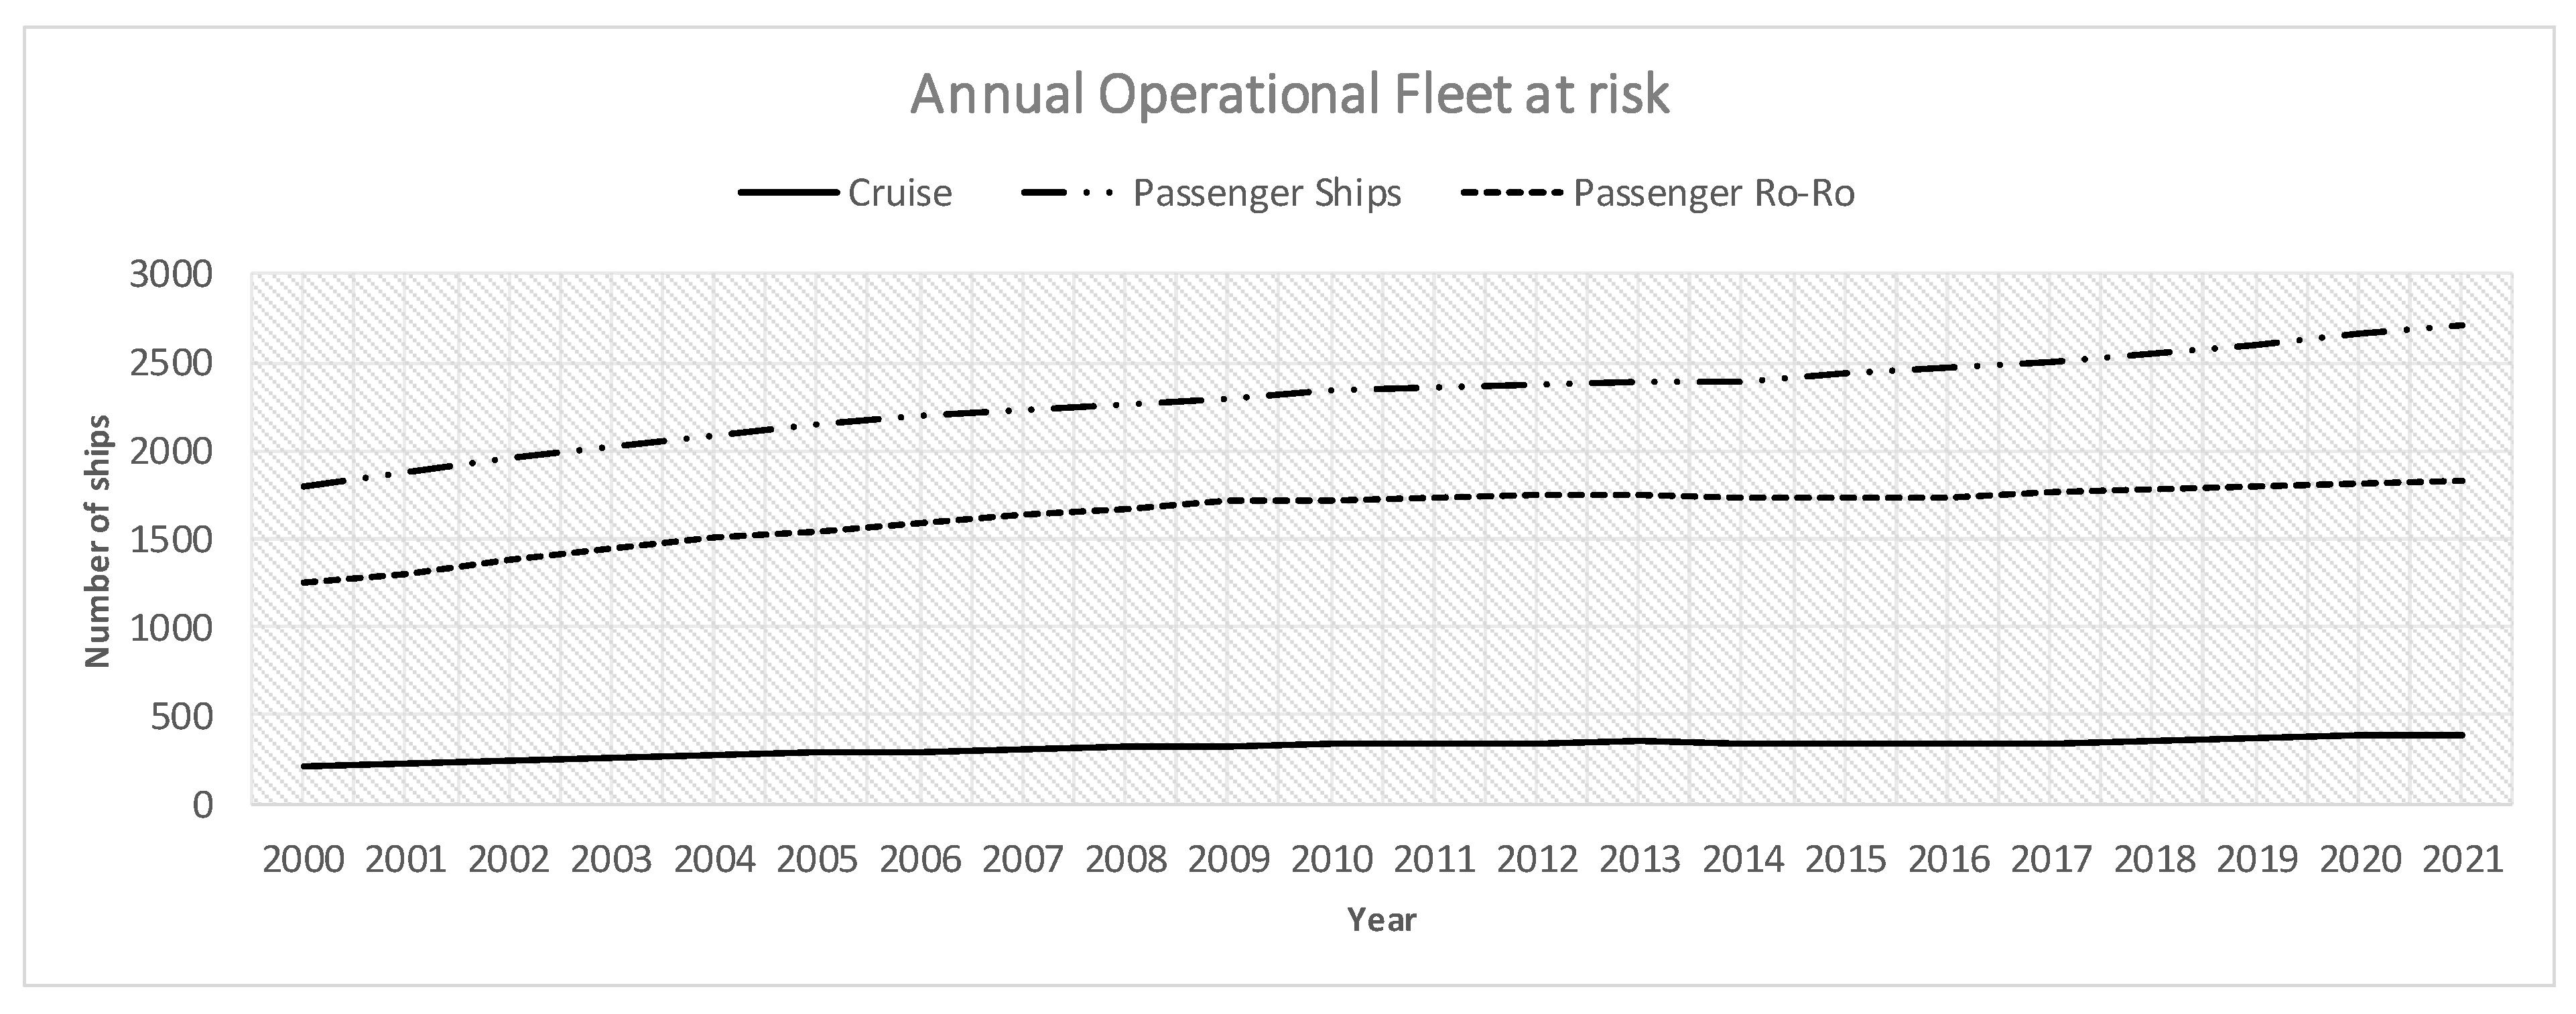
2.2. Operational Fleet at Risk
Before proceeding to the determination of accident frequency rates, the absolute numbers of accidents need to be related to the yearly operating
fleet at risk. The latter has been estimated using raw data from the IHS Sea-web
® database [
23] for all the afore-mentioned ship subtypes by considering year by year the number of ships in worldwide operation, adding the new buildings and removing the scrapings per year, see
Figure 2 and
Table 2.
2.3. Comparison with Other Sources
Historical data on ship accidents plays a decisive role in the development and quantification of risk models. Thus, they need to be carefully checked and compared with existing data from other sources. It should be pointed out, however, when comparing data, that the sampling of data has been done with the same specifications and constraints. Otherwise, data are not comparable quantitatively but possibly in qualitative terms. In the following, we list similar recent studies with their limitations and constraints:
The recent EMSA Marine Accident Report 2020 [
7] contains statistics for ships flying a flag of one of the EU Member States, or the accident occurred within EU Member States’ territorial sea or internal waters, as defined in UNCLOS, or involved other substantial interests of EU Member States. Thus, relevant data refer to only one subset of the present study.
The studies in project EMSA III [
19] and Hamann et al. [
28] present results for IACS ships built after 1982, with lengths greater than 80 m and GT ≥ 1000, and for the period 1994–2012.
The recent study of project FLARE by Mujeeb-Ahmed et al. [
29] refers to only large passenger ships, with lengths greater than 80 m and GT ≥ 3500 and for the period 1999–2020.
3. Results and Discussion
In the following, the basic contributors to the accident risk of passenger ships are presented. They refer to the frequency of accidents and their consequences. The following analysis includes the overall frequency of serious accidents, focusing on navigational accidents, the casualty analysis by accident category, and typical accident consequences for all passenger ship subtypes. Note that the frequency of accident occurrence is calculated by dividing the total number of recorded accidents for each studied period by the number of ships operating worldwide in the same period expressed in shipyears (Fleet at Risk). Likewise, fatality rates are based on the number of fatalities divided by the relevant Fleet at Risk.
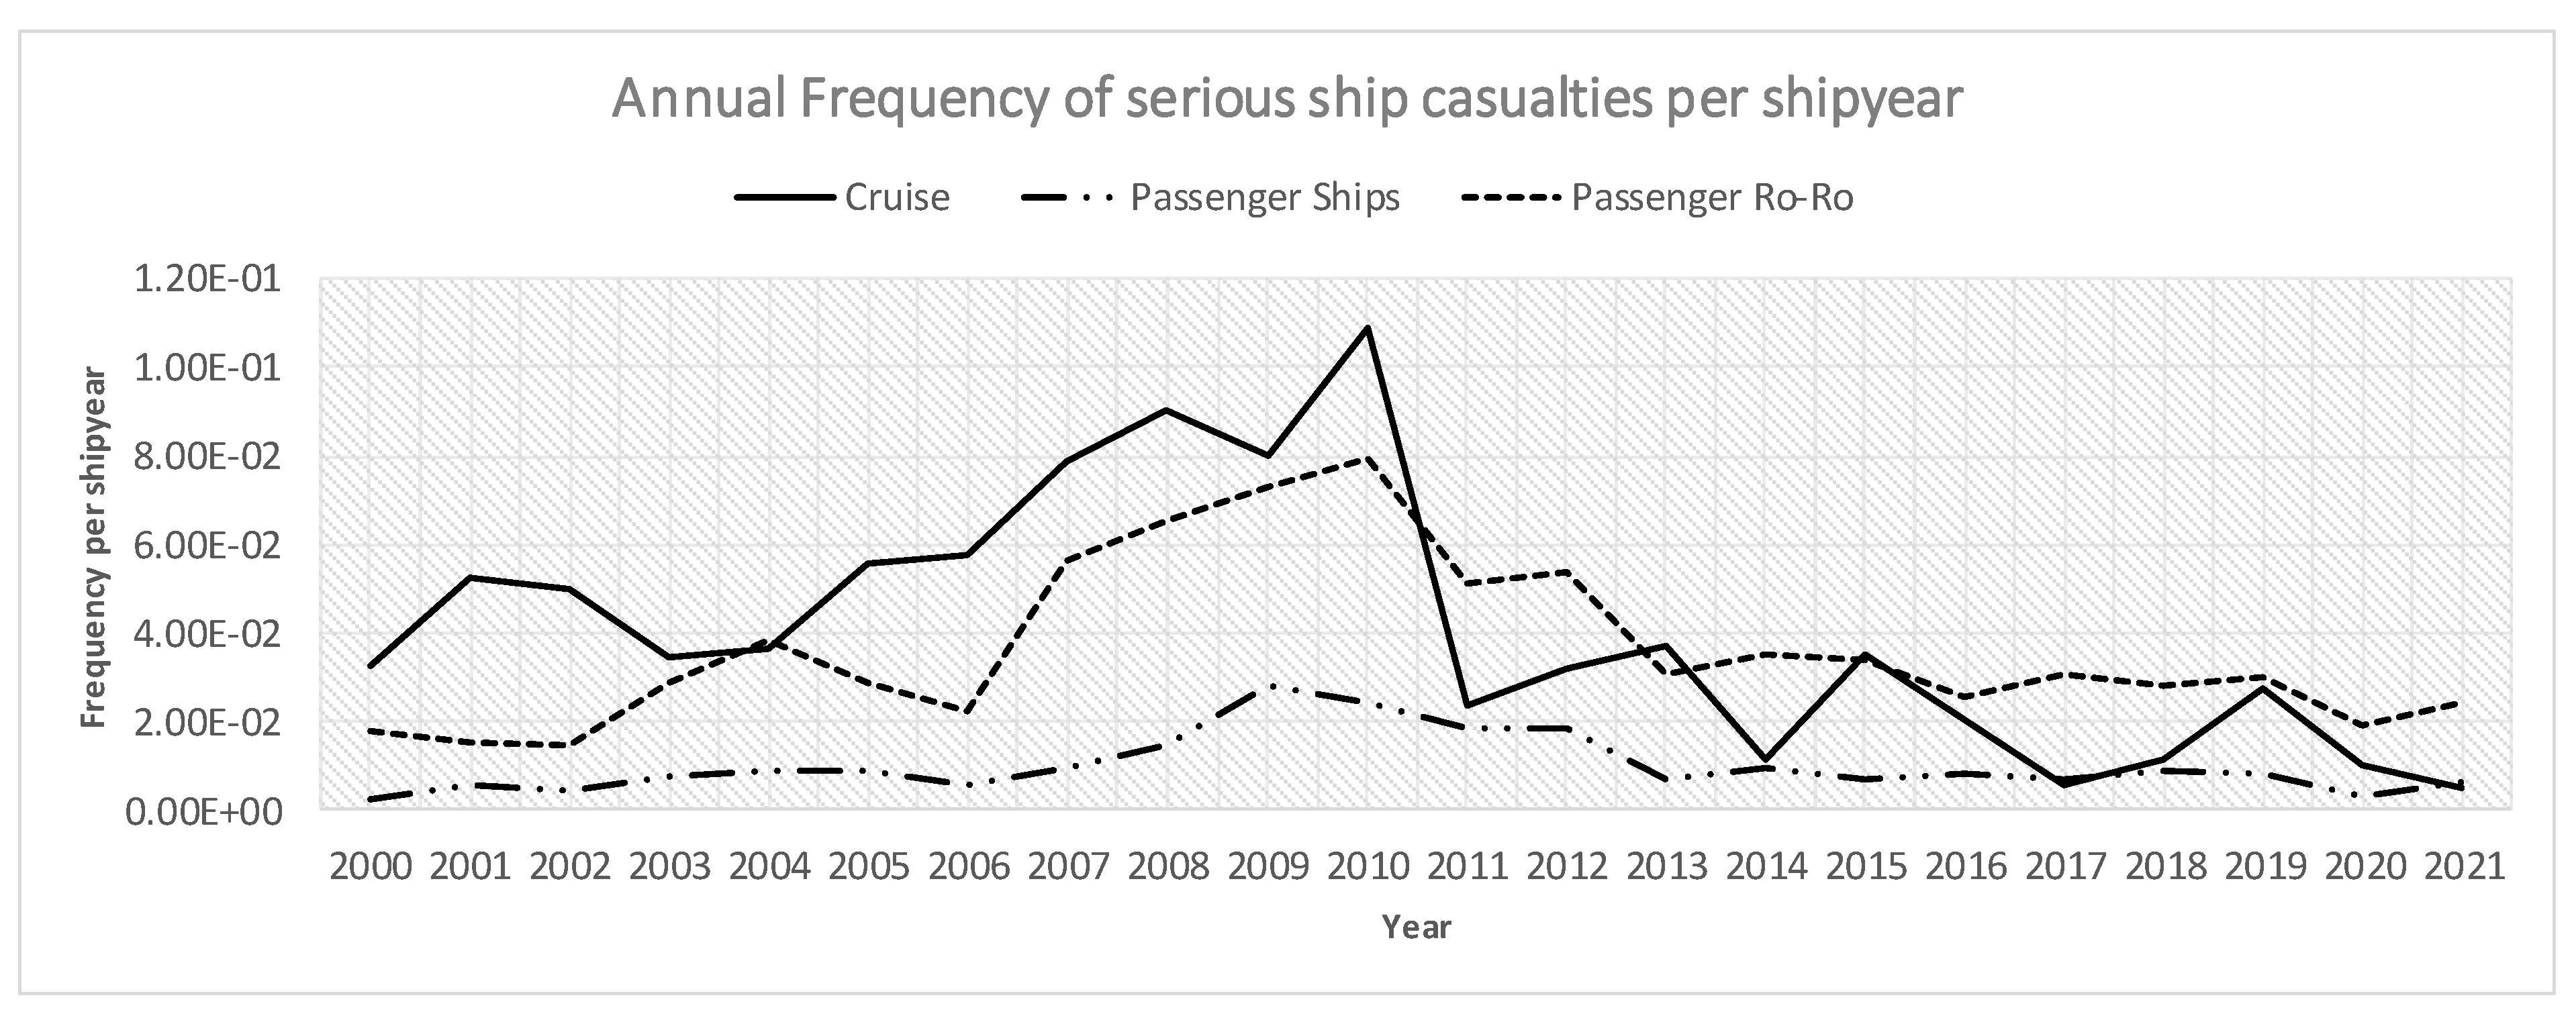
3.1. Frequency of Serious Accidents
Figure 3 presents the annual frequency of serious accidents occurrence by passenger ship subtype. A peak value appears for all ship subtypes in the years 2008–2010, whereas thereafter, frequencies have significantly decreased. According to the present study and from the perspective of the frequency of accidents, the safety level of passenger ships tends to a stabilization to lower values. It is worth mentioning that according to the EMSA Marine Accident Report 2020 [
7], in recent years, the overall safety level of passenger ships in terms of the absolute number of accidents also tends to stabilize, which is in line with the conclusion of the present study.
The observed peak values around the year 2010 for cruise ships are, to a great extent, Hull/Machinery Damage incidents. As this category of casualties mainly refers to machinery damages, this peak value may not be significant with respect to the flooding risk and potential ship loss. In the same period, other passenger ship subtypes also appear to have similar peak values, but for the same reasons as the cruise ship category.
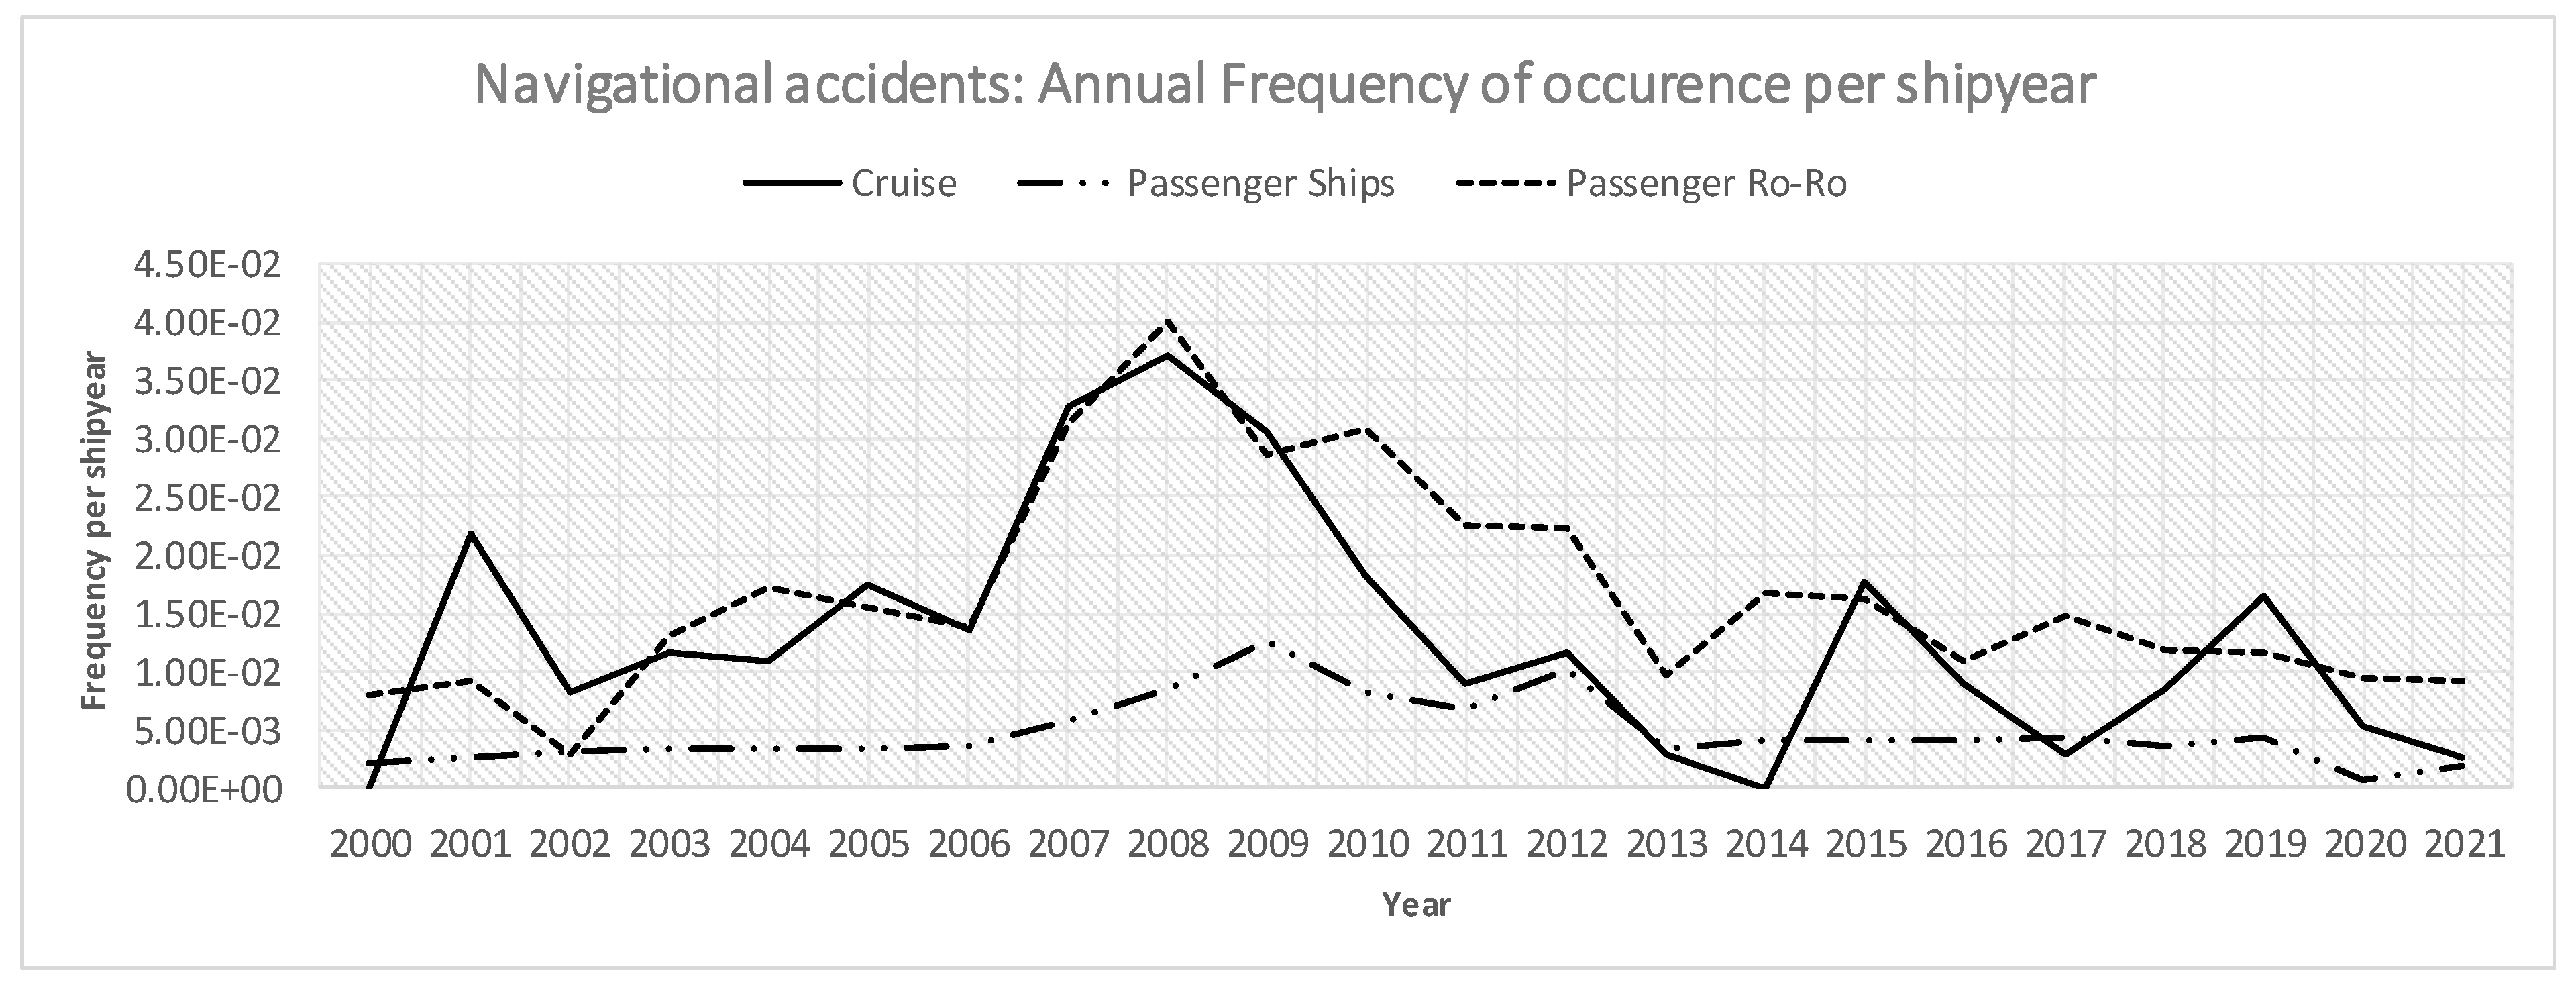
A topical peak was also exhibited in 2019 for cruise ships, while 10 out of the total 275 casualties (4%) took place in 2019. This includes a relatively high number of both navigational (collision, contact, and grounding,
Figure 4) and Hull/Machinery Damage accidents. In the following year (2020), however, the frequency dropped significantly, apparently due to the impact of the COVID-19 pandemic on cruise ship operations.
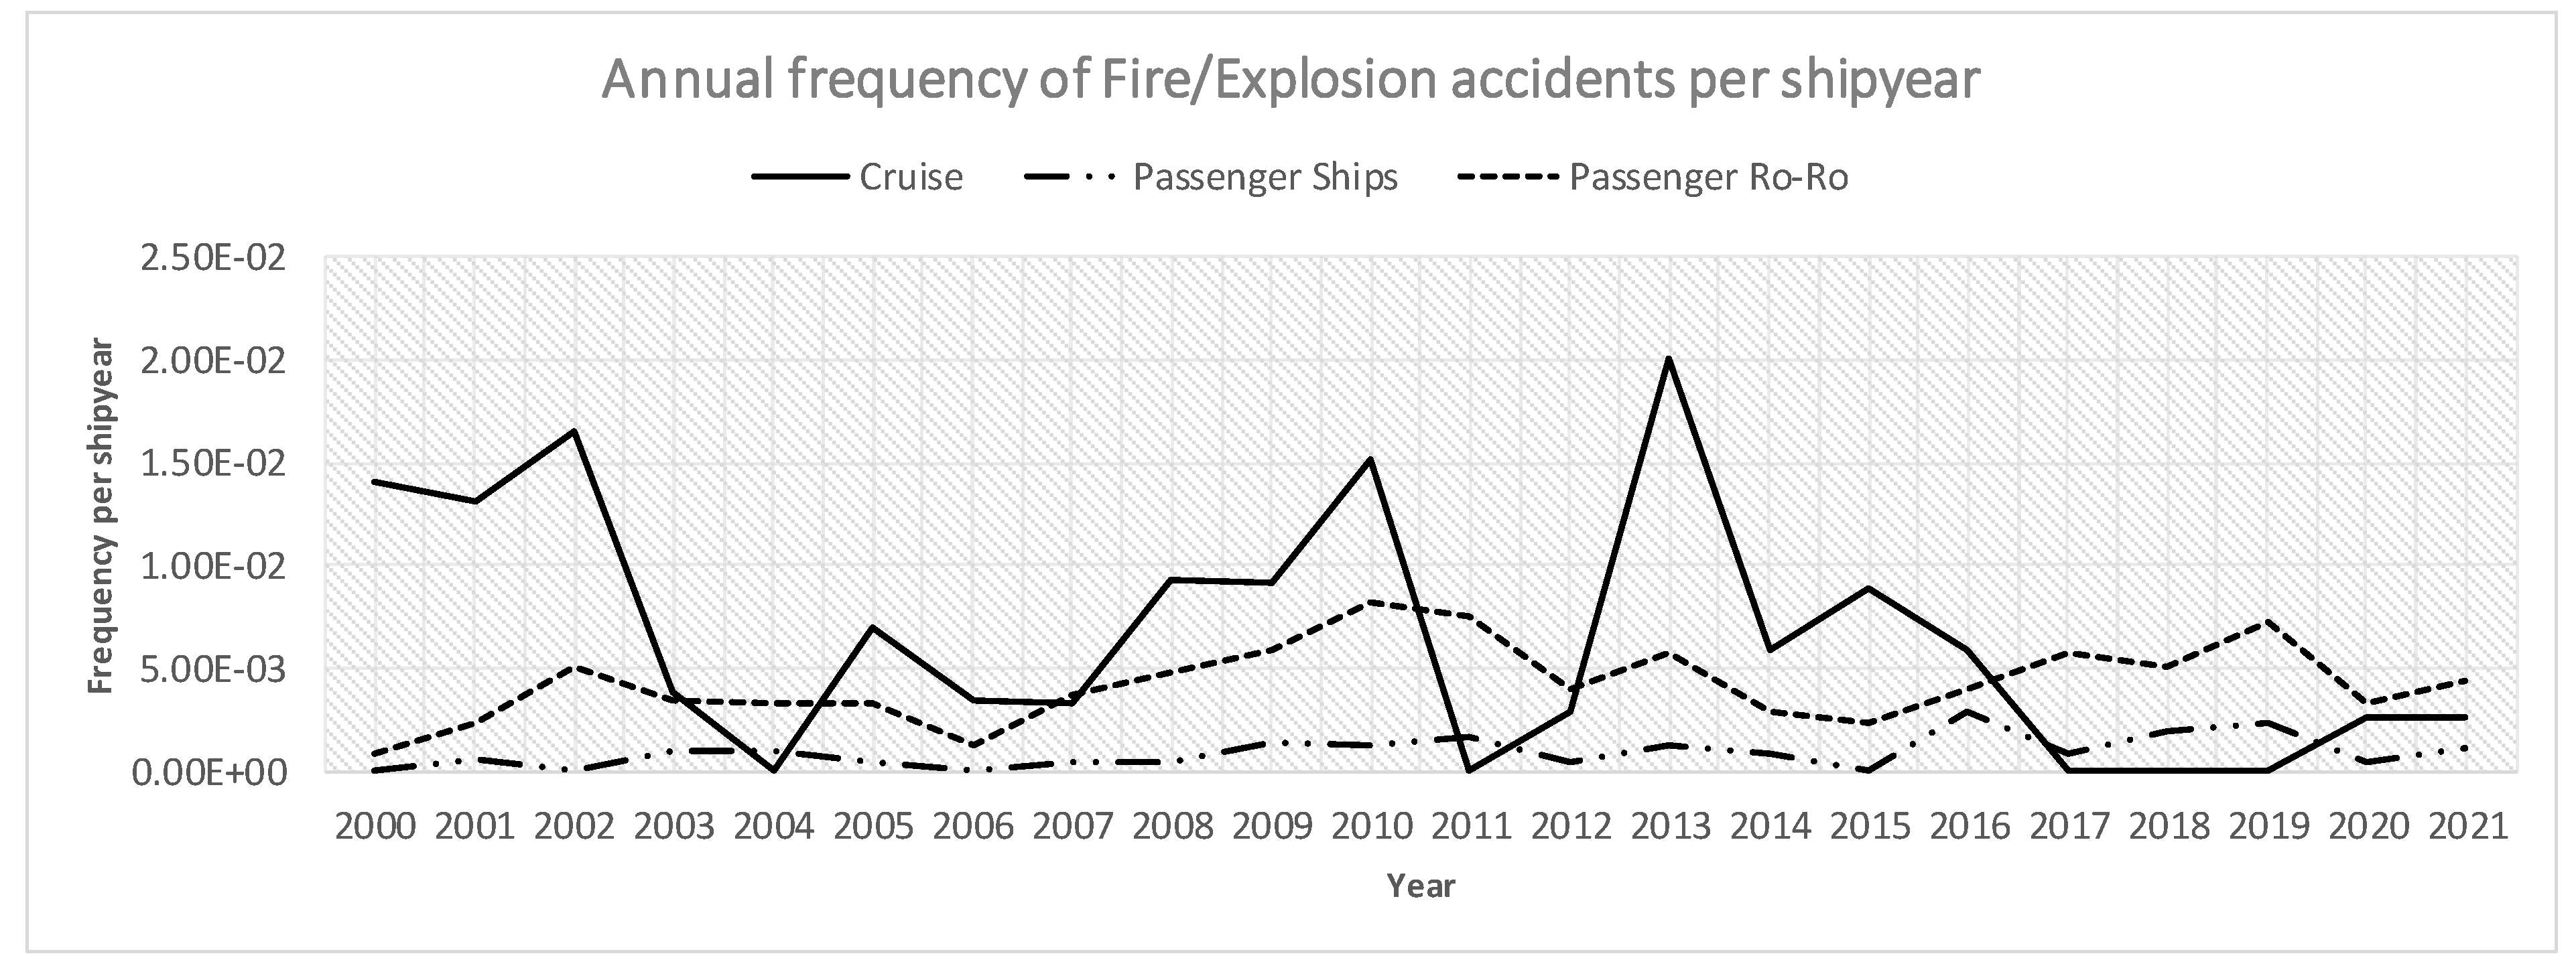
Furthermore, significantly high values for the frequency of Fire/Explosion events are observed in Cruise ships operations, as indicated in
Figure 5.
The current investigation also shows that 44% of the studied passenger ships’ serious casualties are related to the collision, contact and wrecked/stranded events, while distributed by 11% to collision events, 19% to contact events, and 14% to wrecked/stranded events. This is likewise in the EMSA report [
7] in which relevant data considered the limited period 2014–2019 for a subset of the herein investigated passenger ship fleet. According to the EMSA report, 44% of passenger ships’ casualties were related to navigational nature, while noting that loss of propulsion power was the cause for the accident in 22% of all cases.
Table 3 presents the overall frequency of serious accident occurrence by accident category for all passenger ship subtypes. The category with the highest values of frequency of occurrence is by far Hull/Machinery damage; this could be expected because the particular accident category has, by definition, a broad range of accident subcategories such as machinery failure (without generally leading to another accident type, i.e., collision, contact, grounding or foundering), failures of hull fittings/equipment and hull structural failures that resulted in a non-accidental way (e.g., by material fatigue/failure, etc.). Such casualty events present 51% of Cruise ships’ accidents, 42% and 41% for Pure Passenger ships and Passenger Ro-Ro, respectively. Note that according to [
30] and accounting for all ship types, pure hull damages, which are included in the accident category Hull/Machinery damage, present about 5% of the particular accident category, whereas the rest 95% refers to machinery damages.
Beyond high hull/machinery damage statistics, Ro-Ro Passenger ships exhibit the highest frequencies in contact events, probably due to many port calls, whereas Cruise ships show the highest frequency in Fire/Explosion casualties. Note that contact events refer by definition to ship striking or being struck by an external object, but not by another ship or the sea bottom. Cruise and Ro-Ro Passenger ships appear to have almost similar frequencies for grounding accidents (category wrecked/stranded). By adding the groundings to the contact events, which may all lead to a loss of the ship’s watertight integrity (risk of flooding), the total frequency of contacts/groundings is about three times the frequency of collision accidents.
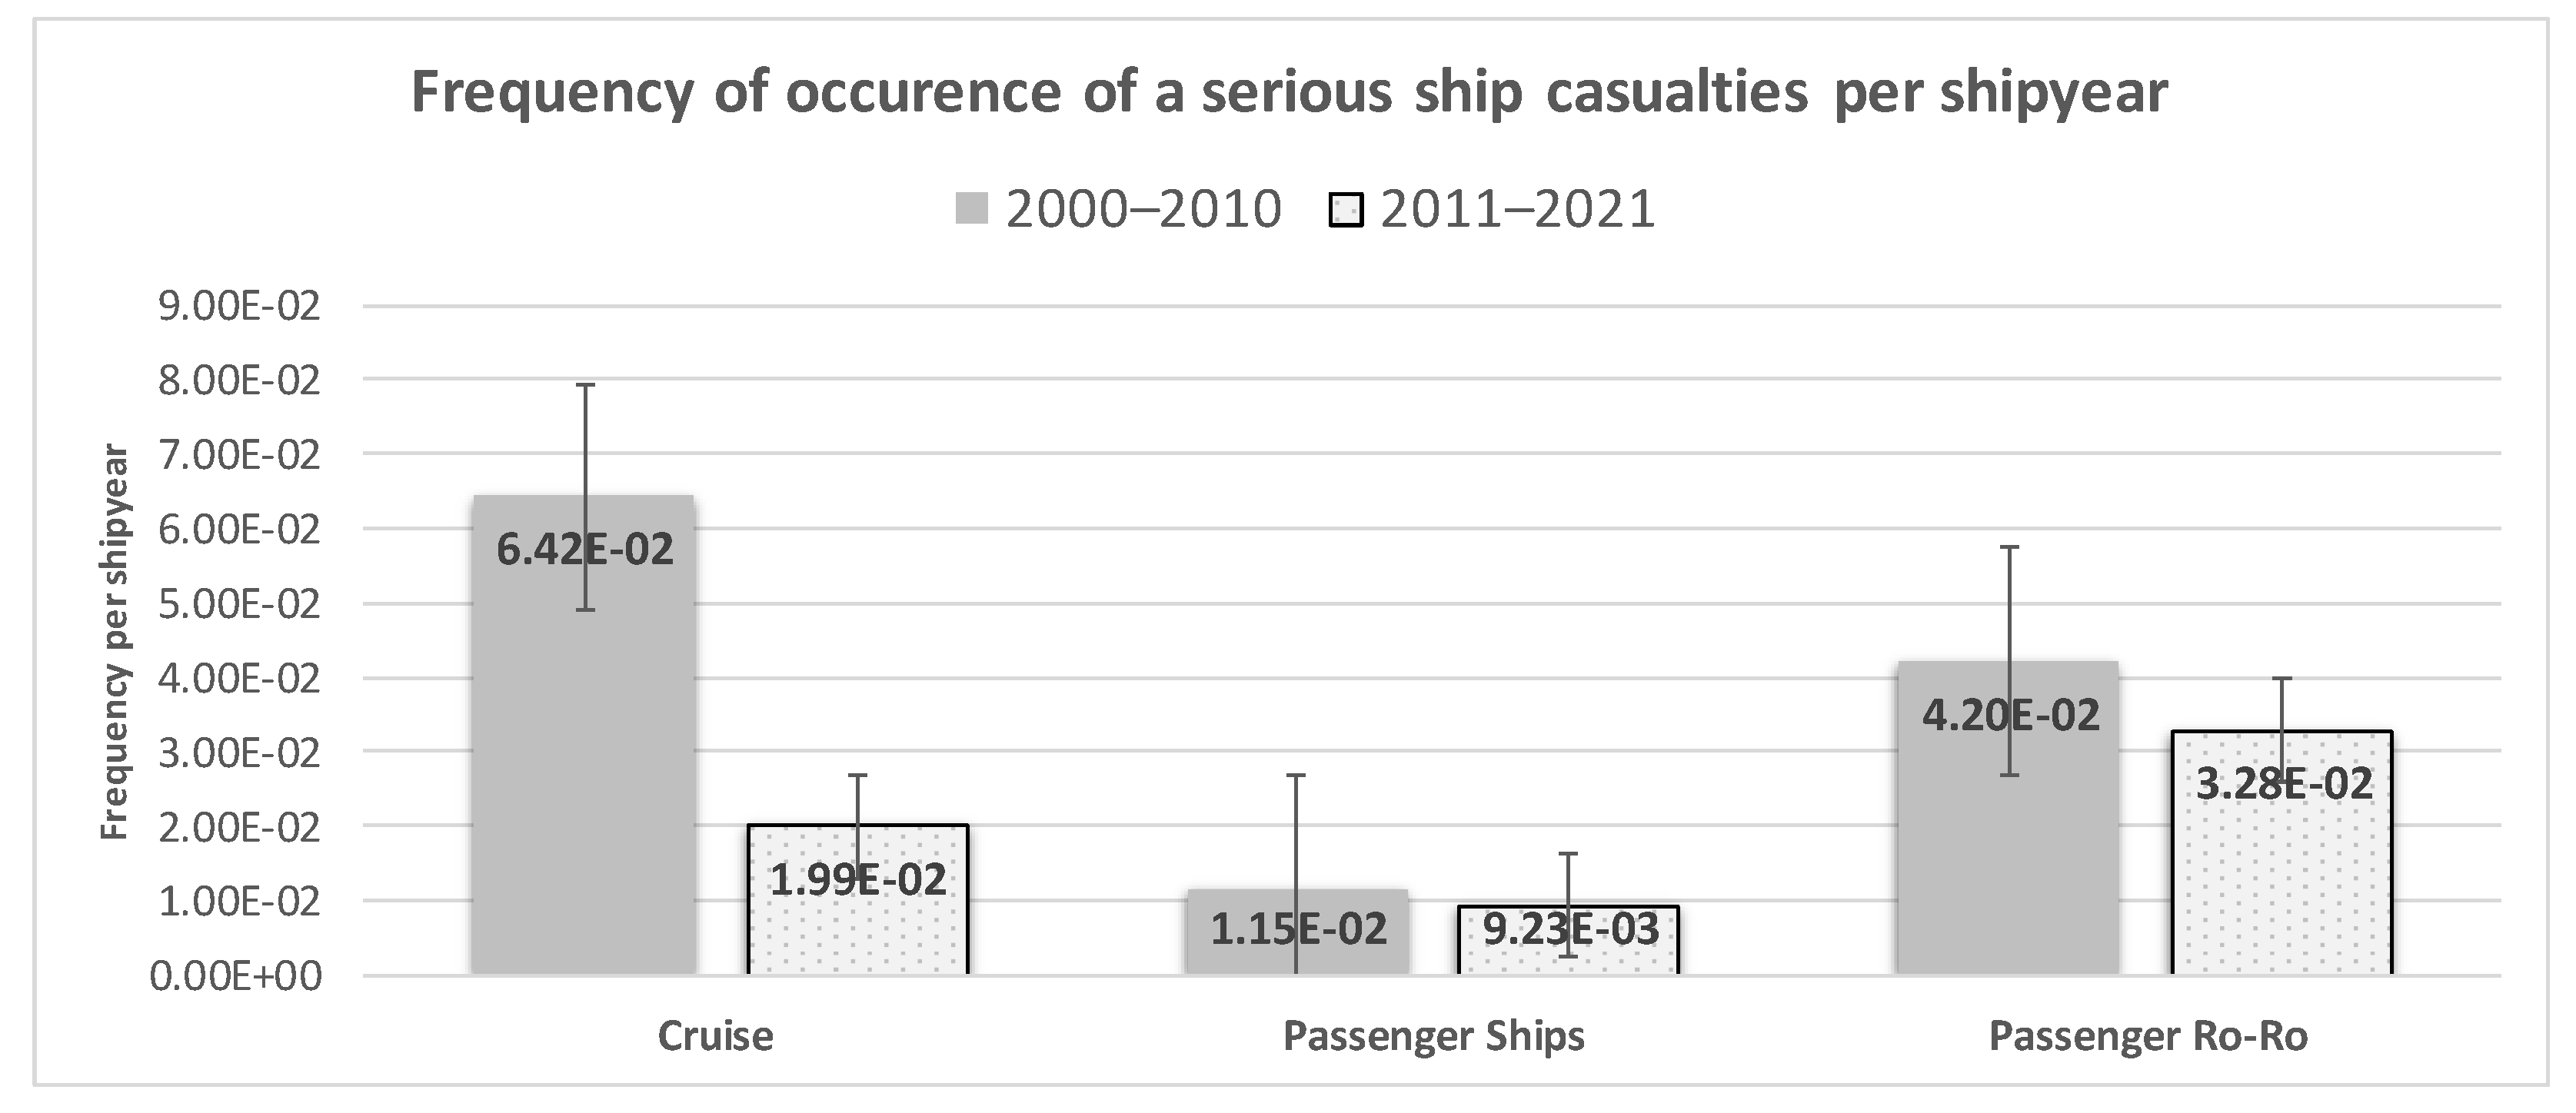
Figure 6 presents the overall frequency of occurrence of serious accidents for the decade 2000–2010 and for the decade 2011–2021. Focusing on the last decade, 2011–2021, there is a remarkable reduction in the overall frequency of occurrence, especially for Cruise ships, whereas Passenger Ro-Ro ships appear to have the highest frequency (3.28 × 10
−2) among the studied passenger ship subtypes in the last decade. The estimated uncertainty ranges of shown frequency data, which were obtained after a standard data series error analysis, are significant, especially for the lower values of shown frequencies observed for pure passenger ships, and this is due to the scarcity of available data, what is inherent to the statistics of data of passenger ship accidents, that are comparably low in terms of absolute numbers.
3.2. Analysis by Ship Subtype
In the following, a statistical analysis of ship navigational (collision, contact, and grounding) casualties per passenger ship subtype is elaborated concerning the location of the incident, environmental conditions at the time of the incident, and the ship’s total loss cases. Furthermore, the overall frequency of accident occurrence is estimated for SOLAS ships only (GT > 499), and the results are compared with [
28]. Finally, the investigation was repeated, taking into account the exclusion of two cases of non-compliant ships with catastrophic consequences. The non-compliance was justified by clear evidence in relevant accident investigation reports [
26,
27].
3.2.1. Cruise Ships
Cruise ships were involved in 22 collision events within the studied period 2000–2021. The majority of these accidents (75%) occurred in terminal areas (port), noting that 75% occurred under adverse weather conditions (strong winds). Furthermore, there was no total ship loss because of a collision. Regarding the contact events, 34 incidents were registered, from which more than half (55%) occurred in terminal areas (port), with 78% under adverse weather conditions. Stranded/wrecked cases present 40% of navigational accidents (collision, contact and stranded), from which 49% occurred in restricted waters, 30% in open sea, and 21% in terminal areas. Five (5) ship total losses were registered due to stranding in restricted/terminal areas or coastal waters (one case), all under good weather conditions.
3.2.2. Pure Passenger Ships
Pure Passenger ships were involved in 61 collision events within the studied period 2000–2021. The majority of these accidents (70%) occurred in terminal or restricted areas. Regarding the impact of weather conditions during the accident, there is a lack of information on 24 accidents; therefore, no conclusion can be derived due to the uncertainty of the particular sample. The majority of the remaining accidents (23%) occurred under poor visibility (fog/rain) and 7% under adverse weather. Three (3) ships’ total losses were registered due to collisions; two (2) cases in restricted and terminal waters and one (1) case in open sea under poor visibility. Open sea is by definition the area of more than 12 miles from the coastline.
Regarding contact events, 76 incidents were registered, of which (63%) occurred in terminal areas, 14% in restricted waters, and 23% in the open sea. There was no available weather information for 87% of cases. Three (3) ships’ total losses were reported, all in terminal or restricted waters.
In 103 cases of stranded/wrecked incidents, the vast majority (70%) occurred in restricted waters under adverse weather conditions and 28% in open sea, from which 83% occurred in poor visibility and under adverse weather conditions. Five (5) ships’ total losses were registered. All of them occurred in restricted and terminal waters under adverse weather conditions.
3.2.3. Passenger Ro-Ro Ships
Passenger Ro-Ro ships were involved in 145 collision events. The majority (58%) occurred in terminal areas, from which 63% occurred under adverse weather conditions and 14% under poor visibility. 22% of collision events occurred in the open sea and 17% in restricted waters. One (1) collision event led to the ship’s total loss in terminal areas under good weather conditions, namely the Passenger Ro-Ro ship Wihan Sejahtera (IMO 8512358) that collided with a Dredge Barge and sank in terminal areas in good weather conditions in 2015.
Regarding contact events, 96% of the cases occurred in terminal and restricted areas, from which 83% occurred under adverse weather conditions. Four (4) incidents led to the ship’s total loss; all occurred in restricted and terminal areas (no weather data available).
Within the studied period, 81% of stranded/wrecked cases occurred in restricted waters and terminal areas, and 73% of these cases occurred under adverse weather conditions. Ten (10) ships’ total losses were registered without available weather data for the majority of cases.
3.3. Ship Total Losses
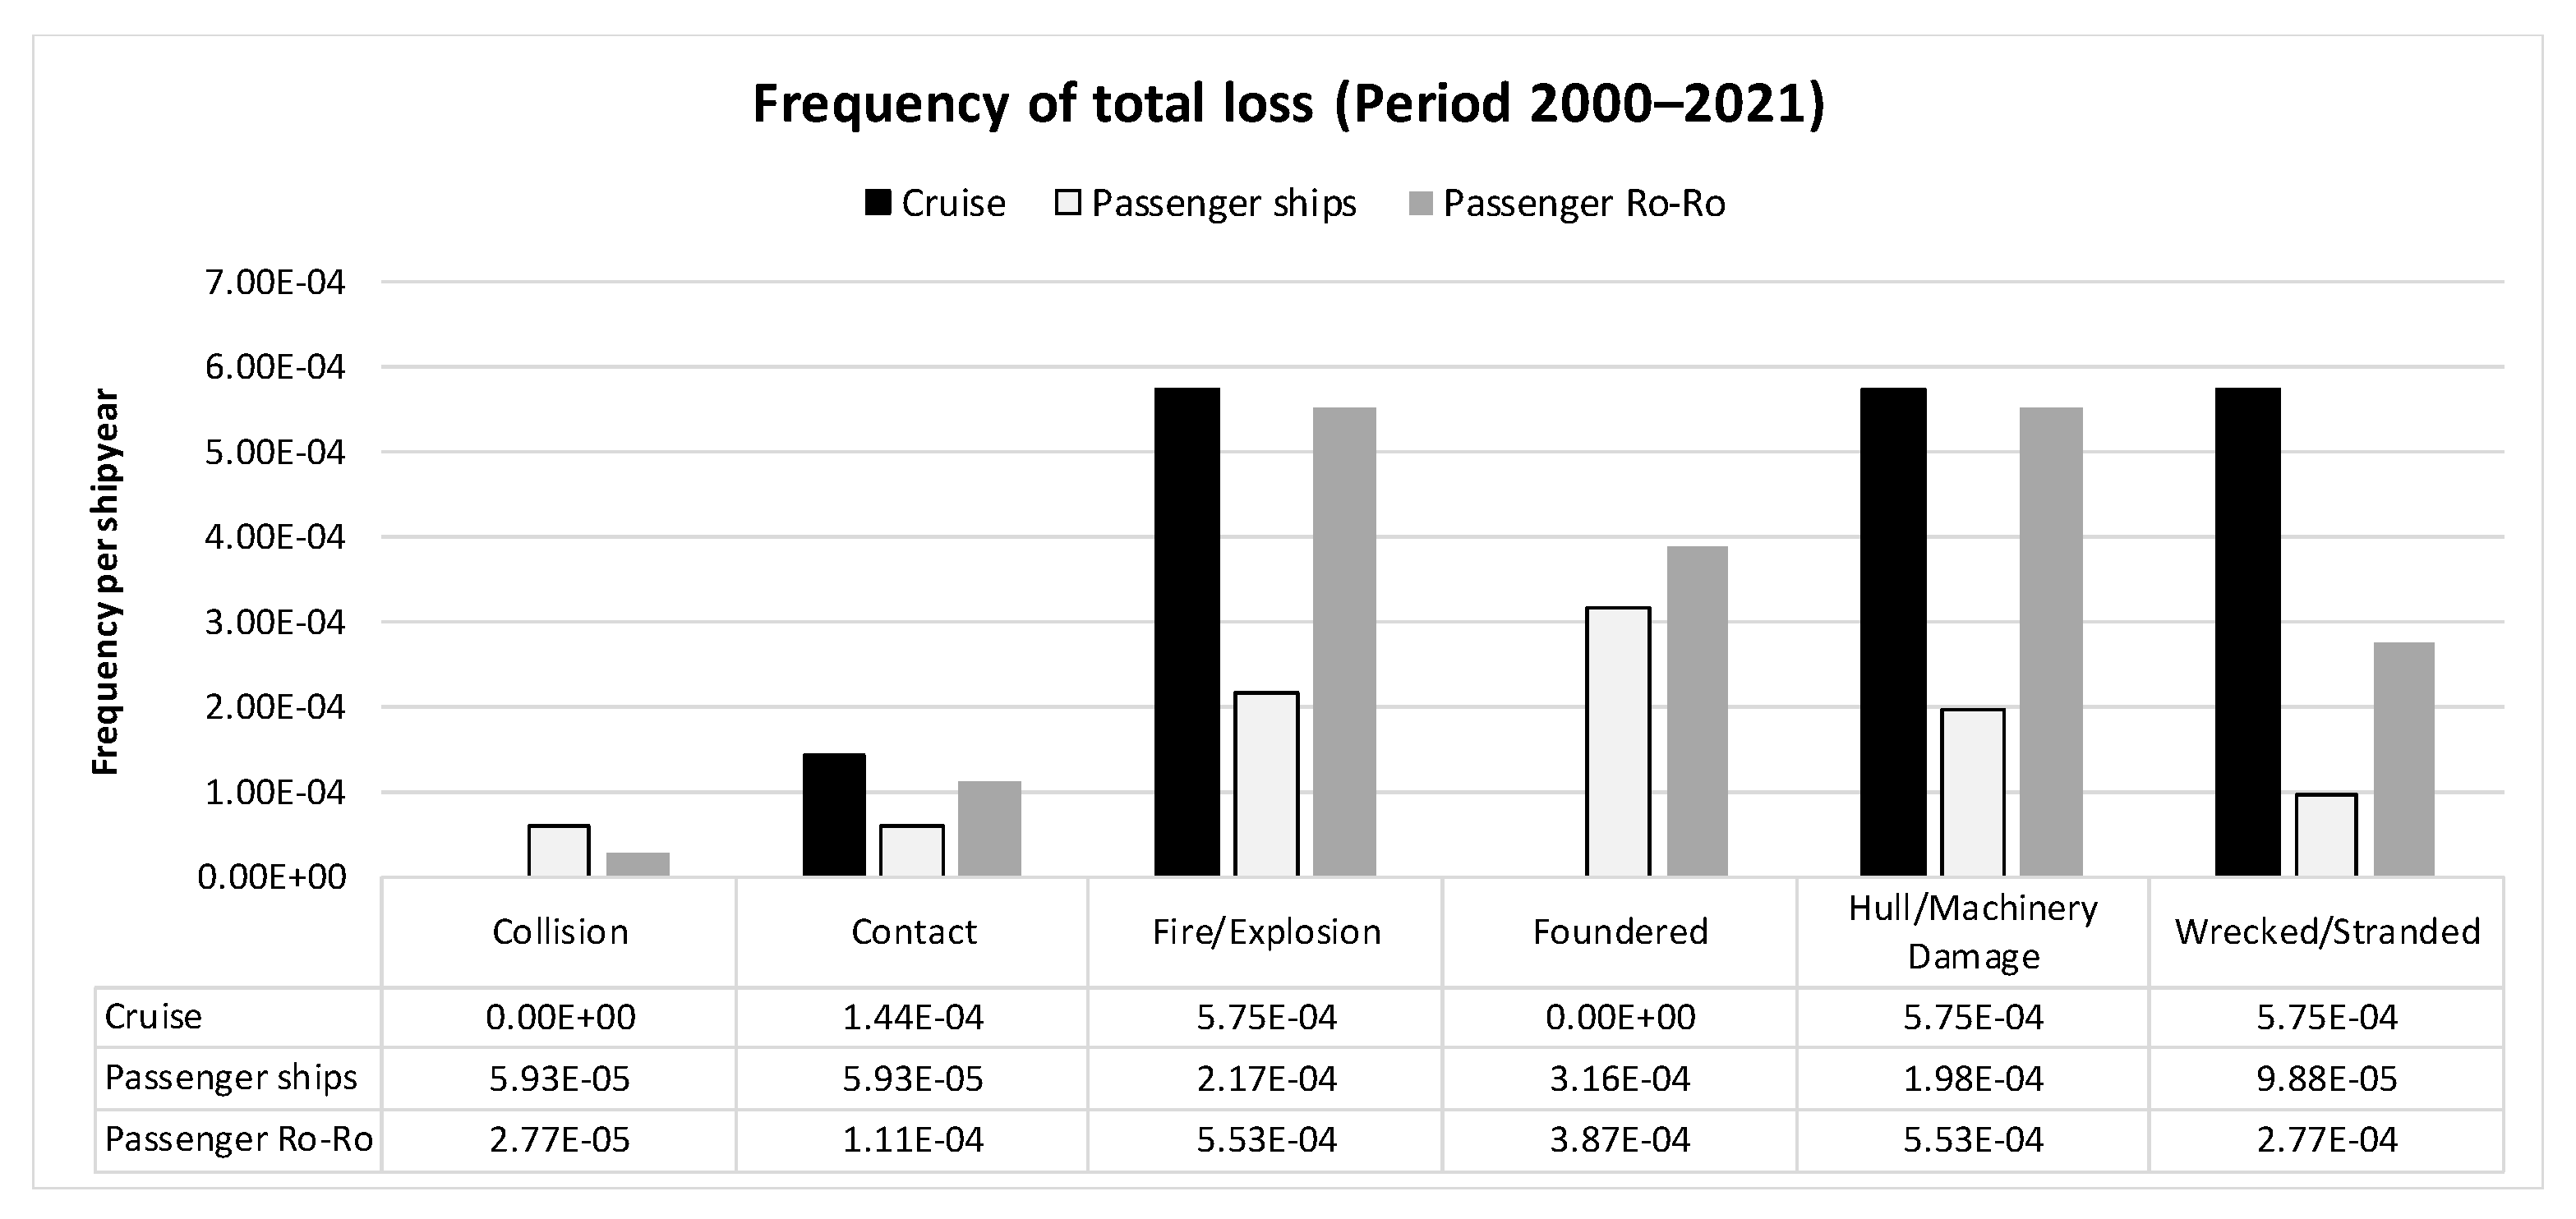
The analysis of ship total losses can provide some insight into how often, and disastrous a catastrophic event happens. Within the studied period and accounting for all studied accident categories, the frequencies of ship total losses by ship subtype are given in
Figure 7. It is observed that although the frequency of accident occurrence has a declining trend in the last decade, 2011–2021 (
Figure 6), the frequency of ship’s total losses has increased for all passenger ship subtypes in the same period,
Table 4.
High frequencies of ship total losses due to Hull/Machinery damages are noted in the studied period 2000–2021,
Figure 7. These total losses refer both to ship sinkings, following the Hull/Machinery damage as an initial accident event, and to economic total losses (laid-up, recycled/scrapping). Focusing on Cruise ships, all total losses (100%) due to Hull/Machinery damage refer to aged ships older than 20 years, whereas the corresponding percentage for (Pure) Passenger ships is 40% and for Ro-Ro Passenger ships is 90%. In addition, Cruise ships show a high frequency of ship’s total losses due to Wrecked/Stranded and Fire/Explosion, while no collision event has led to a cruise ship’s total loss. (Pure) Passenger ships exhibit a high frequency of total loss due to Foundered and Fire/Explosion. Passenger Ro-Ro ships present a relatively high frequency of ship’s total loss in cases of Fire/Explosion and Foundered, while a very low frequency for collision events was determined.
3.4. Fatalities
Table 5 presents the number of registered fatalities (“killed” and “missing” persons) per ship subtype. Within the studied period (2000–2021), 4050 persons on board passenger ships were lost, of which 84% is attributed to Passenger Ro-Ro ships.
Regarding Cruise ships, 48 fatalities were recorded within the period 2000–2021, 67% of them derived from one (1) grounding event (Costa Concordia (Costa Concordia (IMO 9320544) was involved in a stranding incident on 13 January 2012 in good weather conditions)).
Pure Passenger ships presented 606 fatalities, with 90% of them mainly coming from two (2) catastrophic events, both under adverse weather conditions, namely the Skagit (IMO 8645284) vessel sank in adverse weather conditions in 2012, resulting in 293 fatalities, while in service in Tanzania and the Digul (IMO 889549) sank in adverse weather conditions in 2005, resulting in 174 fatalities while in service in Indonesia.
Regarding Passenger Ro-Ro ships, 51% of registered fatalities arise from foundering events and 24% from groundings. Furthermore, values for the Potential Loss of Life (PLL, fatalities per shipyear) are presented, which were deduced from the available statistical dataset (Historical Loss of Life). Focusing on the 3396 fatalities of Passenger Ro-Ro ships reported in the period 2000-2010, the vast majority (over 50%) of them came from just two specific accidents:
In the last decade (2011–2021), 588 fatalities were registered in total, from which 304 fatalities came from one (1) foundering incident (Sewol, IMO 9105205) [
26].
Looking at the observed fatality rates in
Table 5, there is no significant difference over the two decades studied. However, just one catastrophic accident can change the rates dramatically. The frequency of fatalities per shipyear distributed by accident category is presented in
Table 6.
According to [
7], during the period 2014–2019, the number of fatalities of persons on board presented a declining trend, summing up to 42 lost lives, while 10 times, namely 453 fatalities, were recorded in the current study. This difference is attributed to the different sampling plan, noting that the EMSA 2020 study contains only statistics for ships flying an EU Member State flag or ships being operated in EU waters, whereas the current study refers to worldwide operated ships, both internationally and domestically operated (
Section 2).
Looking closer into the Passenger Ro-Ro ships, foundering events, groundings (wrecked/stranded), and fire/explosion events contribute significantly to the observed fatality rate values. This may be related to the operational profile of Passenger Ro-Ro ships which are generally certified for a high number of persons on board. Cruise vessels also exhibit relatively high fatality rates in grounding events, mainly because of two factors; their frequent operation in coastal waters and the possible impact of environmental conditions such as strong winds and waves that may have affected the ship’s safe maneuvering and docking. The same applies to Passenger Ro-Ro ships with daily services in confined waters, ports, and restricted/coastal waters. Foundering events and associated fatalities mainly occur under adverse weather conditions in relation to the ship’s size and very often improper/careless operation.
As indicated in
Table 6, Fire/Explosion incidents also play a prevailing role in Passenger Ro-Ro ship accidents. Fire safety on the particular ship subtype is one of the main areas where continuous effort is required by industry and administrations [
21,
31].
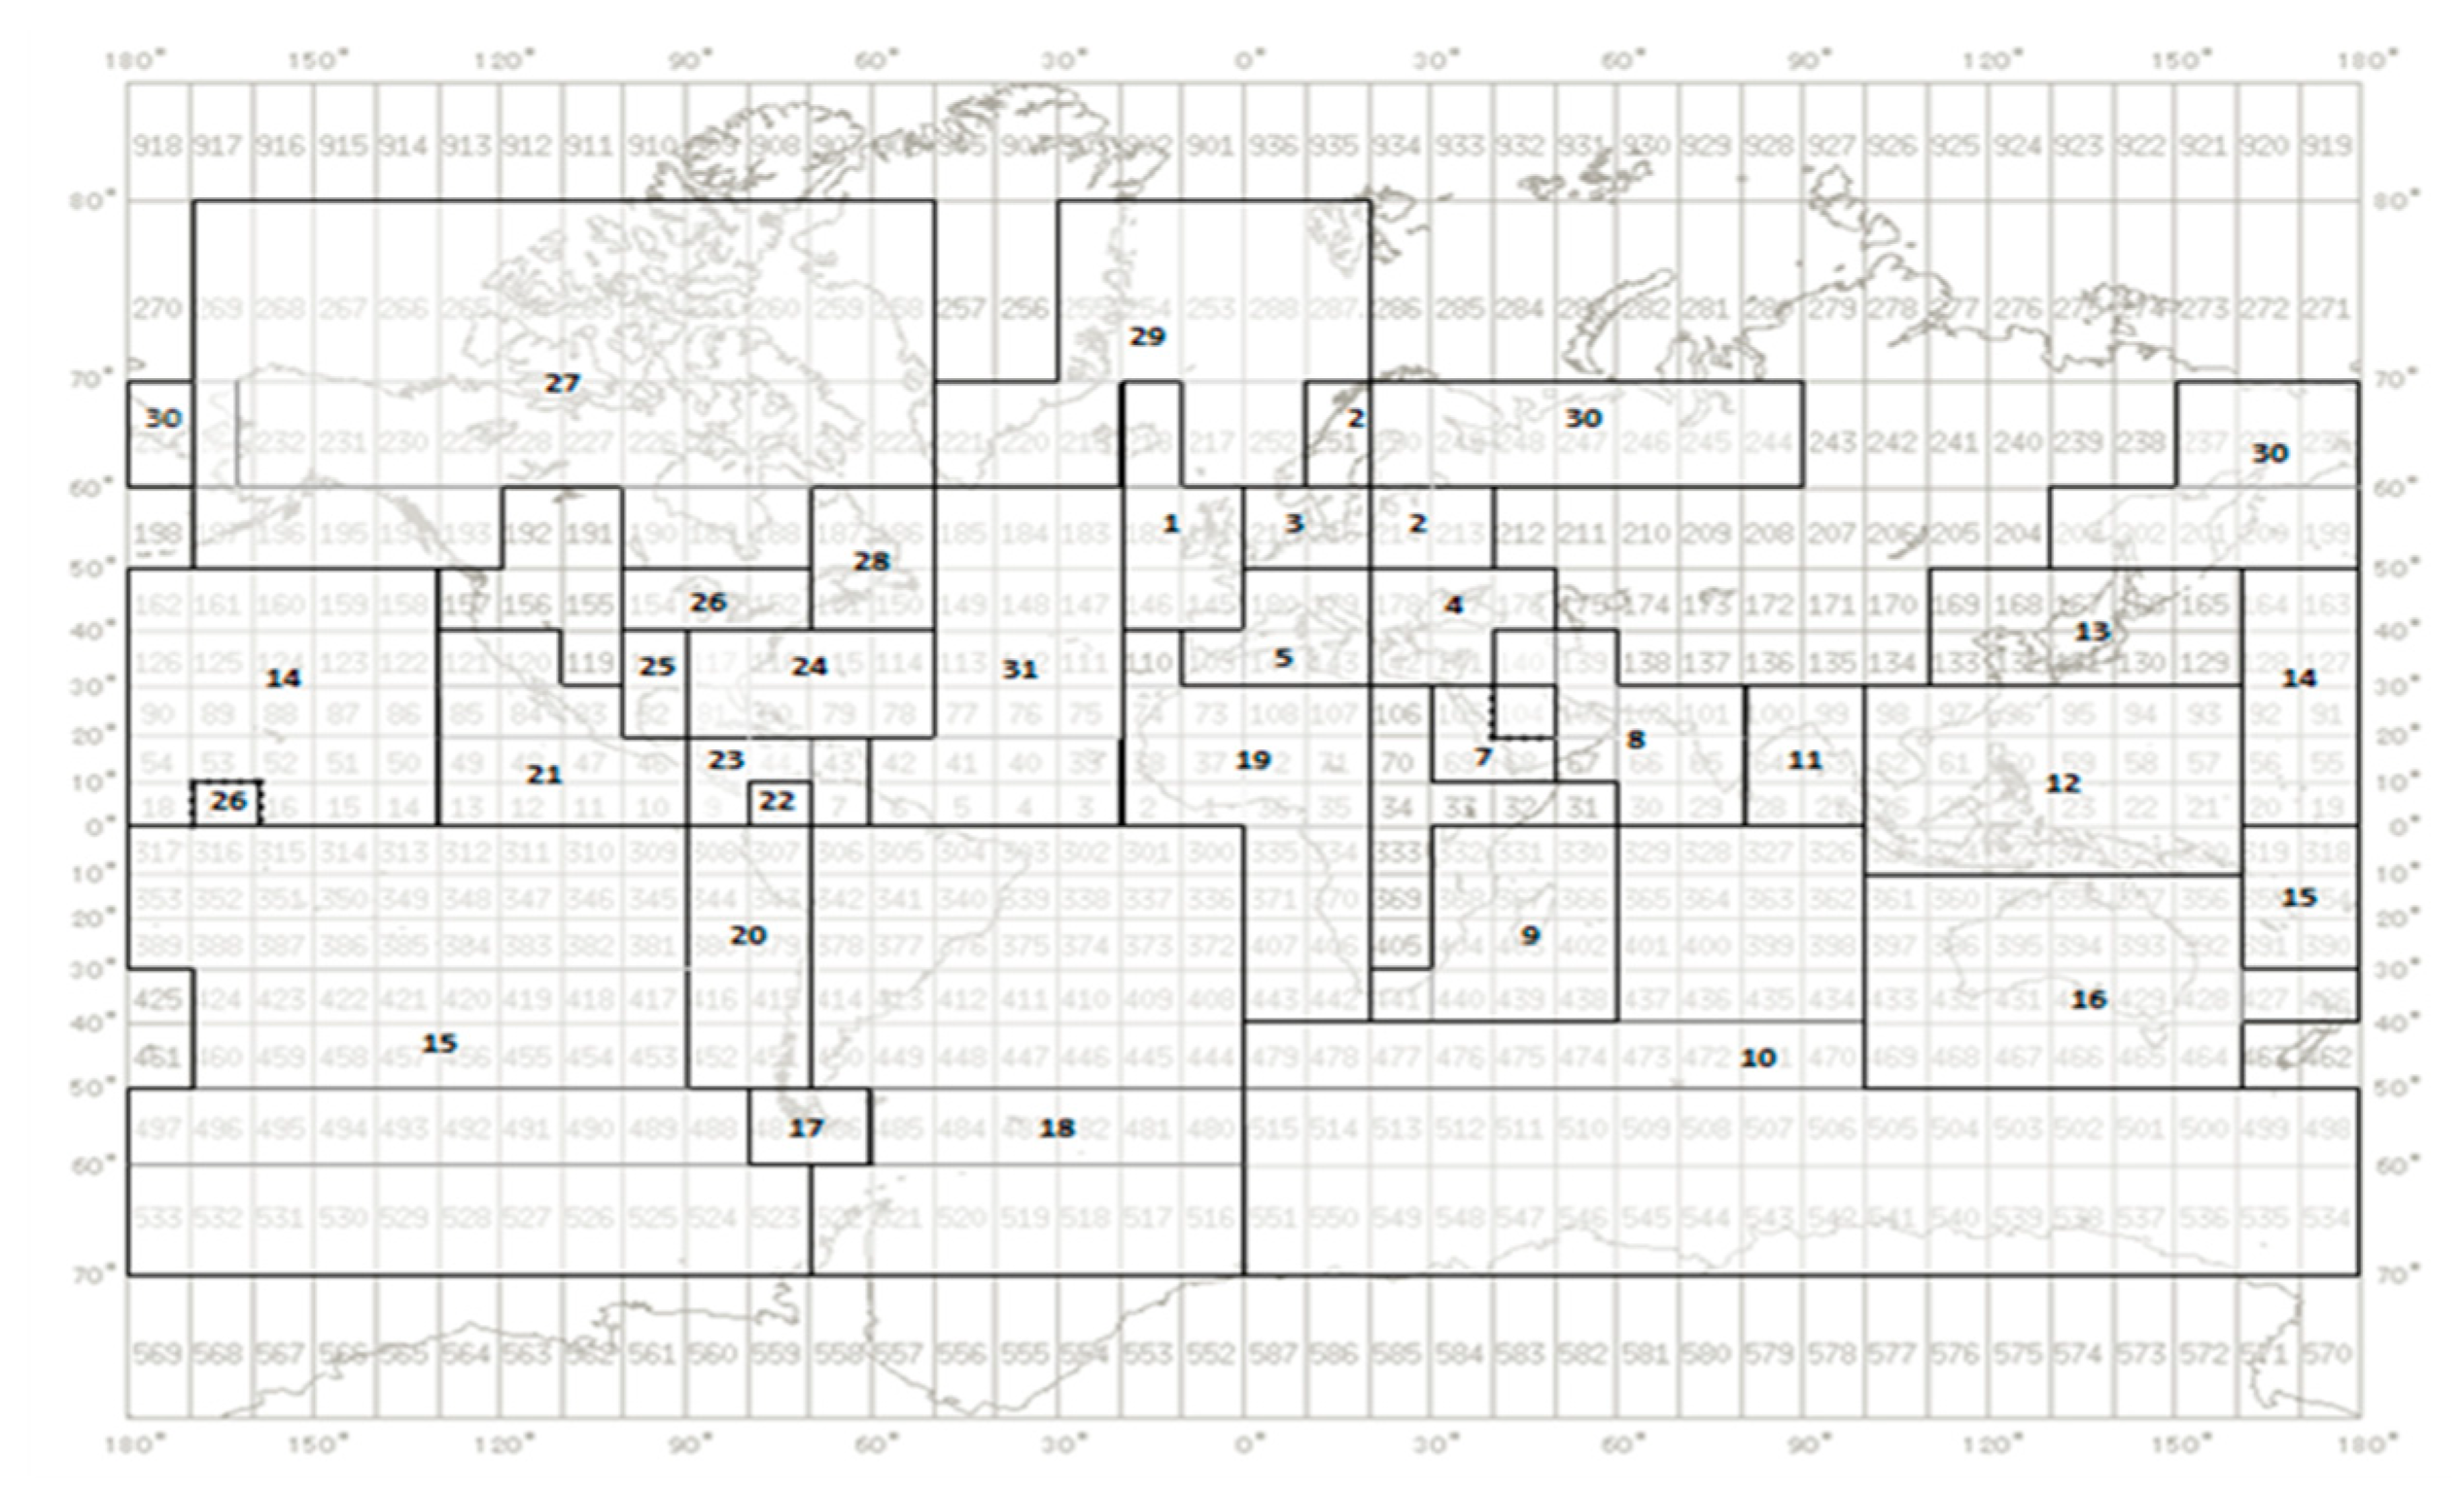
3.5. Sensitive Geographical Areas (SIS Zones) and Seasonality
Regarding the geographic areas in which accidents have occurred, the IHS Sea-web
® database [
23] uses the SIS zones topological system for their localization; based on this, the surface of the earth has been divided into thirty-one (31) zones, which broadly correspond to major areas of interest and depict the implemented SIS zones,
Figure 8.
Following this zoning system, the geographical areas with more frequent accidents are identified. However, independent of the absolute accident statistics, more accurate conclusions on this subject can be drawn only by comparing the number of accidents to the operating fleet in the corresponding geographical areas. In terms of absolute accident numbers, the produced statistics are as follows:
Regarding the Cruise ships, 13% occurred in the West Mediterranean (SIS Zone 5), 11% in U.S. Eastern Seaboard (SIS Zone 24), 10% in the British Isles-North Sea-English Channel-Biscay Bay (SIS Zone 1), and 10% in the West Indies (SIS Zone 23).
Concerning the Passenger ships, 28% in the East Mediterranean and Black Sea (SIS Zone 4), 22% in the South China and East Indies (SIS Zone 12), and 8% in the British Isles-North Sea-English Channel-Biscay Bay (SIS Zone 1).
Regarding the Passenger Ro-Ro ships, 20% in the British Isles-North Sea-English Channel-Biscay Bay (SIS Zone 1), 14% in the Baltic Sea (SIS Zone 2), 13% in the East Mediterranean and Black Sea (SIS Zone 4), 11% in the South China and East Indies (SIS Zone 12) and 10% in the West Mediterranean (SIS Zone 5).
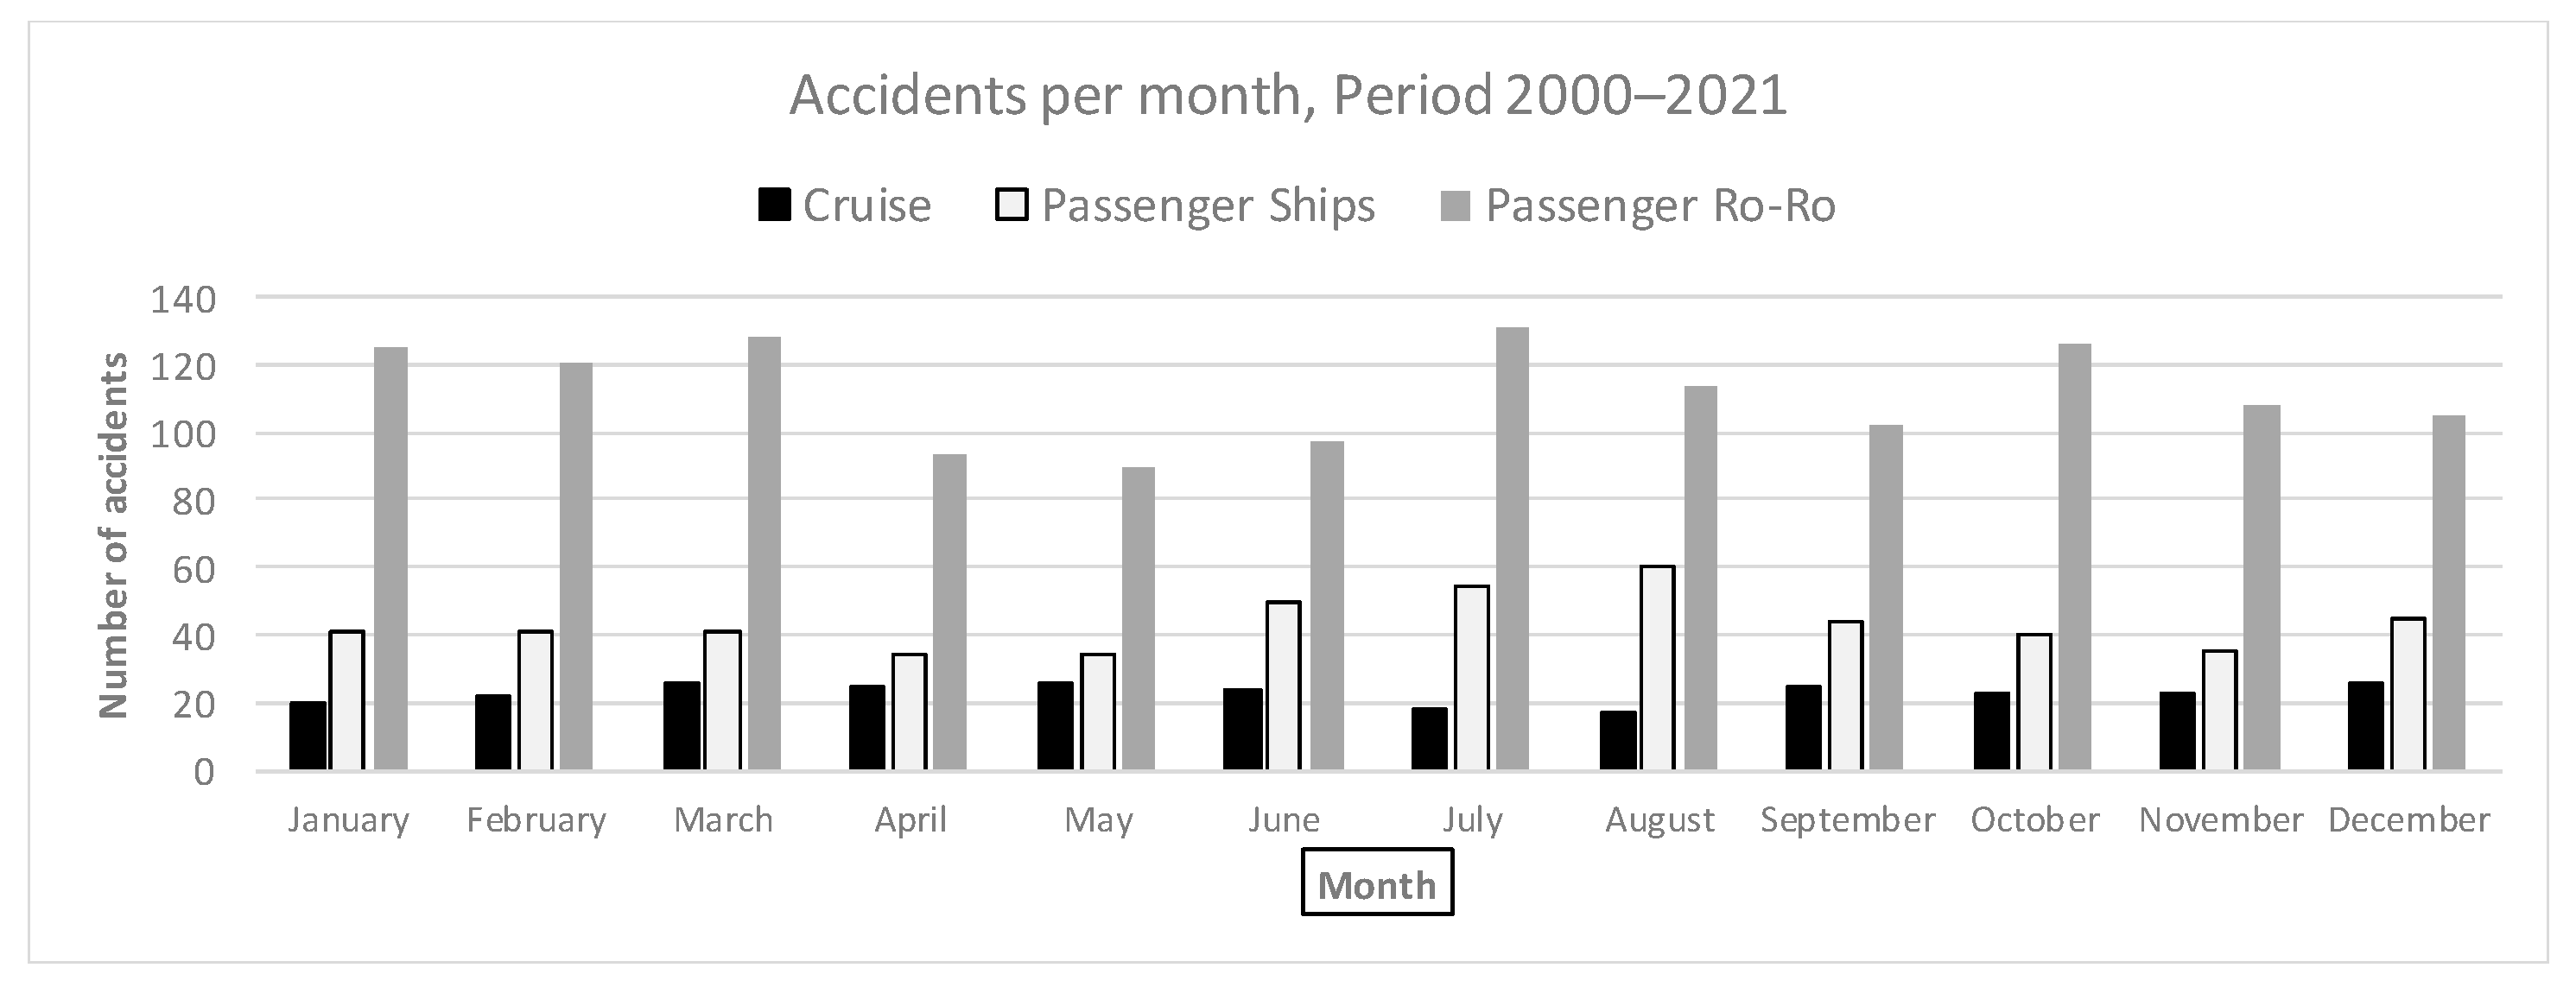
Figure 9 presents the seasonal pattern according to serious ship casualties per month in the period 2000–2021. In general, there is a smooth, quite balanced distribution of ship casualties over the months. Cruise ships exhibit quite similar percentages per month without significant variations throughout the whole year. Focusing on (Pure) Passenger ships, an increased number of incidents seems to take place during the summer period, namely June to August (32% of accidents), in view of increased seasonal activity in summer. Passenger Ro-Ro ships tend to get involved in a relatively higher number of accidents also during winter time (January to March) and summer season.
3.6. SOLAS Ships Analysis
A sensitivity study was carried out to see the effect of increasing the minimum size of ships in the sample to GT ≥ 500 and requiring the fulfillment of a SOLAS Convention standard [
16]. Note that the original sampling plan included all passenger ships, regardless of ship size (GT > 100) and which may have been built under different requirements in terms of the SOLAS Convention (SOLAS and non-SOLAS ships). The results for the SOLAS ships are presented in
Table 7. Additionally, in
Table 7, the corresponding results from [
19,
28] are given while taking into consideration the limitations presented in
Section 2.3 and differences in the study periods.
Reviewing data in
Table 7 shows that the noted values are comparable and of the same order of magnitude. The EMSA III study [
19], confined to data up to the year 2012, presents generally higher values of frequencies for all accident categories. In addition, an important finding based on a comparison of
Table 3 and
Table 7 is that the larger ships tend to exhibit higher frequencies of accident occurrence for all ship subtypes and accident categories.
3.7. Impact on Results When Excluding Clearly Non-Complaint Ships
In this section, an additional investigation is elaborated, aimed at showing the effect of accidents of non-compliant ships on the fatality rates coming from historical data. By definition, non-compliant ships are not complying with in-force safety regulations referring to ship design and operation, at least at the time the incident has happened. For the purpose of this study, covering the period 2000–2021, the following accidents were excluded, because the involved ships did not comply with relevant safety regulations and/or dubious operations at the time of the incident.
Passenger Ro-Ro “Le Joola,” a ship sailing under the Senegalese flag, developed a list and capsized quickly in the Atlantic Ocean 27 miles off the Gambia’s coast on 26 September 2002 under adverse weather conditions. The accident was registered in the IHS database [
23] as “hull and machinery damage.” The ship was certified for the carriage of the following maximum numbers of People On Board (POB): “unberthed 485; cabins 20; berths 50; Crew 44”. At the time of the incident, the vessel was highly overloaded, as evidenced by the estimated number of more than 1500 fatalities, while noting that the exact number of persons on board is still unknown due to many un-ticketed passengers.
The sinking of Passenger Ro-Ro “Sewol” occurred on April 16, 2014, when the ferry was en route from Incheon to Jeju in South Korea under calm weather conditions. During the course turning maneuver, the ship developed an excessive list due to poor stability, took water, capsized, and sank into shallow waters. From the 476 persons on board, 304 were lost. The poor stability of the vessel was attributed to improper modifications of the ship’s arrangements, adding weight to the upper decks and diminishing the ship’s initial stability [
26].
When excluding the above two accidents from the statistics, the overall frequency of accident occurrence per decade remains almost the same, as already presented in
Figure 6. The frequency of Passenger Ro-Ro ship’s total losses was also slightly reduced to 1.01 × 10
−3 for the period 2000–2010 and to 2.58 × 10
−3 for the period 2011–2021 in comparison with
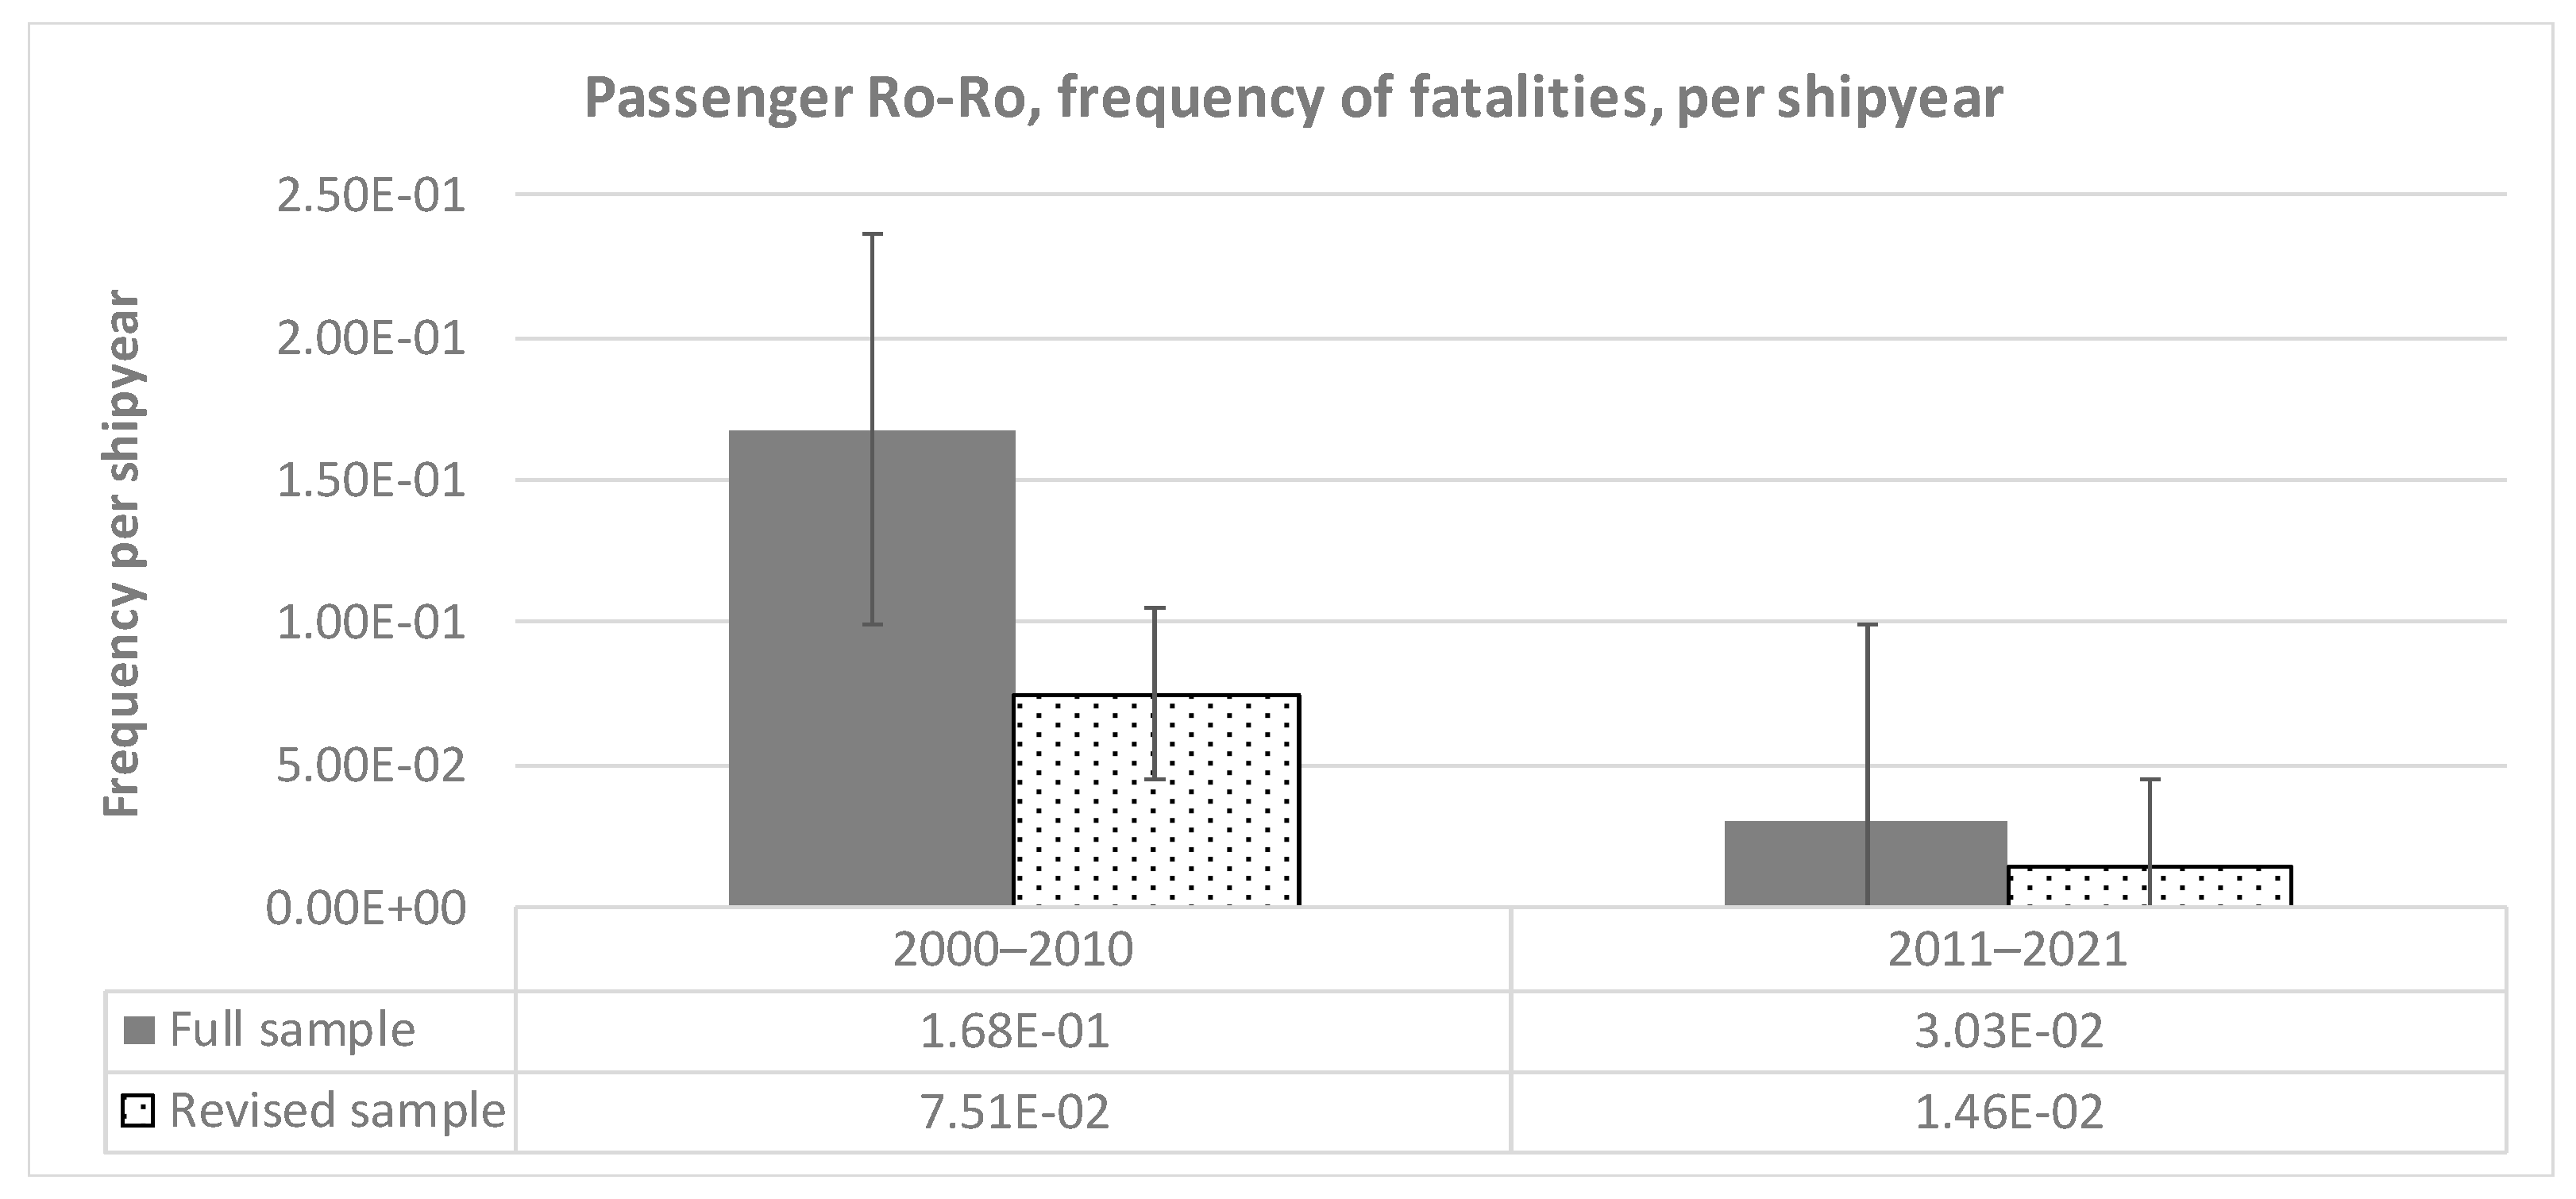
Table 4. However, fatality rates significantly reduced by around 50% for both decades,
Figure 10. This result demonstrates the volatility of observed statistical values that should always be used with care and full consideration of the ensuing uncertainties.
4. Conclusions and Way Ahead
The herein presented analysis covering the last two decades (2000–2021) partly confirms some earlier observed, contradicting trends of the safety level of passenger ships. It shows that there has been a considerable reduction in the frequency of serious accidents’ occurrence in the last decade. Nevertheless, consequences do not exhibit the same trend since the frequency of the ship’s total losses has increased. Fatality rates have also increased in the last decade (2011–2021) for Cruise ships and (Pure) Passenger ships, whereas for Passenger Ro-Ro ships, a significant reduction is observed. Thus, the outcome of the present study indicates that in the last decade, the overall safety level of passenger ships did not significantly change.
The consequences of accidents remained, on average, at about the same level. Major ship accidents with numerous fatalities always happen and will happen in the future. It proves that generally, they do not happen because of the failure of technology or state of the art (scientific and regulatory) in maritime safety, but rather due to the failure of ship management in operation (see
Section 3.7 for typical examples):
navigational errors and deliberate ship overloading potentially cause an increased number of fatalities in the case of ship loss.
the lack of compliance with in-force regulations referring to ship design, outfitting and operation (mostly in cases of retrofitted ships), and
to a limited extent due to the adversity of the environmental conditions in relation to the ship’s size and age.
When comparing the present casualty statistics with data from other relevant sources [
7,
22], observed trends are partly confirmed, while also some distinct differences are observed. This confirms the sensitivity and uncertainty of the quantification of maritime risk by historical accident data. This is related to the scarcity of data for serious accidents, differences in the sample of considered ships (year of built, severity of incidents, period, IACS class), differences in the period of analysis, and last but not least, the adopted methodology in the analysis of data (manual inspection of records or automated processing of data).
When focusing on accidents potentially causing a ship’s flooding (with the possible consequence ship’s sinking) and directly affecting the ship’s damage stability, the following is concluded:
Grounding and contact accidents dominate the statistics of passenger ships of all subtypes, whereas collision accidents only account for about 30% of the events potentially leading to flooding. This calls for an urgent reconsideration of present SOLAS damage stability regulations, in which side collision events are considered the prime contributor to flooding risk. Notably, not even one passenger ship sank during the last two decades due to collision, and this was not different in the past, except for the European Gateway (1982) [
32] and Andrea Doria (1956) accidents that happened several decades ago.
The impact of the environmental conditions is mainly associated with grounding and contact events and not with collision events since that type of accident is mainly affected by foggy conditions, which is also confirmed by dedicated studies on the impact of weather conditions on navigational ship accidents, see [
33,
34].
An interesting result is the values of the observed fatalities per shipyear for all passenger ship subtypes (historical PLL). It may be used as a yardstick when developing risk-based approaches to a ship’s damage stability while using PLL as a metric for the acceptance of the ensuing risk (see, e.g., project FLARE [
20]).
The uncertainties of analyzed data are significant, thus, obtained results should always be used with care. These uncertainties are related to the scarcity of available data, while we have used the most comprehensive publicly available ship accident database, namely the IHS-Sea Web® database, enriched with data from other sources. This is inherent to the statistics of data on passenger ship accidents, which are comparably low in terms of absolute numbers over the years.
The study clearly shows that removing from the statistics major accidents of ships that do not comply with the international safety standards for ship design and operation has a very strong impact on the fatalities recorded.
The findings of the present study may be used in the construction of risk models for the assessment of the safety level of passenger ships, in the elaboration of relevant risk mitigation measures, as well as in the enhancement of maritime safety regulations.
Most ship accidents happen because of human or system errors [
35,
36], and a significant percentage of them could have been avoided if seafarers were adequately familiarized with the navigational equipment and sufficiently trained. In addition, clear communication between passengers and crew, as well as between crew members themselves, is always vital to safe ship operation. Extending the risk assessment techniques developed for ship design to ship’s operation, especially as to the impact of human factors, is eminent and subject to comprehensive, multi-disciplinary research in the area [
37,
38].


