
Vehicle Detection from Aerial Images Using Deep Learning: A Comparative Study


Abstract
:1. Introduction
2. Related Works
2.1. Fixed Surveillance Cameras
2.2. Satellite Imagery
2.3. UAV Imagery
2.4. Our Contribution
- (1)
- We use two datasets with different characteristics for training and testing, whereas most previous works described above tested their technique on a single proprietary dataset. We show that annotation errors in the dataset have an important effect on the detection performance.
- (2)
- We added a third algorithm (YOLOv4) to the comparative analysis.
- (3)
- We tested various hyperparameter values (three different input sizes for YOLOv3 and YOLOv4 each, two different feature extractors for Faster R-CNN, and various values of score and IoU thresholds).
- (4)
- We conducted a more detailed comparison of the results, by showing the AP at different values of IoU thresholds, comparing the tradeoff between AP and inference speed, and calculating several new metrics that have been suggested for the COCO dataset [18].
3. Theoretical Overview of Faster R-CNN and YOLO Architectures
3.1. Two-Stage Detector: Faster R-CNN
3.2. One-Stage Detectors
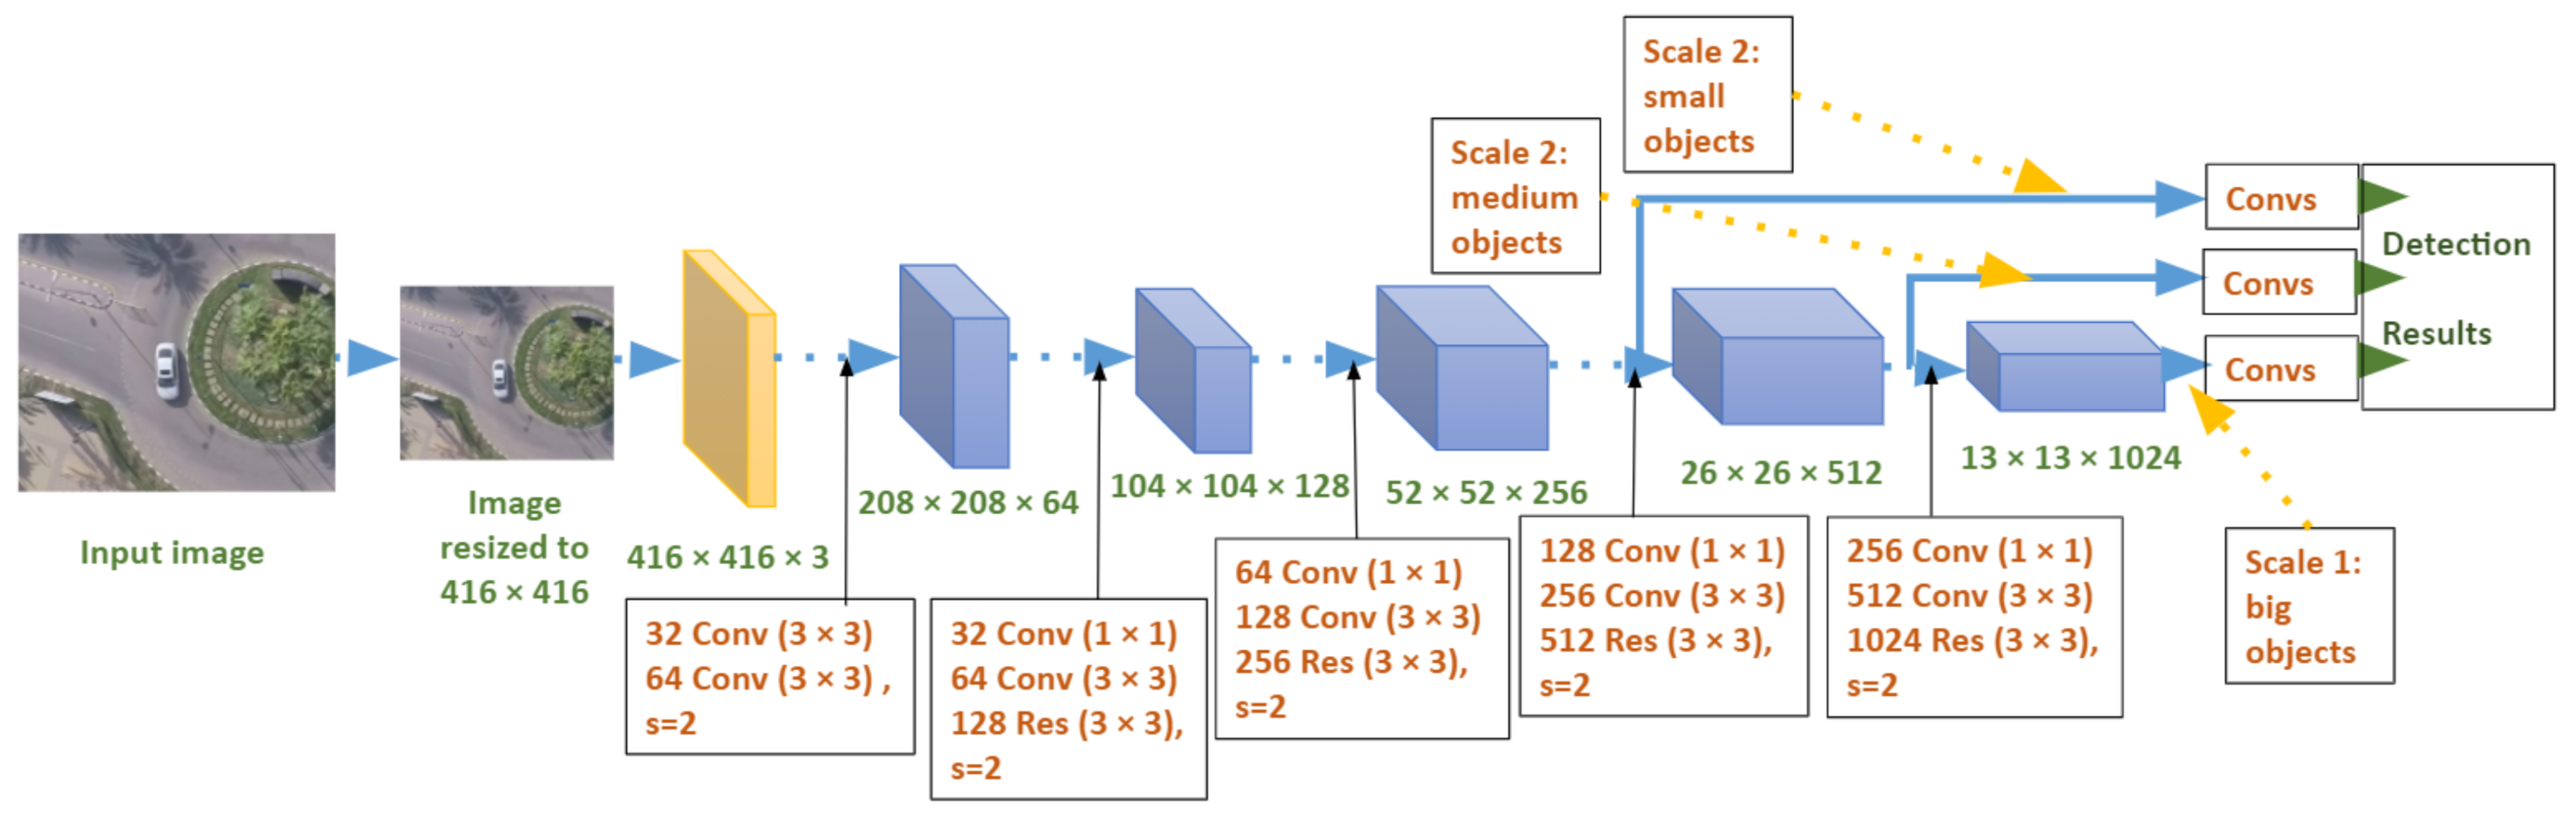
3.2.1. YOLOv3
- Replacing the mean squared error by cross-entropy for the loss function. The cross-entropy loss function is calculated as follows:where M is the number of classes, c is the class index, x is an observation, is an indicator function that equals 1 when c is the correct class for the observation x, and is the natural logarithm of the predicted probability that observation x belongs to class c.
- Using logistic regression (instead of the softmax function) for predicting an objectness score for every bounding box.
3.2.2. YOLOv4
4. Experimental Comparison between Faster R-CNN, YOLOv3, and YOLOv4
4.1. Datasets
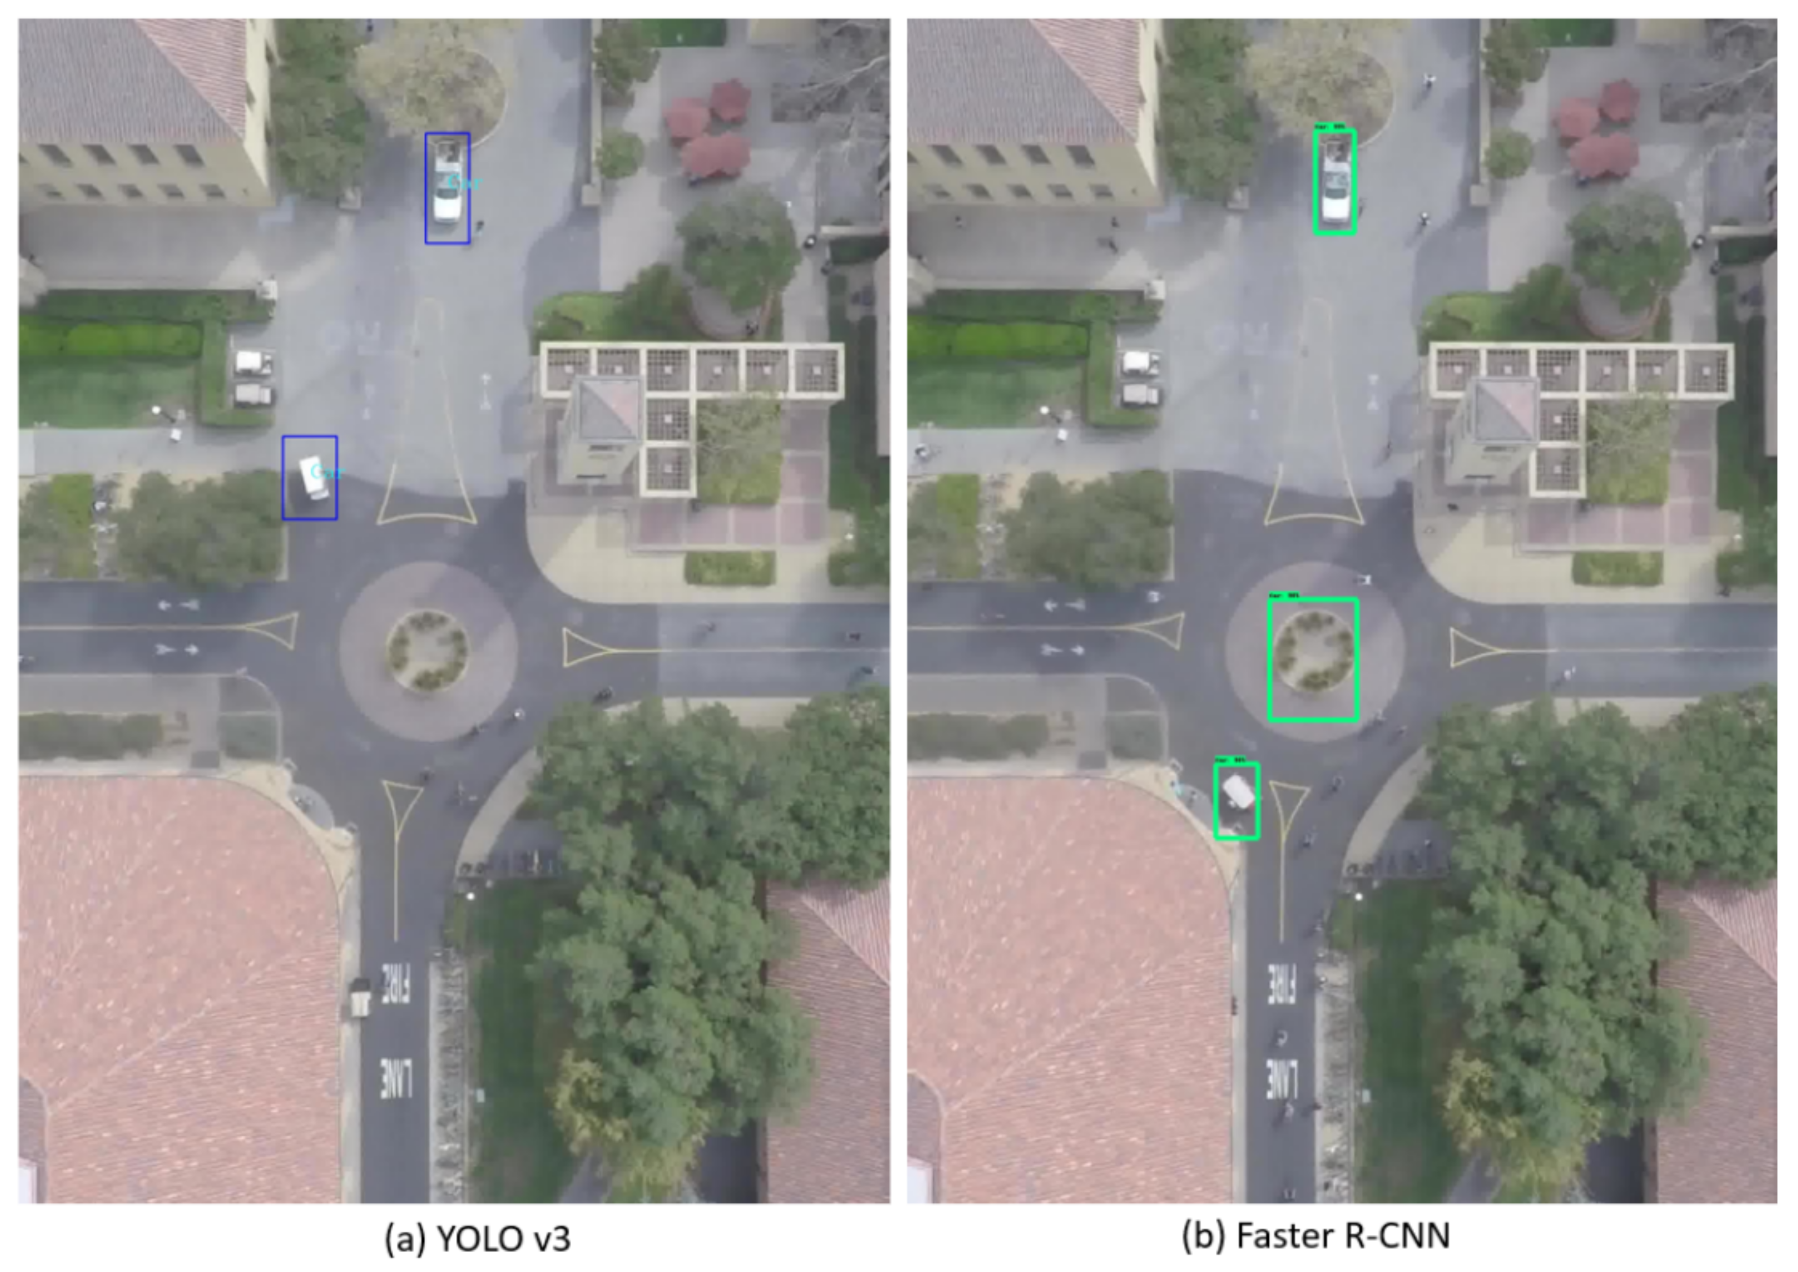
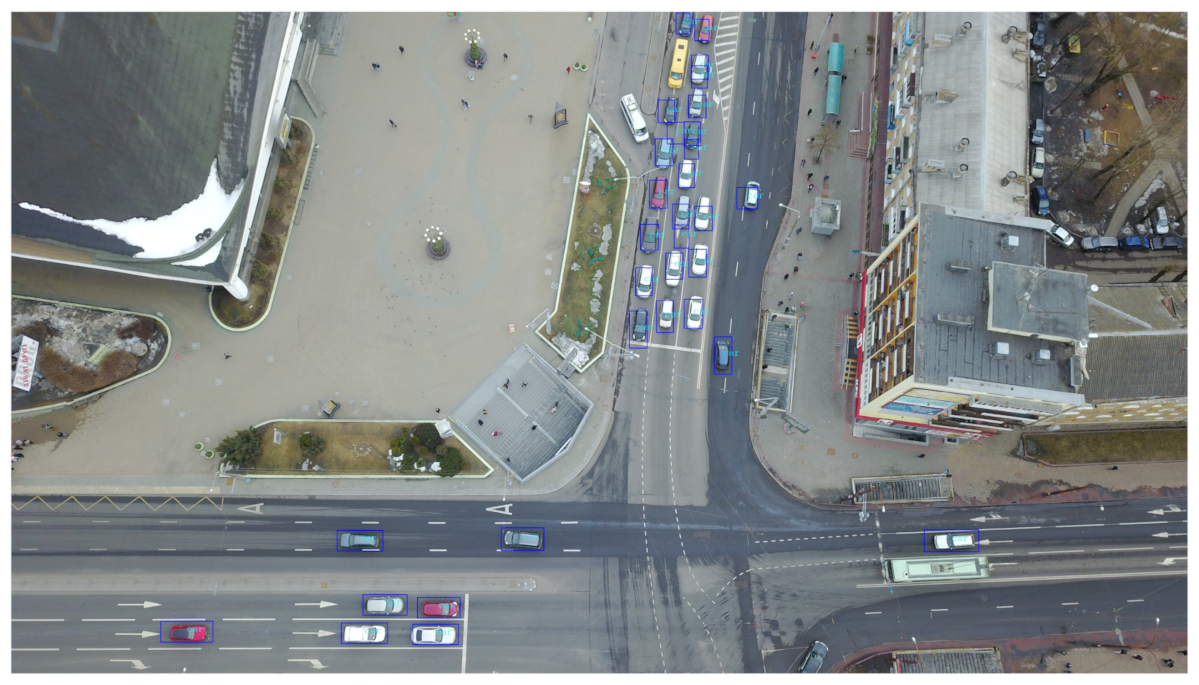
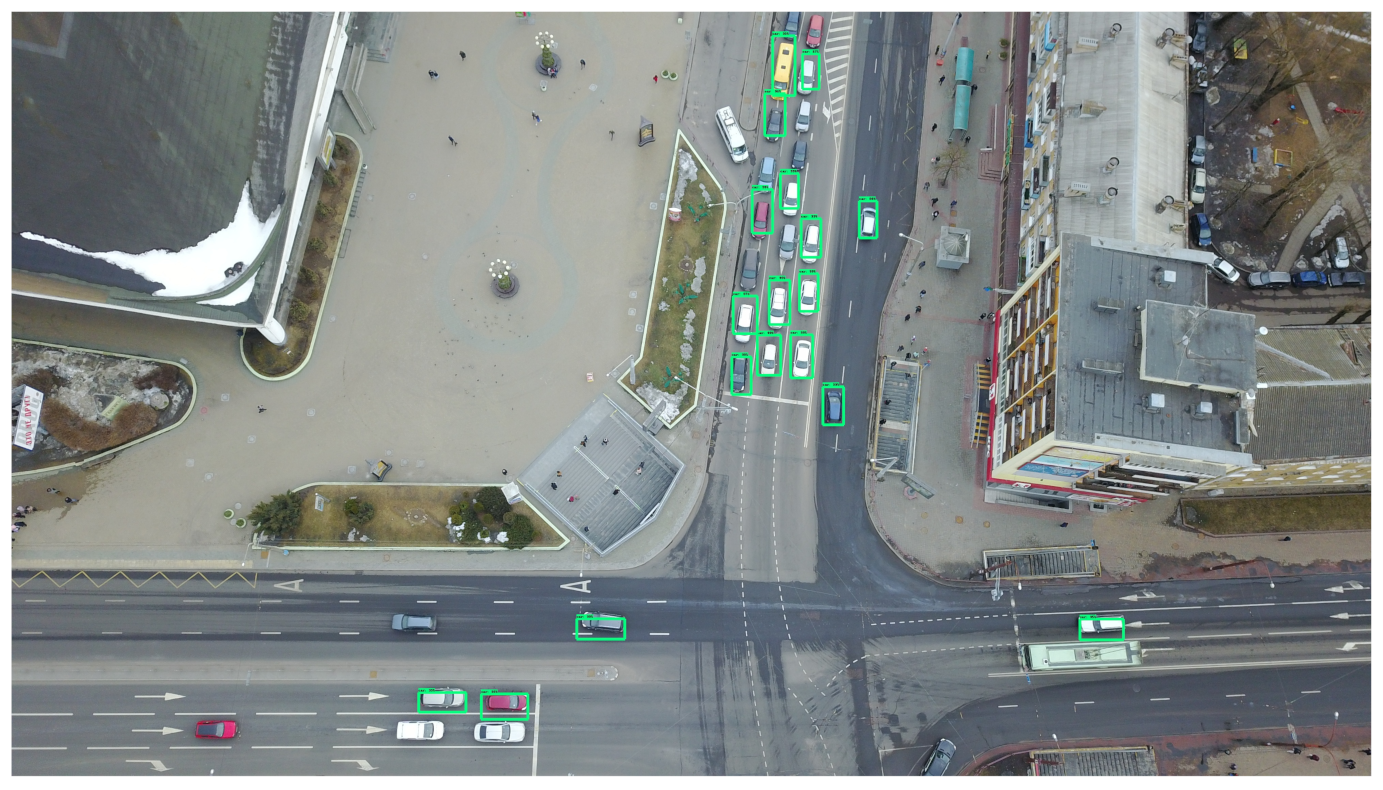
- The Stanford dataset [50] consists of a large-scale collection of aerial images and videos of a university campus containing various agents (cars, buses, bicycles, golf carts, skateboarders, and pedestrians). It was obtained using a 3DR SOLO quadcopter (equipped with a 4k camera) that flew over various crowded campus scenes, at an altitude of around 80 m. It is originally composed of eight scenes, but since we are exclusively interested in car detection, we chose only three scenes that contains the largest percentage of cars: Nexus (in which 29.51% of objects are cars), Gates (1.08%), and DeathCircle (4.71%). All other scenes contain less than 1% of cars. We used the two first scenes for training and the third one for testing. In addition, we removed images that contain no cars. Table 3 shows the number of images and instances in the training and testing datasets. The images in the selected scene have variable sizes, as shown in Table 4, and contain cars of various sizes, as depicted in Figure 4. The average car size (calculated based on the ground-truth bounding boxes) is shown in Table 5. The discrepancy observed between the training and testing datasets in terms of car sizes is explained by the fact that we used different scenes for the training and testing datasets, as explained above. This discrepancy will constitute an additional challenge for the considered object detection algorithms. Furthermore, we noticed that the ground-truth bounding boxes in some images contain some mistakes (bounding boxes containing no objects) and imprecisions (many bounding boxes are much larger than the objects inside them), as can be seen in Figure 5, but we used them as they are in order to assess the impact of annotation errors on detection performance. In fact, the Stanford Drone Dataset was not primarily designed for object detection, but for trajectory forecasting and tracking.
- The PSU datasetwas collected from two sources: an open dataset of aerial images available on Github [51] and our own images acquired after flying a 3DR SOLO drone equipped with a GoPro Hero 4 camera, in an outdoor environment at a PSU parking lot. The drone recorded videos from which frames were extracted and manually labeled. Since we are only interested in a single class, images with no cars were removed from the dataset. The training/testing split was made randomly.Table 3 shows the number of images and instances in the training and testing datasets. The dataset thus obtained contains images of different sizes, as shown in Table 6, and contains cars of various sizes, as depicted in Figure 4. The average car size (calculated based on the ground-truth bounding boxes) in the training and testing datasets is shown in Table 5. We have made this dataset available on [52].
4.2. Hyperparameters
4.3. Results and Discussion
4.3.1. Metrics
- IoU: Intersection over Union measuring the overlap between the predicted and the ground-truth bounding boxes.
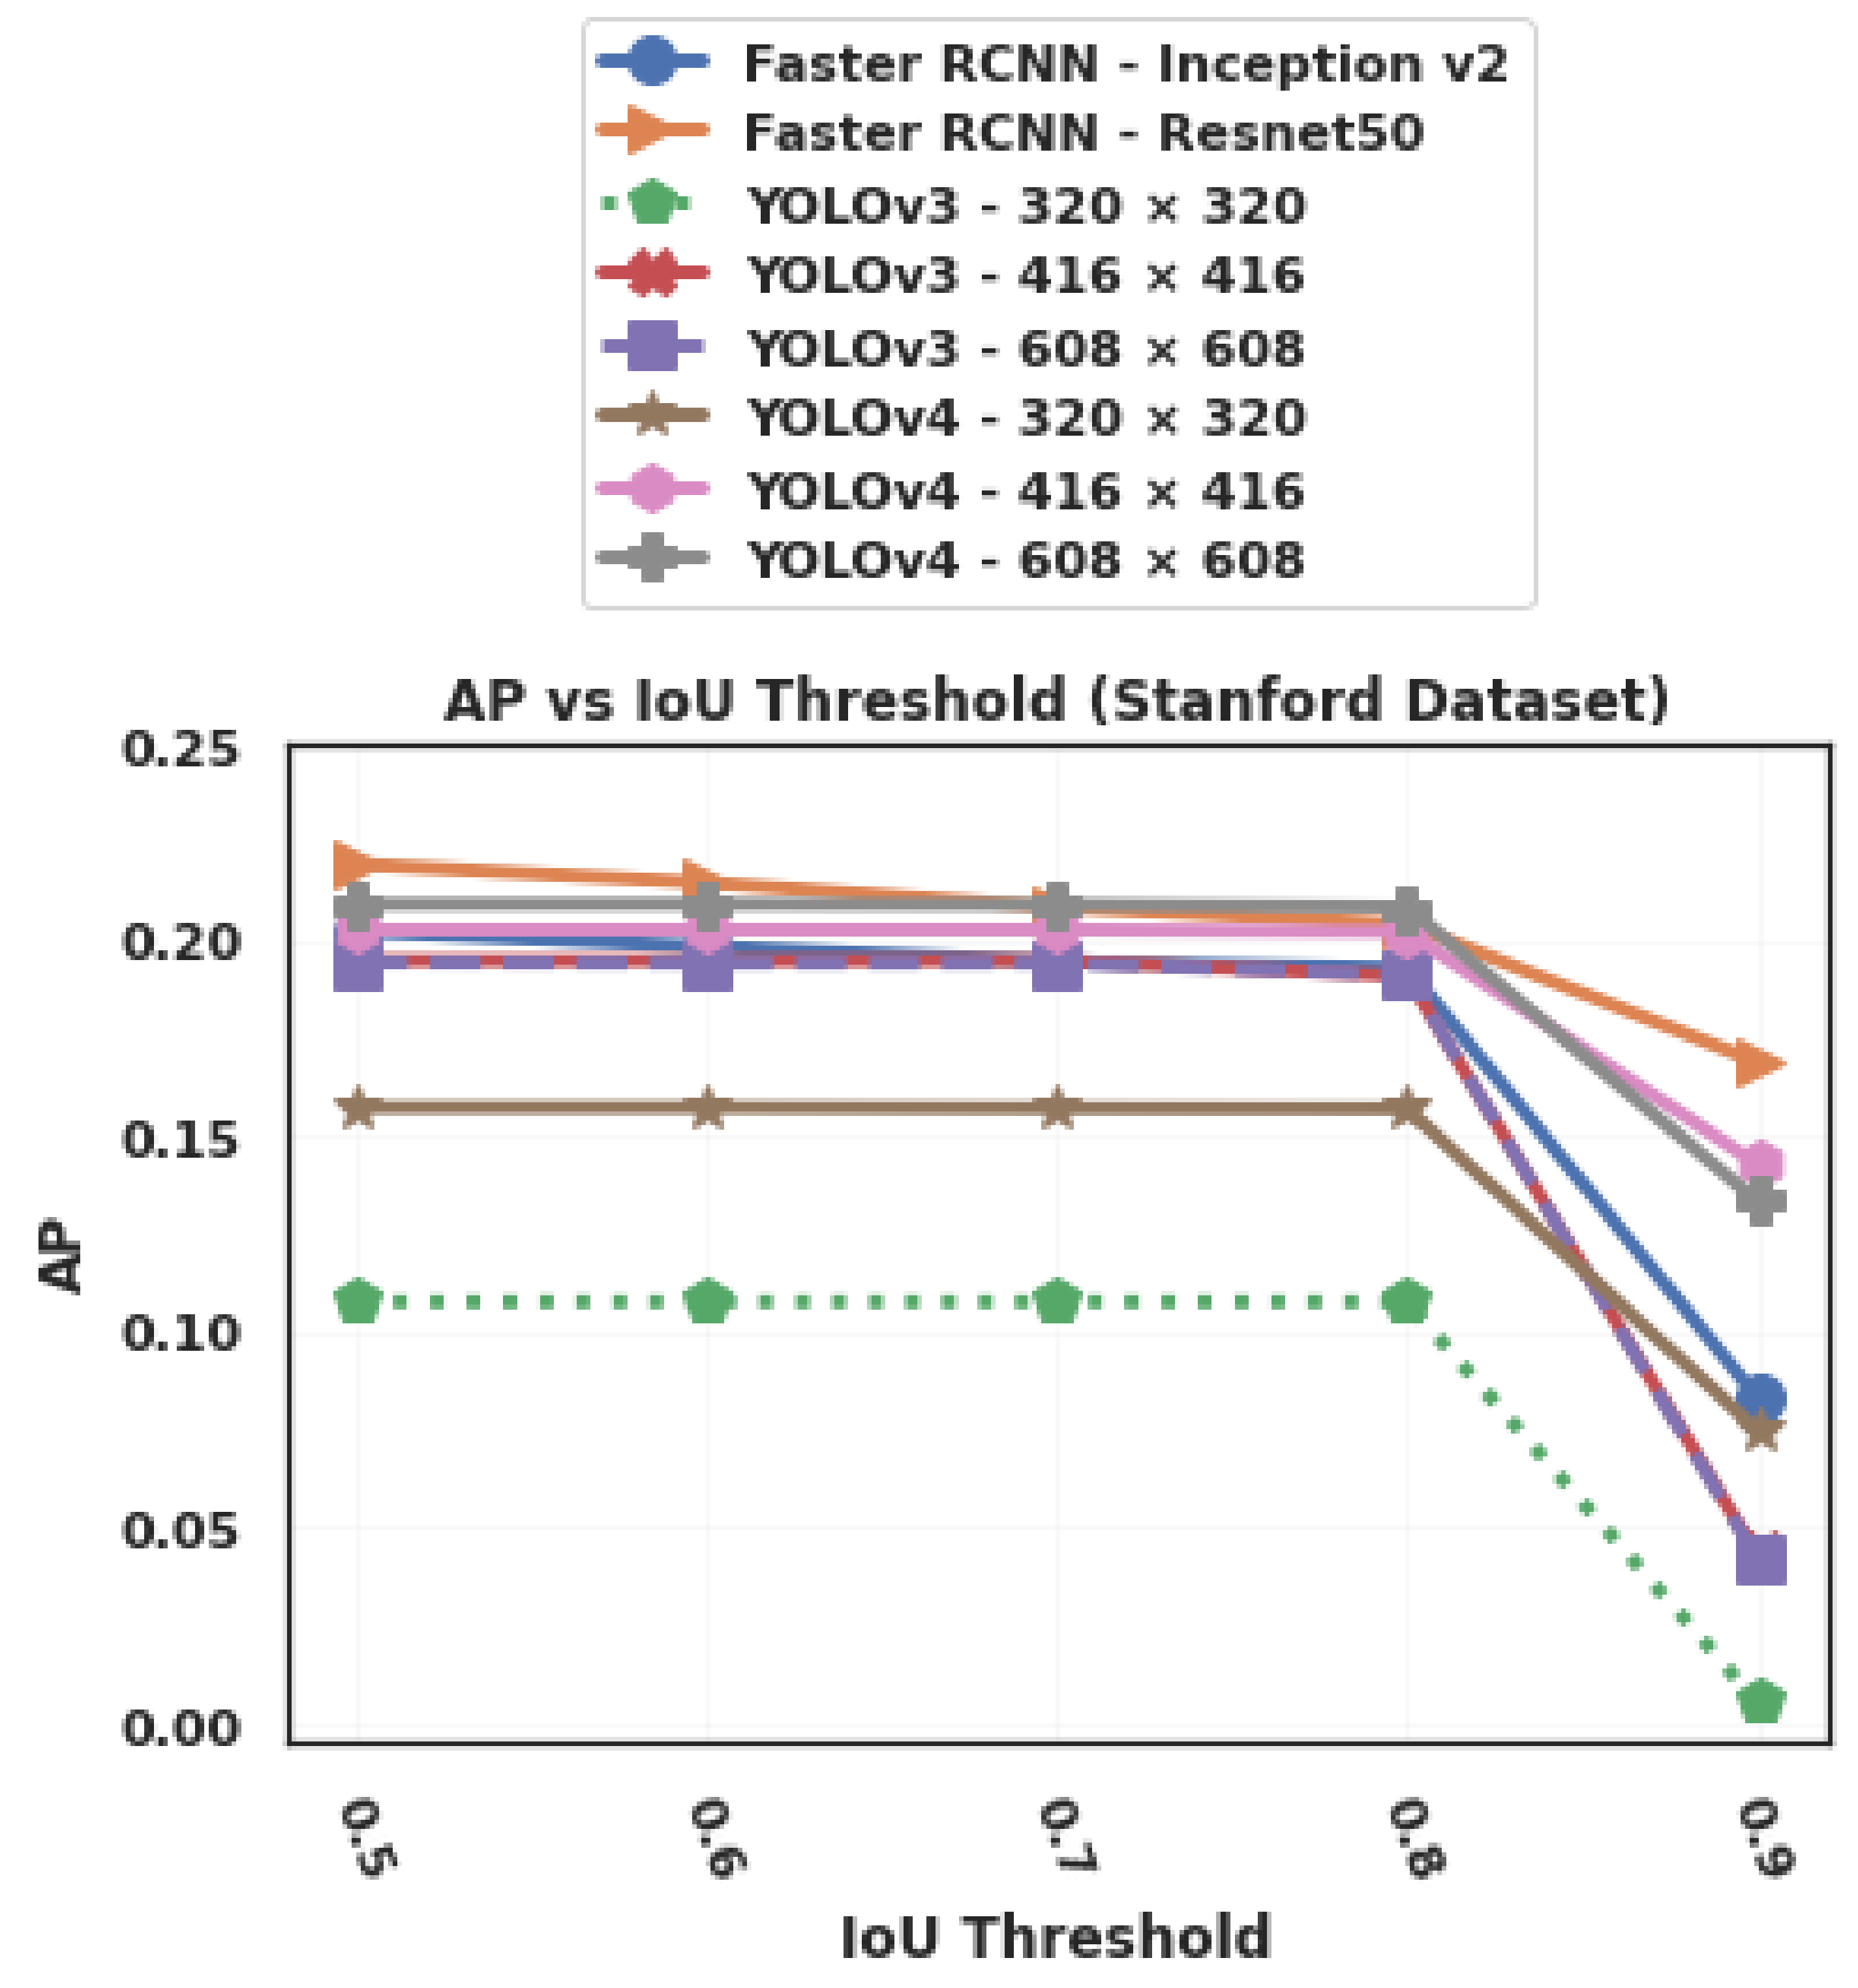
- mAP: mean average precision, or simply AP, since we are dealing with only one class. It corresponds to the area under the precision vs. recall curve. AP was measured for different values of IoU (0.5, 0.6, 0.7, 0.8, and 0.9).
- FPS: number of frames per second, measuring the inference processing speed.
- Inference time (in millisecond per image): also measuring the processing speed.
- ARmax=1, ARmax=10, and ARmax=100: average recall, when considering a maximum number of detections per image, averaged over all values of IoU specified above. We allow only the 1, 10, or 100 top-scoring detections for each image. This metric penalizes missing detections (false negatives) and duplicates (several bounding boxes for a single object).
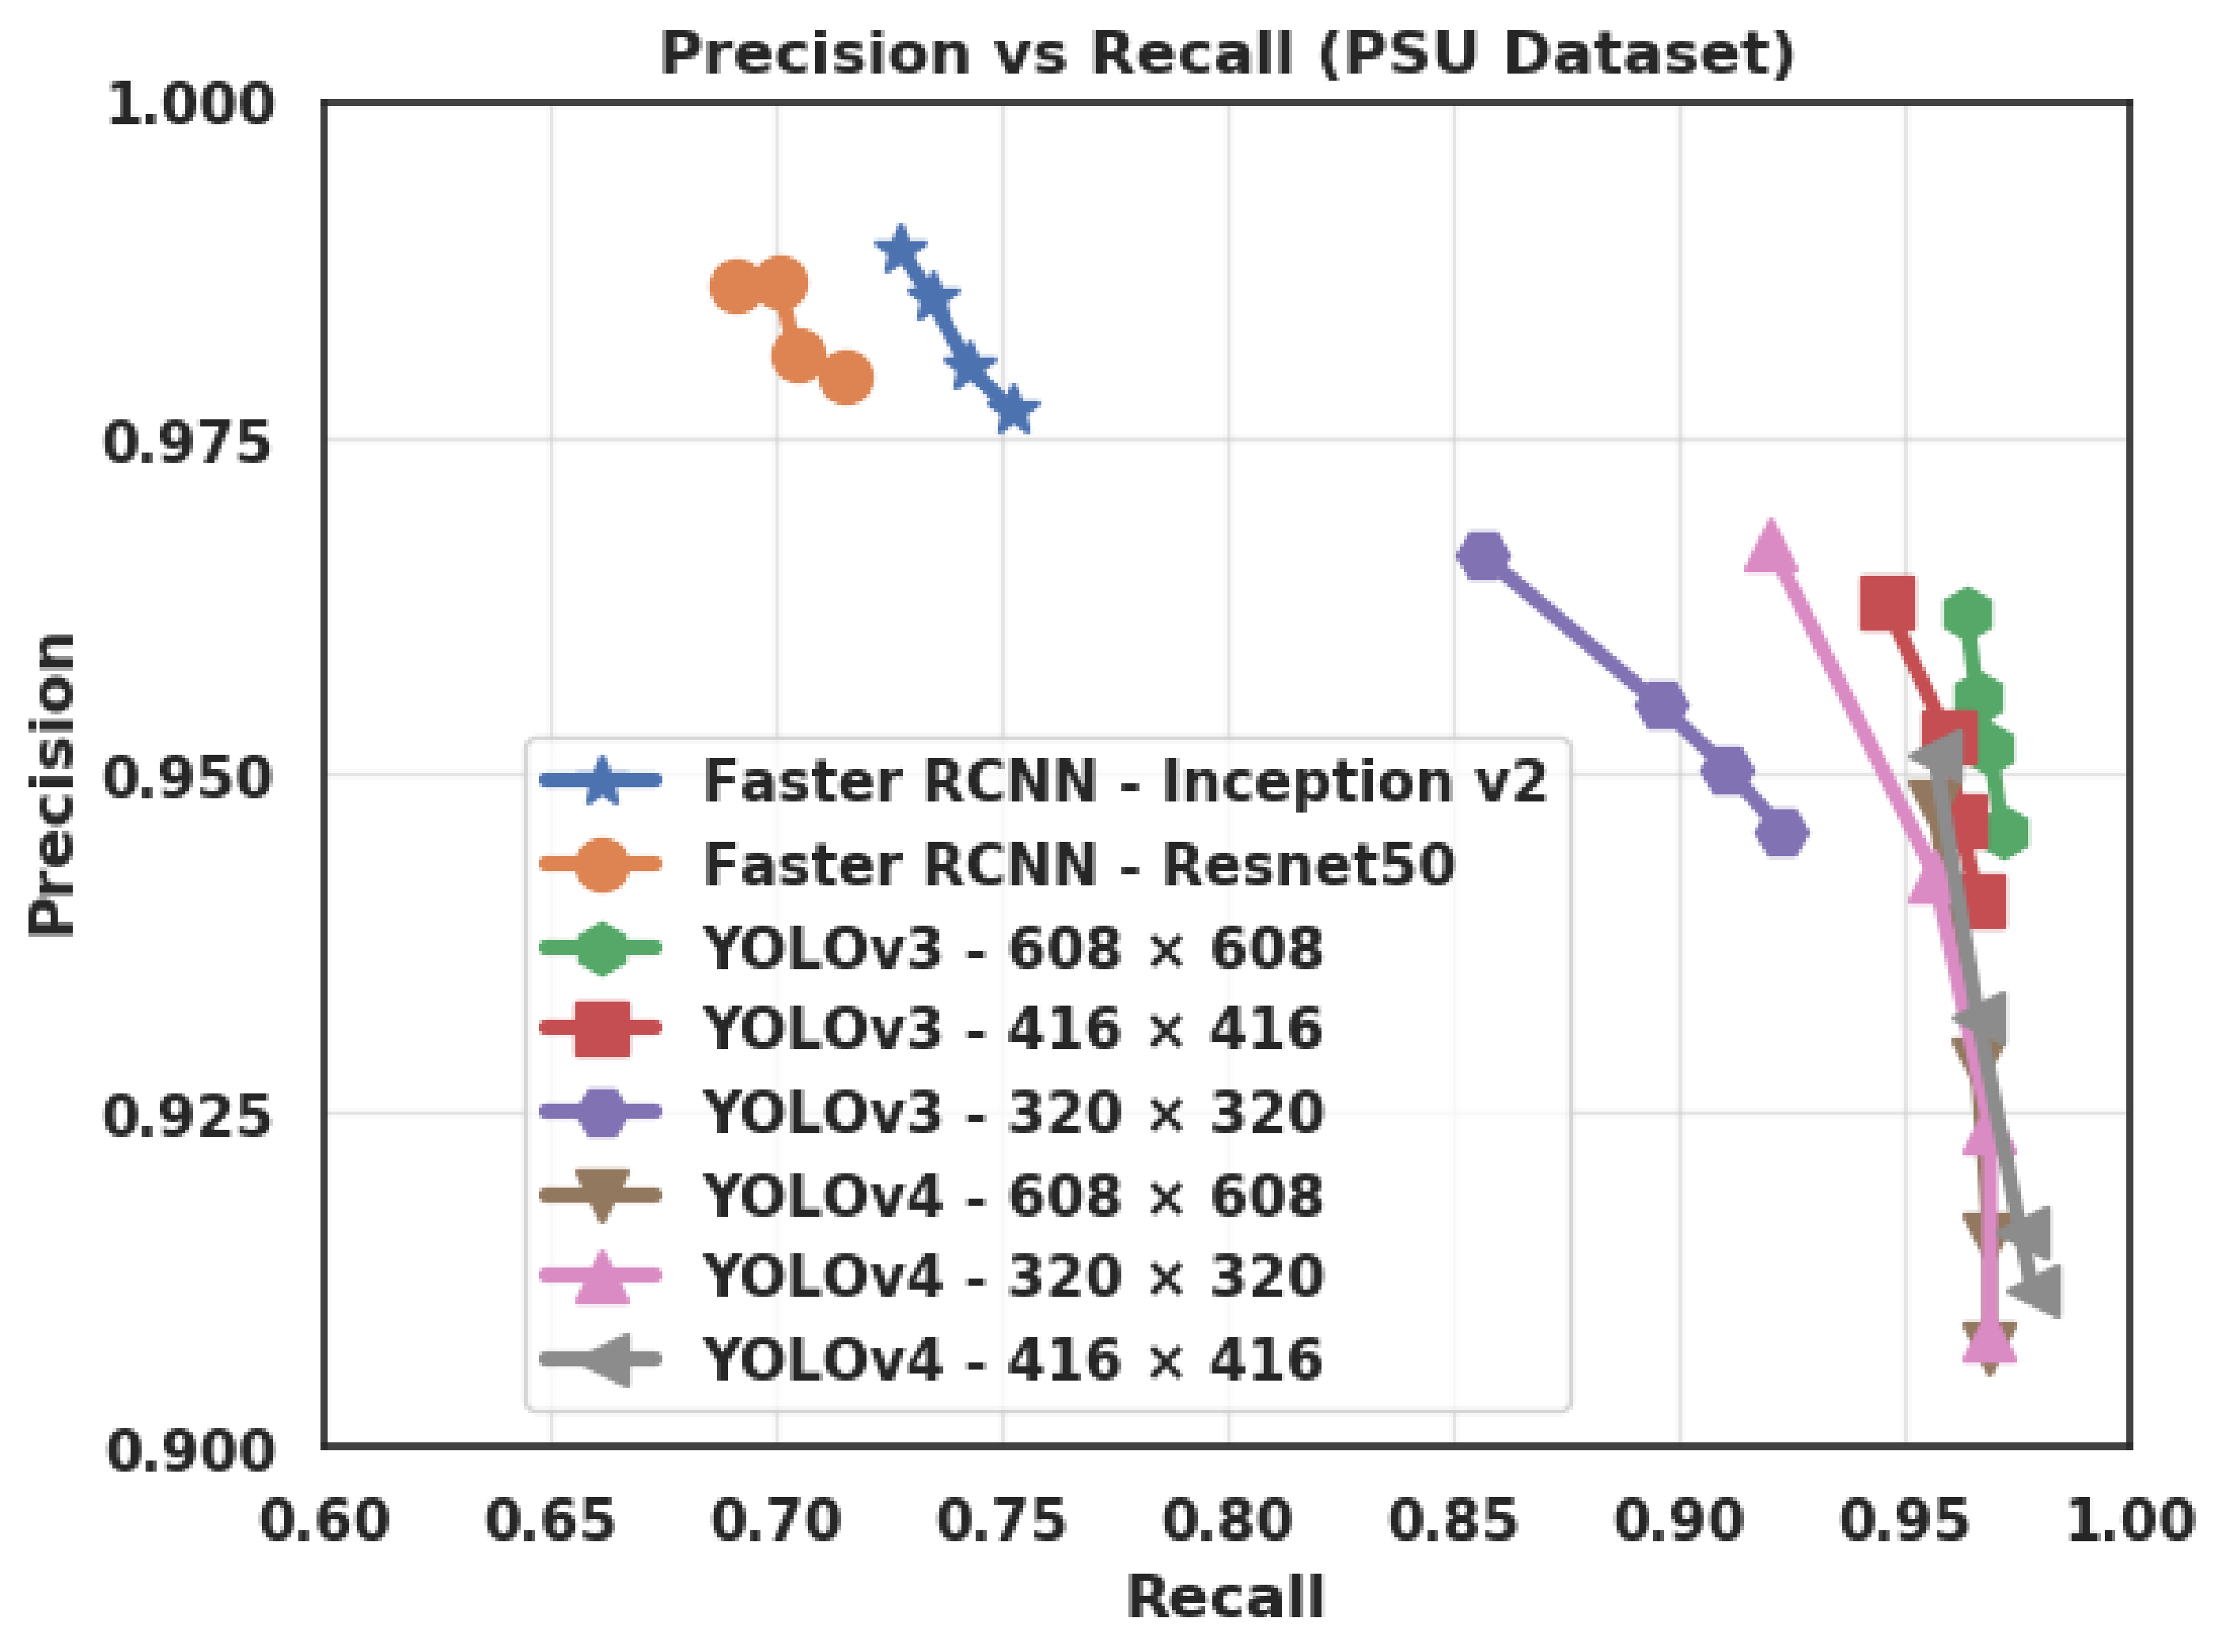
4.3.2. Average Precision
4.3.3. Average Recall
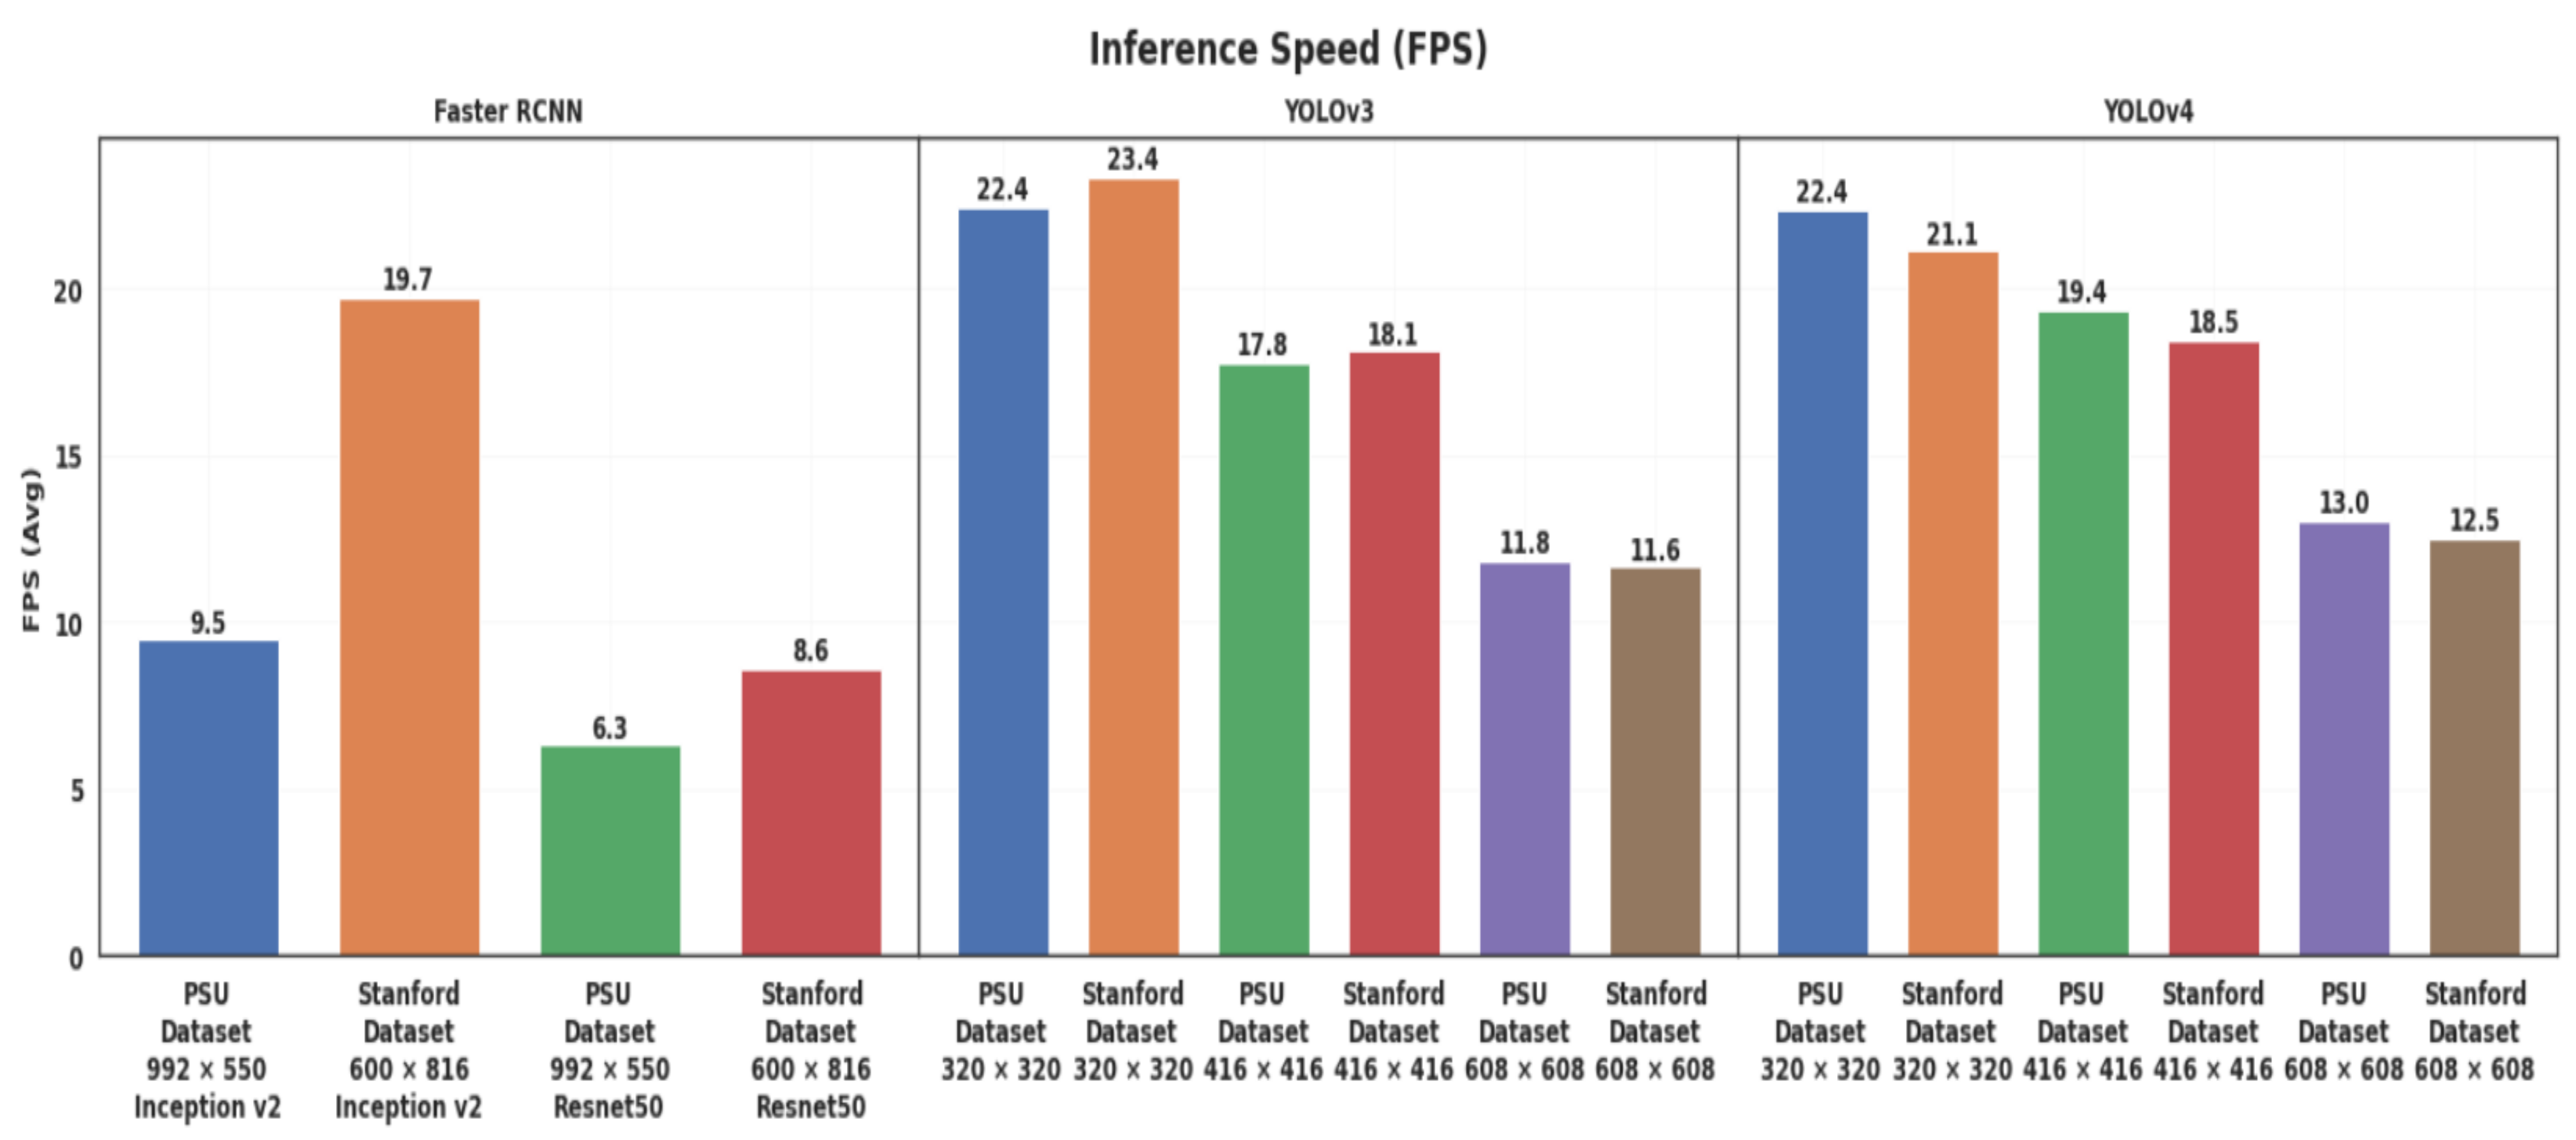
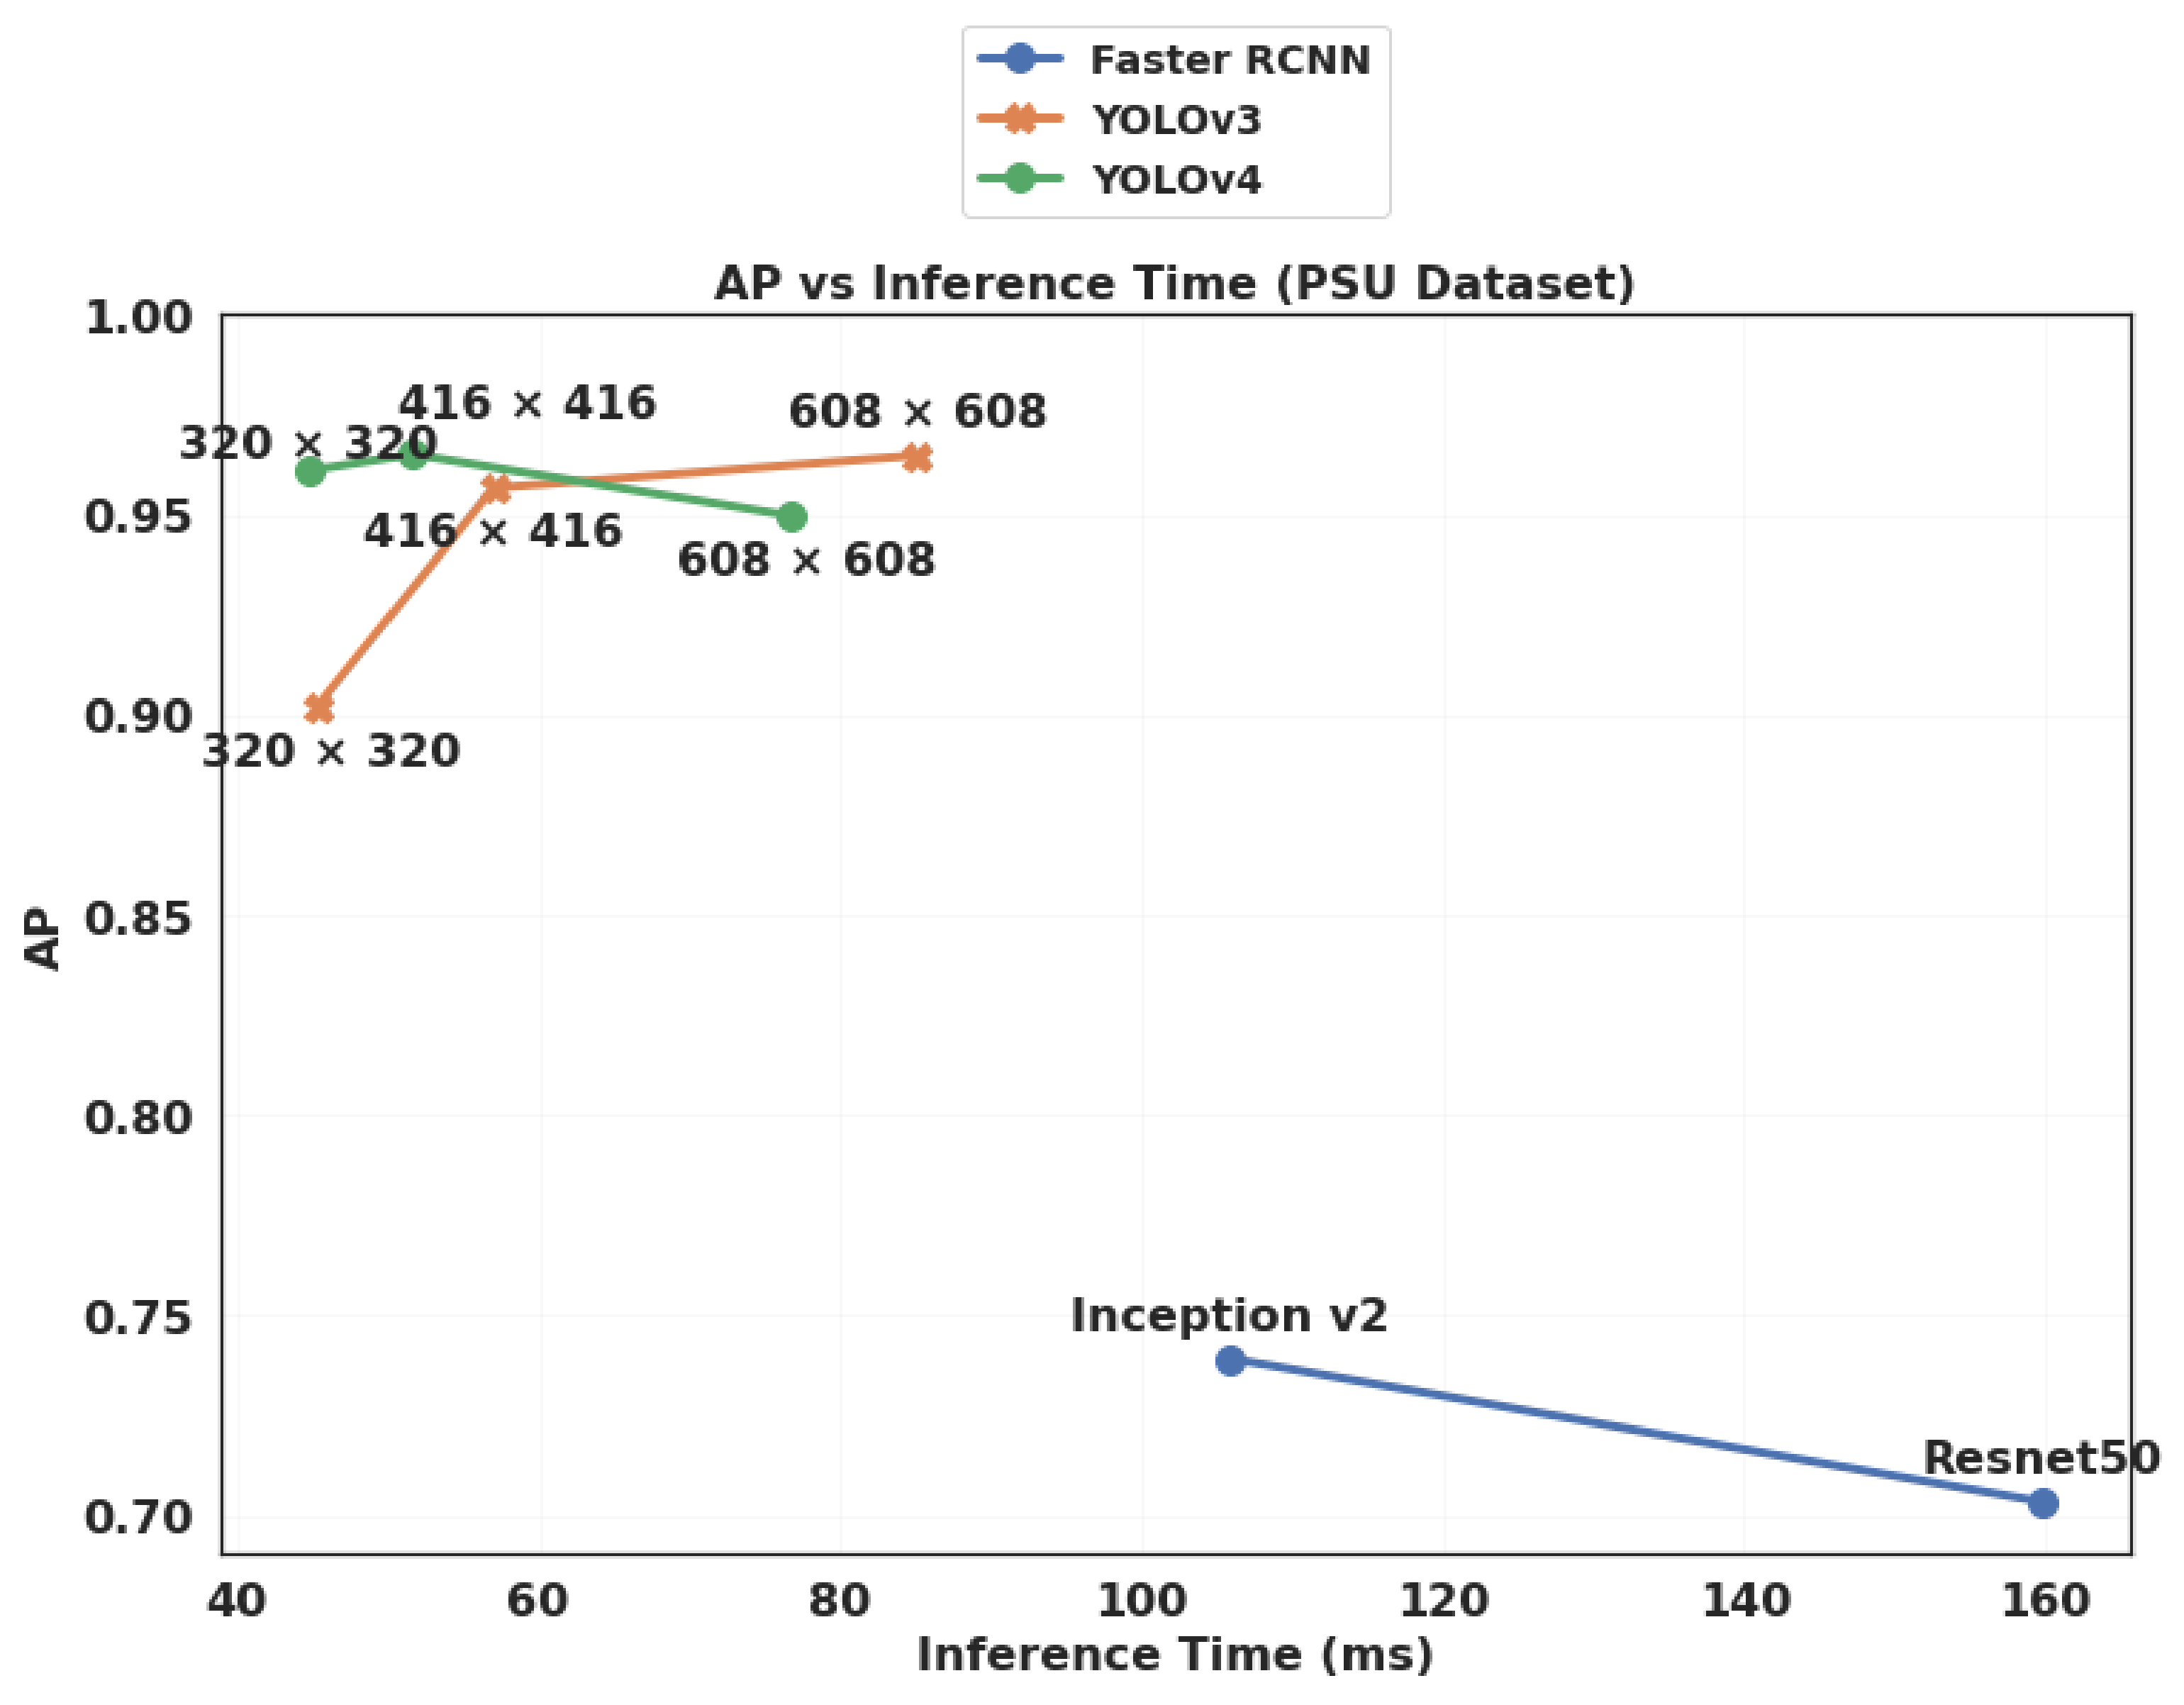
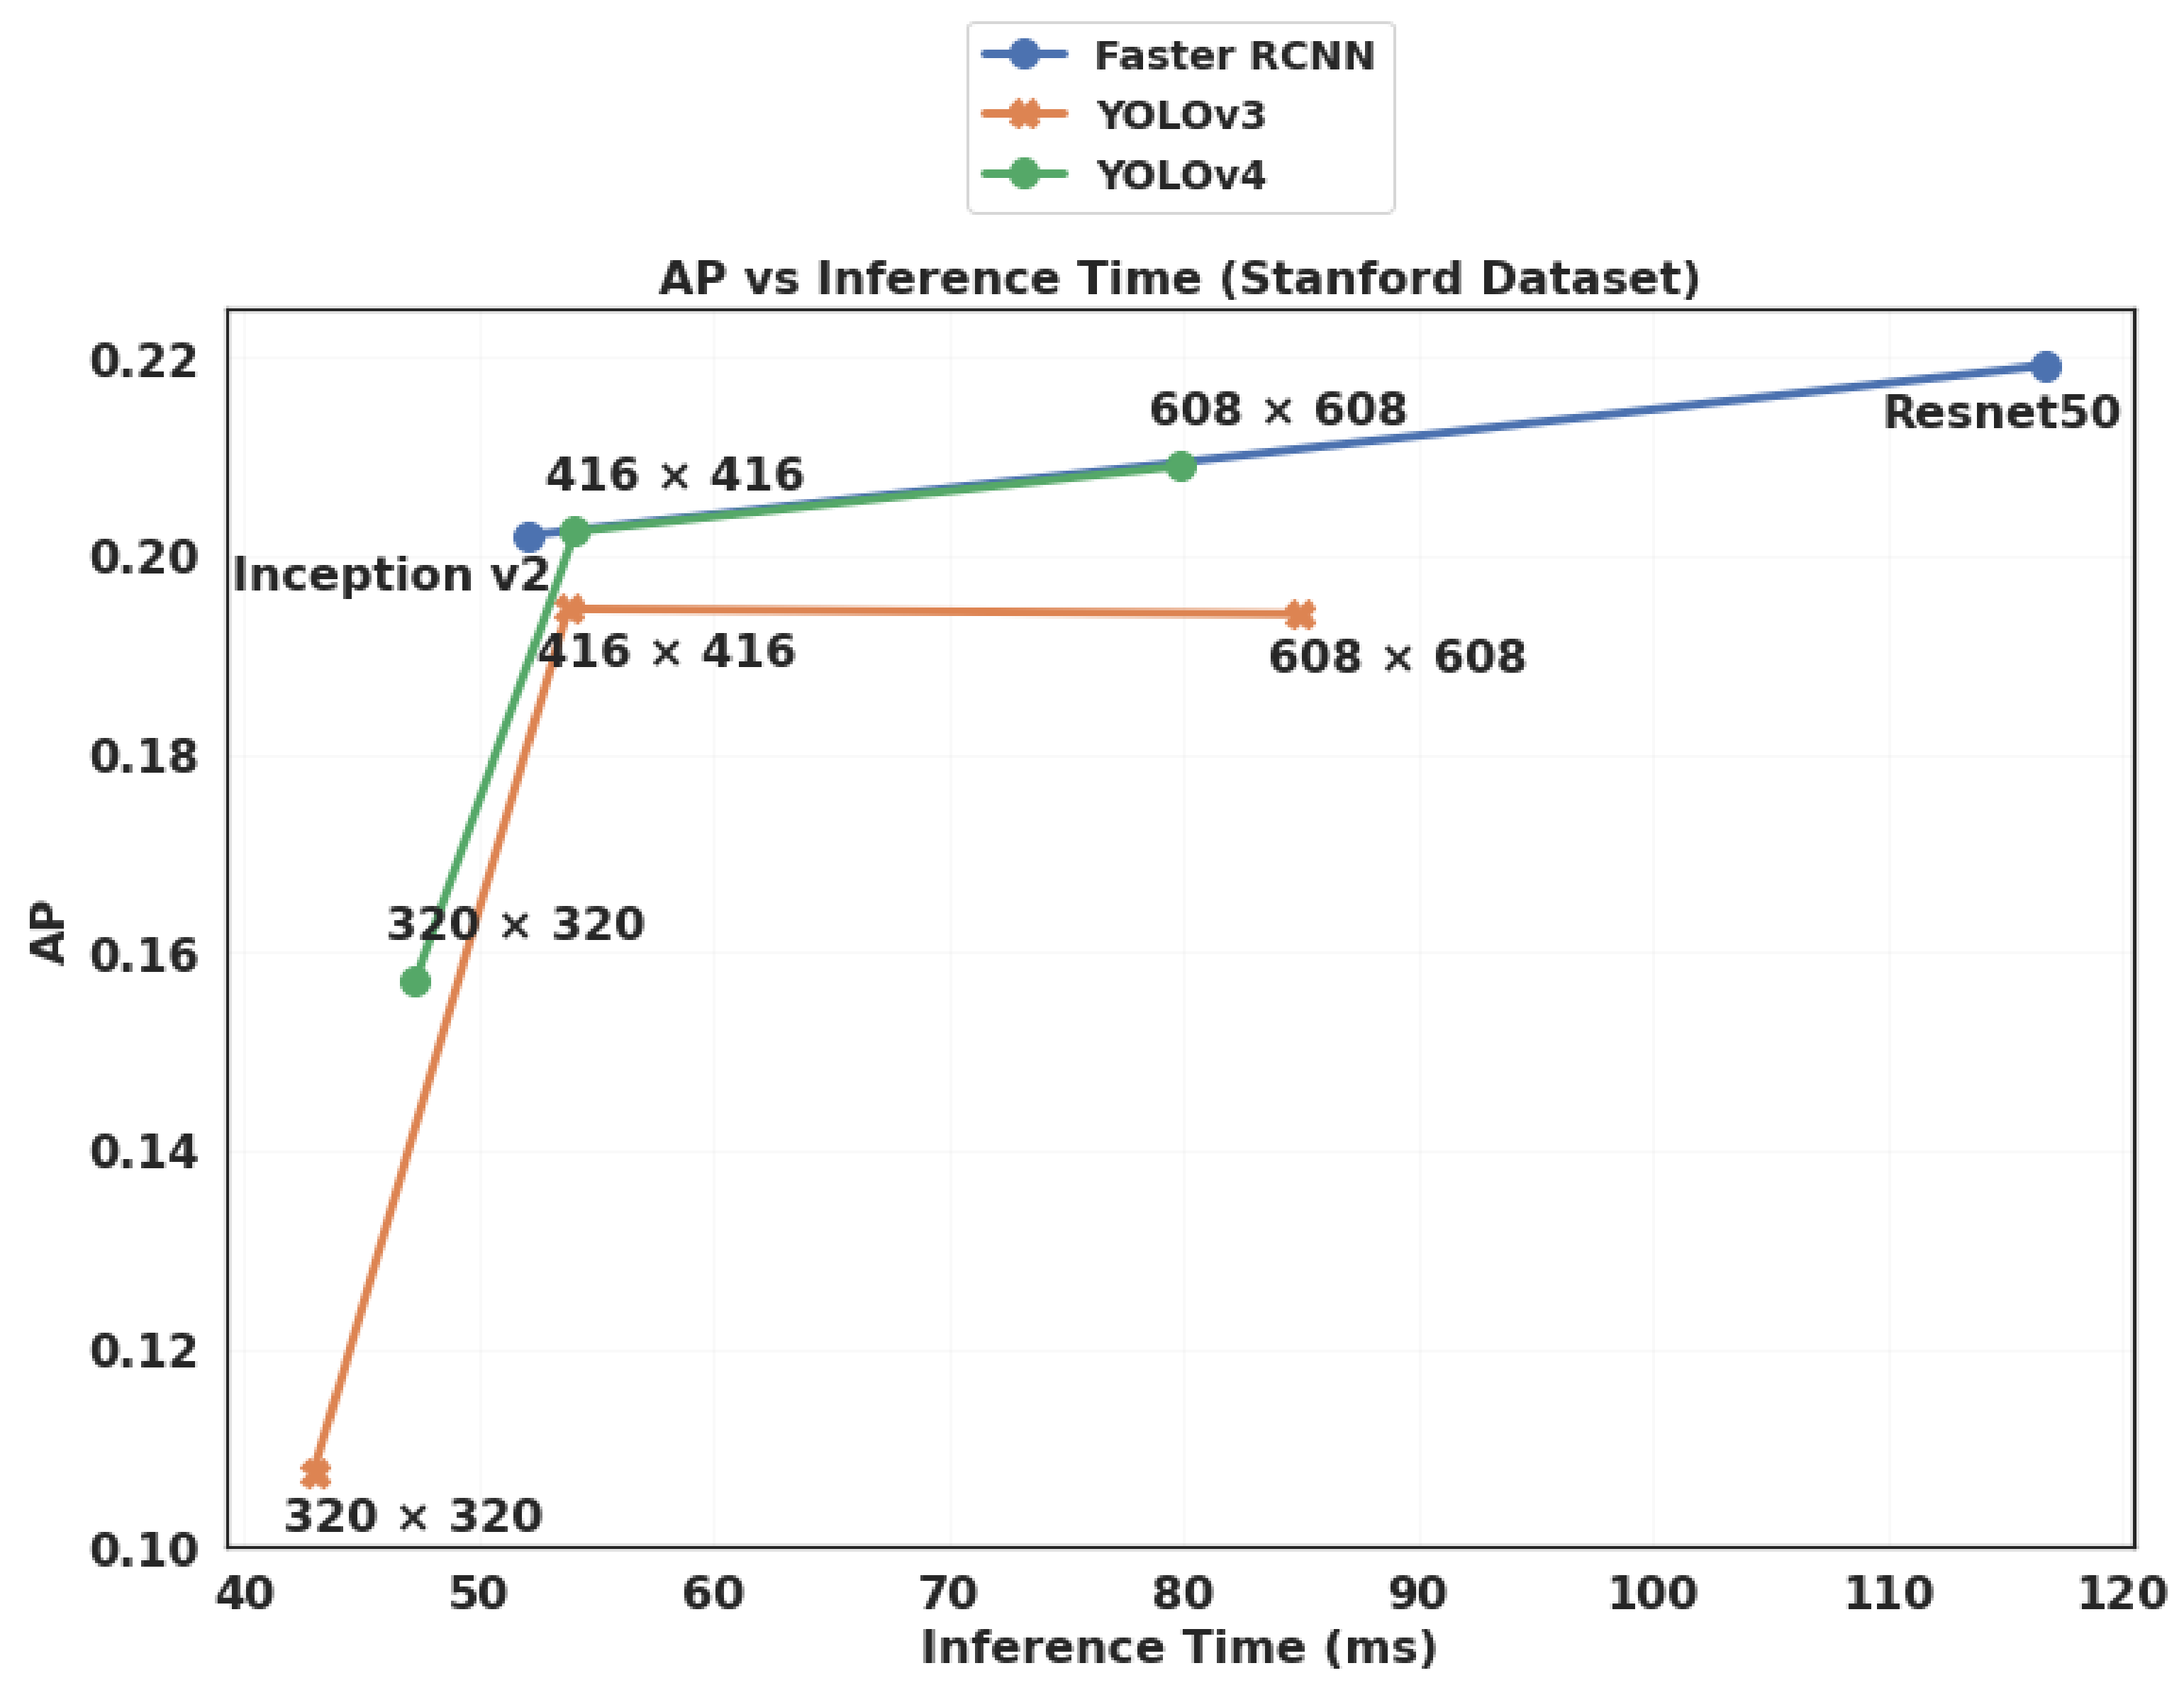
4.3.4. Inference Speed
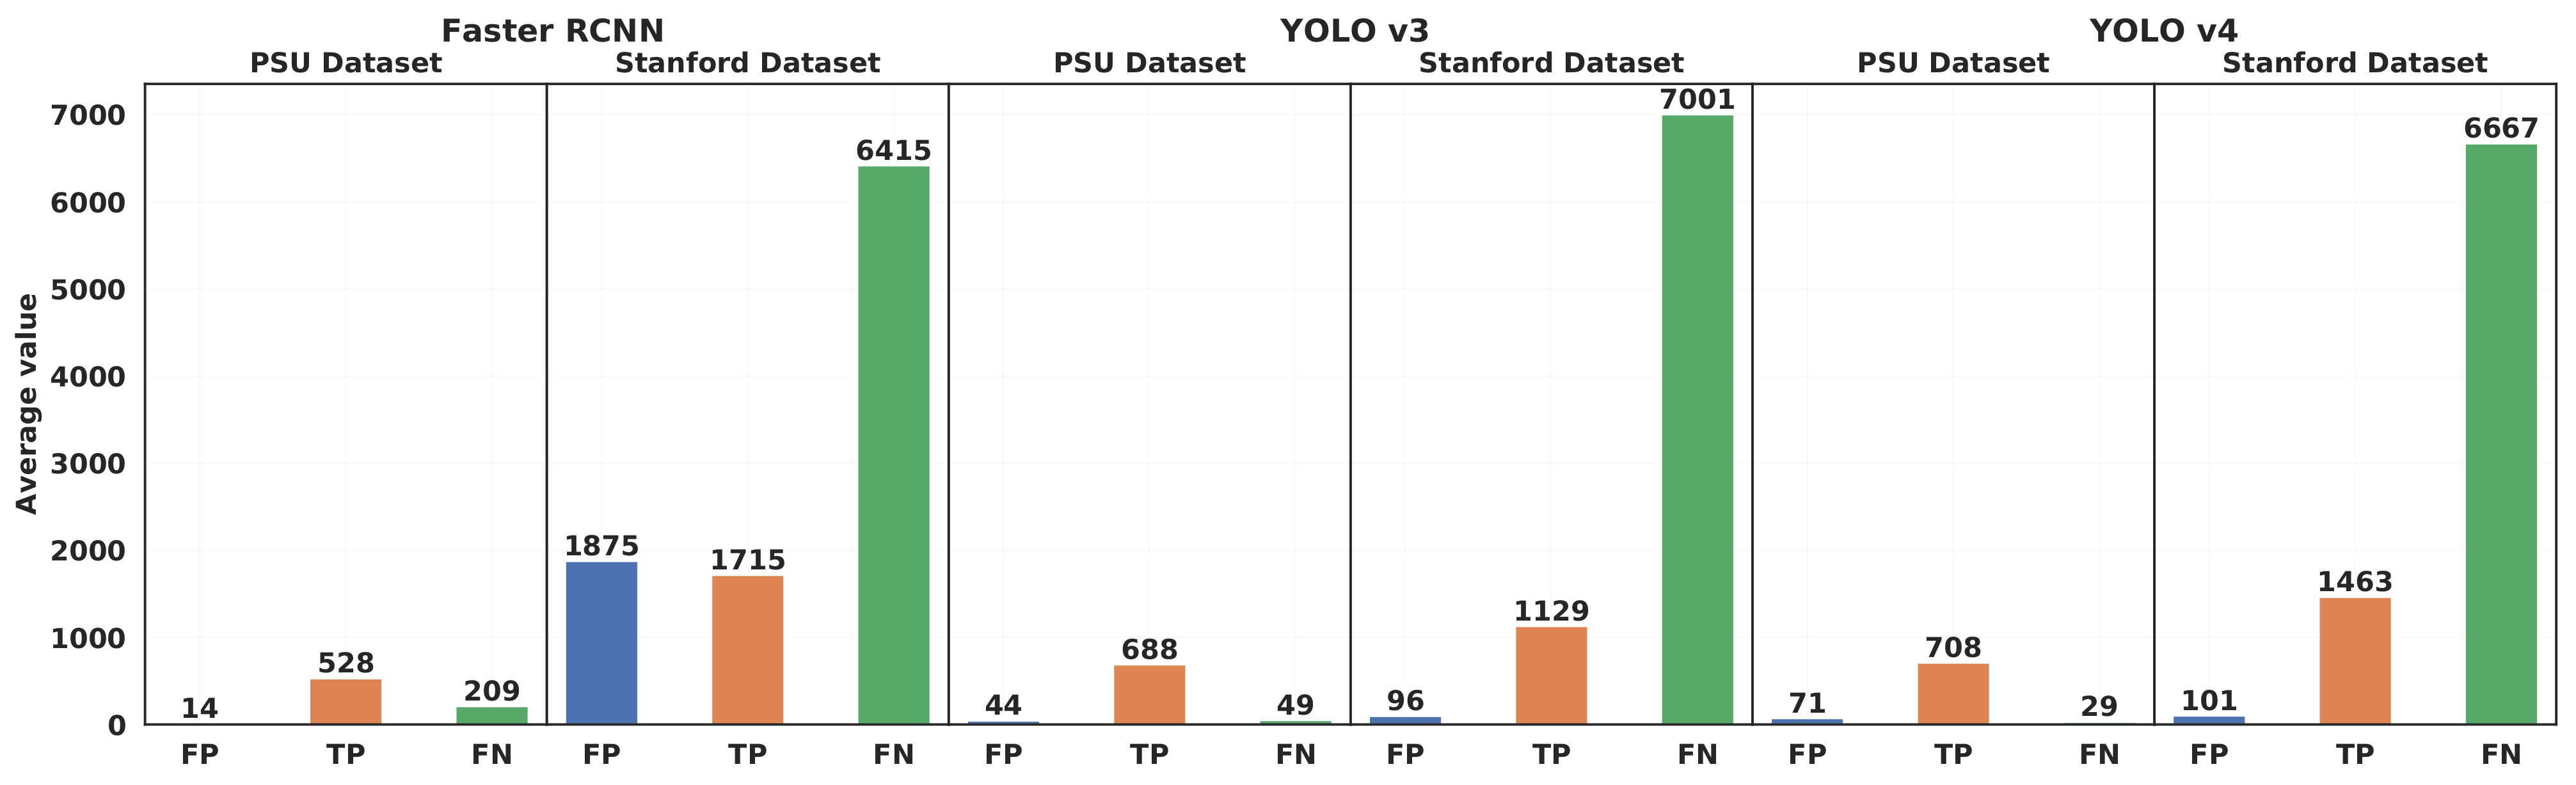
4.3.5. Effect of the Dataset Characteristics
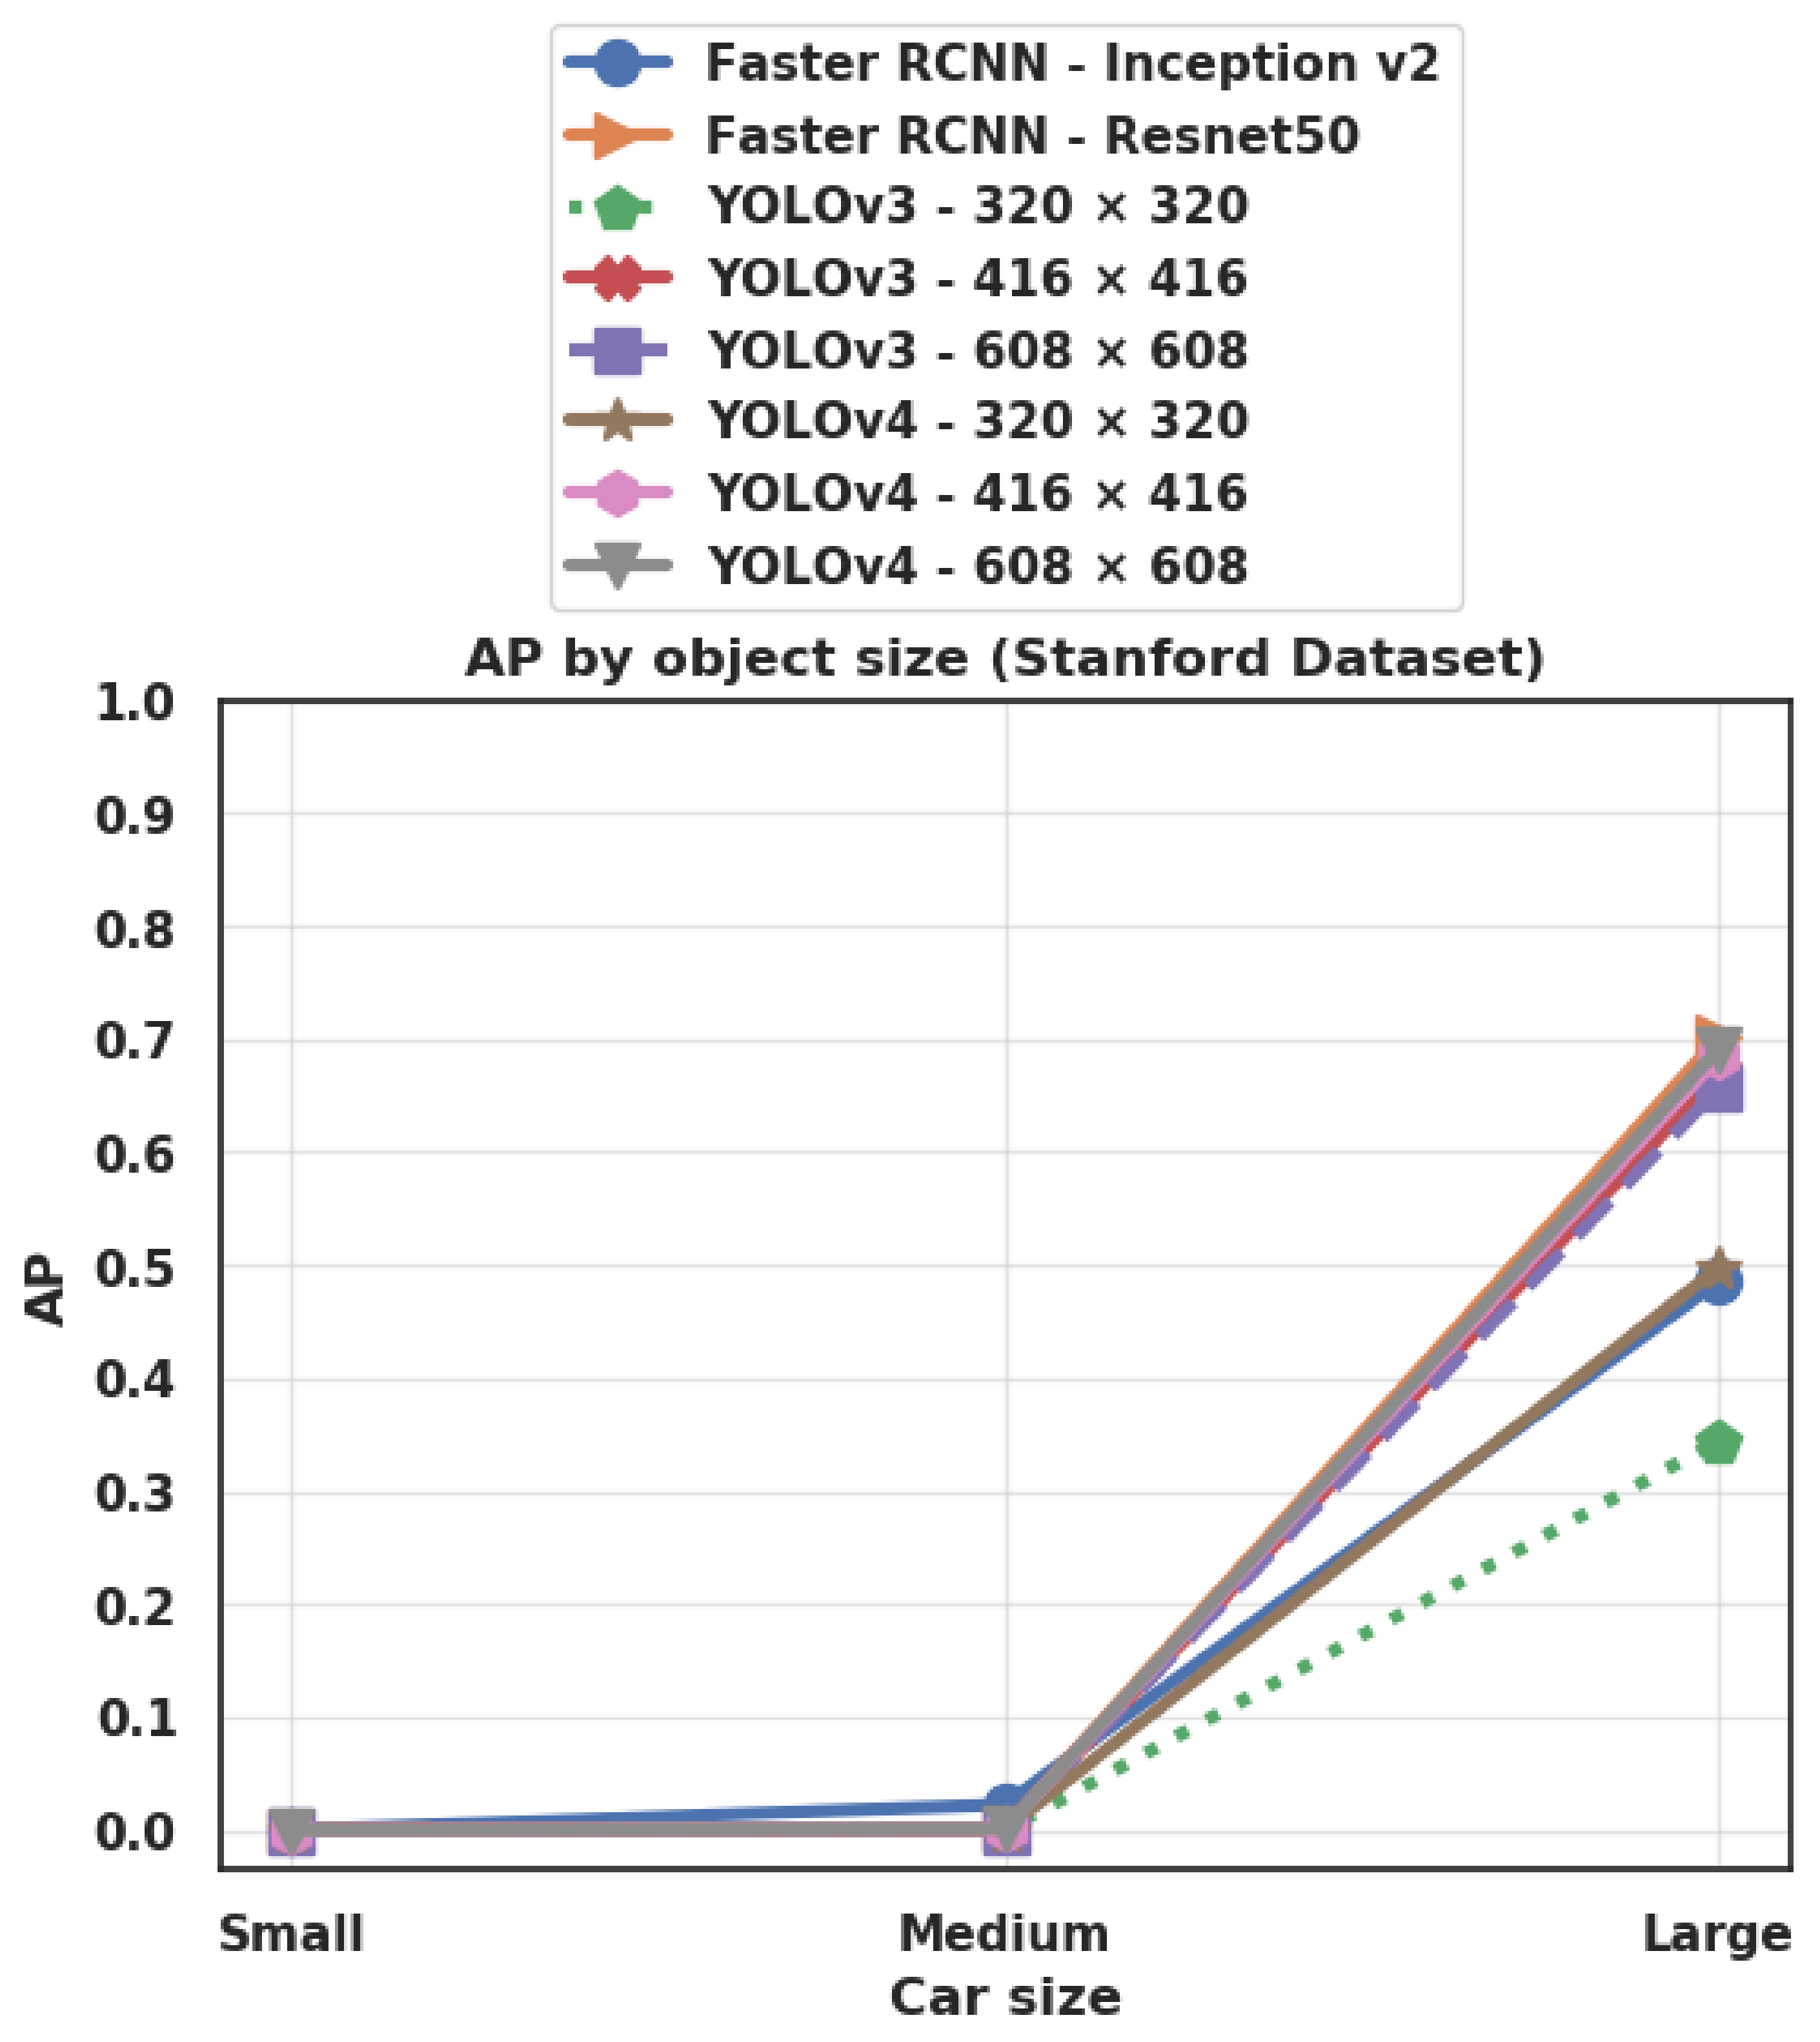
4.3.6. Effect of Object Size
4.3.7. Effect of the Feature Extractor
4.3.8. Effect of the Input Size
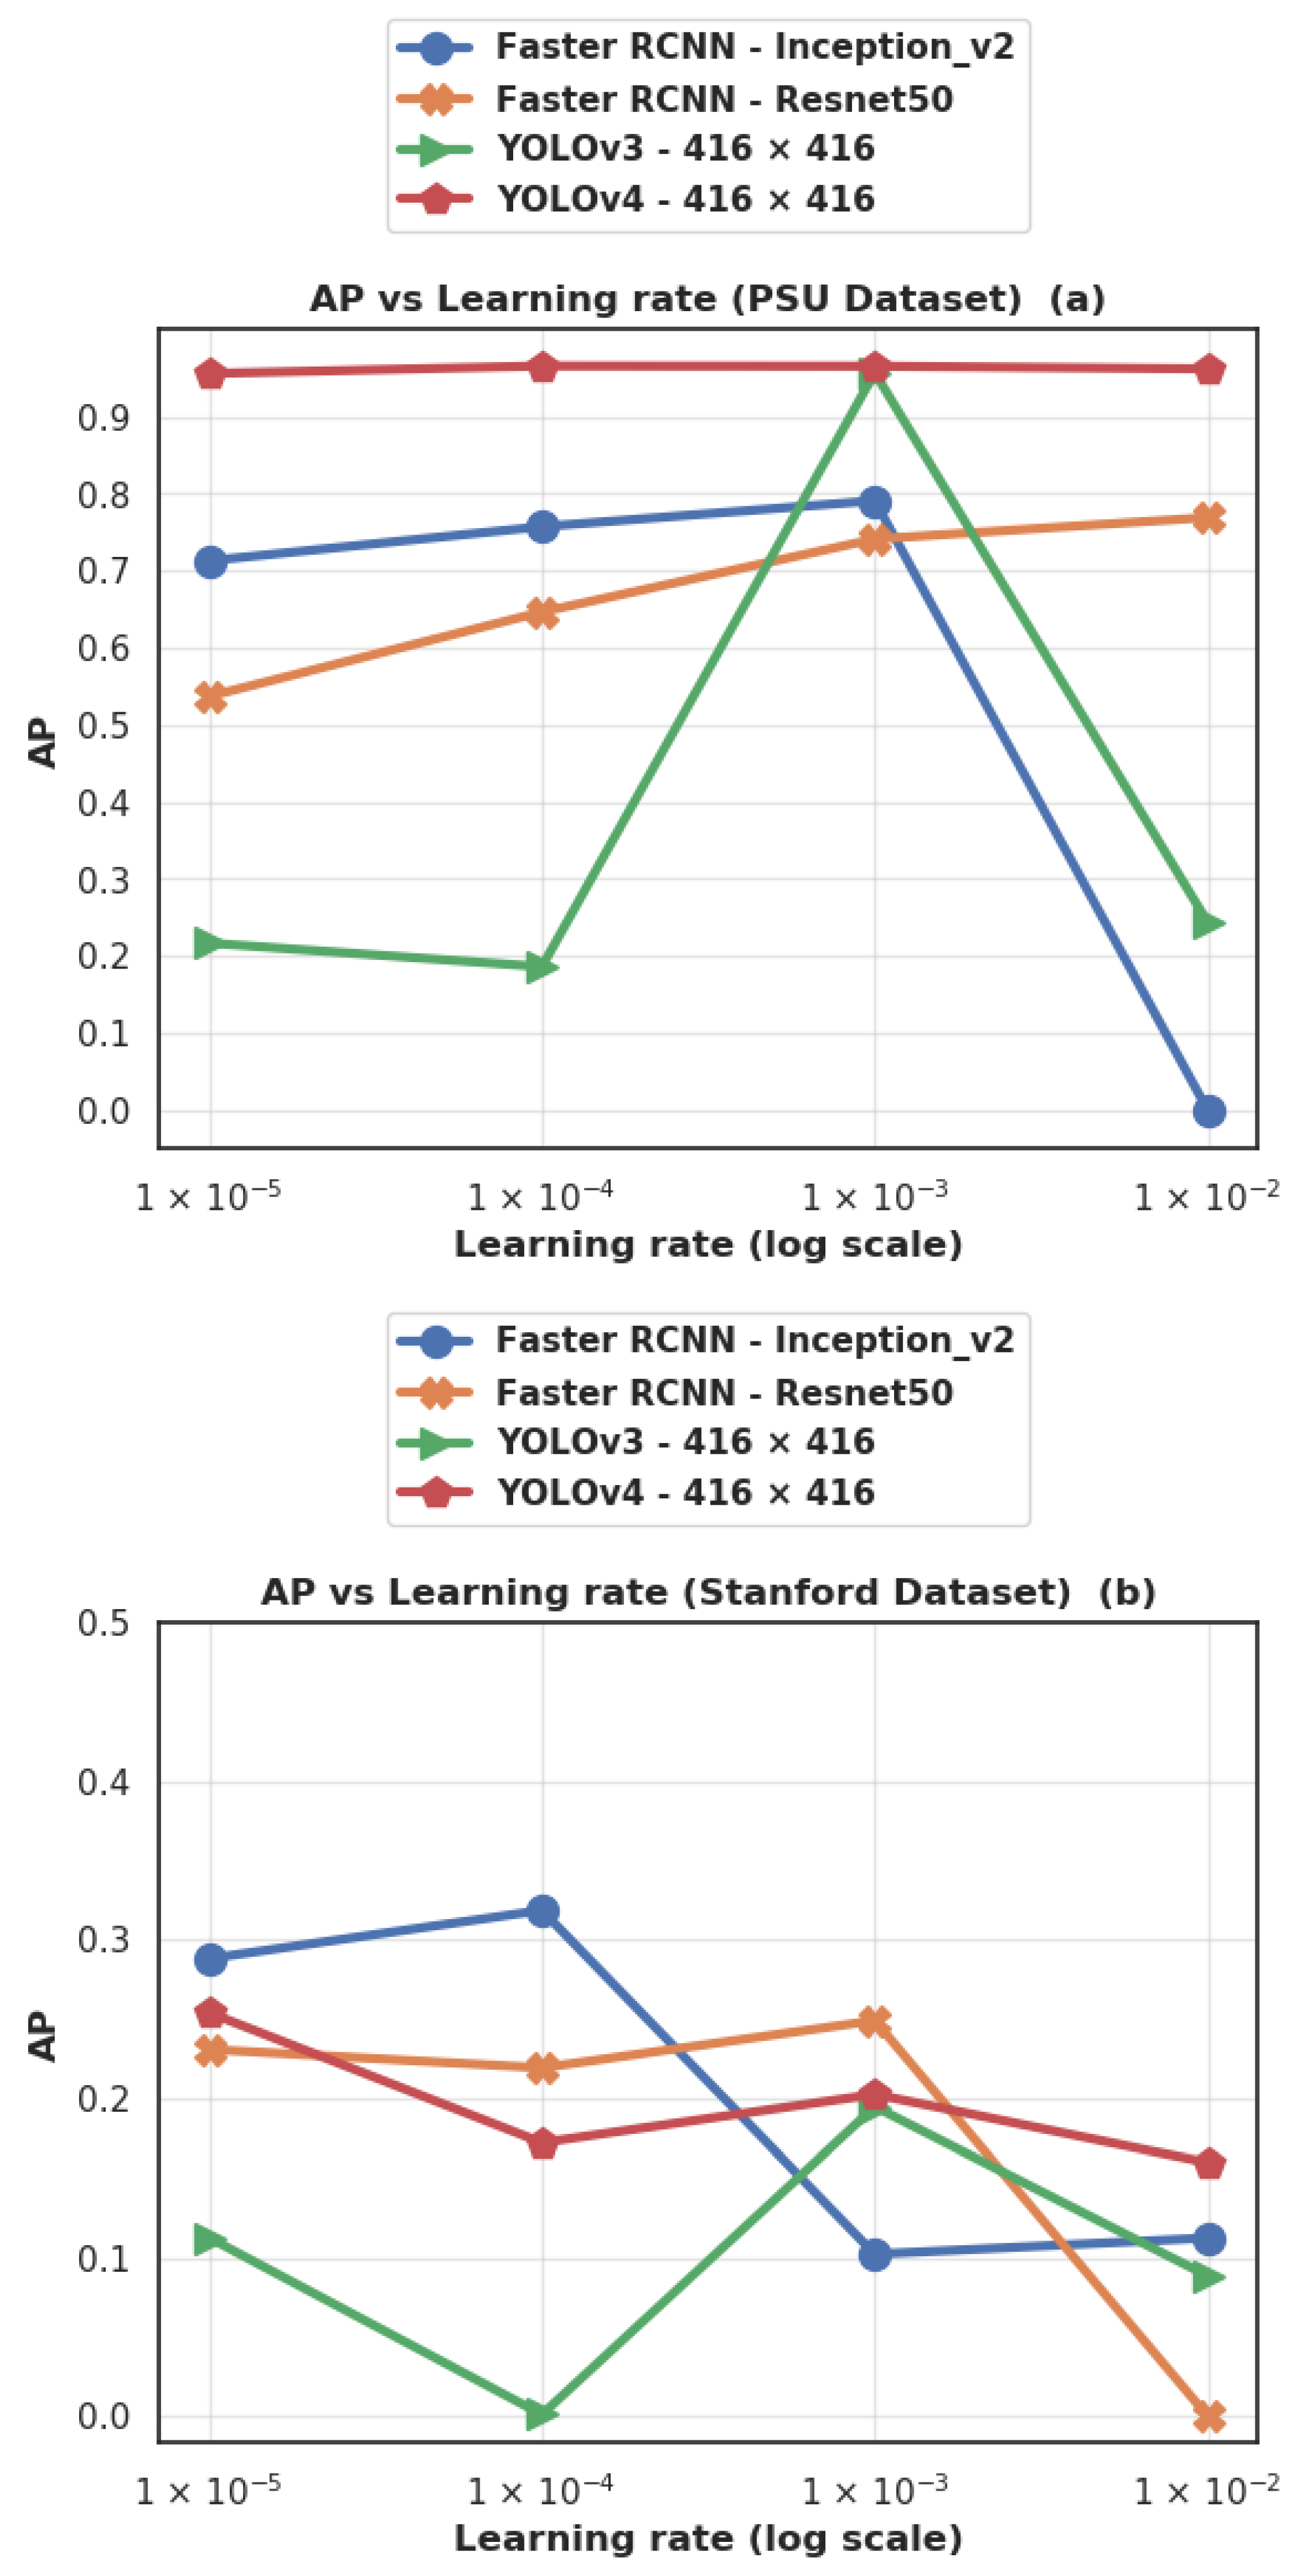
4.3.9. Effect of the Learning Rate
4.3.10. Effect of the Anchor Scales
4.3.11. Main Lessons Learned
5. Conclusions
Author Contributions
Funding
Data Availability Statement
Acknowledgments
Conflicts of Interest
References
- Benjdira, B.; Khursheed, T.; Koubaa, A.; Ammar, A.; Ouni, K. Car Detection using Unmanned Aerial Vehicles: Comparison between Faster R-CNN and YOLOv3. In Proceedings of the 2019 IEEE 1st International Conference on Unmanned Vehicle Systems-Oman (UVS), Muscat, Oman, 5–7 February 2019; pp. 1–6. [Google Scholar]
- Koubaa, A.; Qureshi, B. DroneTrack: Cloud-Based Real-Time Object Tracking Using Unmanned Aerial Vehicles Over the Internet. IEEE Access 2018, 6, 13810–13824. [Google Scholar] [CrossRef]
- Alotaibi, E.T.; Alqefari, S.S.; Koubaa, A. LSAR: Multi-UAV Collaboration for Search and Rescue Missions. IEEE Access 2019, 7, 55817–55832. [Google Scholar] [CrossRef]
- Xi, X.; Yu, Z.; Zhan, Z.; Tian, C.; Yin, Y. Multi-task Cost-sensitive-Convolutional Neural Network for Car Detection. IEEE Access 2019, 7, 98061–98068. [Google Scholar] [CrossRef]
- Menouar, H.; Guvenc, I.; Akkaya, K.; Uluagac, A.S.; Kadri, A.; Tuncer, A. UAV-Enabled Intelligent Transportation Systems for the Smart City: Applications and Challenges. IEEE Commun. Mag. 2017, 55, 22–28. [Google Scholar] [CrossRef]
- Mundhenk, T.N.; Konjevod, G.; Sakla, W.A.; Boakye, K. A large contextual dataset for classification, detection and counting of cars with deep learning. In European Conference on Computer Vision; Springer: Berlin/Heidelberg, Germany, 2016; pp. 785–800. [Google Scholar]
- Li, X.; Luo, M.; Ji, S.; Zhang, L.; Lu, M. Evaluating generative adversarial networks based image-level domain transfer for multi-source remote sensing image segmentation and object detection. Int. J. Remote Sens. 2020, 41, 7327–7351. [Google Scholar] [CrossRef]
- Liu, K.; Mattyus, G. Fast Multiclass Vehicle Detection on Aerial Images. IEEE Geosci. Remote Sens. Lett. 2015, 12, 1938–1942. [Google Scholar] [CrossRef] [Green Version]
- Audebert, N.; Le Saux, B.; Lefèvre, S. Segment-before-Detect: Vehicle Detection and Classification through Semantic Segmentation of Aerial Images. Remote Sens. 2017, 9, 368. [Google Scholar] [CrossRef] [Green Version]
- Ma, B.; Liu, Z.; Jiang, F.; Yan, Y.; Yuan, J.; Bu, S. Vehicle Detection in Aerial Images Using Rotation-Invariant Cascaded Forest. IEEE Access 2019, 7, 59613–59623. [Google Scholar] [CrossRef]
- Ševo, I.; Avramović, A. Convolutional Neural Network Based Automatic Object Detection on Aerial Images. IEEE Geosci. Remote Sens. Lett. 2016, 13, 740–744. [Google Scholar] [CrossRef]
- Ochoa, K.S.; Guo, Z. A framework for the management of agricultural resources with automated aerial imagery detection. Comput. Electron. Agric. 2019, 162, 53–69. [Google Scholar] [CrossRef]
- Kampffmeyer, M.; Salberg, A.; Jenssen, R. Semantic Segmentation of Small Objects and Modeling of Uncertainty in Urban Remote Sensing Images Using Deep Convolutional Neural Networks. In Proceedings of the 2016 IEEE Conference on Computer Vision and Pattern Recognition Workshops (CVPRW), Las Vegas, NV, USA, 26 June–1 July 2016; pp. 680–688. [Google Scholar] [CrossRef]
- Azimi, S.M.; Fischer, P.; Körner, M.; Reinartz, P. Aerial LaneNet: Lane-Marking Semantic Segmentation in Aerial Imagery Using Wavelet-Enhanced Cost-Sensitive Symmetric Fully Convolutional Neural Networks. IEEE Trans. Geosci. Remote Sens. 2019, 57, 2920–2938. [Google Scholar] [CrossRef] [Green Version]
- Mou, L.; Zhu, X.X. Vehicle Instance Segmentation From Aerial Image and Video Using a Multitask Learning Residual Fully Convolutional Network. IEEE Trans. Geosci. Remote Sens. 2018, 56, 6699–6711. [Google Scholar] [CrossRef] [Green Version]
- Benjdira, B.; Bazi, Y.; Koubaa, A.; Ouni, K. Unsupervised Domain Adaptation Using Generative Adversarial Networks for Semantic Segmentation of Aerial Images. Remote Sens. 2019, 11, 1369. [Google Scholar] [CrossRef] [Green Version]
- Jiao, L.; Zhang, F.; Liu, F.; Yang, S.; Li, L.; Feng, Z.; Qu, R. A survey of deep learning-based object detection. IEEE Access 2019, 7, 128837–128868. [Google Scholar] [CrossRef]
- Lin, T.Y.; Maire, M.; Belongie, S.; Hays, J.; Perona, P.; Ramanan, D.; Dollár, P.; Zitnick, C.L. Microsoft coco: Common objects in context. In European Conference on Computer Vision; Springer: Berlin/Heidelberg, Germany, 2014; pp. 740–755. [Google Scholar]
- Ren, S.; He, K.; Girshick, R.; Sun, J. Faster R-CNN: Towards Real-Time Object Detection with. IEEE Trans. Pattern Anal. Mach. Intell. 2017. [Google Scholar] [CrossRef] [PubMed] [Green Version]
- Redmon, J.; Farhadi, A. YOLOv3: An Incremental Improvement. arXiv 2018, arXiv:1804.02767. [Google Scholar]
- Bochkovskiy, A.; Wang, C.Y.; Liao, H.Y.M. YOLOv4: Optimal Speed and Accuracy of Object Detection. arXiv 2020, arXiv:2004.10934. [Google Scholar]
- Kim, C.E.; Oghaz, M.M.D.; Fajtl, J.; Argyriou, V.; Remagnino, P. A comparison of embedded deep learning methods for person detection. arXiv 2018, arXiv:1812.03451. [Google Scholar]
- Wu, B.; Iandola, F.; Jin, P.H.; Keutzer, K. Squeezedet: Unified, small, low power fully convolutional neural networks for real-time object detection for autonomous driving. In Proceedings of the IEEE Conference on Computer Vision and Pattern Recognition Workshops, Honolulu, HI, USA, 21–26 July 2017; pp. 129–137. [Google Scholar]
- Liu, W.; Anguelov, D.; Erhan, D.; Szegedy, C.; Reed, S.; Fu, C.Y.; Berg, A.C. SSD: Single shot multibox detector. In Lecture Notes in Computer Science (Including Subseries Lecture Notes in Artificial Intelligence and Lecture Notes in Bioinformatics); Springer: Cham, Switzerland, 2016. [Google Scholar] [CrossRef] [Green Version]
- Hardjono, B.; Tjahyadi, H.; Rhizma, M.G.A.; Widjaja, A.E.; Kondorura, R.; Halim, A.M. Vehicle Counting Quantitative Comparison Using Background Subtraction, Viola Jones and Deep Learning Methods. In Proceedings of the 2018 IEEE 9th Annual Information Technology, Electronics and Mobile Communication Conference (IEMCON), Vancouver, BC, Canada, 1–3 November 2018; pp. 556–562. [Google Scholar]
- Viola, P.; Jones, M. Rapid object detection using a boosted cascade of simple features. In Proceedings of the 2001 IEEE Computer Society Conference on Computer Vision and Pattern Recognition, CVPR 2001, Kauai, HI, USA, 8–14 December 2001; Volume 1, p. I. [Google Scholar]
- Freund, Y.; Schapire, R.E. A decision-theoretic generalization of on-line learning and an application to boosting. J. Comput. Syst. Sci. 1997, 55, 119–139. [Google Scholar] [CrossRef] [Green Version]
- Redmon, J.; Farhadi, A. YOLO9000: Better, Faster, Stronger. In Proceedings of the 2017 IEEE Conference on Computer Vision and Pattern Recognition, CVPR 2017, Honolulu, HI, USA, 21–26 July 2017; pp. 6517–6525. [Google Scholar] [CrossRef] [Green Version]
- Tayara, H.; Gil Soo, K.; Chong, K.T. Vehicle Detection and Counting in High-Resolution Aerial Images Using Convolutional Regression Neural Network. IEEE Access 2018, 6, 2220–2230. [Google Scholar] [CrossRef]
- Chen, X.Y.; Xiang, S.M.; Liu, C.L.; Pan, C.H. Vehicle Detection in Satellite Images by Hybrid Deep Convolutional Neural Networks. IEEE Geosci. Remote Sens. Lett. 2014. [Google Scholar] [CrossRef]
- Ammour, N.; Alhichri, H.; Bazi, Y.; Benjdira, B.; Alajlan, N.; Zuair, M. Deep Learning Approach for Car Detection in UAV Imagery. Remote Sens. 2017, 9, 312. [Google Scholar] [CrossRef] [Green Version]
- Simonyan, K.; Zisserman, A. Very Deep Convolutional Networks for Large-Scale Image Recognition. Int. Conf. Learn. Represent. (ICRL) 2015. [Google Scholar] [CrossRef] [Green Version]
- Dollár, P.; Tu, Z.; Perona, P.; Belongie, S. Integral channel features. Proc. Br. Mach. Conf. 2009, 91.1–91.11. [Google Scholar] [CrossRef] [Green Version]
- Carranza-García, M.; Torres-Mateo, J.; Lara-Benítez, P.; García-Gutiérrez, J. On the Performance of One-Stage and Two-Stage Object Detectors in Autonomous Vehicles Using Camera Data. Remote Sens. 2021, 13, 89. [Google Scholar]
- Girshick, R.; Donahue, J.; Darrell, T.; Malik, J. Rich feature hierarchies for accurate object detection and semantic segmentation. In Proceedings of the IEEE Computer Society Conference on Computer Vision and Pattern Recognition, Columbus, OH, USA, 23–28 June 2014; pp. 580–587. [Google Scholar] [CrossRef] [Green Version]
- Girshick, R. Fast R-CNN. In Proceedings of the IEEE International Conference on Computer Vision, Santiago, Chile, 7–13 December 2015. [Google Scholar] [CrossRef]
- Redmon, J.; Divvala, S.K.; Girshick, R.B.; Farhadi, A. You Only Look Once: Unified, Real-Time Object Detection. In Proceedings of the 2016 IEEE Conference on Computer Vision and Pattern Recognition, CVPR 2016, Las Vegas, NV, USA, 27–30 June 2016; pp. 779–788. [Google Scholar] [CrossRef] [Green Version]
- He, K.; Zhang, X.; Ren, S.; Sun, J. Deep Residual Learning for Image Recognition. In Proceedings of the IEEE Conference on Computer Vision and Pattern Recognition, Las Vegas, NV, USA, 27–30 June 2016. [Google Scholar] [CrossRef] [Green Version]
- Yun, S.; Han, D.; Chun, S.; Oh, S.J.; Yoo, Y.; Choe, J. CutMix: Regularization Strategy to Train Strong Classifiers with Localizable Features. In Proceedings of the 2019 IEEE/CVF International Conference on Computer Vision (ICCV), Seoul, Korea, 27–28 October 2019. [Google Scholar] [CrossRef] [Green Version]
- Ghiasi, G.; Lin, T.Y.; Le, Q.V. DropBlock: A regularization method for convolutional networks. arXiv 2018, arXiv:1810.12890. [Google Scholar]
- Zheng, Z.; Wang, P.; Liu, W.; Li, J.; Ye, R.; Ren, D. Distance-IoU Loss: Faster and Better Learning for Bounding Box Regression. arXiv 2019, arXiv:1911.08287. [Google Scholar]
- Yao, Z.; Cao, Y.; Zheng, S.; Huang, G.; Lin, S. Cross-Iteration Batch Normalization. arXiv 2020, arXiv:2002.05712. [Google Scholar]
- Loshchilov, I.; Hutter, F. SGDR: Stochastic Gradient Descent with Warm Restarts. arXiv 2016, arXiv:1608.03983. [Google Scholar]
- Misra, D. Mish: A Self Regularized Non-Monotonic Neural Activation Function. arXiv 2019, arXiv:1908.08681. [Google Scholar]
- Wang, C.Y.; Liao, H.Y.M.; Yeh, I.H.; Wu, Y.H.; Chen, P.Y.; Hsieh, J.W. CSPNet: A New Backbone that can Enhance Learning Capability of CNN. arXiv 2019, arXiv:1911.11929. [Google Scholar]
- Tan, M.; Pang, R.; Le, Q.V. Efficientdet: Scalable and efficient object detection. arXiv 2019, arXiv:1911.09070. [Google Scholar]
- Huang, Z.; Wang, J.; Fu, X.; Yu, T.; Guo, Y.; Wang, R. DC-SPP-YOLO: Dense connection and spatial pyramid pooling based YOLO for object detection. Inf. Sci. 2020, 522, 241–258. [Google Scholar] [CrossRef] [Green Version]
- Woo, S.; Park, J.; Lee, J.Y.; Kweon, I.S. CBAM: Convolutional Block Attention Module. Lect. Notes Comput. Sci. 2018, 3–19. [Google Scholar] [CrossRef] [Green Version]
- Liu, S.; Qi, L.; Qin, H.; Shi, J.; Jia, J. Path Aggregation Network for Instance Segmentation. In Proceedings of the 2018 IEEE/CVF Conference on Computer Vision and Pattern Recognition, Salt Lake City, UT, USA, 18–23 June 2018. [Google Scholar] [CrossRef] [Green Version]
- Robicquet, A.; Sadeghian, A.; Alahi, A.; Savarese, S. Learning social etiquette: Human trajectory understanding in crowded scenes. In European Conference on Computer Vision; Springer: Berlin/Heidelberg, Germany, 2016; pp. 549–565. [Google Scholar]
- Aerial-Car-Dataset. Available online: https://github.com/jekhor/aerial-cars-dataset (accessed on 16 October 2018).
- PSU Car Dataset. Available online: https://github.com/aniskoubaa/psu-car-dataset (accessed on 7 August 2020).
- Ioffe, S.; Szegedy, C. Batch Normalization: Accelerating Deep Network Training by Reducing Internal Covariate Shift. In Proceedings of the Machine Learning Research, Lille, France, 7–9 July 2015; pp. 448–456. [Google Scholar]
- Bianco, S.; Cadene, R.; Celona, L.; Napoletano, P. Benchmark analysis of representative deep neural network architectures. IEEE Access 2018, 6, 64270–64277. [Google Scholar] [CrossRef]
- Koubaa, A.; Ammar, A.; Kanhouch, A.; Alhabashi, Y. Cloud versus Edge Deployment Strategies of Real-Time Face Recognition Inference. IEEE Trans. Netw. Sci. Eng. 2021. [Google Scholar] [CrossRef]


| Ref. | Dataset Used | Algorithms | Main Results |
|---|---|---|---|
| Mundhenk et al., 2016 [6] | Cars Overhead with Context (COWC): 32,716 unique cars. 58,247 negative targets. 308,988 training patches and 79,447 testing patches. Annotated using single pixel points. Resolution: 1024 × 1024 and 2048 × 2048. | ResCeption (Inception with Residual Learning) | Up to 99.14% correctly classified patches (containing cars or not). F1 score of 94.34% for detection. Car counting: RMSE of 0.676. |
| Xi et al., 2019 [4] | Parking lot dataset from aerial view. Training: 2000 images. Testing: 1000 images. Number of instances: NA. Resolution: 5456 × 3632. | Multi-Task Cost-sensitive Convolutional Neural Network (MTCS-CNN). | mAP of 85.3% for car detection. |
| Chen et al., 2014 [30] | 63 satellite images collected from Google Earth. Training: 31 images (3901 vehicles). Testing: 32 images (2870 vehicles). Resolution: 1368 × 972. | Hybrid Deep Convolutional Neural Network (HDNN). | Precision up to 98% at a recall rate of 80%. |
| Ammour et al., 2017 [31] | 8 images acquired by UAV. Training: 3 images (136 positive instances, and 1864 negative instances). Testing: 5 images (127 positive instances). Resolution: Variable from 2424 × 3896 to 3456 × 5184. Spatial resolution of 2 cm. | Pre-trained CNN coupled with a linear support vector machine (SVM). | Precision from 67% up to 100%, and recall from 74% up to 84%, on the five testing images. Inference time: between 11 and 30 min/image. |
| Hardjono et al., 2018 [25] | 4 CCTV datasets: - Dataset 1: 3 s videos at 1 FPS. Resolution: 480 × 360 - Dataset 2: 60 min:32 sec video at 9 FPS. Resolution: 1920 × 1080 - Dataset 3: 30 min:27 sec video at 30 FPS. Resolution: 1280 × 720 - Dataset 4: 32 sec video at 30 FPS. Resolution: 1280 × 720 Training: 1932 positive instances and 10,000 negative instances. | - Background Subtraction (BS) - Viola Jones (VJ) - YOLOv2 | - BS: F1 score from 32% to 55%. Inference time from 23 to 40 ms. - VJ: F1 score from 61% to 75%. Inference time from 39 to 640 ms. - YOLOv2: F1 score from 92% to 100% on Datasets 2 to 4. Inference time not reported. |
| Benjdira et al., 2019 [1] | PSU+[27] UAV dataset: Training: 218 images (3365 car instances). Testing: 52 images (737 car instances). Resolution: Variable from 684 × 547 to 4000 × 2250. | - YOLOv3 (input size: 608 × 608). - Faster R-CNN (Feature extractor: Inception ResNet v2). | - YOLOv3: F1 score of 99.9%. Inference time: 57 ms. - Faster R-CNN: F1 score of 88%. Inference time: 1.39 s. (Using an Nvidia GTX 1080 GPU). |
| Our paper | - Stanford UAV dataset: Training: 6872 images (74,826 car instances). Testing: 1634 images (8131 car instances). Resolution: Variable from 1184 × 1759 to 1434 × 1982. PSU+[27] UAV dataset: Training: 218 images (3365 car instances). Testing: 52 images (737 car instances). Resolution: Variable from 684 × 547 to 4000 × 2250. | - YOLOv3 and YOLOv4 (input sizes: 320 × 320, 416 × 416, and 608 × 608). - Faster R-CNN (Feature extractors: Inception v2, and Resnet50). | - YOLOv4: F1 score: up to 34.4% on the Stanford dataset up to 94.6% on the PSU dataset. Inference time: from 45 to 80 ms. - YOLOv3: F1 score: up to 32.6% on the Stanford dataset up to 96.0% on the PSU dataset. Inference time: from 43 to 85 ms. - Faster R-CNN: F1 score: up to 31.4% on the Stanford dataset up to 84.5% on the PSU dataset. Inference time: from 52 to 160 ms. (Using an Nvidia GTX 1080 GPU). |
| YOLOv3 | YOLOv4 | Faster R-CNN | |
|---|---|---|---|
| Phases | Concurrent bounding box regression, and classification | Concurrent bounding box regression, and classification | RPN + Fast R-CNN object detector |
| Neural network type | Fully convolutional. | Fully convolutional. | Fully convolutional (RPN and 4 detection network). |
| Backbone feature extractor | Darknet-53 (53 convolutional layers). | CSPDarknet53 (53 convolutional layers). | VGG-16 or Zeiler & Fergus(ZF). Other feature extractors can also be incorporated. |
| Location detection | Anchor-based (dimension clusters). | Anchor-based | Anchor-based |
| Number of anchors boxes | Only one bounding-box prior for each ground-truth object. | Using multiple anchors for a single ground truth | 3 scales and 3 aspect ratios, yielding k = 9 anchors at each sliding position. |
| Default Anchors sizes | (10,13), (16,30), (33,23), (30,61), (62,45), (59,119), (116,90), (156,198), (373,326) | (12,16), (19,36), (40,28), (36,75), (76,55), (72,146), (142,110), (192,243), (459,401) | Scales: (128,128), (256,256), (512,512). Aspect ratios: 1:1, 1:2, 2:1. |
| IoU thresholds | One (at 0.5). | One (at 0.213) | Two (at 0.3 and 0.7). |
| Loss function | Binary cross-entropy loss | Complete IoU loss: CIoU | Multi-task loss: - Log loss for classification. - Smooth L1 for regression. |
| Input size | Different possible input sizes (n × n with n multiple of 32). | Different possible input sizes (n × n with n multiple of 32). | - Conserves the aspect ratio of the original image. - Either the smallest dimension is 600, or the largest dimension is 1024. |
| Momentum | Default value: 0.9. | Default value: 0.949 | Default value: 0.9. |
| Weight decay | Default value: 0.0005. | Default value: 0.0005 | Default value: 0.0005. |
| Batch size | Default value: 64. | Default value: 64. | Default value: 1. |
| Stanford Dataset | PSU Dataset | |||||
|---|---|---|---|---|---|---|
| Training Set | Testing Set | Total | Training Set | Testing Set | Total | |
| Number of images | 6872 | 1634 | 8506 | 218 | 52 | 270 |
| Percentage | 80.8% | 19.2% | 100% | 80.7% | 19.3% | 100% |
| Number of car instances | 74,826 | 8131 | 82,957 | 3364 | 738 | 4102 |
| Size | Number of Images |
|---|---|
| 1409 × 1916 | 1634 |
| 1331 × 1962 | 1558 |
| 1330 × 1947 | 1557 |
| 1411 × 1980 | 1494 |
| 1311 × 1980 | 1490 |
| 1334 × 1982 | 295 |
| 1434 × 1982 | 142 |
| 1284 × 1759 | 138 |
| 1425 × 1973 | 128 |
| 1184 × 1759 | 70 |
| Dataset | Average Car Width | Average Car Length |
|---|---|---|
| PSU training | 48 | 36 |
| PSU testing | 55 | 46 |
| Stanford training | 72 | 152 |
| Stanford testing | 60 | 90 |
| Size | Number of Images |
|---|---|
| 1920 × 1080 | 172 |
| 1764 × 430 | 26 |
| 684 × 547 | 21 |
| 1284 × 377 | 20 |
| 1280 × 720 | 19 |
| 4000 × 2250 | 12 |
| # | Algorithm | Feature Extractor | Dataset | Average Input Size | Number of Iterations |
|---|---|---|---|---|---|
| 1 | Faster R-CNN | Inception v2 | Stanford | 816 × 600 (variable) | 600,000 |
| 2 | Faster R-CNN | Inception v2 | PSU | 992 × 550 (variable) | 600,000 |
| 3 | Faster R-CNN | Resnet50 | Stanford | 816 × 600 (variable) | 600,000 |
| 4 | Faster R-CNN | Resnet50 | PSU | 992 × 550 (variable) | 600,000 |
| 5 | Faster R-CNN | Inception v2 | Stanford | 608 × 608 (fixed) | 600,000 |
| 6 | Faster R-CNN | Inception v2 | PSU | 608 × 608 (fixed) | 600,000 |
| 7 | Faster R-CNN | Resnet50 | Stanford | 608 × 608 (fixed) | 600,000 |
| 8 | Faster R-CNN | Resnet50 | PSU | 608 × 608 (fixed) | 600,000 |
| 9 | YOLO v3 | Darknet-53 | Stanford | 320 × 320 (fixed) | 896,000 |
| 10 | YOLO v3 | Darknet-53 | Stanford | 416 × 416 (fixed) | 320,000 |
| 11 | YOLO v3 | Darknet-53 | Stanford | 608 × 608 (fixed) | 1,088,000 |
| 12 | YOLO v3 | Darknet-53 | PSU | 320 × 320 (fixed) | 640,000 |
| 13 | YOLO v3 | Darknet-53 | PSU | 416 × 416 (fixed) | 640,000 |
| 14 | YOLO v3 | Darknet-53 | PSU | 608 × 608 (fixed) | 640,000 |
| 15 | YOLO v4 | CSPDarknet-53 | Stanford | 320 × 320 (fixed) | 192,000 |
| 16 | YOLO v4 | CSPDarknet-53 | Stanford | 416 × 416 (fixed) | 192,000 |
| 17 | YOLO v4 | CSPDarknet-53 | Stanford | 608 × 608 (fixed) | 192,000 |
| 18 | YOLO v4 | CSPDarknet-53 | PSU | 320 × 320 (fixed) | 192,000 |
| 19 | YOLO v4 | CSPDarknet-53 | PSU | 416 × 416 (fixed) | 192,000 |
| 20 | YOLO v4 | CSPDarknet-53 | PSU | 608 × 608 (fixed) | 192,000 |
| Network | ARmax=1 | ARmax=10 | ARmax=100 |
|---|---|---|---|
| Faster R-CNN (Inception-v2) | 15.1% | 17.1% | 17.1% |
| Faster R-CNN (Resnet50) | 16.4% | 18.6% | 18.6% |
| YOLOv3 (320 × 320) | 9.0% | 9.1% | 9.1% |
| YOLOv3 (416 × 416) | 17.1% | 17.3% | 17.3% |
| YOLOv3 (608 × 608) | 17.2% | 17.3% | 17.3% |
| YOLOv4 (320 × 320) | 14.7% | 14.7% | 14.7% |
| YOLOv4 (416 × 416) | 19.3% | 19.4% | 19.4% |
| YOLOv4 (608 × 608) | 19.1% | 24.0% | 24.0% |
| Network | ARmax=1 | ARmax=10 | ARmax=100 |
|---|---|---|---|
| Faster R-CNN (Inception-v2) | 6.2% | 41.5% | 70.8% |
| Faster R-CNN (Resnet50) | 6.4% | 41.5% | 67.2% |
| YOLOv3 (320 × 320) | 6.0% | 42.2% | 81.0% |
| YOLOv3 (416 × 416) | 6.4% | 44.1% | 90.4% |
| YOLOv3 (608 × 608) | 6.4% | 44.5% | 91.9% |
| YOLOv4 (320 × 320) | 6.8% | 47.1% | 95.5% |
| YOLOv4 (416 × 416) | 6.8% | 46.8% | 96.6% |
| YOLOv4 (608 × 608) | 6.7% | 46.5% | 95.6% |
| Algorithm | Feature Extractor | Input Size | AP | TP | FN | FP | Precision | Recall | F1 Score | FPS | Inference Time (ms) |
|---|---|---|---|---|---|---|---|---|---|---|---|
| Faster R-CNN | Inception v2 | 992 × 550 (variable) | 0.739 | 548 | 190 | 11 | 0.980 | 0.743 | 0.845 | 9.5 | 105 |
| Faster R-CNN | Inception v2 | 608 × 608 (fixed) | 0.731 | 541 | 197 | 14 | 0.975 | 0.733 | 0.837 | 9.5 | 105 |
| Faster R-CNN | Resnet50 | 992 × 550 (variable) | 0.708 | 524 | 214 | 9 | 0.983 | 0.710 | 0.825 | 6.4 | 156 |
| Faster R-CNN | Resnet50 | 608 × 608 (fixed) | 0.623 | 463 | 275 | 17 | 0.965 | 0.627 | 0.76 | 5.3 | 189 |
| YOLOv3 | Darknet-53 | 320 × 320 (fixed) | 0.902 | 672 | 66 | 35 | 0.950 | 0.911 | 0.930 | 22.1 | 45 |
| YOLOv3 | Darknet-53 | 416 × 416 (fixed) | 0.957 | 710 | 28 | 40 | 0.947 | 0.962 | 0.954 | 17.5 | 57 |
| YOLOv3 | Darknet-53 | 608 × 608 (fixed) | 0.965 | 715 | 23 | 36 | 0.952 | 0.969 | 0.960 | 11.8 | 84 |
| YOLOv4 | CSPDarknet-53 | 320 × 320 (fixed) | 0.961 | 715 | 23 | 59 | 0.924 | 0.969 | 0.946 | 22.4 | 45 |
| YOLOv4 | CSPDarknet-53 | 416 × 416 (fixed) | 0.965 | 720 | 18 | 66 | 0.916 | 0.976 | 0.945 | 19.4 | 52 |
| YOLOv4 | CSPDarknet-53 | 608 × 608 (fixed) | 0.950 | 715 | 23 | 66 | 0.915 | 0.969 | 0.941 | 13 | 77 |
| Algorithm | Feature Extractor | Input Size | AP | TP | FN | FP | Precision | Recall | F1 Score | FPS | Inference Time (ms) |
|---|---|---|---|---|---|---|---|---|---|---|---|
| Faster R-CNN | Inception v2 | 600 × 816 (variable) | 0.202 | 1780 | 6351 | 1813 | 0.495 | 0.219 | 0.304 | 19.2 | 52 |
| Faster R-CNN | Inception v2 | 608 × 608 (fixed) | 0.317 | 2916 | 5215 | 2654 | 0.524 | 0.359 | 0.426 | 21.1 | 47 |
| Faster R-CNN | Resnet50 | 600 × 816 (variable) | 0.219 | 1909 | 6222 | 2117 | 0.474 | 0.235 | 0.314 | 8.6 | 116 |
| Faster R-CNN | Resnet50 | 608 × 608 (fixed) | 0.123 | 2061 | 6070 | 2456 | 0.456 | 0.253 | 0.326 | 8.2 | 122 |
| YOLOv3 | Darknet-53 | 320 × 320 (fixed) | 0.107 | 876 | 7255 | 4 | 0.995 | 0.108 | 0.194 | 23.3 | 43 |
| YOLOv3 | Darknet-53 | 416 × 416 (fixed) | 0.195 | 1583 | 6548 | 1 | 0.999 | 0.195 | 0.326 | 18.6 | 54 |
| YOLOv3 | Darknet-53 | 608 × 608 (fixed) | 0.194 | 1581 | 6550 | 10 | 0.994 | 0.194 | 0.325 | 11.8 | 85 |
| YOLOv4 | CSPDarknet-53 | 320 × 320 (fixed) | 0.157 | 1278 | 6853 | 5 | 0.996 | 0.157 | 0.272 | 21.1 | 47 |
| YOLOv4 | CSPDarknet-53 | 416 × 416 (fixed) | 0.202 | 1646 | 6485 | 1 | 0.999 | 0.202 | 0.337 | 18.5 | 54 |
| YOLOv4 | CSPDarknet-53 | 608 × 608 (fixed) | 0.209 | 1701 | 6430 | 64 | 0.964 | 0.209 | 0.344 | 12.5 | 80 |
| Algorithm | Anchor Scales | AP (Average Precision) | IoU (Intersection over Union) | Average Predicted Width | Average Predicted Height |
|---|---|---|---|---|---|
| YOLOv3 416 × 416 (default anchors) | 10 × 13, 16 × 30, 33 × 23, 30 × 61, 62 × 45, 59 × 119, 116 × 90, 156 × 198, 373 × 326 | 0.195 | 0.89 | 67 | 170 |
| YOLOv3 416 × 416 (reduced anchors) | 10 × 27, 25 × 16, 17 × 26, 18 × 35, 22 × 31, 35 × 23, 23 × 38, 27 × 34, 31 × 42 | 0.082 | 0.55 | 127 | 282 |
| YOLOv4 416 × 416 (default anchors) | 12 × 16, 19 × 36, 40 × 28, 36 × 75, 76 × 55, 72 × 146, 142 × 110, 192 × 243, 459 × 401 | 0.202 | 0.92 | 86 | 170 |
| YOLOv4 416 × 416 (reduced anchors) | 10 × 27, 25 × 16, 17 × 26, 18 × 35, 22 × 31, 35 × 23, 23 × 38, 27 × 34, 31 × 42 | 0.188 | 0.87 | 81 | 192 |
| Faster R-CNN, with ResNet50 (default anchors) | Scales: 128 × 128, 256 × 256, 512 × 512 Aspect ratios: 1:1, 1:2, 2:1 | 0.219 | 0.48 | 91 | 171 |
| Faster R-CNN, with ResNet50 (reduced anchors) | Scales: 64 × 64, 128 × 128, 256 × 256 Aspect ratios: 1:1, 1:2, 2:1 | 0.207 | 0.25 | 72 | 131 |
| Faster R-CNN, with Inception-v2 (default anchors) | Scales: 128 × 128, 256 × 256, 512 × 512 Aspect ratios: 1:1, 1:2, 2:1 | 0.202 | 0.48 | 74 | 140 |
| Faster R-CNN, with Inception-v2 (reduced anchors) | Scales: 64 × 64, 128 × 128, 256 × 256 Aspect ratios: 1:1, 1:2, 2:1 | 0.255 | 0.50 | 92 | 174 |
Publisher’s Note: MDPI stays neutral with regard to jurisdictional claims in published maps and institutional affiliations. |
© 2021 by the authors. Licensee MDPI, Basel, Switzerland. This article is an open access article distributed under the terms and conditions of the Creative Commons Attribution (CC BY) license (https://creativecommons.org/licenses/by/4.0/).
Share and Cite
Ammar, A.; Koubaa, A.; Ahmed, M.; Saad, A.; Benjdira, B. Vehicle Detection from Aerial Images Using Deep Learning: A Comparative Study. Electronics 2021, 10, 820. https://doi.org/10.3390/electronics10070820
Ammar A, Koubaa A, Ahmed M, Saad A, Benjdira B. Vehicle Detection from Aerial Images Using Deep Learning: A Comparative Study. Electronics. 2021; 10(7):820. https://doi.org/10.3390/electronics10070820
Chicago/Turabian StyleAmmar, Adel, Anis Koubaa, Mohanned Ahmed, Abdulrahman Saad, and Bilel Benjdira. 2021. "Vehicle Detection from Aerial Images Using Deep Learning: A Comparative Study" Electronics 10, no. 7: 820. https://doi.org/10.3390/electronics10070820
APA StyleAmmar, A., Koubaa, A., Ahmed, M., Saad, A., & Benjdira, B. (2021). Vehicle Detection from Aerial Images Using Deep Learning: A Comparative Study. Electronics, 10(7), 820. https://doi.org/10.3390/electronics10070820