1. Introduction
Plants, which are an important food source and a significant part of the ecological environment, are inextricably linked to the survival of humans [
1]. To meet the demand for increasing grain production, breeding experts need to adopt efficient breeding programs to breed high-yielding and high-quality crop varieties [
2]. A high-throughput number of plant phenotyping datasets can help researchers analyze and track the growth of plants, which is a great help to plant breeding [
3]. However, compared to high-throughput measurements of crop gene sequences, traditional plant phenotyping methods based on artificial measurements are usually inefficient, which limits the process of modern agricultural intelligent breeding. In addition, measuring plant phenotypes manually may lead to inaccurate results, and direct contact with the plants would cause irreversible damage to the plants [
4]. Hence, an automatic high-throughput plant phenotyping technique has become a research point in the field of modern digital agriculture.
The plant phenotype is a comprehensive assessment of the complex plant characteristics that we observe, including morphological parameters, traits, physiology, etc. For most plants, leaves, which are the main component of photosynthesis, take up the largest proportion of all organs [
2,
5]. Monitoring and analyzing phenotyping parameters such as the shape, color, and size of plant leaves in real-time could help to detect pests and diseases, predict crop yields, and select high-quality crop varieties. Furthermore, plant leaves are more regular than other organs with complex structures, and it is easy to obtain samples, so plant leaves’ phenotype is the most-essential task in plant physiology research. Therefore, an automatic, high-throughput, and accurate plant leaf segmentation method is of primary importance for downstream research tasks [
6].
With the development of computer vision technology, image processing has been widely adopted in the field of modern digital agriculture [
7]. Many image-based phenotyping methods, which are low-cost, non-invasive, and high-throughput, have been proposed to acquire detailed and particular plant traits [
8]. Mao et al. [
9] proposed an adaptive segmentation method of crop disease imaging based on the fuzzy C-mean clustering algorithm (FCM), which takes as the input the gray pixels and the mean of the neighborhood of pixels. Li et al. [
10] designed a co-segmentation algorithm based on the optimization model of the Markov random field to generate a universal and accurate image segmentation of cotton leaves under natural lighting conditions. Singh et al. [
11] proposed an algorithm for an image segmentation technique that is used for the automatic detection and classification of plant leaf diseases. Xie et al. [
12] converted tobacco images into the Lab color space and then used support vector machine (SVM) to recognize and count tobacco plants. These methods could significantly improve the efficiency of plant phenotyping in a non-destructive way.
However, since plants usually have complex structures and occlusions exist in the leaves, these image-based methods still have some limitations in plant leaf segmentation. To address this issue, many researchers have introduced 3D point clouds into plant phenotyping [
13,
14,
15,
16]. On the other hand, with the rapid development of 3D sensing techniques, the way to obtain 3D data becomes less expensive and easier, such as 3D laser scanners, time of flight cameras, and light detection and ranging (LiDAR) [
17,
18,
19]. Mortensen et al. [
20] proposed a cluster-based method for segmenting lettuce in color 3D point clouds and estimating the fresh weight. Jin et al. [
21] proposed a median-normalized vector growth (MNVG) algorithm to segment stems and leaves, after which the phenotypic traits of the leaf and stem were extracted. Hui et al. [
22] used a multi-view stereo (MVS) approach to quantify and evaluate the canopy structure of plant populations and monitor the growth and development from the seedling to the fruiting stage. Itakura et al. [
23] designed a method that automatically segmented 3D models constructed from scenes taken from different positions for the leaf areas and inclination angles. Jin et al. [
24] proposed a voxel-based convolutional neural network (VCNN) to segment maize stem and leaf, and the results outperformed traditional methods.
Although the above-mentioned methods are effective for the segmentation of plant 3D point clouds, there still exist two main drawbacks of these methods: (1) traditional methods are not robust for plants in different stages owing to the variable sizes; (2) learning-based methods using only one representation of 3D point clouds cannot explore the point traits thoroughly, which limits the accuracy and generalization ability. The objective of this work was to address these two deficiencies in the segmentation of plant 3D point clouds. We evaluated the recently popular learning-based methods on plant 3D point cloud datasets (i.e., maize and tomato) and propose an adaptive voxel-based approach to extract local region features. Then, a feature fusion method based on an attention mechanism is proposed to coalesce pointwise features and voxelwise features.
In summary, the contributions of this work are as follows:
To the best of our knowledge, this is the first work that uses a multi-representation of 3D point clouds to segment the leaves and stems of plants.
An adaptive voxel-based method to partition plant 3D point clouds more evenly is proposed, then a sparse 3D convolution is introduced to accelerate the efficiency.
An attention-based feature fusion method to merge point features from different modules is proposed, which may contribute to future developments of plant 3D point cloud segmentation.
2. Results
In this section, we first provide the detailed experimental setting and evaluation metrics and then report the results on two plant datasets, namely maize and tomato. Furthermore, a cross-validation experiment was constructed, in which we trained the models on the maize dataset and tested on the tomato dataset, and vice versa, to validate the generalization ability.
2.1. Experimental Setup
We compared our feature-fusion-based network with three popular learning-based methods (i.e., PointNet [
25], PointNet++2017PointNet2, and DGCNN [
26]) on the maize and tomato datasets. All networks were trained with Adam with a learning rate of 0.001 for 200 epochs on an Nvidia Geforce 3090 GPU. It is worth noting that our proposed FF-Net took as the input the entire plant point cloud without down-sampling, while the other three competitors have to down-sample the points as the memory cost is so large that an overflow occurs. Therefore, the batch size of FF-Net was set to 4, while the other three were 32.
2.2. Evaluation Metrics
For a fair comparison, we used the same strategy to train all models and report the per-class Intersection over Union (IoU) [
25] and the mean IoU (mIoU) [
25] over all classes. The IoU can be formulated as
where
TP (true positive) denotes that the positive class is predicted as the positive class,
FN (false negative) indicates that the positive class is predicted as the negative class, and
FP (false positive) means that the negative class is predicted as the positive class.
The mean intersection over union (mIoU) is the average IoU of all classes, which can be formulated as
2.3. Results on Maize Dataset
Results:
Table 1 presents the semantic segmentation results on the maize datasets, from which we can observe that all methods achieved a high IoU (>95%) for the ground category and the second-highest IoU (>80%) for the leaf class. However, PointNet [
25] almost failed to recognize the stem, which is a relatively small class with few points. As a result, PointNet [
25] only achieved a 3.4% IoU for the leaf class. PointNet++ [
27] and DGCNN [
26] obtained a relatively small IoU (<40%) for the stem class, which mostly confounded stems with leaves. Our proposed method outperformed all other methods for both classes’ IoU and mIoU. Specifically, our proposed method achieved about a 20% performance gain over PointNet [
25], 7% over PointNet++ [
27], and 5% over DGCNN [
26]. In addition, our proposed method outperformed the other methods for the stem class by a large margin (>15%).
Visualization: It can be seen from
Figure 1 that PointNet [
25] hardly identified the stems and recognized them as leaves (falling into the yellow boxes). Benefiting from the hierarchical feature extraction, PointNet++ [
27] achieved some improvement in recognizing leaves, while still misidentifying some leaves as stems (e.g., Row A of PointNet++ [
27]). It is worth noting that, in Rows B and D, both PointNet [
25] and PointNet++ [
27] misidentified the stems as leaves. The reason may be that the stems and leaves of these maize plants have very similar properties. By contrast, DGCNN [
26] can identify the stems as shown in Rows B and D. As we can see from
Figure 1, DGCNN almost recognized all stems, but still had some misidentification of the petiole (e.g., Rows B and D of DGCNN [
26]). There existed another interesting phenomenon, where DGCNN misrecognized the outline of the leaf as the stem, as shown in Row C of
Figure 1. From the last column of
Figure 1, we can see that our proposed method, the FF-Net, produced the most-similar segmentation results as the ground truth. Nevertheless, our method still missed some part of the stem when recognizing, as shown in Rows B and D.
2.4. Results on Tomato Dataset
Results: The semantic segmentation results of tomatoes are shown in
Table 2, from which we can see that all methods obtained a relatively high IoU for the ground (>99%) and leaf (>90%) category. However, PointNet [
25] still struggled with the stem class and obtained a 28.35% IoU, which was about 25% higher than the prediction on the maize datasets before. PointNet++ [
27] achieved a 48.78% IoU for the stem class, which was about 13% higher than the prediction for the maize datasets. DGCNN [
26] obtained a 56.73% IoU for the stem class, which was 18% higher than the prediction for the maize datasets. As can be seen from
Table 2, our proposed method consistently outperformed other methods in all three classes.
Visualization:
Figure 2 presents the semantic segmentation results of the methods above on the tomato dataset. The parts of the misrecognition and missed recognition are outlined with yellow boxes. As we can see from
Figure 2, PointNet [
25] can recognize most of the stems that are far away from the leaves, as these stems have significantly different traits from the stems near the leaves. However, the stems that are close to the leaves have similar traits as the leaves, and it was a challenging task for PointNet to distinguish them. PointNet++ [
27] performed better than PointNet [
25] due to its hierarchical feature extraction mechanism. As shown in
Figure 2, PointNet++ [
27] identified more details of the stems than PointNet [
25] (Rows D, E, and F). Nonetheless, there also existed some misidentifications of leaves for PointNet++ [
27], e.g., Row E of PointNet++ [
27], where a leaf in the middle of the plant was misidentified as the stem. We also found an interesting phenomenon that both PointNet and PointNet++ [
27] hardly recognized stems surrounded by leaves, such as the stems on top of the plants in Rows D, E, and F. As for DGCNN [
26], we can see that most of the stems were identified, even the hardest stems surrounded by many leaves. As shown in the rightmost column of
Figure 2, our proposed method recognized most outlines of the stems, while still misidentifying some points of the stem as the leaf class. Even so, our method performed better than all other competitors in recognizing the details of the stems, as shown in Rows D, E, and F. It is worth noting that a part of the ground was misidentified as the stem, as shown in the last column of Row E in
Figure 2, which caused the IoU value of the stem class to decrease.
2.5. Results of Cross-Validation
To evaluate the generalization ability of the model, we conducted extensive cross-validation experiments on both plant datasets. First, we studied the case when the models were trained on the tomato dataset and tested on the maize dataset. Then, we trained the models on the maize dataset and tested them on the tomato dataset. For a fair comparison, we adopted the same parameter settings as the aforementioned experiments and report the same metrics, namely class IoU and mean IoU. The details are introduced in the following sections.
2.5.1. Training on Tomato and Testing on Maize
Results:
Table 3 shows the segmentation results for being trained on the tomato dataset and evaluated on the maize dataset. Because the ground in both datasets had similar traits, all models maintained a high IoU for the ground class (>95%). As for the leaf class, all models obtained a relatively high IoU (>80%), except for PointNet. However, all models failed to recognize the stem class, especially PointNet and DGCNN [
26], which only obtained IoUs of 0.35% and 0.69% for the stem class, respectively. Compared with the segmentation results of the stems being trained and evaluated on the same category of the maize dataset, the segmentation results for the stems for PointNet [
25], PointNet++ [
27], DGCNN [
26], and FF-Net, which were trained on the tomato dataset and evaluated on the maize dataset, were down by 90%, 92%, 98%, and 87%. Our method achieved the smallest reduction in the IoU for the stem class when generalizing from the tomato dataset to the maize dataset.
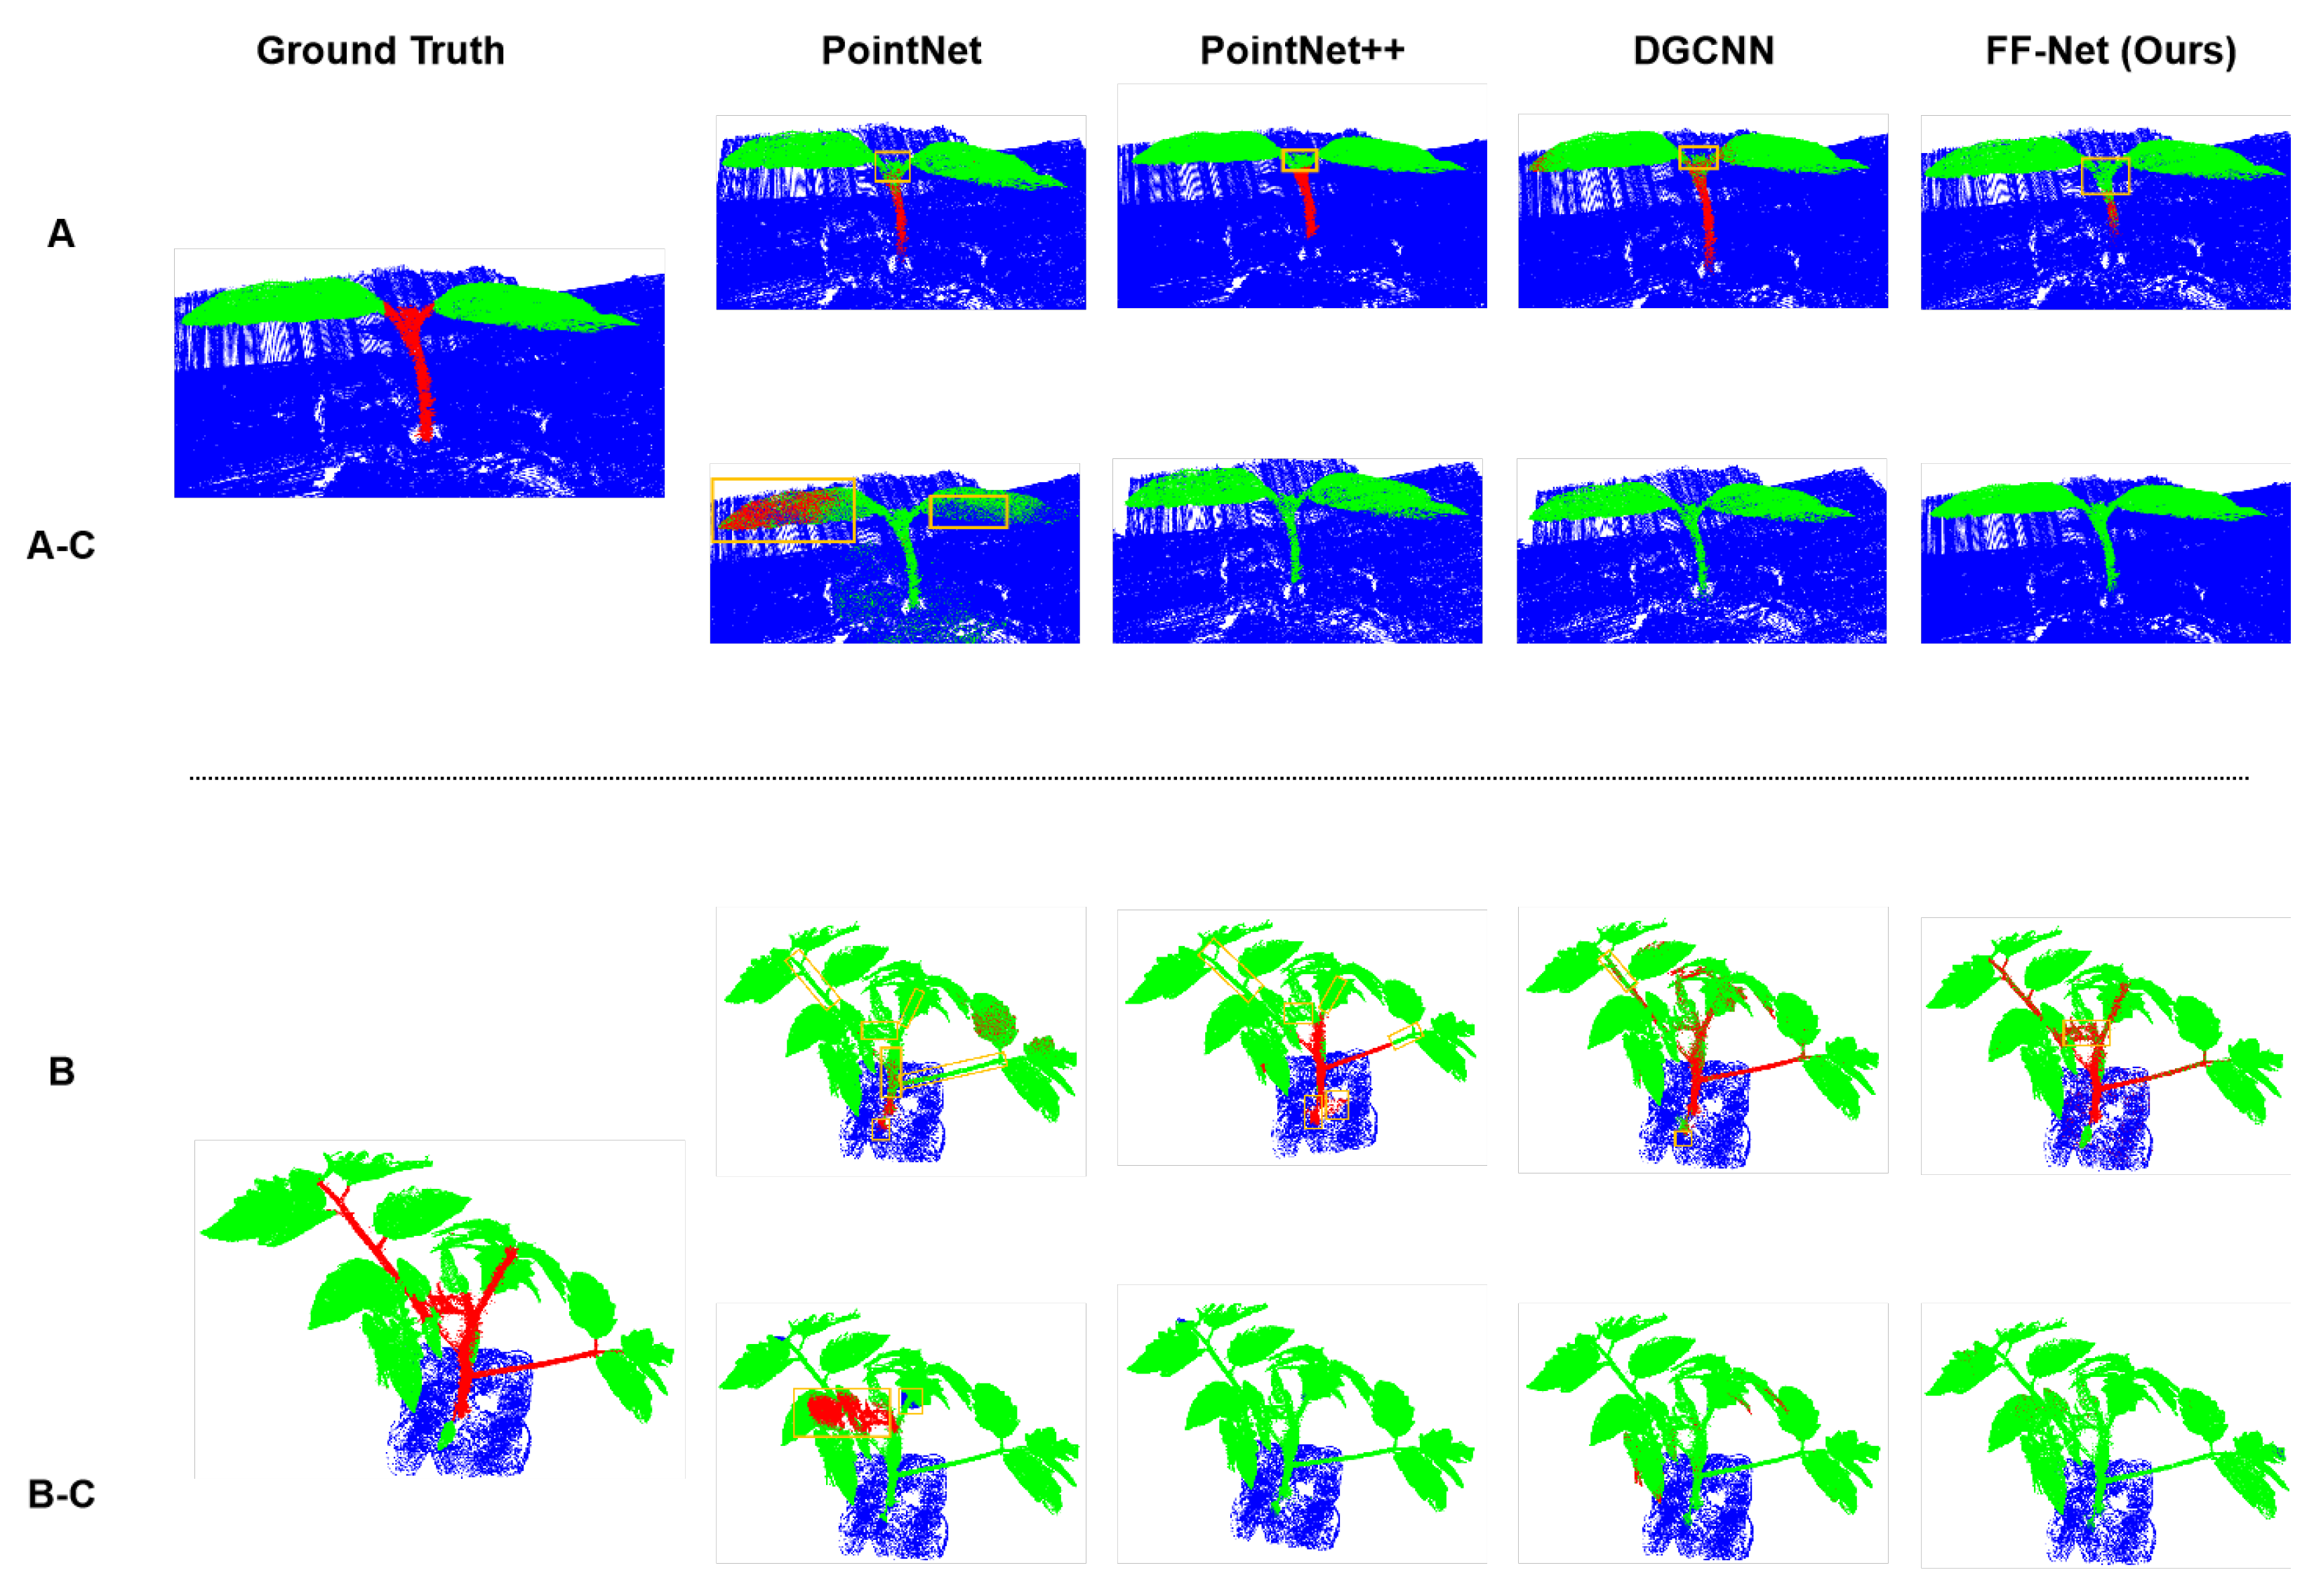
Visualization:
Figure 3 presents the cross-validation results on the maize dataset of the above methods, in which Row A (and B) indicates that the models were trained and evaluated on the maize dataset, while Rows A-C (and B-C) denote that the models were trained on the tomato dataset, but evaluated on the maize dataset. We can see that almost all models failed to obtain precise segmentation results, when trained on a different category of the datasets. PointNet misidentified almost the whole stem as leaves and the bottom leaf as the stem when trained on the tomato dataset, as presented in Rows A-C. For the more complicated maize shown in Rows B-C, almost all points were predicted as the stem class, which was the wrong prediction. As a result, PointNet [
25] did not generalize well on the different categories of the datasets. PointNet++ [
27] performed slightly better than PointNet [
25] in generalizability on the different datasets. As we can see in Rows A-C and B-C of
Figure 3, PointNet++ [
27] trained on the tomato dataset did not identify the stems of the maize dataset precisely, which performed worse than when it was trained on the maize dataset. DGCNN obtained similar performance to PointNet++ [
27] in generalizability to the different datasets.
2.5.2. Training on Maize and Testing on Tomato
Results: The segmentation results of the cross-validation for which the models were trained on the maize dataset and evaluated on the tomato dataset are shown in
Table 4. As we can see from the table, all models obtained relatively high IoUs for the ground class (>95%) and leaf class (>90%). However, the IoU for the stem class of all models dropped sharply compared to that of the models trained on the tomato dataset, which was similar to the cross-validation mentioned above. PointNet [
25] did not identify any of the stem points of the test dataset when generalized to the tomato dataset from the maize dataset.
Visualization:
Figure 4 shows the cross-validation results on the tomato dataset of all these methods, in which Row A (and B) indicates that the models were trained and evaluated on the tomato dataset, while Rows A-C (and B-C) denote that the models were trained on the maize dataset, but evaluated on the tomato dataset. As we can see, all models almost correctly classified the ground and leaf points, except for PointNet, which misidentified part of the leaves as the stems when trained on the maize dataset. However, all models barely recognized the stem points when generalizing from the maize dataset to the tomato dataset.


