The effectiveness of the proposed EEMD-EKRRSE method is verified on the IEEE-33 node system and a 78-node distribution system in China. The test is performed on a PC purchased in Qingdao, Shandong, China, produced by HP, with Intel Core i5-9300, 16 GB of RAM. The relevant algorithms are compiled using the Python platform 3.6. The CNN model and the kernel ridge regression model are trained using the TensorFlow 2.10.0 and Keras 2.10.0 toolboxes, respectively. The MATPOWER 7.0 toolbox is employed to obtain the system state dataset and measurement dataset through power flow calculations.
4.1. IEEE-33 Node System
(1) Measurement Denoising Effect
To analyze the impact of strong non-Gaussian noise, Laplace noise with a mean of 0 and a standard deviation of 0.01, and Gaussian noise with a weight of 0.5, and a weight of 0.5, both with covariances of 10
−5I and 10
−3I, are added to the measurement data of node 4, respectively. The EEMD decomposition is used to decompose the original measurement into multiple IMF components. Under the interference of these two types of noise, EEMD decomposition is performed on 1000 sets of active power and reactive power measurement data. The results are shown in
Table 1 and
Figure 2.
From
Table 1, it can be observed that the IMF1 component has the highest sample entropy for both active and reactive power, indicating the highest time-series complexity of this component.
From
Figure 2, it can be seen that the distribution characteristics of each IMF component are significantly different. After removing the IMF1 component, the denoised measurement data can be obtained.
Table 2 and
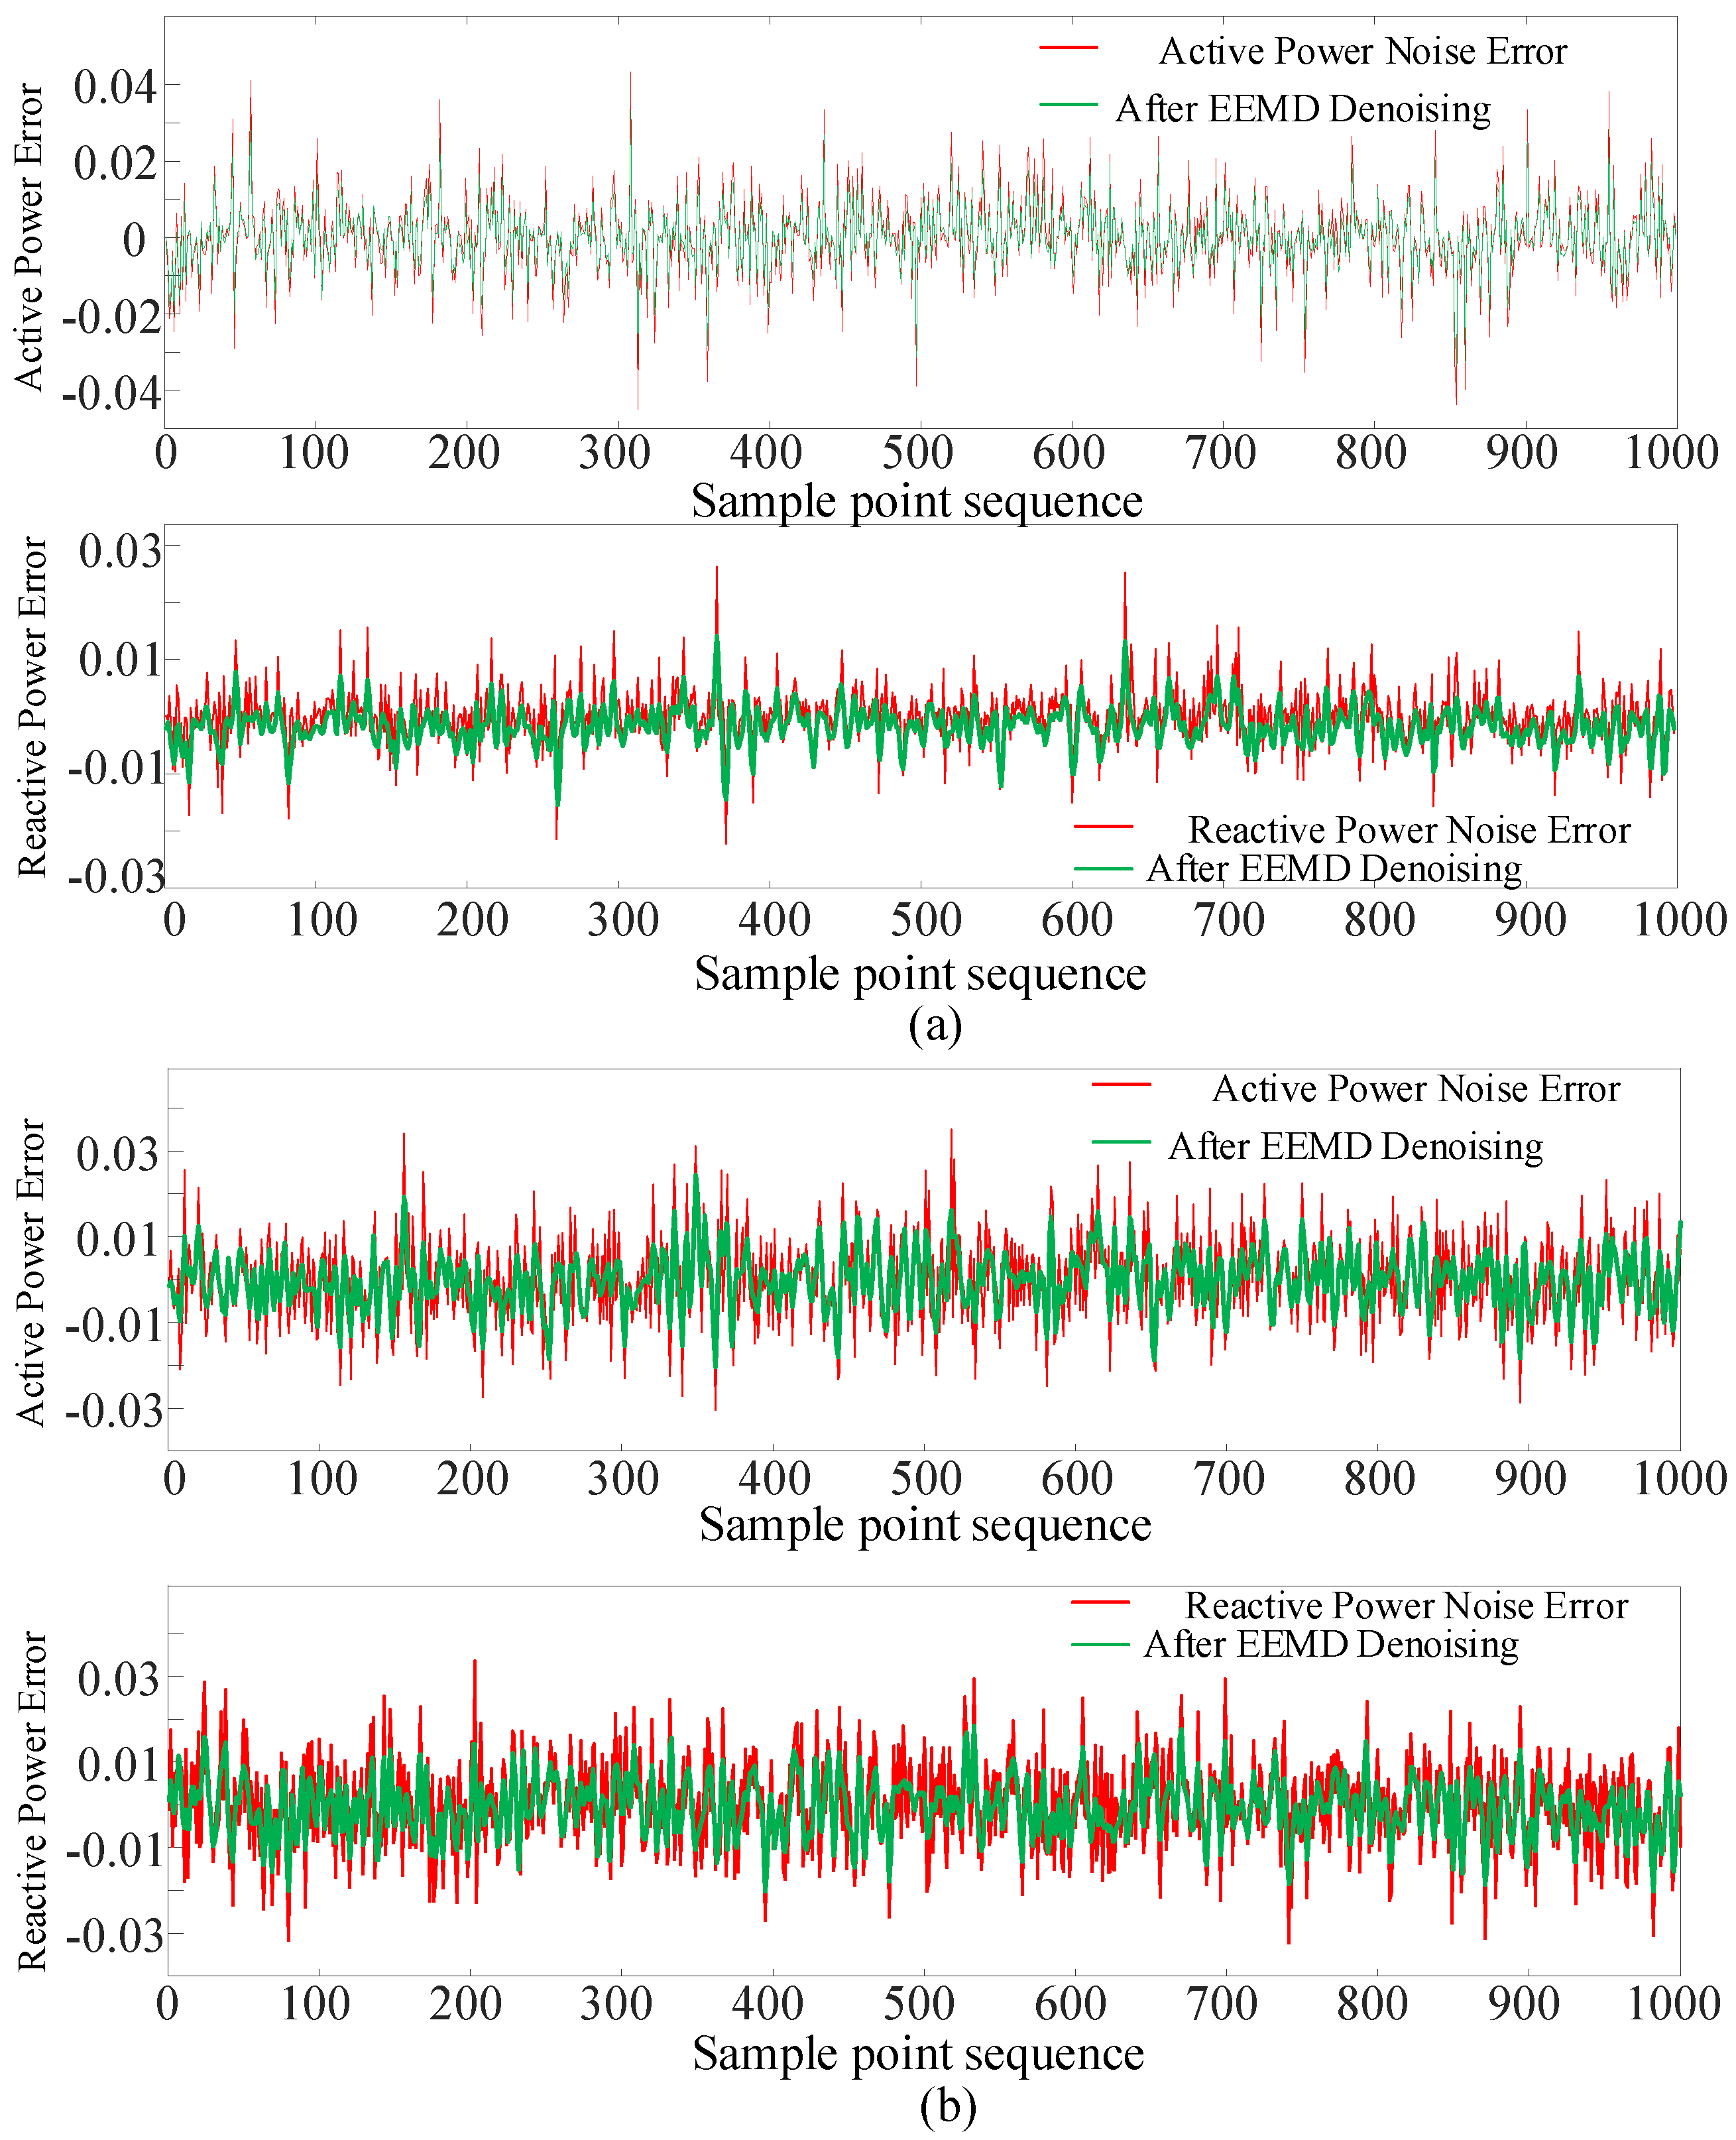
Figure 3 show the Absolute Error (AE) and Root Mean Square Error (RMSE) of 1000 sets of active power and reactive power measurements at this node before and after denoising.
From
Table 2, it can be seen that in the Laplace noise environment, the absolute errors of active power and reactive power after denoising using EEMD are 6.74 × 10
−3 and 6.58 × 10
−3, respectively, which are reduced by 6.5% and 35% compared to the errors before denoising. In the bimodal Gaussian noise environment, the absolute errors of active power and reactive power are reduced by 38% and 35%, respectively. Moreover, the RMSE of active power and reactive power in the Laplace noise environment is reduced by 8% and 30%, respectively, compared to the RMSE before denoising. In the bimodal Gaussian noise environment, they are reduced by 36% and 35%, respectively. It can be seen that EEMD has a significant noise reduction effect.
From
Figure 3, it can be observed that the fluctuation amplitude of the error curve of the denoised measurement information using EEMD is significantly reduced, indicating that EEMD can effectively reduce the noise level in the measurement information. To further demonstrate the denoising effect of EEMD under strong non-Gaussian noise, Laplace noise with a mean of 0 and standard deviation ranging from 0.02 to 0.05 with a step of 0.01 is added to the active power data of node 4, and EEMD is then used to denoise the data.
Table 3 shows that the AE and RMSE after denoising using EEMD decreased by 27% and 33% on average, respectively, indicating that the denoised measurement data are closer to the true values. This validates the denoising effect of EEMD under strong non-Gaussian noise.
(2) Filtering Effect of EKRRSE
Laplace noise with a mean of 0 and standard deviation ranging from 0.01 to 0.05 in increments of 0.01 is added to the measurement data at node 4, and KRRSE is then used to filter.
Table 4 presents the results of the Mean Absolute Percentage Error (MAPE) and RMSE of KRRSE. Additionally,
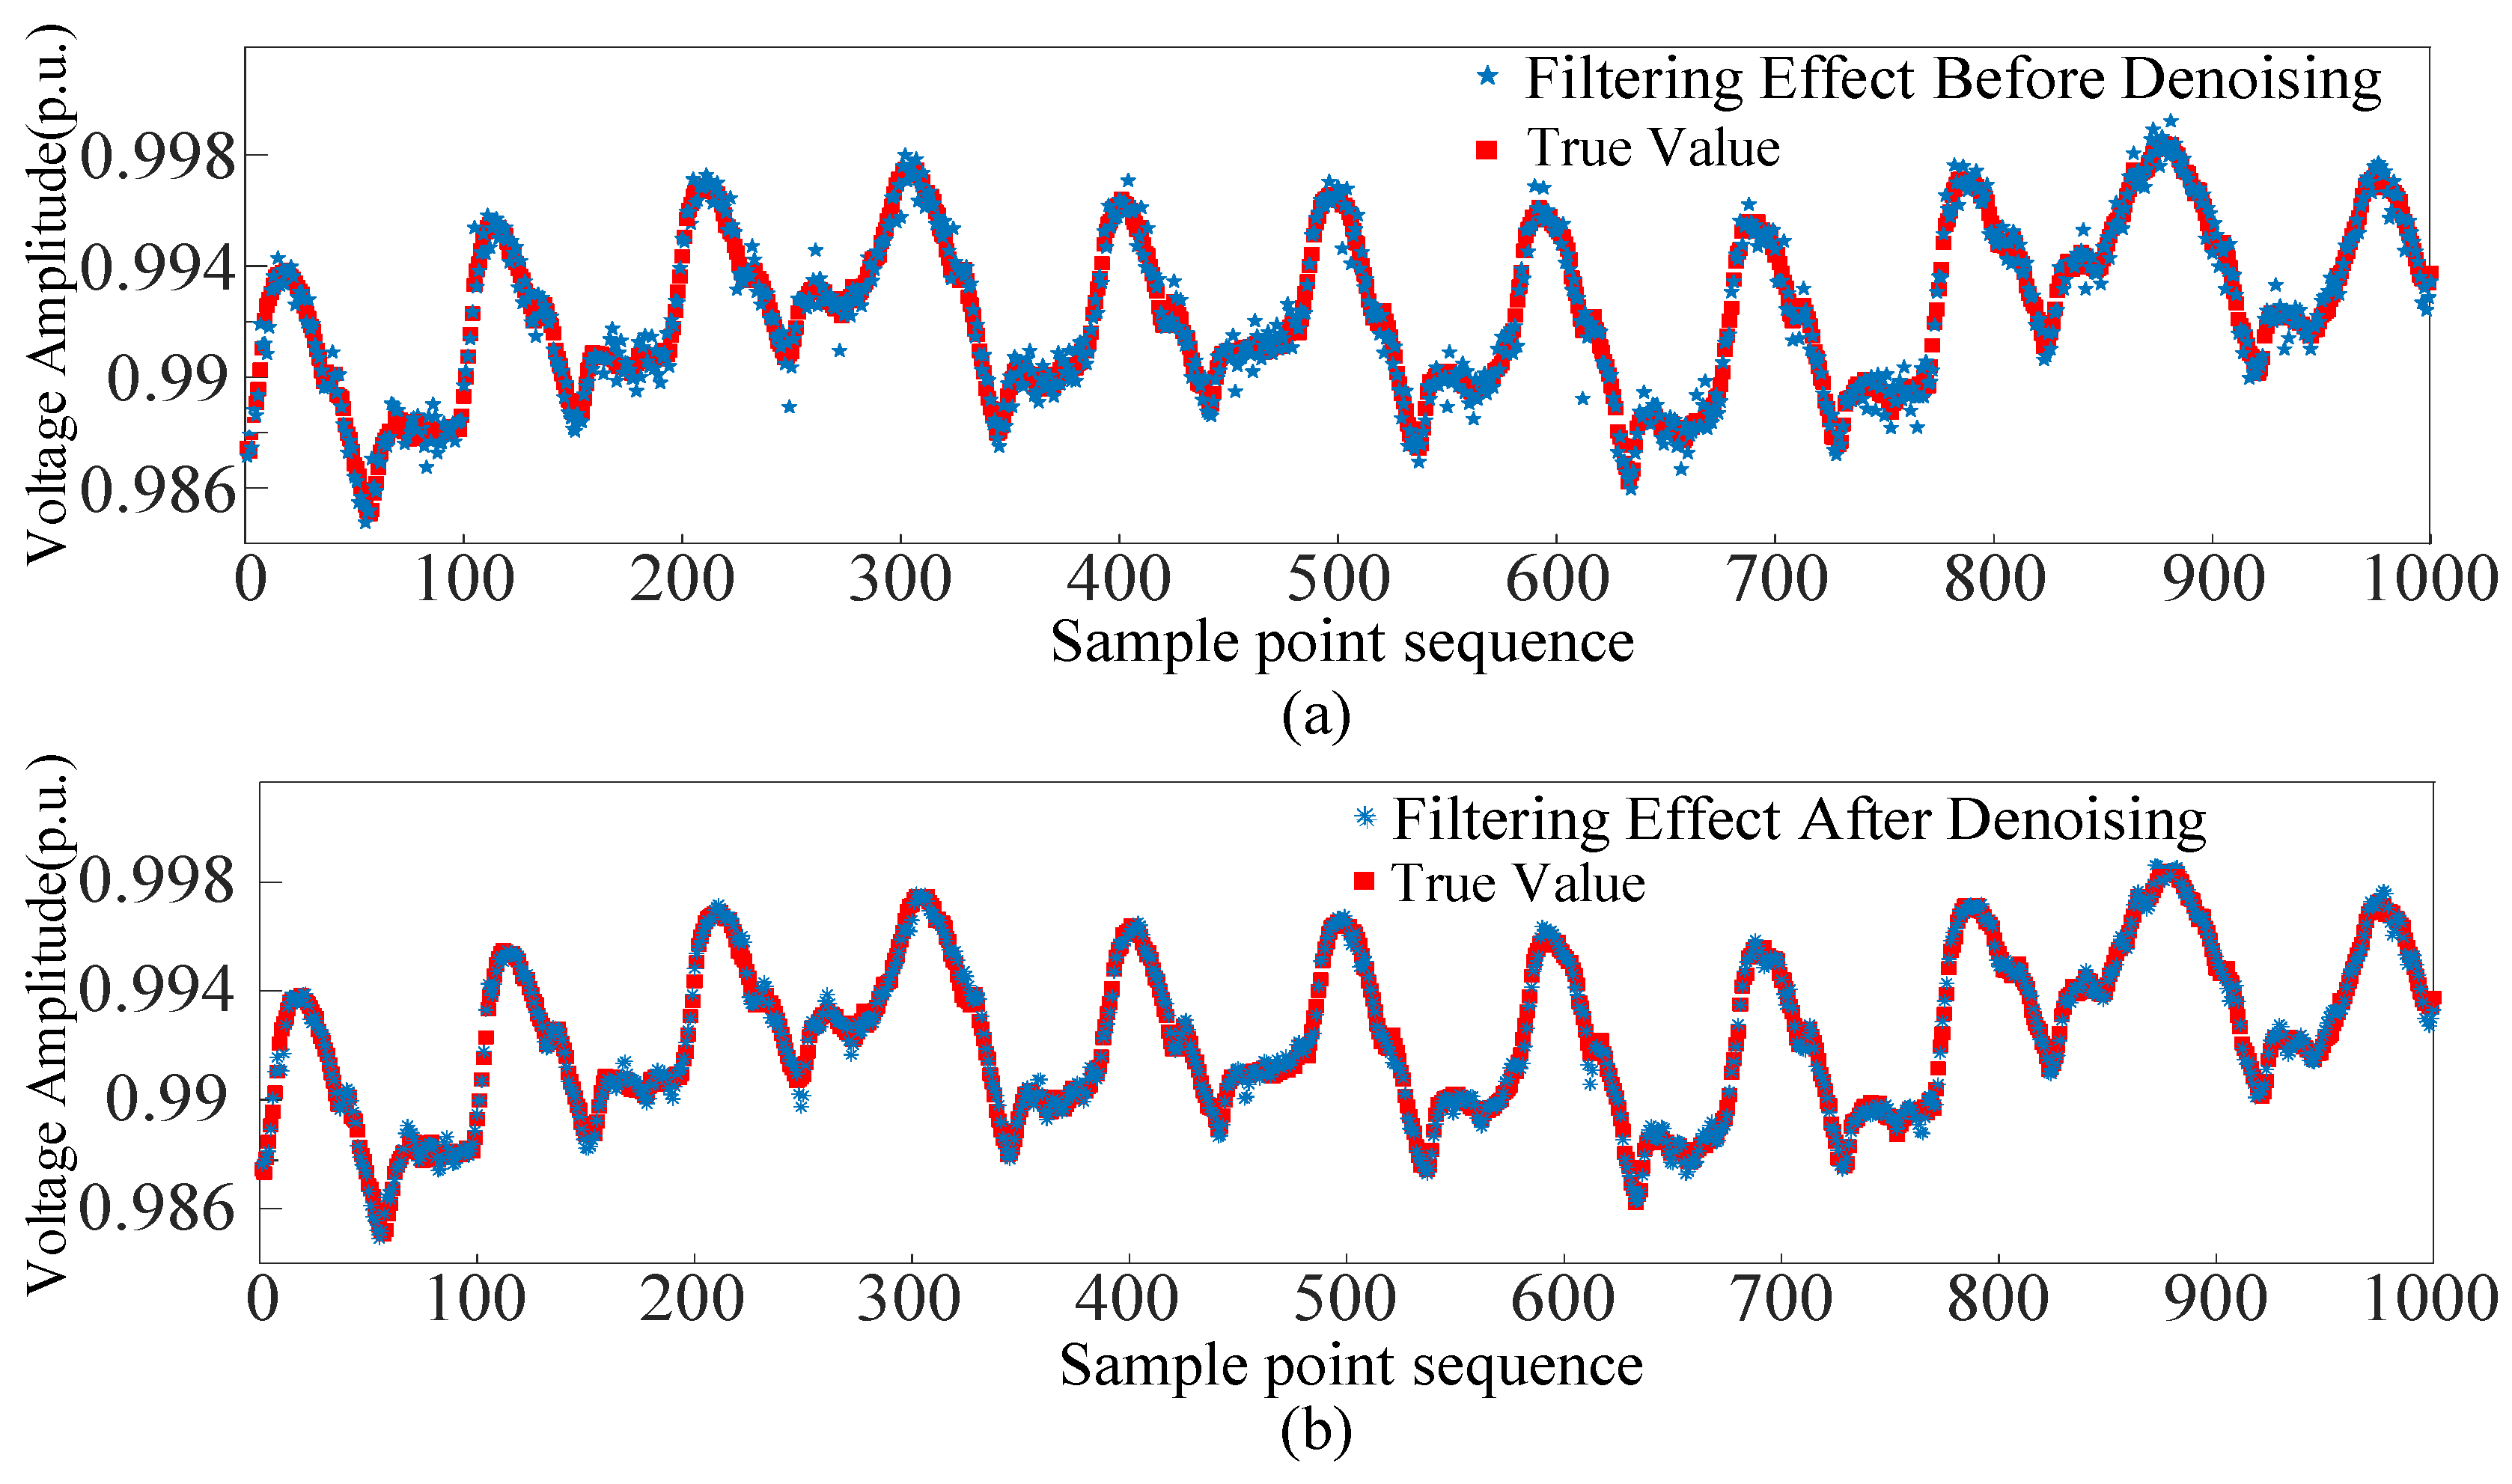
Figure 4 illustrates the comparison of filtering performance before and after denoising with EEMD when the noise deviation is 0.05.
From
Table 4, it can be seen that before denoising, as the standard deviation of noise increases, the MAPE of KRRSE filtering gradually increases. When the noise standard deviation increases from 0.01 to 0.05, the MAPE and RMSE increase by 3.56 times and 3.77 times, respectively, showing a significant decrease in filtering performance. However, after noise reduction by EEMD, the MAPE is reduced by nearly 29% on average, and the filtering accuracy is significantly improved. When the noise standard deviation is 0.05, the RMSE is 3.28 × 10
−4, which is 33% lower than before denoising, enhancing filtering stability. From
Figure 4, it is evident that the filtering values before denoising deviate from the true value at multiple points, which is more obvious at the peak and valley points of the curve. After denoising with EEMD, the data errors are reduced, and the measured information is closer to the true values. Consequently, KRRSE shows improved filtering performance, validating that EEMD-based measurement denoising effectively improves the accuracy and stability of KRRSE filtering.
To further reduce the estimation errors, the nonlinear relationship between the measurement information and the estimation residuals is learned through kernel ridge regression, and the estimated residuals are then integrated into the results of the first-stage filtering.
To validate the effectiveness of the EKRRSE method, we take node 4 as an example. Laplace noise with a mean of 0 and standard deviation ranging from 0.01 to 0.05 in steps of 0.01 is superimposed onto the measurement data of node 4. The EKRRSE method is then used to filter the denoised measurement data.
Table 5 presents a comparison of the filtering effects between KRRSE and EKRRSE. It can be seen that under the influence of noise with different standard deviations, compared to the filtering results of KRRSE, EKRRSE shows a decrease in both MAPE and RMSE. Specifically, the MAPE decreases by 8.4% on average, and the RMSE decreases by 9.3% on average. This indicates that EKRRSE can improve the estimation accuracy and stability, making the filtering results closer to the true values.
(3) Robustness Analysis
DBSCAN is used to filter the abnormal data in measurements, and CAGN is utilized to reconstruct the corresponding measurement data. It is worth noting that the reconstructed measurement information obtained by CAGN has high accuracy, and EEMD is not suitable for denoising the reconstructed information. EKRRSE is applied to handle the reconstructed measurement information to improve the filtering effect. To evaluate the filtering performance of EKRRSE on abnormal data, two scenarios are studied, and the filtering results of KRRSE and EKRRSE are compared as shown in
Table 6.
Scenario 1: The active power measurement information for nodes 12 and 32 is missing from sample point 3 to sample point 70.
Scenario 2: The reactive power measurement information for nodes 15 and 23 is abnormal from sample point 3 to sample point 70.
From
Table 6, it can be observed that the MAPE and RMSE of EKRRSE in Scenarios 1 and 2 are both lower than those of KRRSE. The accuracy and estimation stability of EKRRSE are better than KRRSE overall. This is because EKRRSE can learn the mapping relationship between the reconstructed measurement information and the residuals, further reducing the estimation residuals and improving the filtering accuracy of the algorithm in abnormal scenarios.
(4) Computation Efficiency
The performance of EKRRSE, KRRSE, Cubature Particle Filter (CPF) [
25], and Robust Cubature Particle Filter (RCPF) [
25] in terms of computation efficiency and error are compared, and the results are shown in
Table 7.
From
Table 7, it can be observed that EKRRSE exhibits the highest accuracy. This is attributed to the algorithm’s ability to utilize the estimation residuals effectively, thereby improving the filtering accuracy. As the EKRRSE filtering model requires additional training of residual information, the runtime has slightly increased but still remains within the millisecond level. Therefore, the proposed EKRRSE method in this paper meets the requirements for both computation efficiency and accuracy in state estimation.
4.2. A 78-Node System
To further validate the effectiveness of the proposed EEMD-EKRRSE method, a case study is conducted on a 78-node distribution system in China.
(1) Measurement Denoising Effect
Laplace noise with a mean of 0 and a standard deviation of 0.01, and bimodal Gaussian noise with covariance matrices of 10
−5I and 10
−3I and weights of 0.5 for each mode, are added to the active and reactive power data of node 17 of this system. The original measurements are decomposed into multiple IMF components using EEMD, and the reconstruction results are shown in
Table 8 and
Figure 5.
After EEMD denoising, the AE of the active power decreased from 6.68 × 10⁻³ to 5.87 × 10⁻³, and the AE of the reactive power decreased from 7.31 × 10⁻³ to 6.09 × 10⁻³ in the Laplace noise environment, reducing by approximately 12% and 17%, respectively. In the bimodal Gaussian noise environment, the AE of the active power is reduced by nearly 20% and the AE of the reactive power is reduced by about 19%, demonstrating a significant denoising effect.
As shown in
Figure 5, the RMSE of each denoised measurement is obviously reduced. To demonstrate the denoising effect of EEMD under strong non-Gaussian noise, Laplace noise with a mean of 0 and standard deviation ranging from 0.02 to 0.05 in steps of 0.01 is superimposed onto the active power data of node 17, and EEMD is used to denoise the data.
Table 9 shows the comparison of measurement errors before and after denoising.
From
Table 9, it can be seen that under the influence of gradually increasing noise, the error after denoising with EEMD is always lower than the original error. Specifically, AE is reduced by nearly 29%, indicating that the denoised data are closer to the true measurement. RMSE is decreased by nearly 38%, improving the stability of measurement data and ensuring the reliability and accuracy of the data required for subsequent filtering.
(2) Effect of EKRRSE Filtering after Denoising
To verify the denoising effect of EEMD decomposition, Laplace noise with a mean of 0 and standard deviations ranging from 0.01 to 0.05 in steps of 0.01 is superimposed onto the measurement data of node 17. Subsequently, EEMD-denoised measurements are filtered using EKRRSE, and the results are presented in
Table 10.
Table 10 shows that EKRRSE can also improve the filtering effect in the practical distribution system. The average MAPE is decreased by 15%, and the average RMSE is decreased by 14%, further improving the filtering accuracy and stability. This is because EKRRSE can obtain the relative weights of each regression independent variable on the state information, and establish a mapping relationship between measurement and residuals, thereby obtaining more reliable estimated residuals.
(3) Robustness Analysis
Table 11 shows a comparison of the filtering results between EKRRSE and KRRSE to evaluate the filtering performance on abnormal data. Two scenarios are considered to compare the filtering results.
Scenario 1: The active power measurement information of nodes 11 and 61 randomly deviates from the normal value by 50%.
Scenario 2: 20% of the reactive power measurement information of nodes 8 and 10 is missing randomly.
Table 11 shows that the MAPE and RMSE of EKRRSE are lower than those of KRRSE. This is because EKRRSE learns the relationship between measurement information and residual errors, making the filtering results closer to the true state and improving filtering accuracy and stability.
(4) Computation Efficiency
To further validate the performance advantages of the proposed EKRRSE method, a comparison between EKRRSE and KRRSE is conducted in terms of the runtime and relative error. The results are presented in
Table 12.
From
Table 12, it can be observed that EKRRSE has a slightly increased runtime due to the integration of residual information from KRRSE. However, it still remains within the millisecond range. In addition, the relative error of EKRRSE is lower than that of KRRSE, improving the filtering performance. This demonstrates that the EKRRSE method also exhibits high efficiency and accuracy in practical distribution systems.


