Strategic Framework for Parameterization of Cell Culture Models


Abstract
:1. Introduction
2. Materials and Methods
2.1. Cell Culture Maintenance
2.2. Fed-Batch Cell Cultures
2.3. Analytical Assays
2.4. Computational Tools
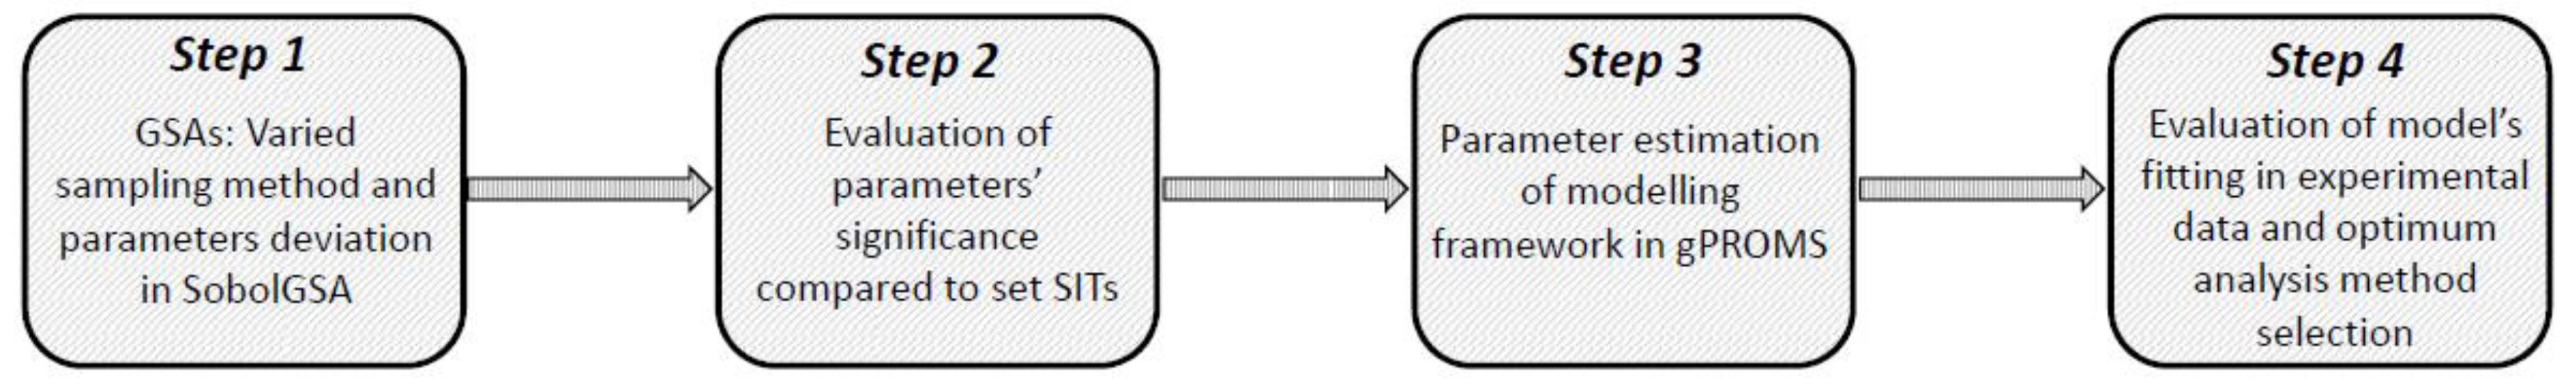
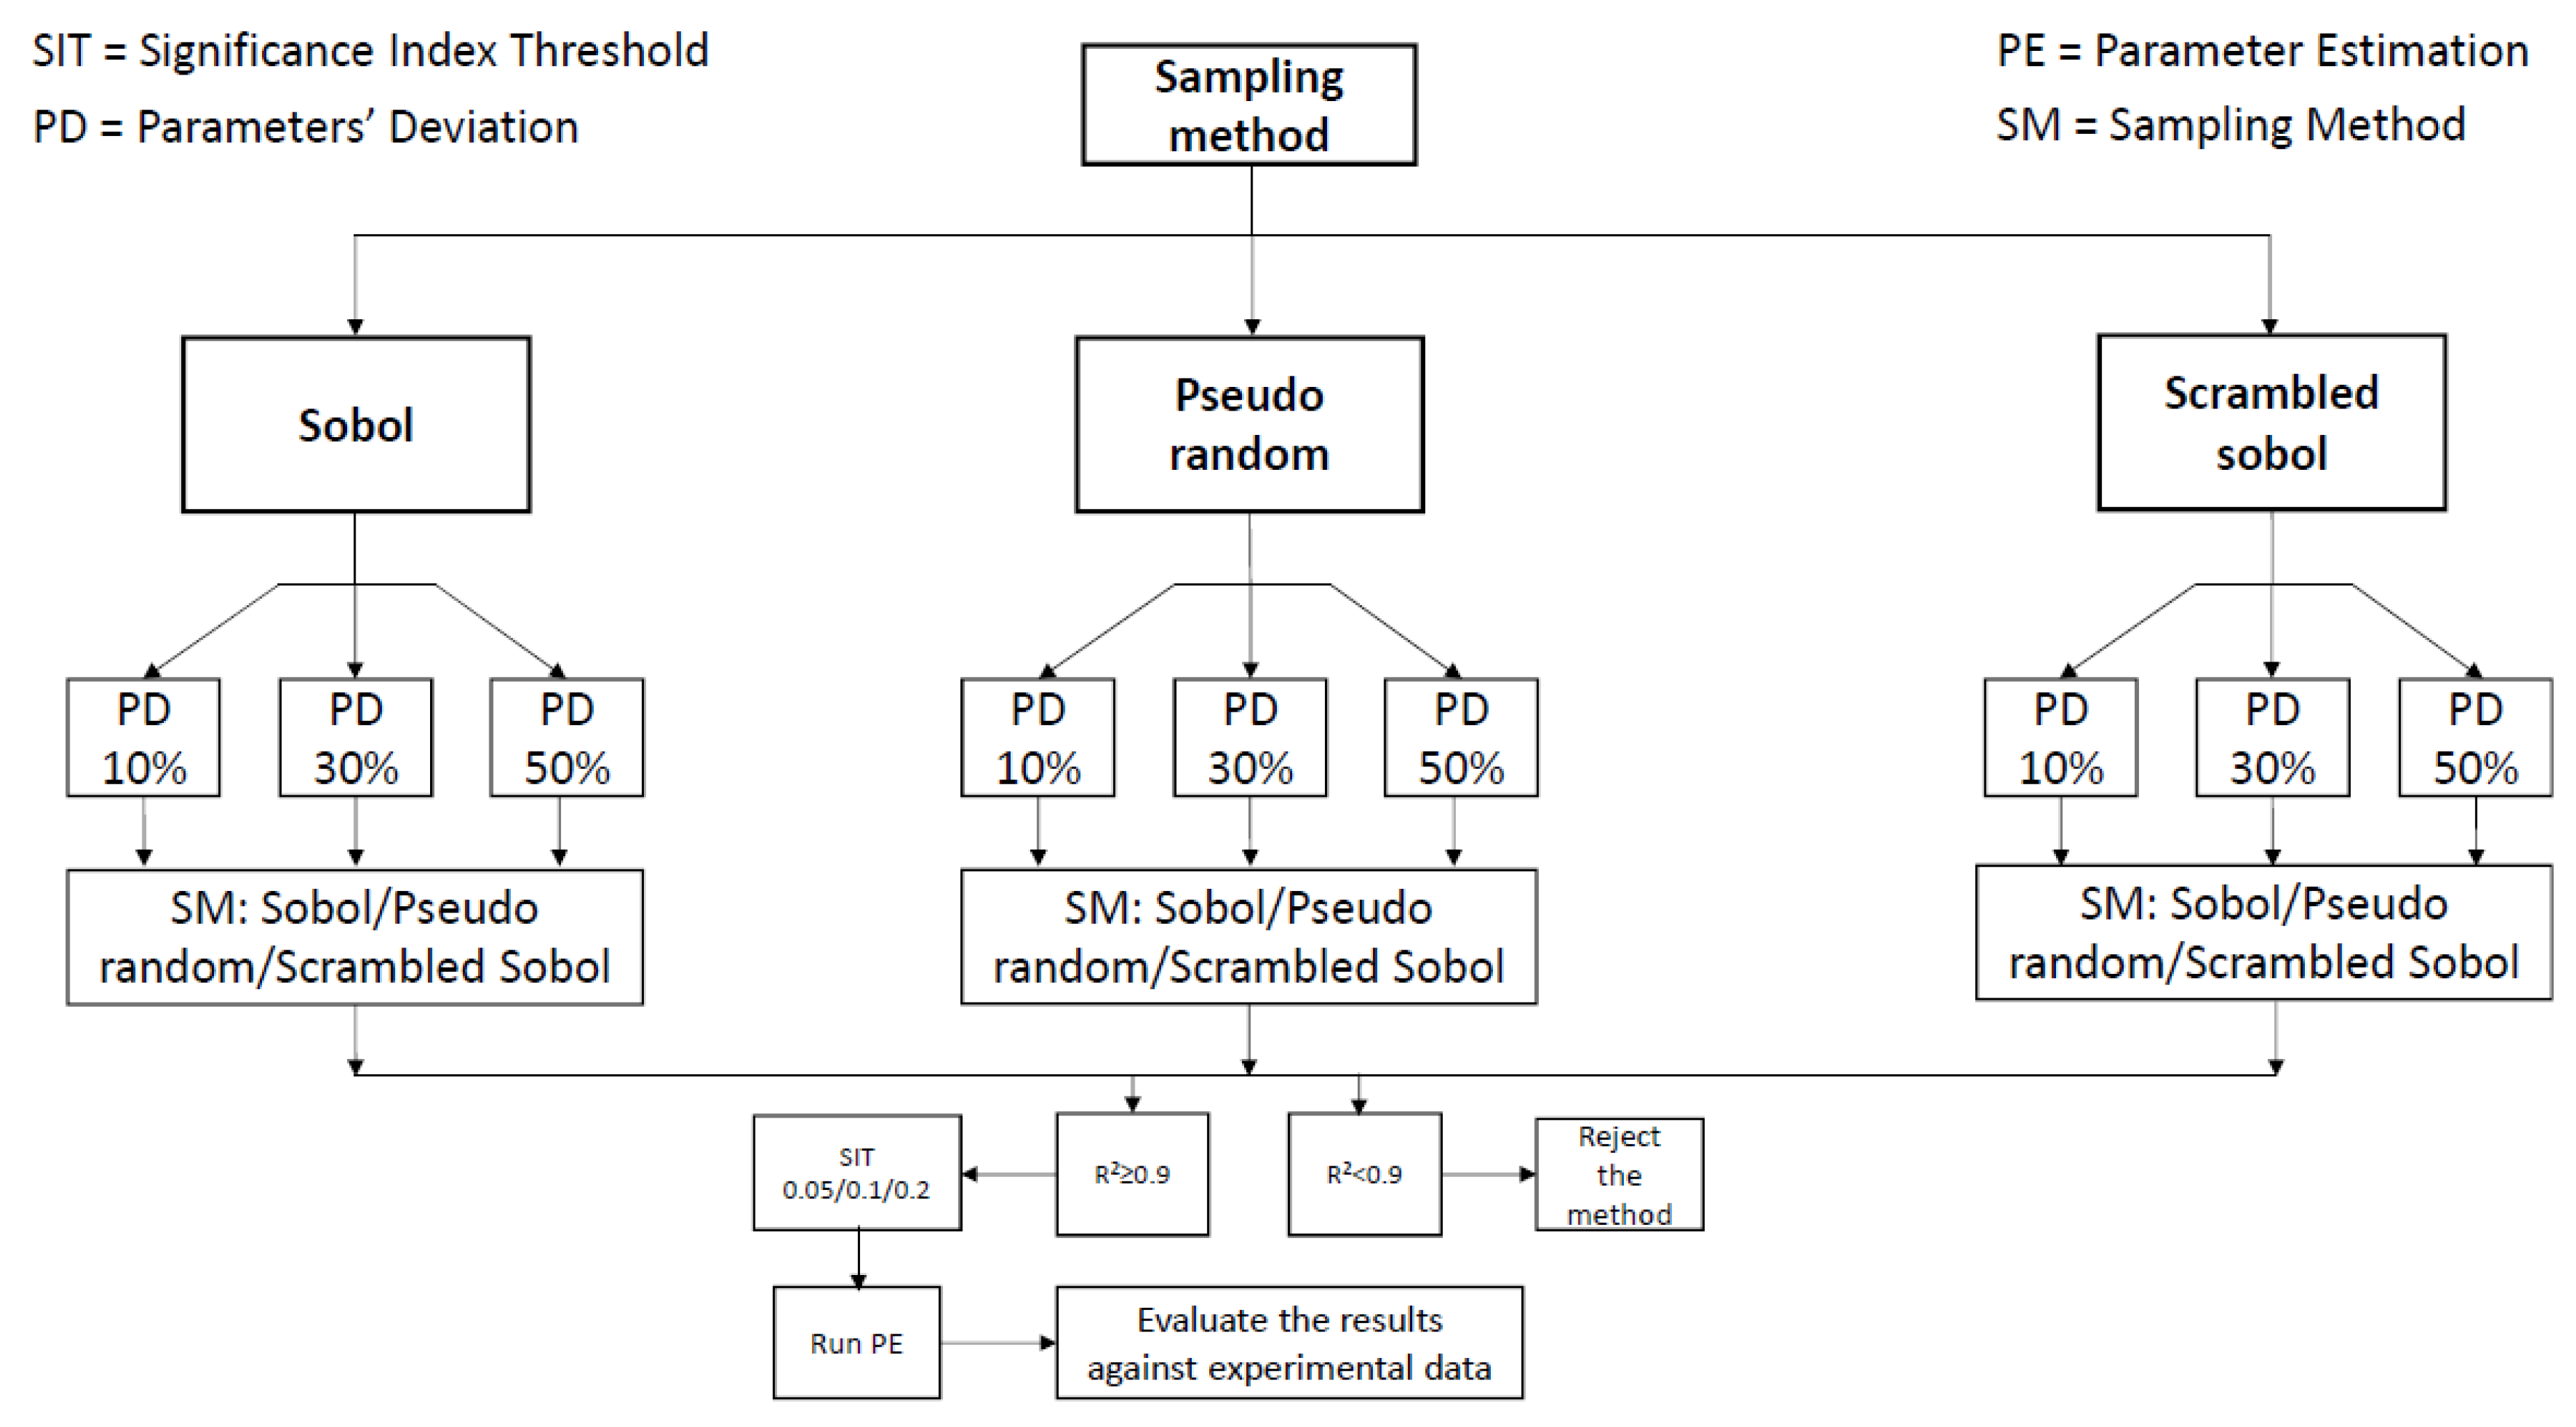
2.5. Workflow and Strategic Framework
- Step 1:
- GSA is performed for the model in use. GSA parameters that can vary are: sampling strategy for the parameter space and metamodel building (Sobol’, Pseudo-random, Scrambled-Sobol’) and range of parameter deviation (10%, 30% and 50%).
- Step 2:
- The resulting metamodels that exhibit high agreement (R2 > 0.9) are used to progress to post-sensitivity analysis where different SITs were applied (0.05, 0.1 and 0.2) in order to indicate the significant parameters.
- Step 3:
- Each set of significant parameters indicated by Step 2 is then included in parameter estimation for the model in use.
- Step 4:
- The parameter estimation results and therefore the sensitivity analysis efficiency are subsequently evaluated in terms of goodness of fit with experimental data and the optimum analysis method is chosen.
3. Results and Discussion
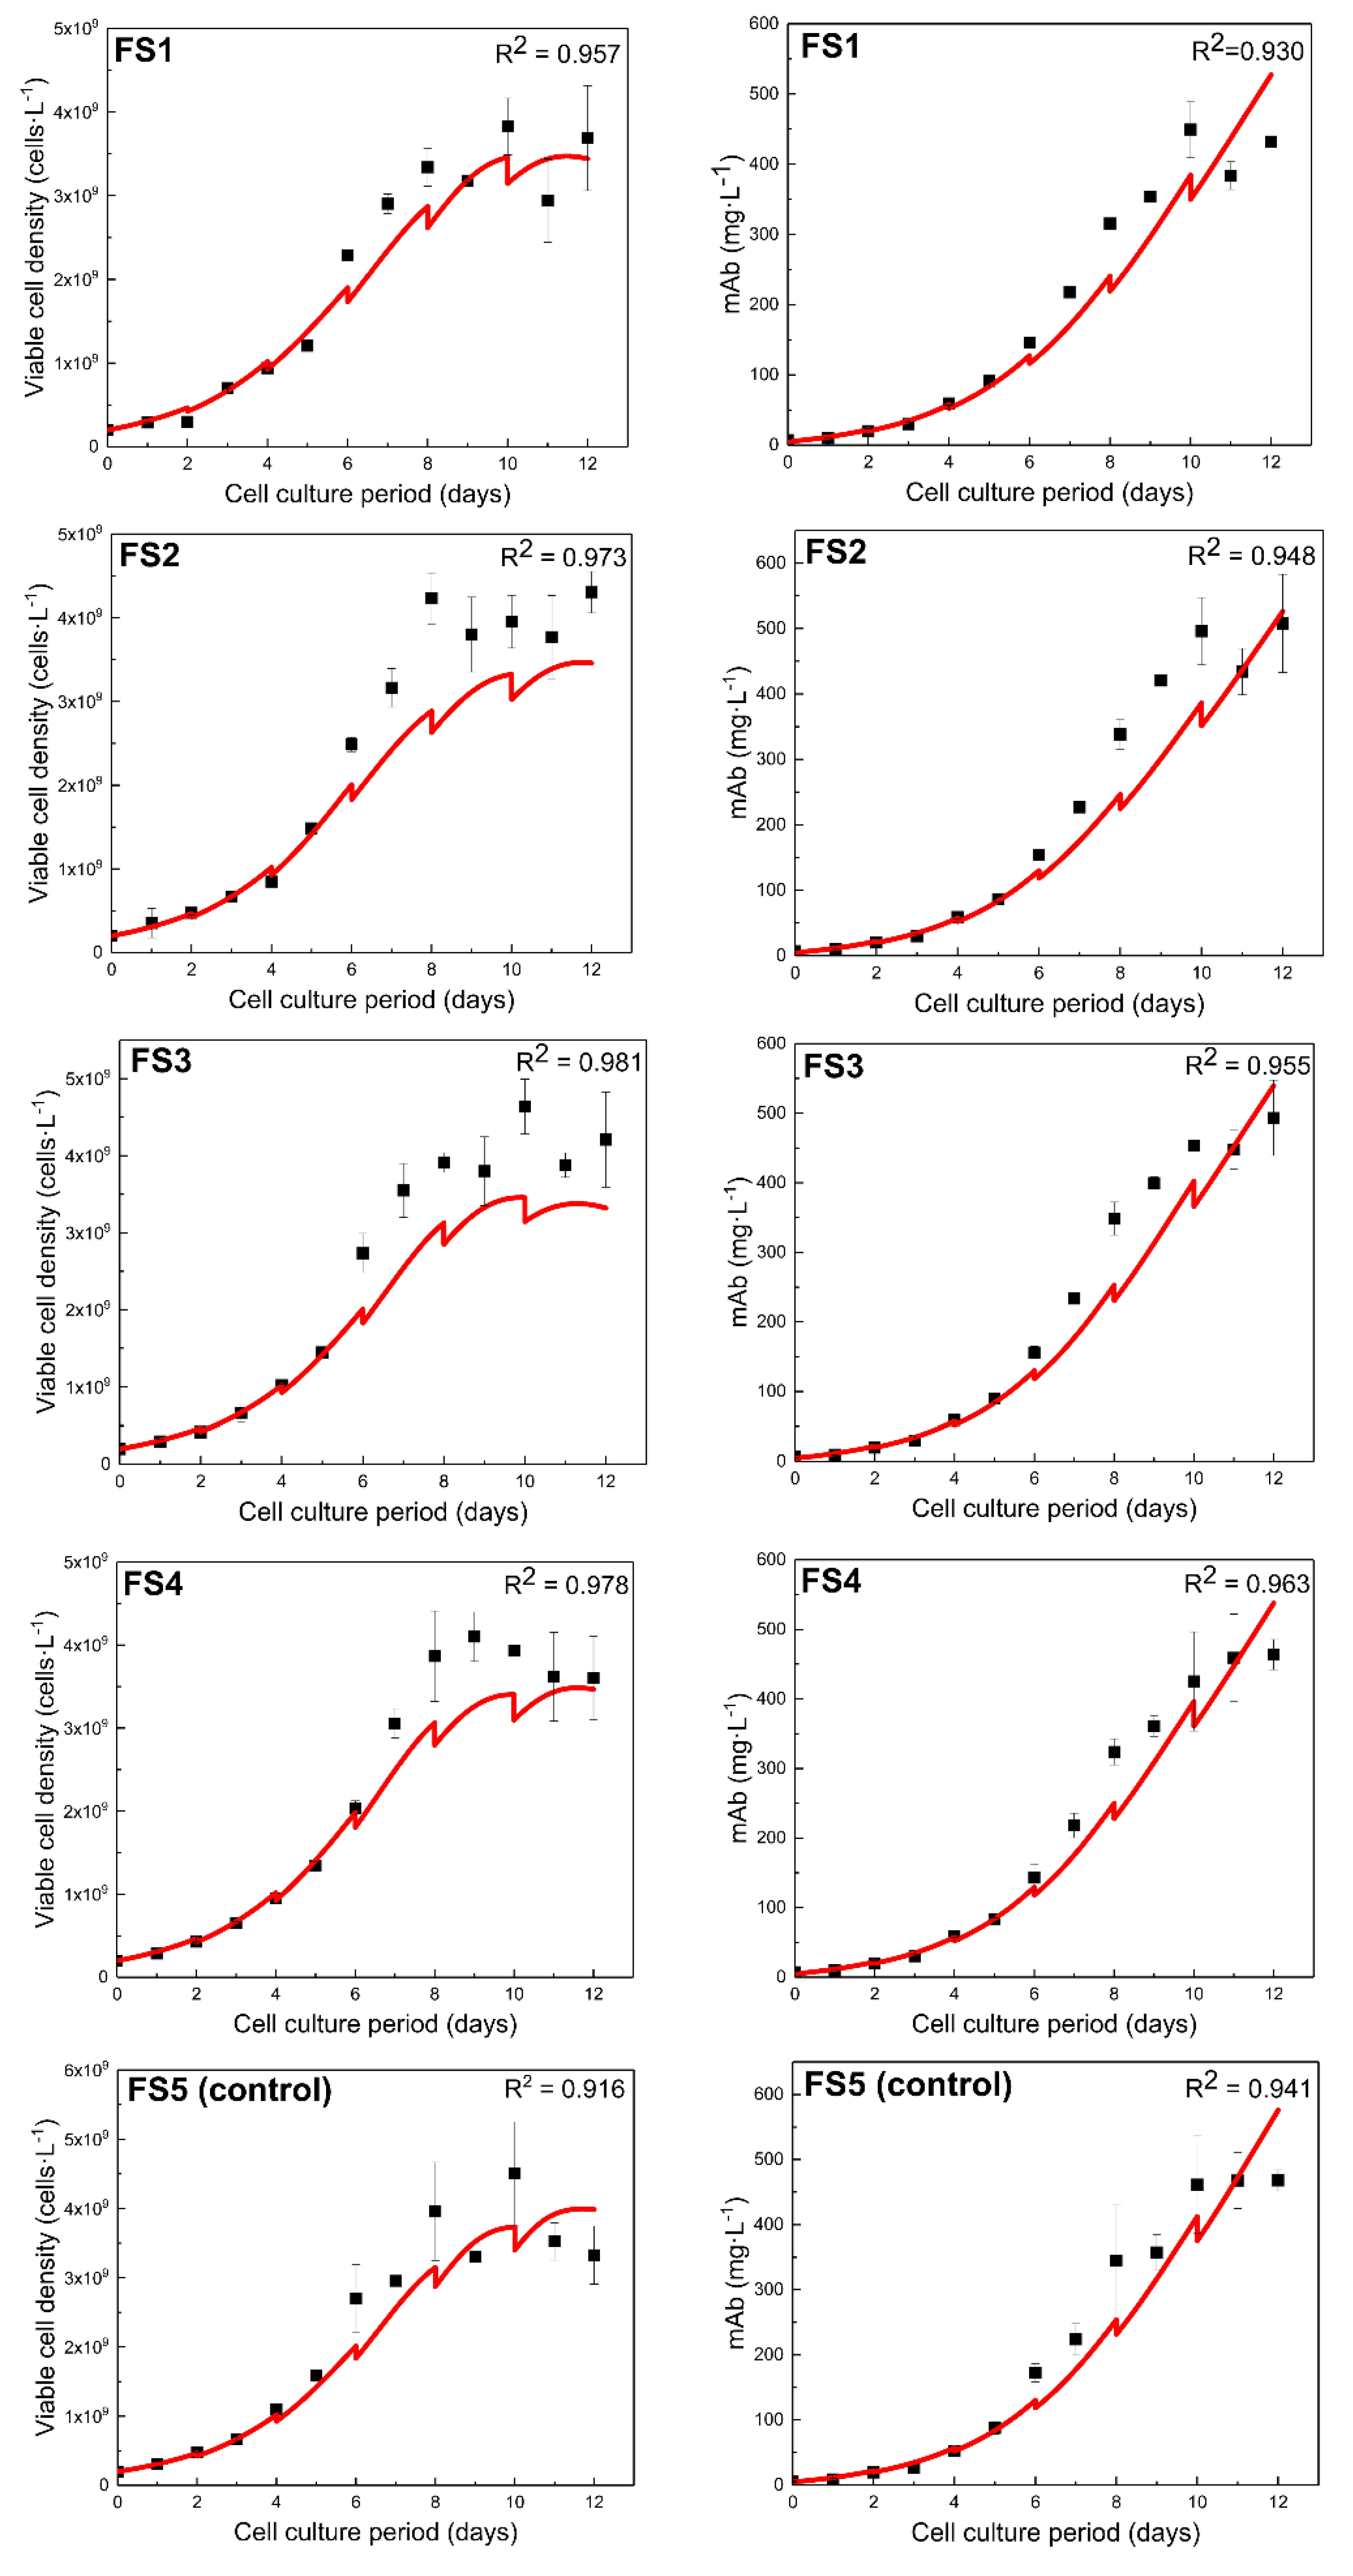
3.1. Model Calibration to CHO-T Cell Line
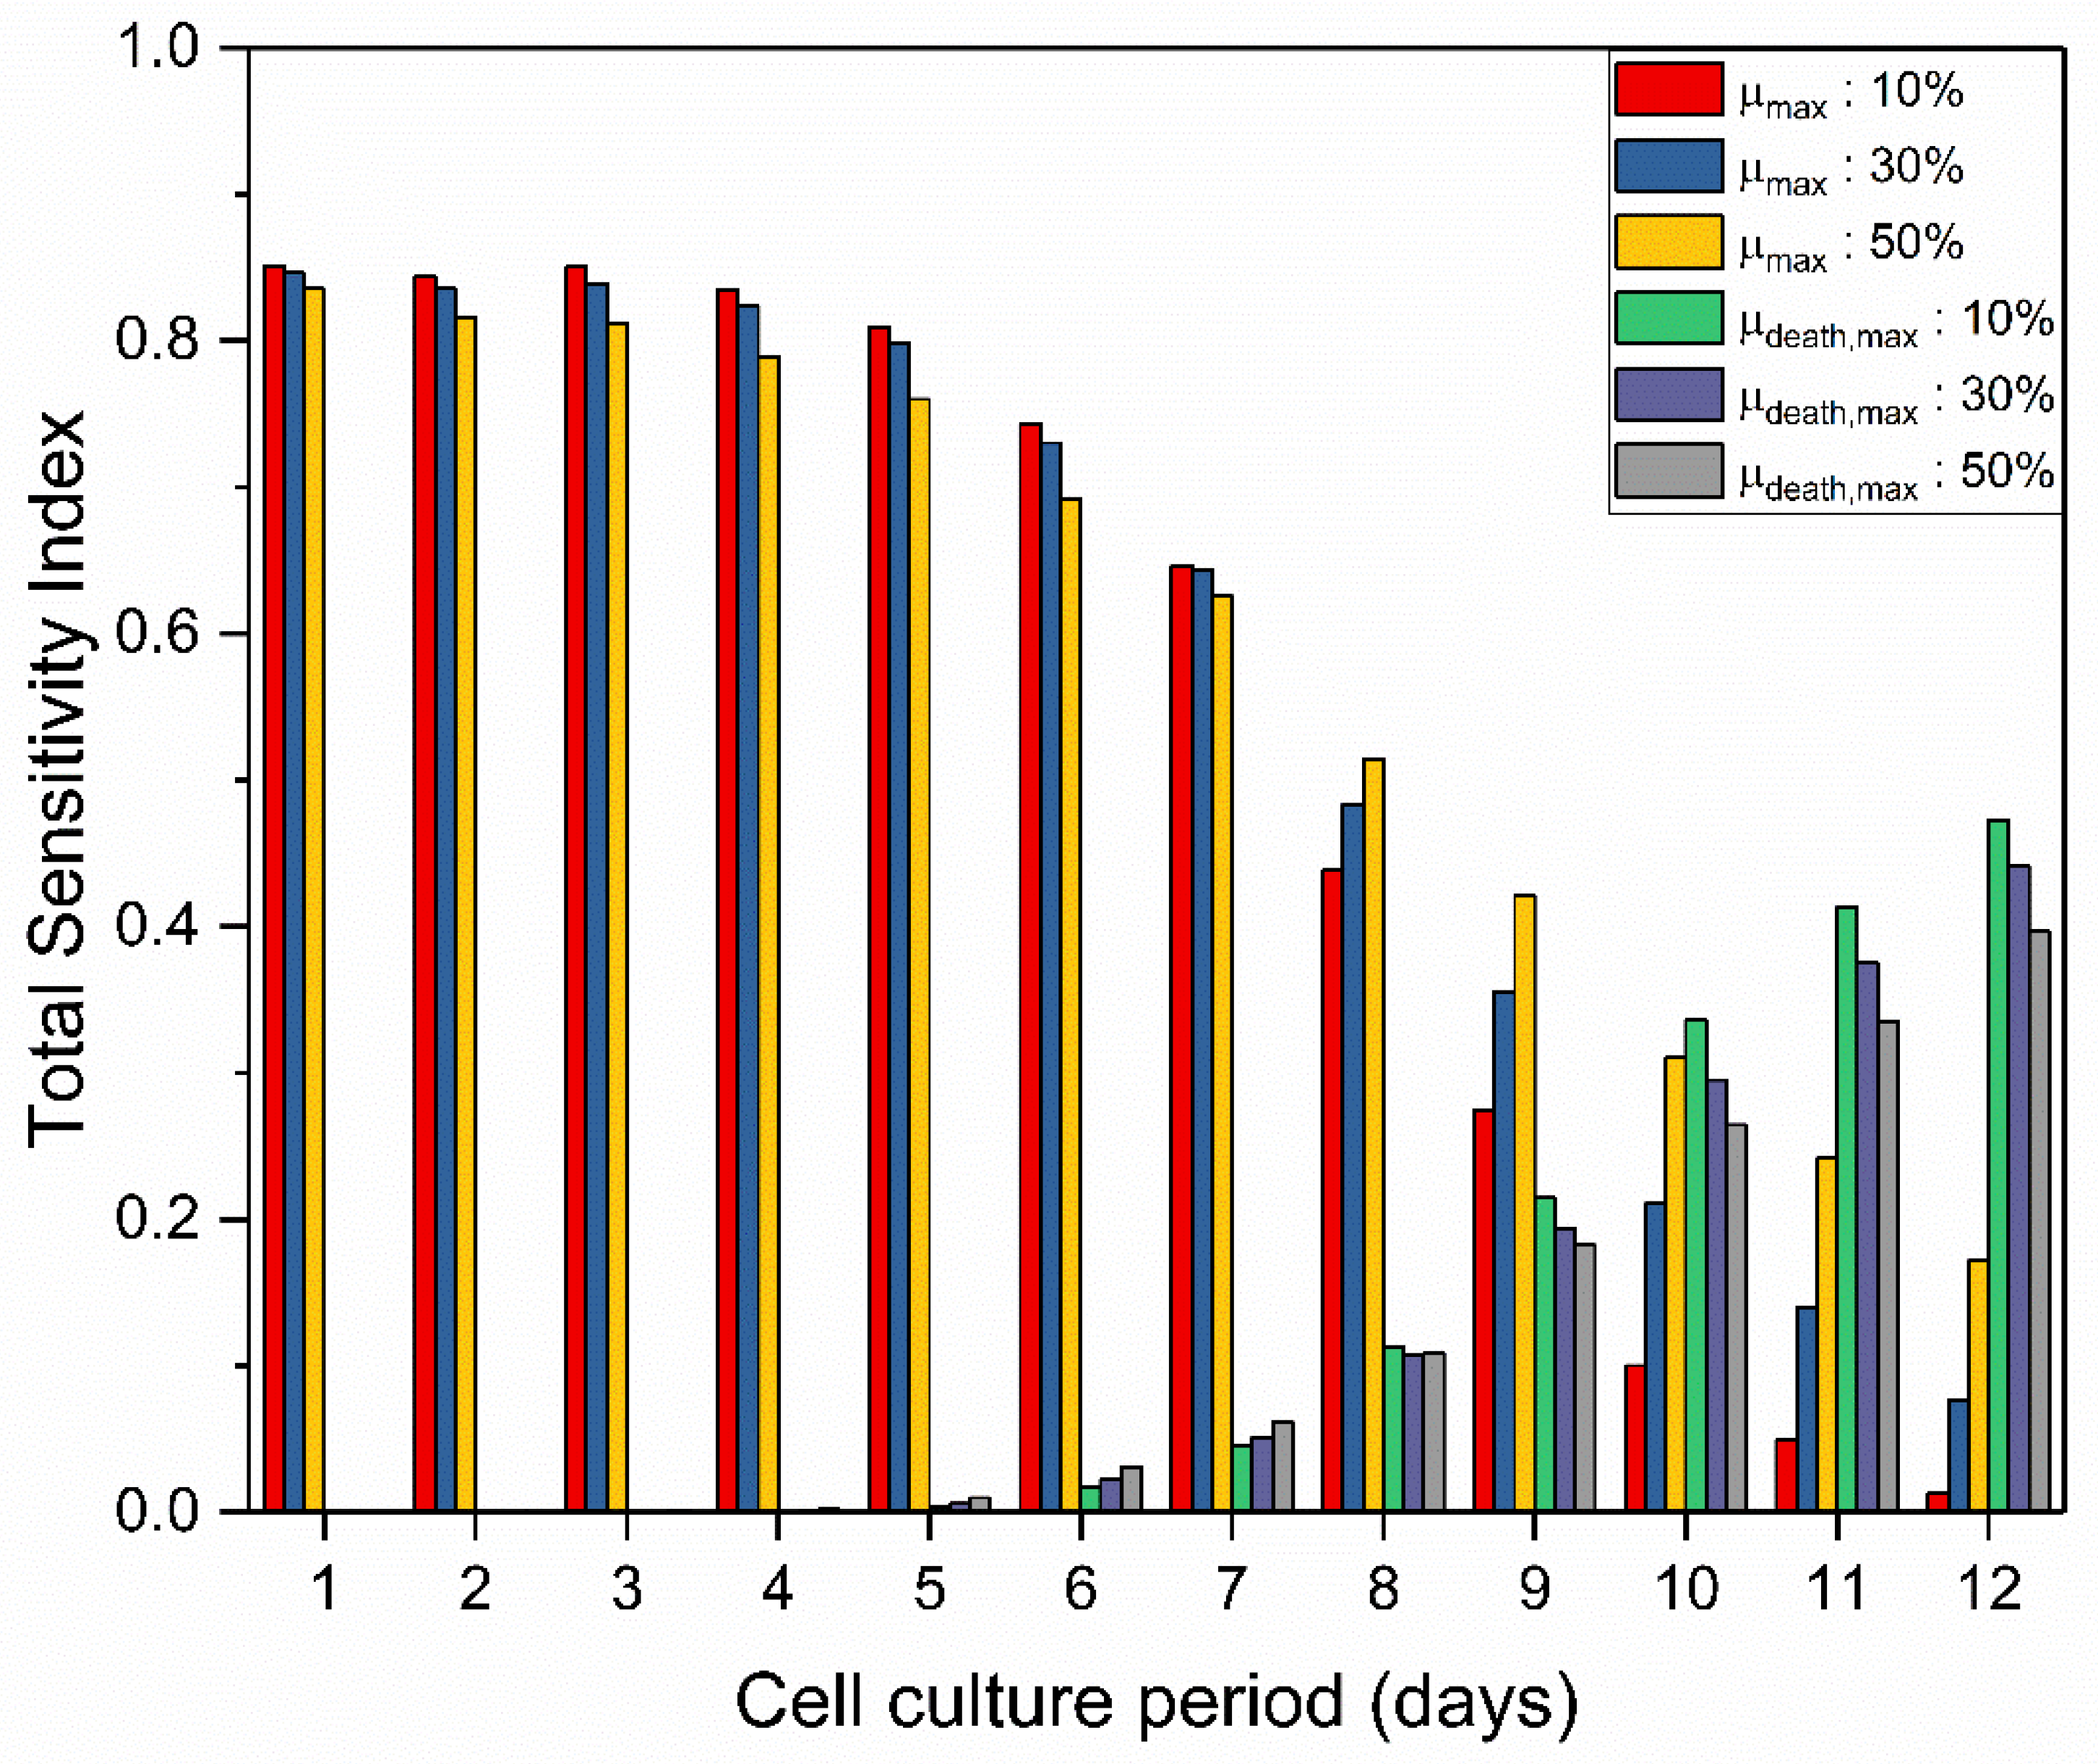
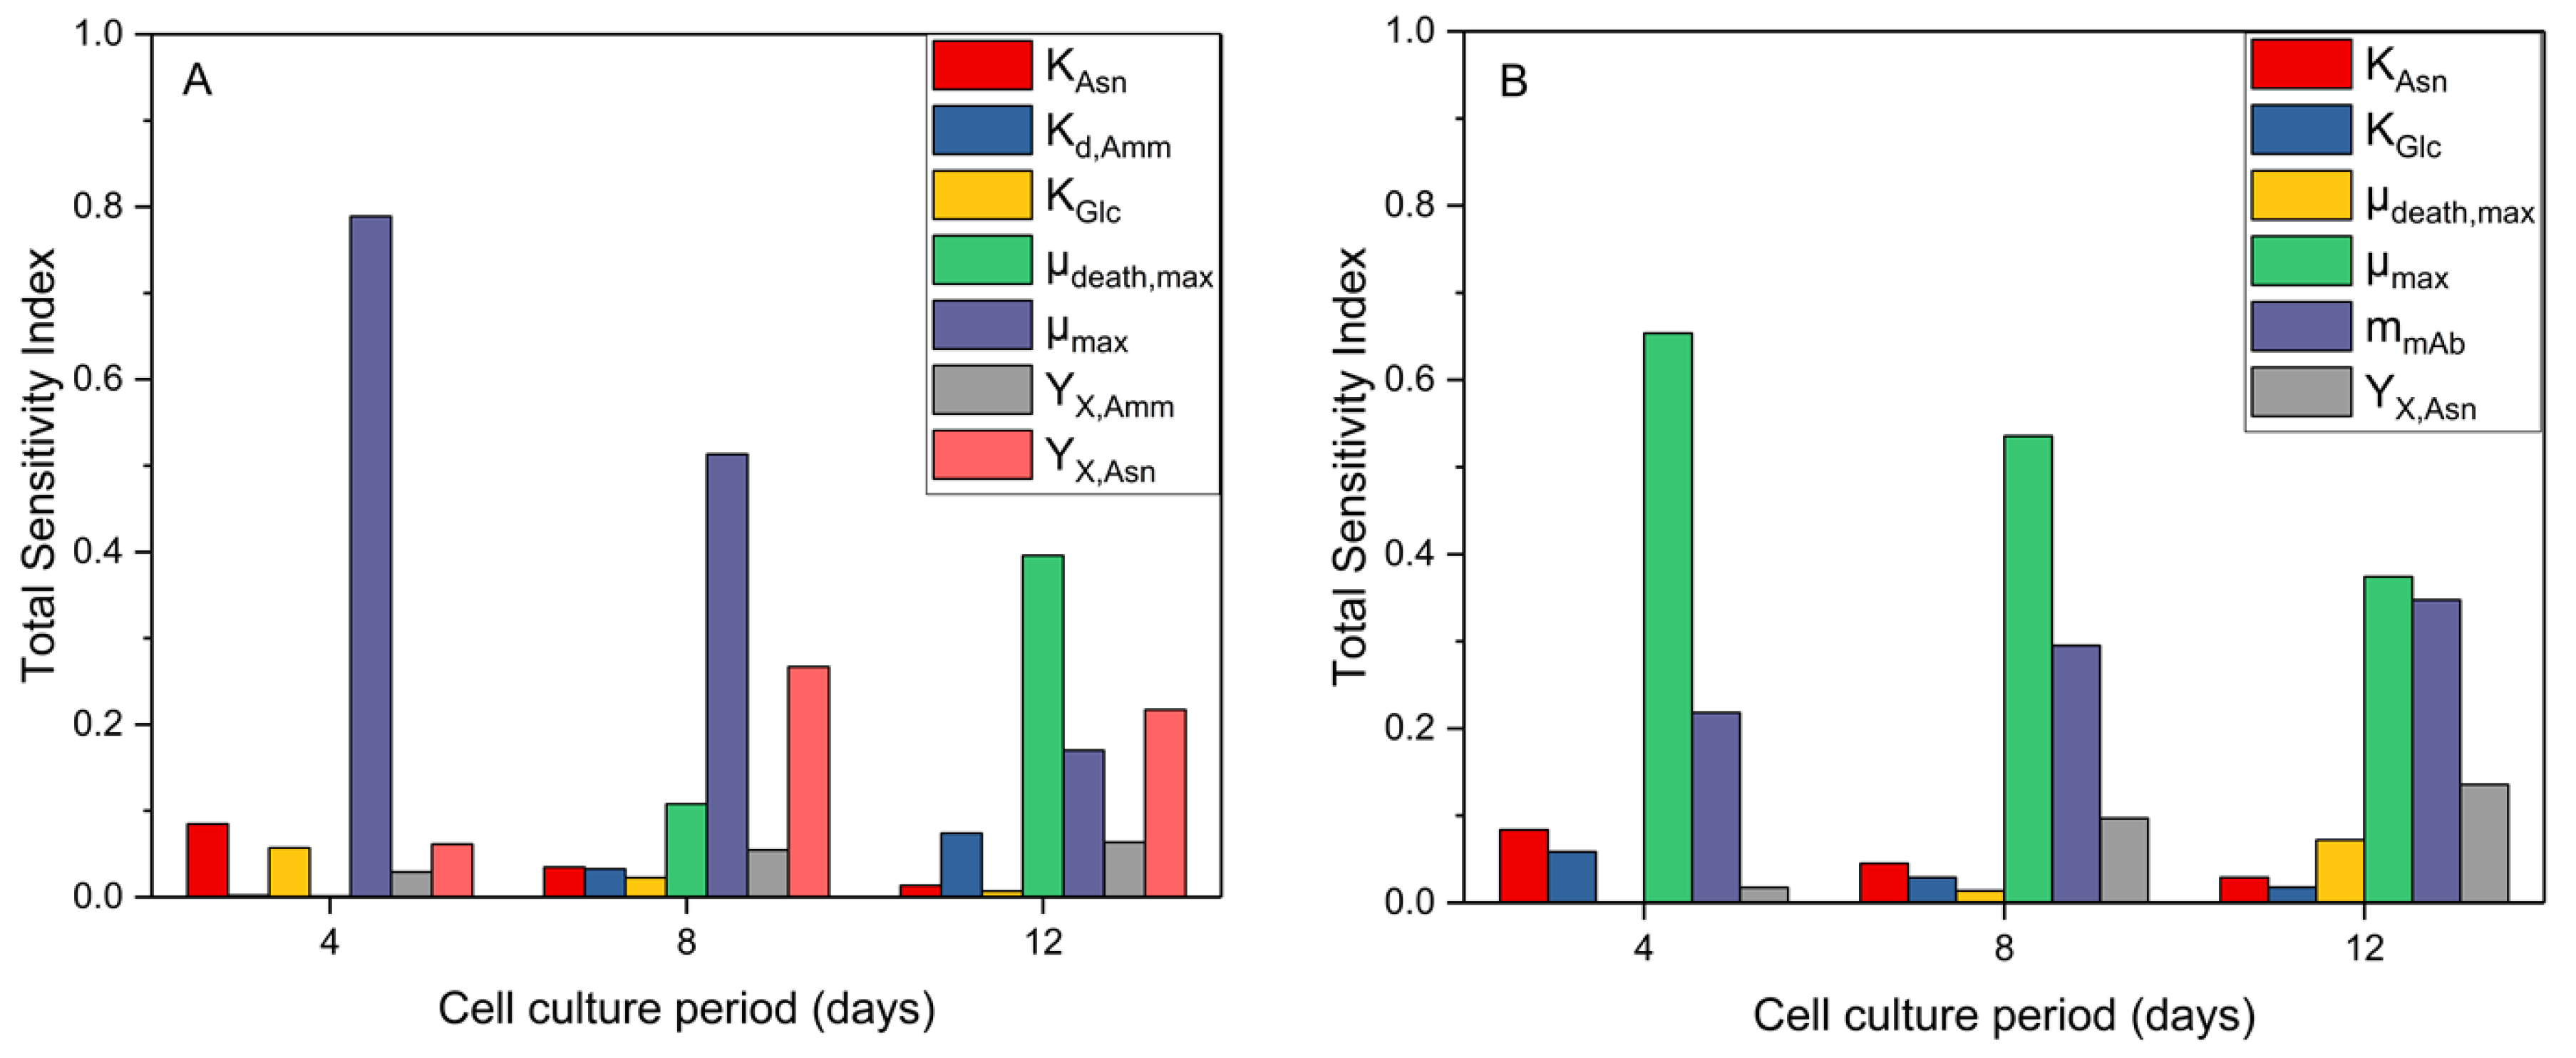
3.1.1. GSA Results for the Mathematical Model
3.1.2. Post-Analysis of GSA Results and Model Calibration
3.1.3. Model Predictive Capabilities Post Re-Calibration
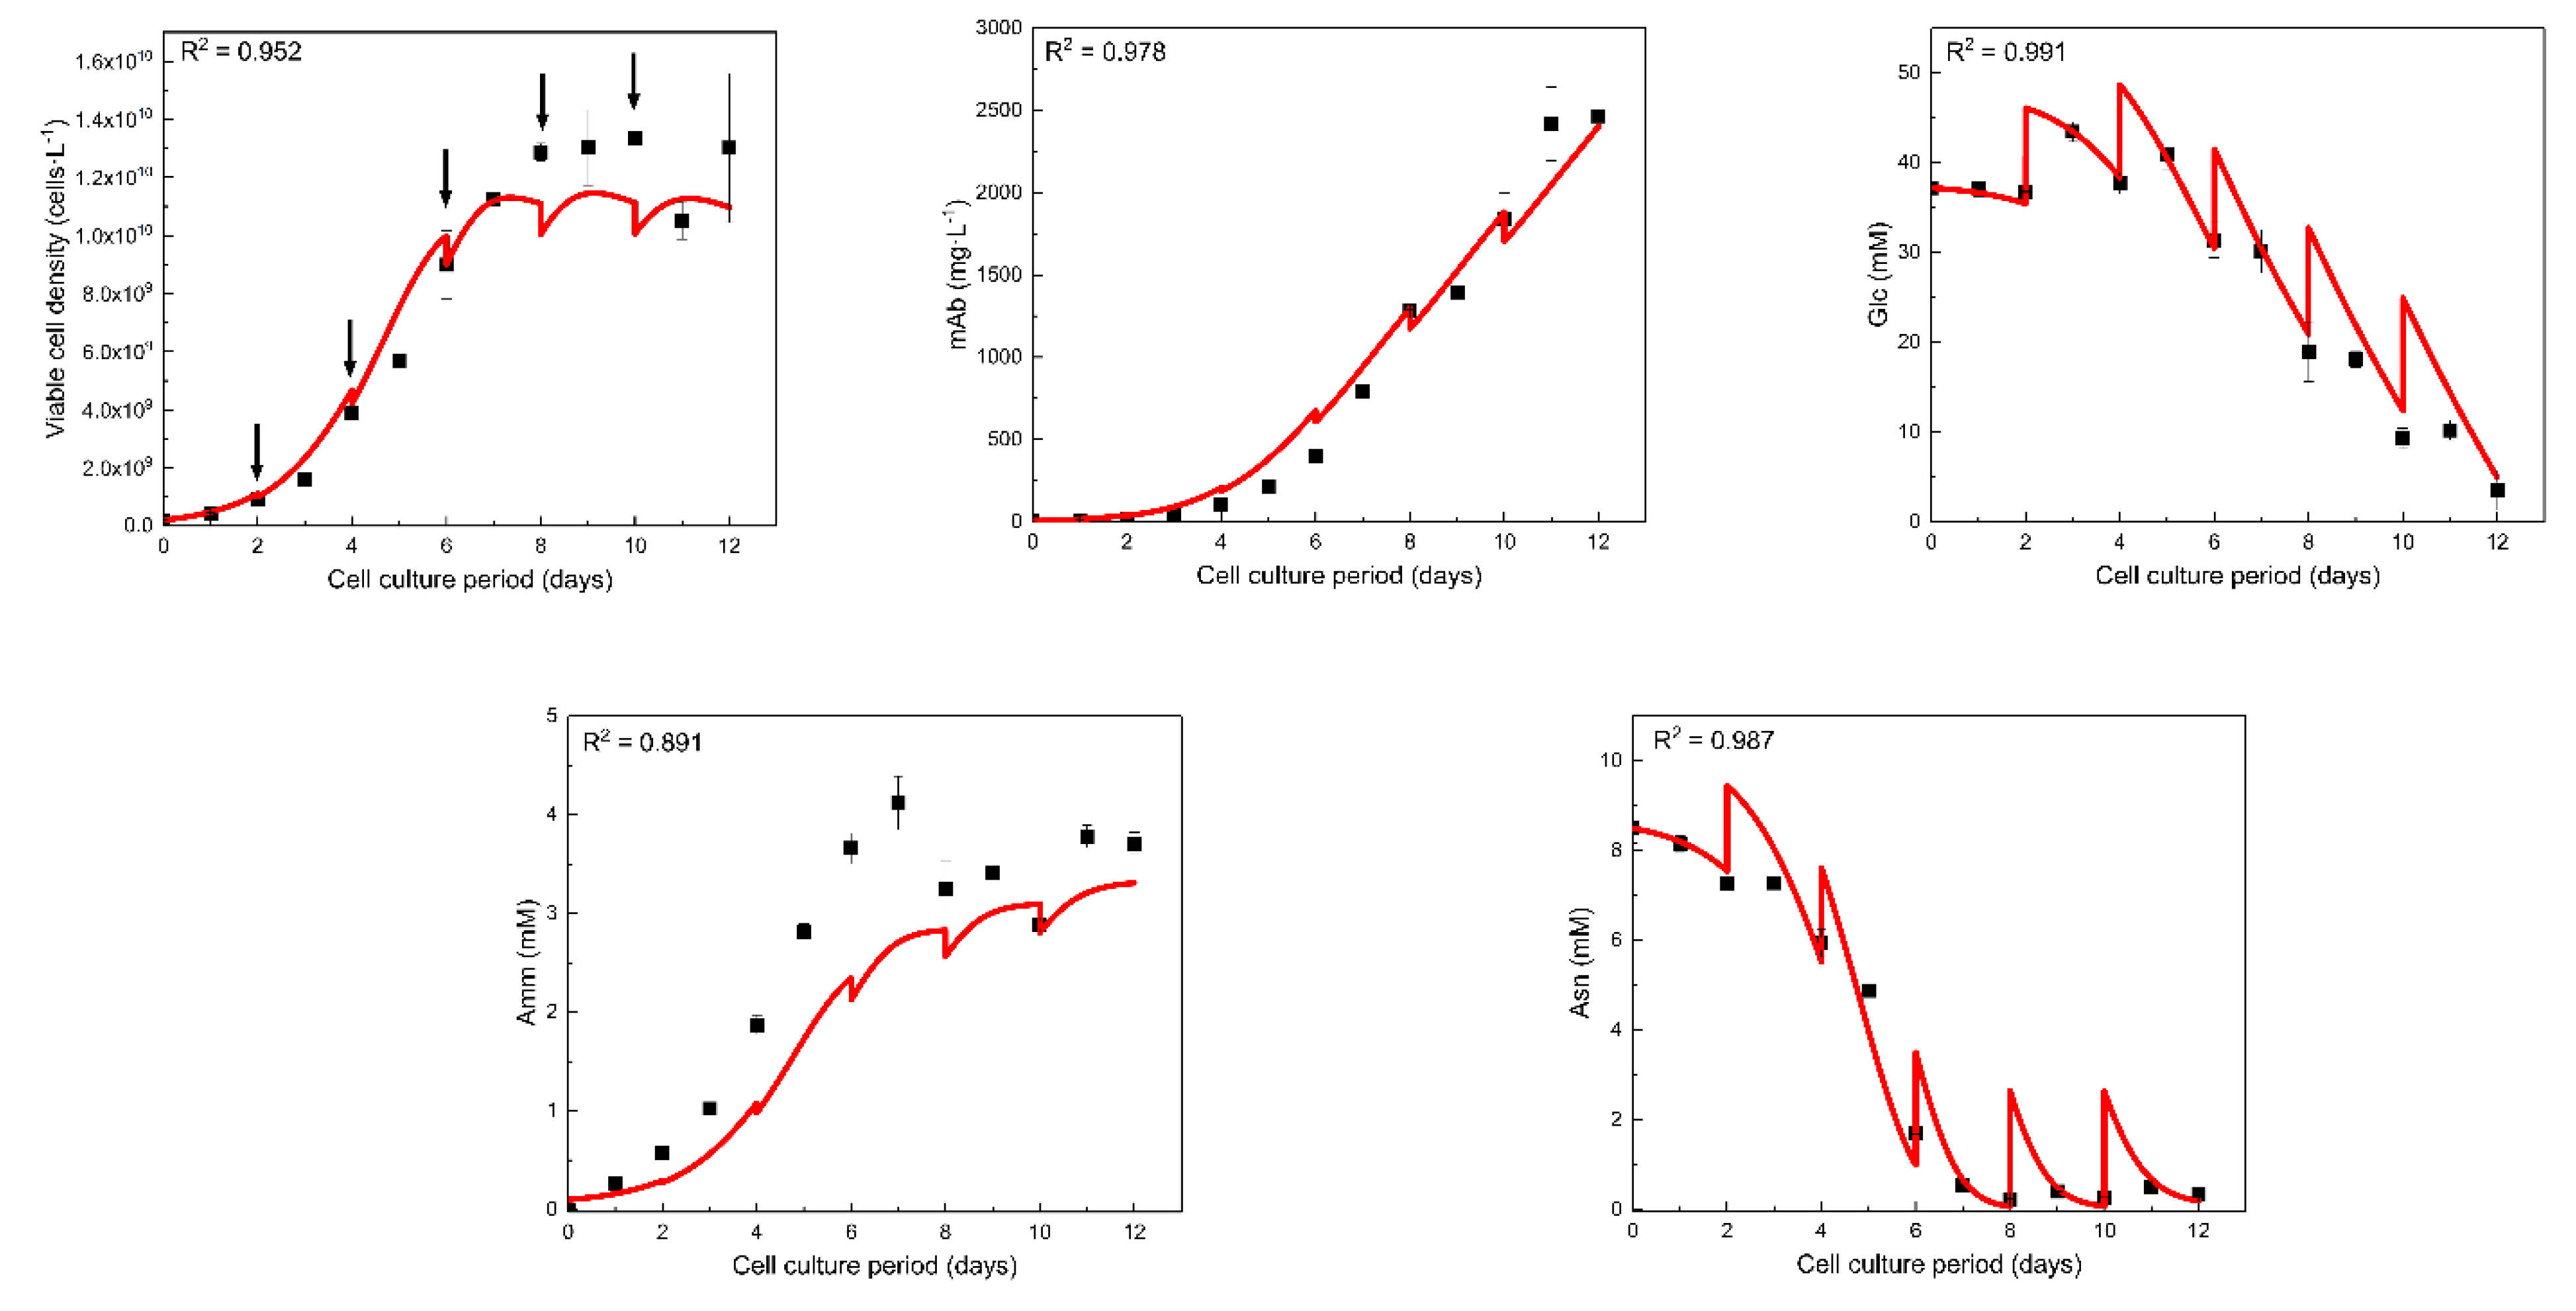
3.2. Model Training to a Different CHO Cell Line (GS46)
4. Conclusions
Supplementary Materials
Author Contributions
Funding
Acknowledgments
Conflicts of Interest
References
- Sanderson, C.S.; Barford, J.P.; Barton, G.W. A structured, dynamic model for animal cell culture systems. Biochem. Eng. J. 1999, 3, 203–211. [Google Scholar] [CrossRef]
- Kontoravdi, C.; Asprey, S.P.; Pistikopoulos, E.N.; Mantalaris, A. Development of a dynamic model of monoclonal antibody production and glycosylation for product quality monitoring. Comput. Chem. Eng. 2007, 31, 392–400. [Google Scholar] [CrossRef]
- Nolan, R.P.; Lee, K. Dynamic model of CHO cell metabolism. Metab. Eng. 2011, 13, 108–124. [Google Scholar] [CrossRef]
- Hefzi, H.; Ang, K.S.; Hanscho, M.; Bordbar, A.; Ruckerbauer, D.; Lakshmanan, M.; Orellana, C.A.; Baycin-Hizal, D.; Huang, Y.; Ley, D. A consensus genome-scale reconstruction of Chinese hamster ovary cell metabolism. Cell Syst. 2016, 3, 434–443. [Google Scholar] [CrossRef]
- Calmels, C.; McCann, A.; Malphettes, L.; Andersen, M.R. Application of a curated genome-scale metabolic model of CHO DG44 to an industrial fed-batch process. Metab. Eng. 2019, 51, 9–19. [Google Scholar] [CrossRef] [PubMed]
- Jimenez del Val, I.; Fan, Y.; Weilguny, D. Dynamics of immature mAb glycoform secretion during CHO cell culture: An integrated modelling framework. Biotechnol. J. 2016, 11, 610–623. [Google Scholar] [CrossRef] [Green Version]
- Jedrzejewski, P.; del Val, I.; Constantinou, A.; Dell, A.; Haslam, S.; Polizzi, K.; Kontoravdi, C. Towards controlling the glycoform: A model framework linking extracellular metabolites to antibody glycosylation. Int. J. Mol. Sci. 2014, 15, 4492–4522. [Google Scholar] [CrossRef]
- Sou, S.N.; Jedrzejewski, P.M.; Lee, K.; Sellick, C.; Polizzi, K.M.; Kontoravdi, C. Model-based investigation of intracellular processes determining antibody Fc-glycosylation under mild hypothermia. Biotechnol. Bioeng. 2017, 11, 1570–1582. [Google Scholar] [CrossRef] [PubMed]
- Villiger, T.K.; Scibona, E.; Stettler, M.; Broly, H.; Morbidelli, M.; Soos, M. Controlling the time evolution of mAb N-linked glycosylation—Part II: Model-based predictions. Biotechnol. Prog. 2016, 32, 1135–1148. [Google Scholar] [CrossRef] [PubMed]
- Saltelli, A.; Annoni, P.; Azzini, I.; Campolongo, F.; Ratto, M.; Tarantola, S. Variance based sensitivity analysis of model output. Design and estimator for the total sensitivity index. Comput. Phys. Commun. 2010, 181, 259–270. [Google Scholar] [CrossRef]
- Kravaris, C.; Hahn, J.; Chu, Y. Advances and selected recent developments in state and parameter estimation. Comput. Chem. Eng. 2013, 51, 111–123. [Google Scholar] [CrossRef]
- Kiparissides, A.; Koutinas, M.; Kontoravdi, C.; Mantalaris, A.; Pistikopoulos, E.N. ‘Closing the loop’ in biological systems modeling—From the in silico to the in vitro. Automatica 2011, 47, 1147–1155. [Google Scholar] [CrossRef]
- Kontoravdi, C.; Pistikopoulos, E.N.; Mantalaris, A. Systematic development of predictive mathematical models for animal cell cultures. Comput. Chem. Eng. 2010, 34, 1192–1198. [Google Scholar] [CrossRef] [Green Version]
- Wang, Z.; Sheikh, H.; Lee, K.; Georgakis, C. Sequential parameter estimation for mammalian cell model based on in silico design of experiments. Processes 2018, 6, 100. [Google Scholar] [CrossRef]
- Kiparissides, A.; Rodriguez-Fernandez, M.; Kucherenko, S.; Mantalaris, A.; Pistikopoulos, E. Application of global sensitivity analysis to biological models. In Computer Aided Chemical Engineering; Braunschweig, B., Joulia, X., Eds.; Elsevier: Amsterdam, The Netherlands, 2008; pp. 689–694. [Google Scholar]
- Kontoravdi, C.; Asprey, S.P.; Pistikopoulos, E.N.; Mantalaris, A. Application of global sensitivity analysis to determine goals for design of experiments: An example study on antibody-producing cell cultures. Biotechnol. Prog. 2005, 21, 1128–1135. [Google Scholar] [CrossRef] [PubMed]
- Todri, E.; Amenaghawon, A.N.; Del Val, I.J.; Leak, D.J.; Kontoravdi, C.; Kucherenko, S.; Shah, N. Global sensitivity analysis and meta-modeling of an ethanol production process. Chem. Eng. Sci. 2014, 114, 114–127. [Google Scholar] [CrossRef]
- Sobol’, I.M. Global sensitivity indices for nonlinear mathematical models and their Monte Carlo estimates. Math. Comput. Simul. 2001, 55, 271–280. [Google Scholar] [CrossRef]
- Hong, H.S.; Hickernell, F.J. Algorithm 823: Implementing scrambled digital sequences. ACM Trans. Math. Softw. 2003, 29, 95–109. [Google Scholar] [CrossRef]
- Saltelli, A. Making best use of model evaluations to compute sensitivity indices. Comput. Phys. Commun. 2002, 145, 280–297. [Google Scholar] [CrossRef]
- Sobol’, I.M.; Kucherenko, S. Global sensitivity indices for nonlinear mathematical models. Review. WILMOTT Mag. 2005, 1, 56–61. [Google Scholar] [CrossRef]
- Li, G.; Rosenthal, C.; Rabitz, H. High dimensional model representations. J. Phys. Chem. A 2001, 105, 7765–7777. [Google Scholar] [CrossRef]
- Li, G.; Wang, S.-W.; Rabitz, H. Practical approaches to construct RS-HDMR component functions. J. Phys. Chem. A 2002, 106, 8721–8733. [Google Scholar] [CrossRef]
- Li, G.; Bastian, C.; Welsh, W.; Rabitz, H. Experimental design of formulations utilizing high dimensional model representation. J. Phys. Chem. A 2015, 119, 8237–8249. [Google Scholar] [CrossRef]
- Li, G.; Hu, J.; Wang, S.W.; Georgopoulos, P.G.; Schoendorf, J.; Rabitz, H. Random sampling-high dimensional model representation (RS-HDMR) and orthogonality of its different order component functions. J. Phys. Chem. A 2006, 110, 2474–2485. [Google Scholar] [CrossRef]
- Li, G.; Rabitz, H.; Yelvington, P.E.; Oluwole, O.O.; Bacon, F.; Kolb, C.E.; Schoendorf, J. Global sensitivity analysis for systems with independent and/or correlated inputs. J. Phys. Chem. A 2010, 114, 6022–6032. [Google Scholar] [CrossRef] [PubMed]
- Spiessl, S.M.; Kucherenko, S.; Becker, D.A.; Zaccheus, O. Higher-order sensitivity analysis of a final repository model with discontinuous behaviour using the RS-HDMR meta-modeling approach. Reliab. Eng. Syst. Saf. 2018. [Google Scholar] [CrossRef]
- Kotidis, P.; Jedrzejewski, P.; Sou, S.N.; Sellick, C.; Polizzi, K.; del Val, I.J.; Kontoravdi, C. Model-based optimisation of antibody galactosylation in CHO cell culture. Biotechnol. Bioeng. 2019. [Google Scholar] [CrossRef] [PubMed]
- PSE. gPROMS ModelBuilder Documentation v.5.1.1; Process Systems Enterprise Limited: London, UK, 2018. [Google Scholar]
- Kucherenko, S.; Zaccheus, O. SobolGSA Software. 2018. Available online: http://www.imperial.ac.uk/process-systems-engineering/research/free-software/sobolgsa-software/ (accessed on 20 March 2019).
- Zuniga, M.M.; Kucherenko, S.; Shah, N. Metamodelling with independent and dependent inputs. Comput. Phys. Commun. 2013, 184, 1570–1580. [Google Scholar] [CrossRef]
- Kotidis, P.; Demis, P.; Goey, C.H.; Correa, E.; McIntosh, C.; Trepekli, S.; Shah, N.; Klymenko, O.V.; Kontoravdi, C. Constrained global sensitivity analysis for bioprocess design space identification. Comput. Chem. Eng. 2019. [Google Scholar] [CrossRef]
- Kyriakopoulos, S.; Kontoravdi, C. A framework for the systematic design of fed-batch strategies in mammalian cell culture. Biotechnol. Bioeng. 2014, 111, 2466–2476. [Google Scholar] [CrossRef]


| Feeding Strategy | Galactose (mM) | Uridine (mM) | ||||||
|---|---|---|---|---|---|---|---|---|
| Day 4 | Day 6 | Day 8 | Day 10 | Day 4 | Day 6 | Day 8 | Day 10 | |
| FS1 | 79.35 | 15.38 | 10.99 | 248.29 | 15.87 | 3.08 | 2.20 | 49.66 |
| FS2 | 4.27 | 168.34 | 37.72 | 11.35 | 0.85 | 33.67 | 7.54 | 2.27 |
| FS3 | 5.19 | 3.11 | 235.29 | 249.94 | 1.04 | 0.62 | 47.06 | 49.99 |
| FS4 | 21.91 | 6.41 | 233.46 | 3.97 | 4.38 | 1.28 | 46.69 | 0.79 |
| FS5 (control) | - | - | - | - | - | - | - | - |
| Parameter | Value | Unit |
|---|---|---|
| μmax | 6.50 × 10⁻² | h−1 |
| μdeath,max | 1.50 × 10⁻² | h−1 |
| KGlc | 14.04 | mM |
| KAsn | 2.62 | mM |
| KIAmm | 3.17 | mM |
| KILac | 1 × 10³ | mM |
| KIUrd | 41.09 | mM |
| Kd,Amm | 14.28 | mM |
| Kd,Urd | 27.86 | mM |
| YmAb,X | 3.39 | pg·cell−1 |
| mmAb | 4.10 × 10⁻¹ | pg·cell−1·h−1 |
| 1.01 × 10⁹ | cell·mmol−1 | |
| 5.46 × 10⁷ | cell·mmol−1 | |
| 4.64 × 10⁹ | cell·mmol−1 | |
| 1.46 × 10¹⁰ | cell·mmol−1 | |
| 7.68 × 10⁸ | cell·mmol−1 | |
| 2.36 × 10⁹ | cell·mmol−1 | |
| 1.38 × 10⁸ | cell·mmol−1 | |
| 1.61 × 10⁹ | cell·mmol−1 | |
| 3.59 × 10⁹ | cell·mmol−1 | |
| 0.10 | mmol·mmol−1 | |
| 1.56 | mmol·mmol−1 | |
| 0.10 | mmol·mmol−1 | |
| 0.13 | mmol·mmol−1 | |
| 2 | mmol·mmol−1 | |
| 3.43 × 10⁻¹¹ | mmol·cell−1·h−1 | |
| 1.87 × 10⁻¹⁰ | mmol·cell−1·h−1 | |
| 5.27 | mM | |
| 0.35 | - | |
| 21.20 | mM | |
| 16 | mM | |
| 18.23 | mM | |
| 7 | mM |
| Set A (SIT = 0.05) | Set B (SIT = 0.1) | Set C (SIT = 0.2) | |||||
|---|---|---|---|---|---|---|---|
| Parameter | Value | 95% CI | Value | 95% CI | Value | 95% CI | Units |
| 2.66 | 0.24 | - | - | - | - | mM | |
| 1.46 × 10⁻² | 2.92 × 10⁻³ | 1.41 × 10⁻² | 2.46 × 10⁻³ | - | - | h−1 | |
| 3.89 × 10⁻² | 1.14 × 10⁻³ | 3.89 × 10⁻² | 1.14 × 10⁻³ | 3.41 × 10⁻² | 7.24 × 10⁻⁴ | h−1 | |
| 1.07 | 5.10 × 10⁻² | 1.07 | 5.10 × 10⁻² | 1.13 | 5.46 × 10⁻² | pg·cell−1·h−1 | |
| 3.46 × 10⁸ | 2.79 × 10⁷ | 3.46 × 10⁸ | 2.79 × 10⁷ | - | - | cell·mmol−1 | |
| Estimated Parameter | Value | Units | 95% Confidence Interval |
|---|---|---|---|
| 1.31 | pg·cell−1·h−1 | 1.15 × 10⁻¹ | |
| 1.06 × 10⁹ | cell·mmol−1 | 4.97 × 10⁶ | |
| 5.68 × 10⁹ | cell·mmol−1 | 8.25 × 10⁷ | |
| 18.55 | mM | 4.02 | |
| 7.14 | mM | 0.64 | |
| 1.85 × 10¹⁰ | cell·mmol−1 | 3.53 × 10⁸ | |
| 3.35 × 10⁻¹¹ | mmol·cell−1·h−1 | 3.35 × 10⁻¹² | |
| 6.96 × 10⁻² | h−1 | 6.67 × 10⁻⁴ | |
| 4.66 × 10⁹ | cell·mmol−1 | 1.67 × 10⁸ | |
| 8.69 × 10⁸ | cell·mmol−1 | 2.75 × 10⁷ |
© 2019 by the authors. Licensee MDPI, Basel, Switzerland. This article is an open access article distributed under the terms and conditions of the Creative Commons Attribution (CC BY) license (http://creativecommons.org/licenses/by/4.0/).
Share and Cite
Kotidis, P.; Kontoravdi, C. Strategic Framework for Parameterization of Cell Culture Models. Processes 2019, 7, 174. https://doi.org/10.3390/pr7030174
Kotidis P, Kontoravdi C. Strategic Framework for Parameterization of Cell Culture Models. Processes. 2019; 7(3):174. https://doi.org/10.3390/pr7030174
Chicago/Turabian StyleKotidis, Pavlos, and Cleo Kontoravdi. 2019. "Strategic Framework for Parameterization of Cell Culture Models" Processes 7, no. 3: 174. https://doi.org/10.3390/pr7030174
APA StyleKotidis, P., & Kontoravdi, C. (2019). Strategic Framework for Parameterization of Cell Culture Models. Processes, 7(3), 174. https://doi.org/10.3390/pr7030174