3.2. Design of Experiments and Organic Removals
The Box–Behnken design matrix for AD of Pot ale is given in
Table 6 with experiment results. A variety of methane content was seen in the generated biogas. The maximum biogas quality and quantity were achieved with the std. no. 12 as 550 ± 6 mL/g vs. and 54.3% CH
4 in respectively. Although all reactions were started at the neutral pH, mainly low final pH values were seen in all samples with a slight difference (higher) in the ones seeded 50% sludge, however it was still lower than optimum pH range for methanogens (std. no. 7, 8, 11, and 12). The same particular samples also had significantly higher CH
4 percentages than the rest.
The percentage removals of the organic compounds are given in
Table 7. Mainly higher COD and BOD removals were achieved with the samples seeded with 50% sludge (std. no. 7, 8, 11, and 12 in
Table 7) suggesting the higher sludge amount delayed the pH drops thus methanogens could survive longer to transform the organic matter into CH
4. The pH drops were explained with VFA (acetic acid, propionic acid, isobutyric acid, butyric acid, isovaleric acid, and valeric acid) accumulation in the reactors. The total VFAs concentrations before and after AD are given in
Figure 4.In contrast, the highest SO4 decompositions were seen the samples which contain 10 and 30% sludge while SO4 removal of 50% sludge contain samples was almost one-third of the values obtained with 30% sludge. Due to the bacterial competition, the sludge seeding ratio lower than 50% results in unsuitable environment for methanogenic bacteria growth, and it triggers the activity of the sulphate reducing bacteria. Digestion under these conditions results in low CH4 generation and high (> 10,000 ppm) H2S generation.
The VFA concentration after AD was found to be significantly higher for all samples. The std. no. 5, 6, 9, 10, 7, 11 and 12 (which were seeded with 30 and 50% sludge) had lower total VFAs concentrations after AD in comparison to 10% sludge seeding. Moreover, 50% sludge containing samples (std. no. 7, 8, 11, and 12) had significantly higher biogas yields with significantly higher methane contents (
Table 6) indicating that they were not affected by VFA inhibition as much as the ones containing a lower sludge amount. The std. no. 12 in particular had the lowest total VFA value (16.12 mM) after AD and it had the highest biogas quality and the quantity (
Table 6).
The same design was followed in order to evaluate the impact of process parameters on increased solid content after adding spent grain into pot ale (1:5, by wet weight). Design matrix with the corresponding responses is given in
Table 8. A similar range of CH
4 generation was seen with the previous design for AD of pot ale. The highest biogas quality and quantity were obtained with the std. no. 12 as 55 ± 0.4% CH
4 in 360 ± 10 mL/g vs. biogas. Moreover, the final pH value for this particular sample was maintained within the neutral areas, whereas it dropped around the level of 5.5 for the other samples.
The percentage removal of COD, BOD, and SO
4 due to bacterial activity is given in
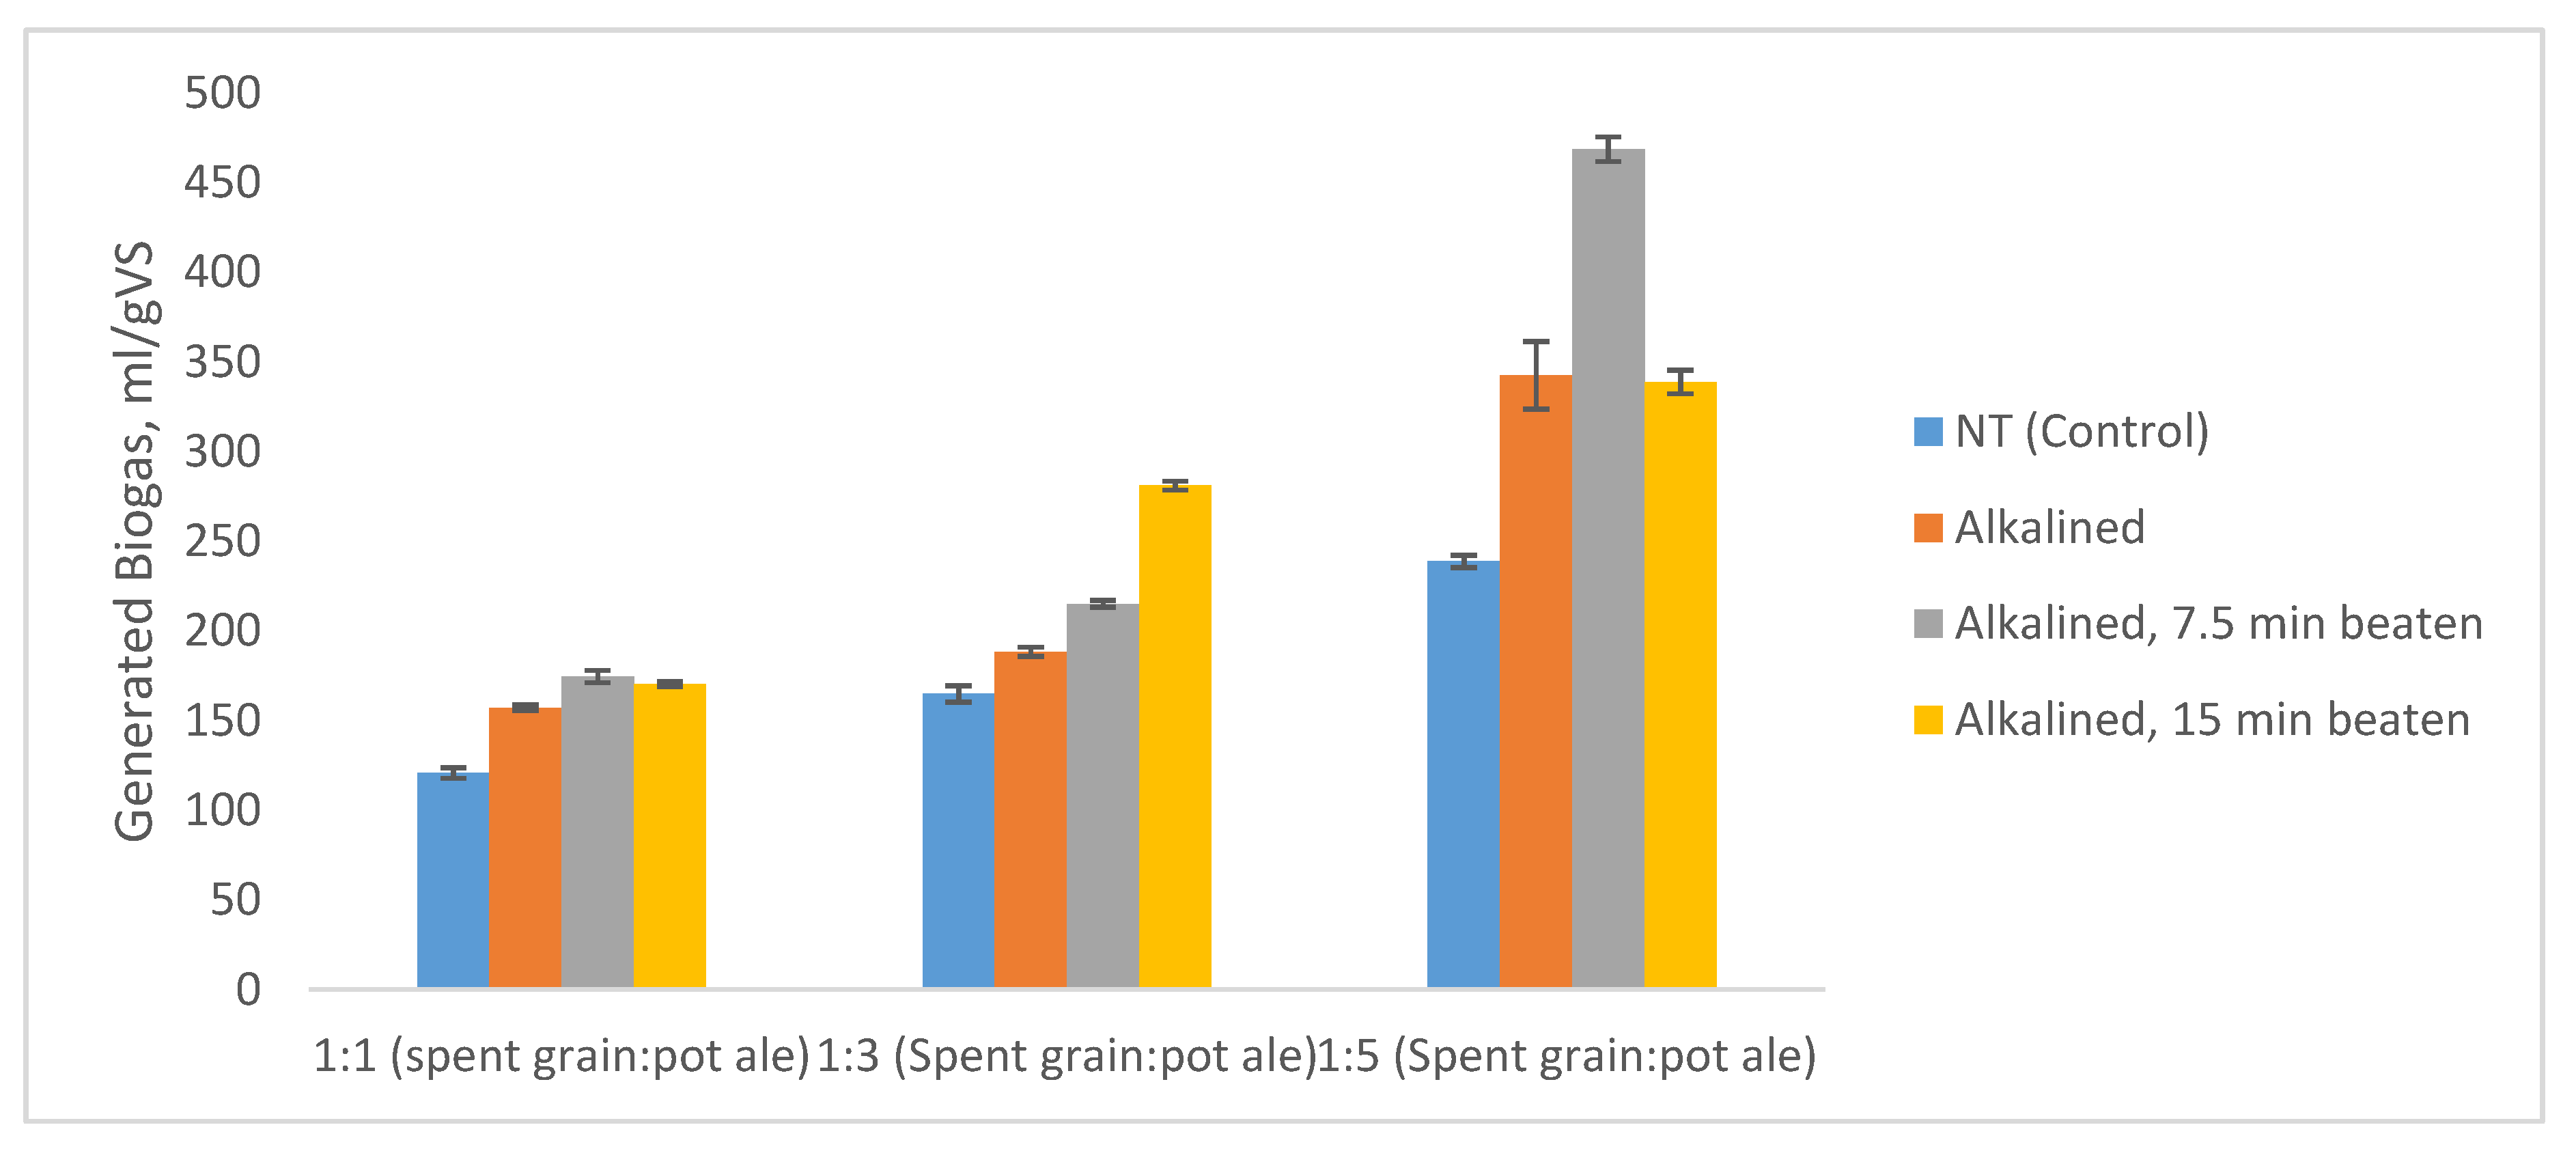
Table 9. The experiments performed with 10% and 30% sludge resulted in low COD and BOD removal percentage levels regardless of the application of the pre-treatments, correspondingly low levels of biogas yields were seen in those samples. Pre-treatments, however, had a significant impact on biogas quality for the same samples i.e., the std. no. 1,2 and 5,6 in (
Table 8), CH
4% increased 2- and 5-fold over due to the effect of 15 min beating pre-treatment, respectively. It can be explained by, in early stage of anaerobic digestion, the extended active surface area on solid material in the reactors stimulated microbial activity which resulted in higher CH
4 generation. However, the availability of large amounts of fresh feedstock caused imbalanced reaction rates, sequentially sharp pH drops inhibitory level in particular for the acetoclastic methanogens. The percentage of sulphate removal was found to be significantly higher for the samples seeded with 10 and 30% sludge, which also indicating higher activity of sulphate reducing bacteria with regard to methanogenic bacteria. Moreover, excessive H
2S production levels (reaching beyond the sensor range >10 000 ppm) in the samples contain 10 and 30% sludge supported the same statement.
Significantly higher COD and BOD removals were achieved with the samples seeded with 50% sludge along with the lower SO
4 removals (
Table 9) in comparison to the lower sludge seeding ratios. In case of std. no. 7 and 8, 15 min beating pre-treatment resulted in a significant rises in both biogas yield (from 207 ± 19 to 279 ± 11 mL/g VS,
p: 0.0093) and quality 28.0 ± 2.1 to 48.5 ± 2.3% (
p: 0.0008) CH
4 due to higher COD and BOD removals (
Table 9). Moreover, the std. no. 8 had lower H
2S production (
p: 0.0030) than 7 because of 9% less SO
4 reduction (
Table 9). Different digestion temperatures were seen to significantly influence biogas production and CH
4 content (std. no. 11 and 12,
Table 8). The digestion at 38 °C increased the biogas generation yield from 258 ± 8 to 360 ± 10 mL/g vs. and the percentage, because of higher COD, BOD removals which are given in
Table 9, the of CH
4 from 29.3 ± 2.1 to 55.0 ± 0.4 with respect to the digestion at 35 °C. Furthermore, likewise in the std. no. 8, a lower H
2S production was achieved with experiment no. 12 along with lower SO
4 removal percentages (
Table 9).
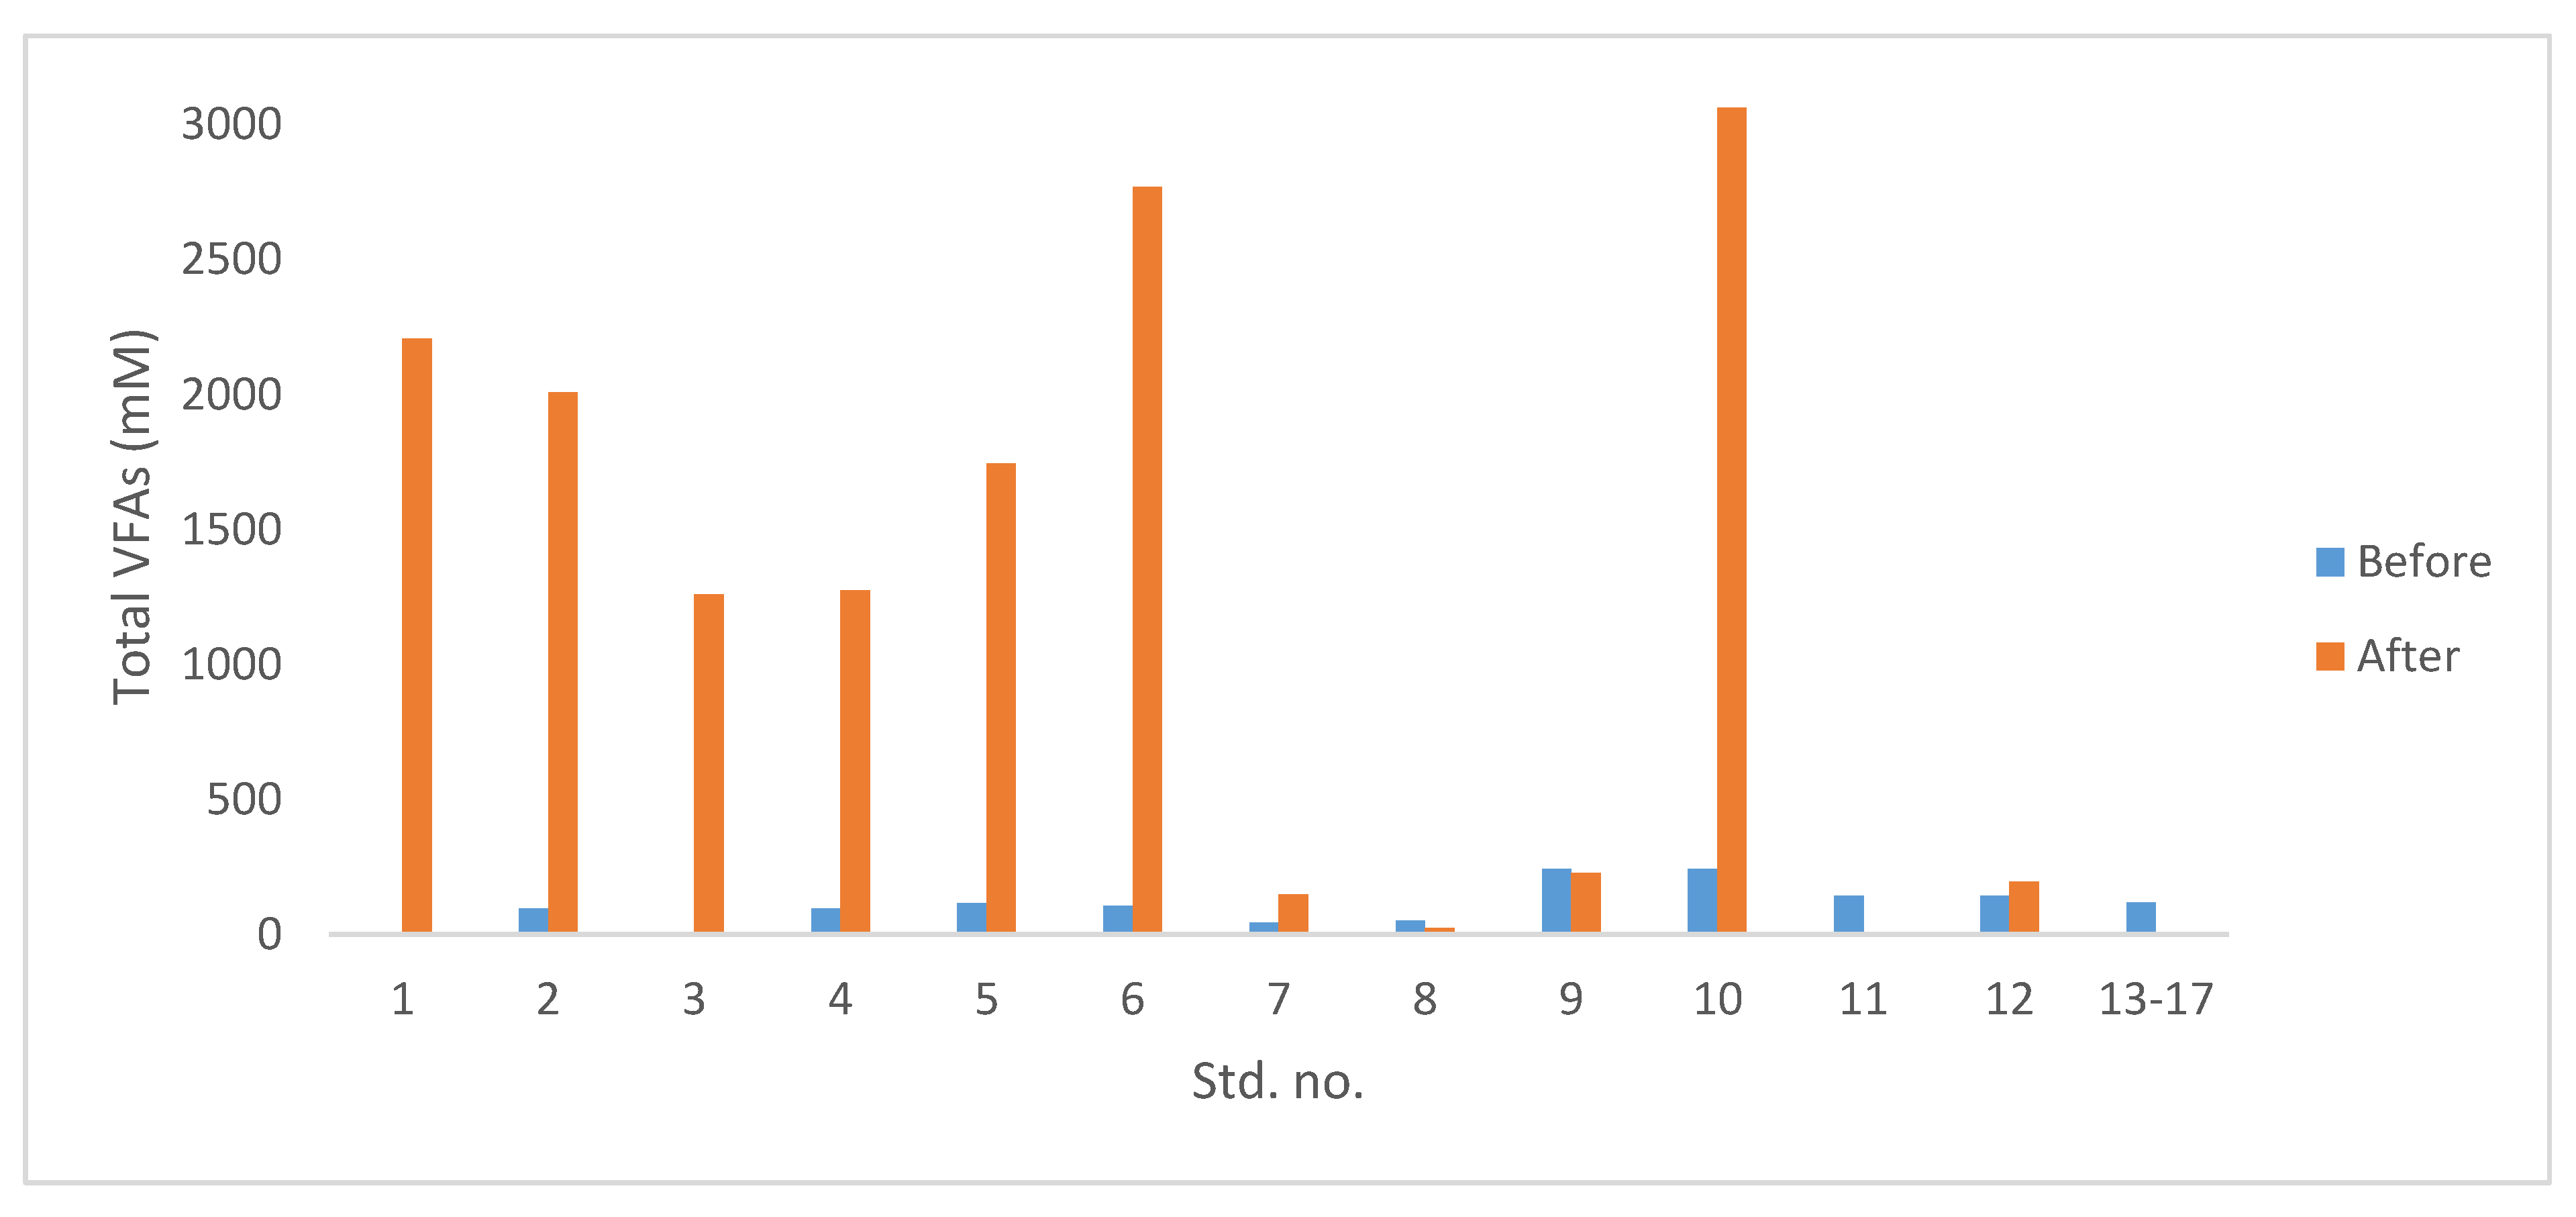
Results of the VFA analysis of pot ale spent grain mix before and after anaerobic digestion is given in
Figure 5.Although total VFA concentration of all samples after AD was so much higher than the initial corresponding values, samples which were seeded with 50% sludge (sample nos. 7,11 in
Figure 5) had the lowest final total VFAs values indicating that these particular samples were not affected by the VFA inhibition as much as the others [
59]. Therefore, their biogas yields as well as methane percentage of the produced biogas is significantly higher than the samples seeded with lower sludge (
Table 8). AD of pot ale spent grain mix have much higher final VFA concentration than pot ale alone even though the same design factors are applied for both feedstock types. This is attributed to higher impact of the lack of internal agitation within the system for AD of the mixed compounds, since it has higher solid content. In other words, microbes are physically blocked to reach spent grain which lead a competition for limited amount of pot ale as the feedstock.
3.3. Mathematical Model Estimations
The mathematical models were statistically analysed by ANOVA (using the coding format given in
Table 10) and the summary of analysis is given in (
Table 11 and
Table 12), (
Table 13 and
Table 14) and (
Table 15 and
Table 16) for biogas production, CH
4 and CO
2% for AD of pot ale, and spent grain and pot ale co-digestion respectively. For each experiment, developed models achieved an adequate fit with produced data within the identified significance threshold since the value of lack of fit was <0.05 for all models except for biogas generation by AD of spent grain and pot ale mix <0.1. In other words, estimated model on biogas production by AD of spent grain and pot ale had no significant lack of fit within 90% confidence interval, whereas the confidence interval is 95% for all other models. Furthermore, the values of R
2, adjusted R
2 (Adj. R
2) and predicted R
2 (Pred. R
2) were close to 1 for all models indicating a sufficient regression for the models, plus the difference between the adjusted R
2 (Adj. R
2) and predicted R
2 (Pred. R
2) was less than 0.2. An adequate precision value greater than 4 indicates adequate model discrimination [
60] achieved here in all cases. Mathematical models were built based on actual and coded factors allowing to plot different design factors with different units in the same graph to compare their individual effects on the response of interest.
For biogas yield, the first and the second order of sludge percentage (C, C
2) were significant parameters regardless of feedstock type according to ANOVA. In case of AD of pot ale the first and second order of the beating time (A, A
2) was found to be a significant parameter (
Table 11) whereas in case of AD of spent grain and pot ale temperature (B) the interaction between temperature and sludge percentage (BC) were the significant factors (
Table 12).
Final equations showed the biogas generation (Y) as a function of the independent variables in terms of coded and actual factors on biogas production by AD of pot ale and spent grain and pot ale mixture given in Equations (2) and (3) and Equations (4) and (5) respectively.
The coefficients of the final equation in terms of coded factors (Equations (2) and (3)) indicates the power of the design parameters on biogas generation as C > C2 > A2 > A and C > C2 > BC > B for AD of pot ale and spent grain pot ale mixture.
ANOVA results for CH
4% modelling, showed the digestion temperature (B), the first and second order effects of sludge (C, C
2), as well as interaction between temperature and sludge percentage (BC) as significant parameters for AD of pot ale in 95% confidence interval (
Table 13).The beating time (A), first and the second order effects of temperature (B, B
2) and sludge% (C, C
2), as well as the interaction effect of temperature and sludge percentage (BC) were the significant model terms for AD spent grain and pot ale mixture (
Table 14). Influence strength of the significant parameters on CH
4 concentration within the biogas generated by AD of pot ale and pot ale and spent grain mixture was identified as C > C
2 > BC > B and C > C
2 > BC > B > A > B
2 respectively by considering coefficient of the final equation in terms of coded factors Equations (6) and (7). The final models in terms of actual factors are given in Equations (8) and (9) for AD of pot ale and AcoD of spent grain and pot ale mixture respectively.
For modelling CO
2 concentrations, ANOVA analysis defined the second order effect of sludge% (C
2) and the interaction between temperature and sludge percentage (BC) as significant model terms within a 95% confidence interval for AD of pot ale (
Table 15). The first order effects of temperature (B) and sludge% (C) were added to the model by the software to support hierarchy. The first and second order effects of sludge percentages (C, C
2) were the significant parameters for CO
2 modelling by AD of spent grain and pot ale mixture (
Table 16). However, temperature (B) and the interaction effect of temperature and sludge% (BC) were also added to the model after the stepwise regression to improve the model by the software. The strength of the model terms on CO
2 content of generated biogas by AD pot ale and spent grain pot ale mixture was defined as C
2 > BC > B >C and C
2 > C > BC > B based on the coefficient of the final equation in terms of coded factor (Equations (10) and (11)). The final mathematical models on CO
2 content of produced biogas are given in Equations (12) and (13).
3.4. Validation of the Estimated Models
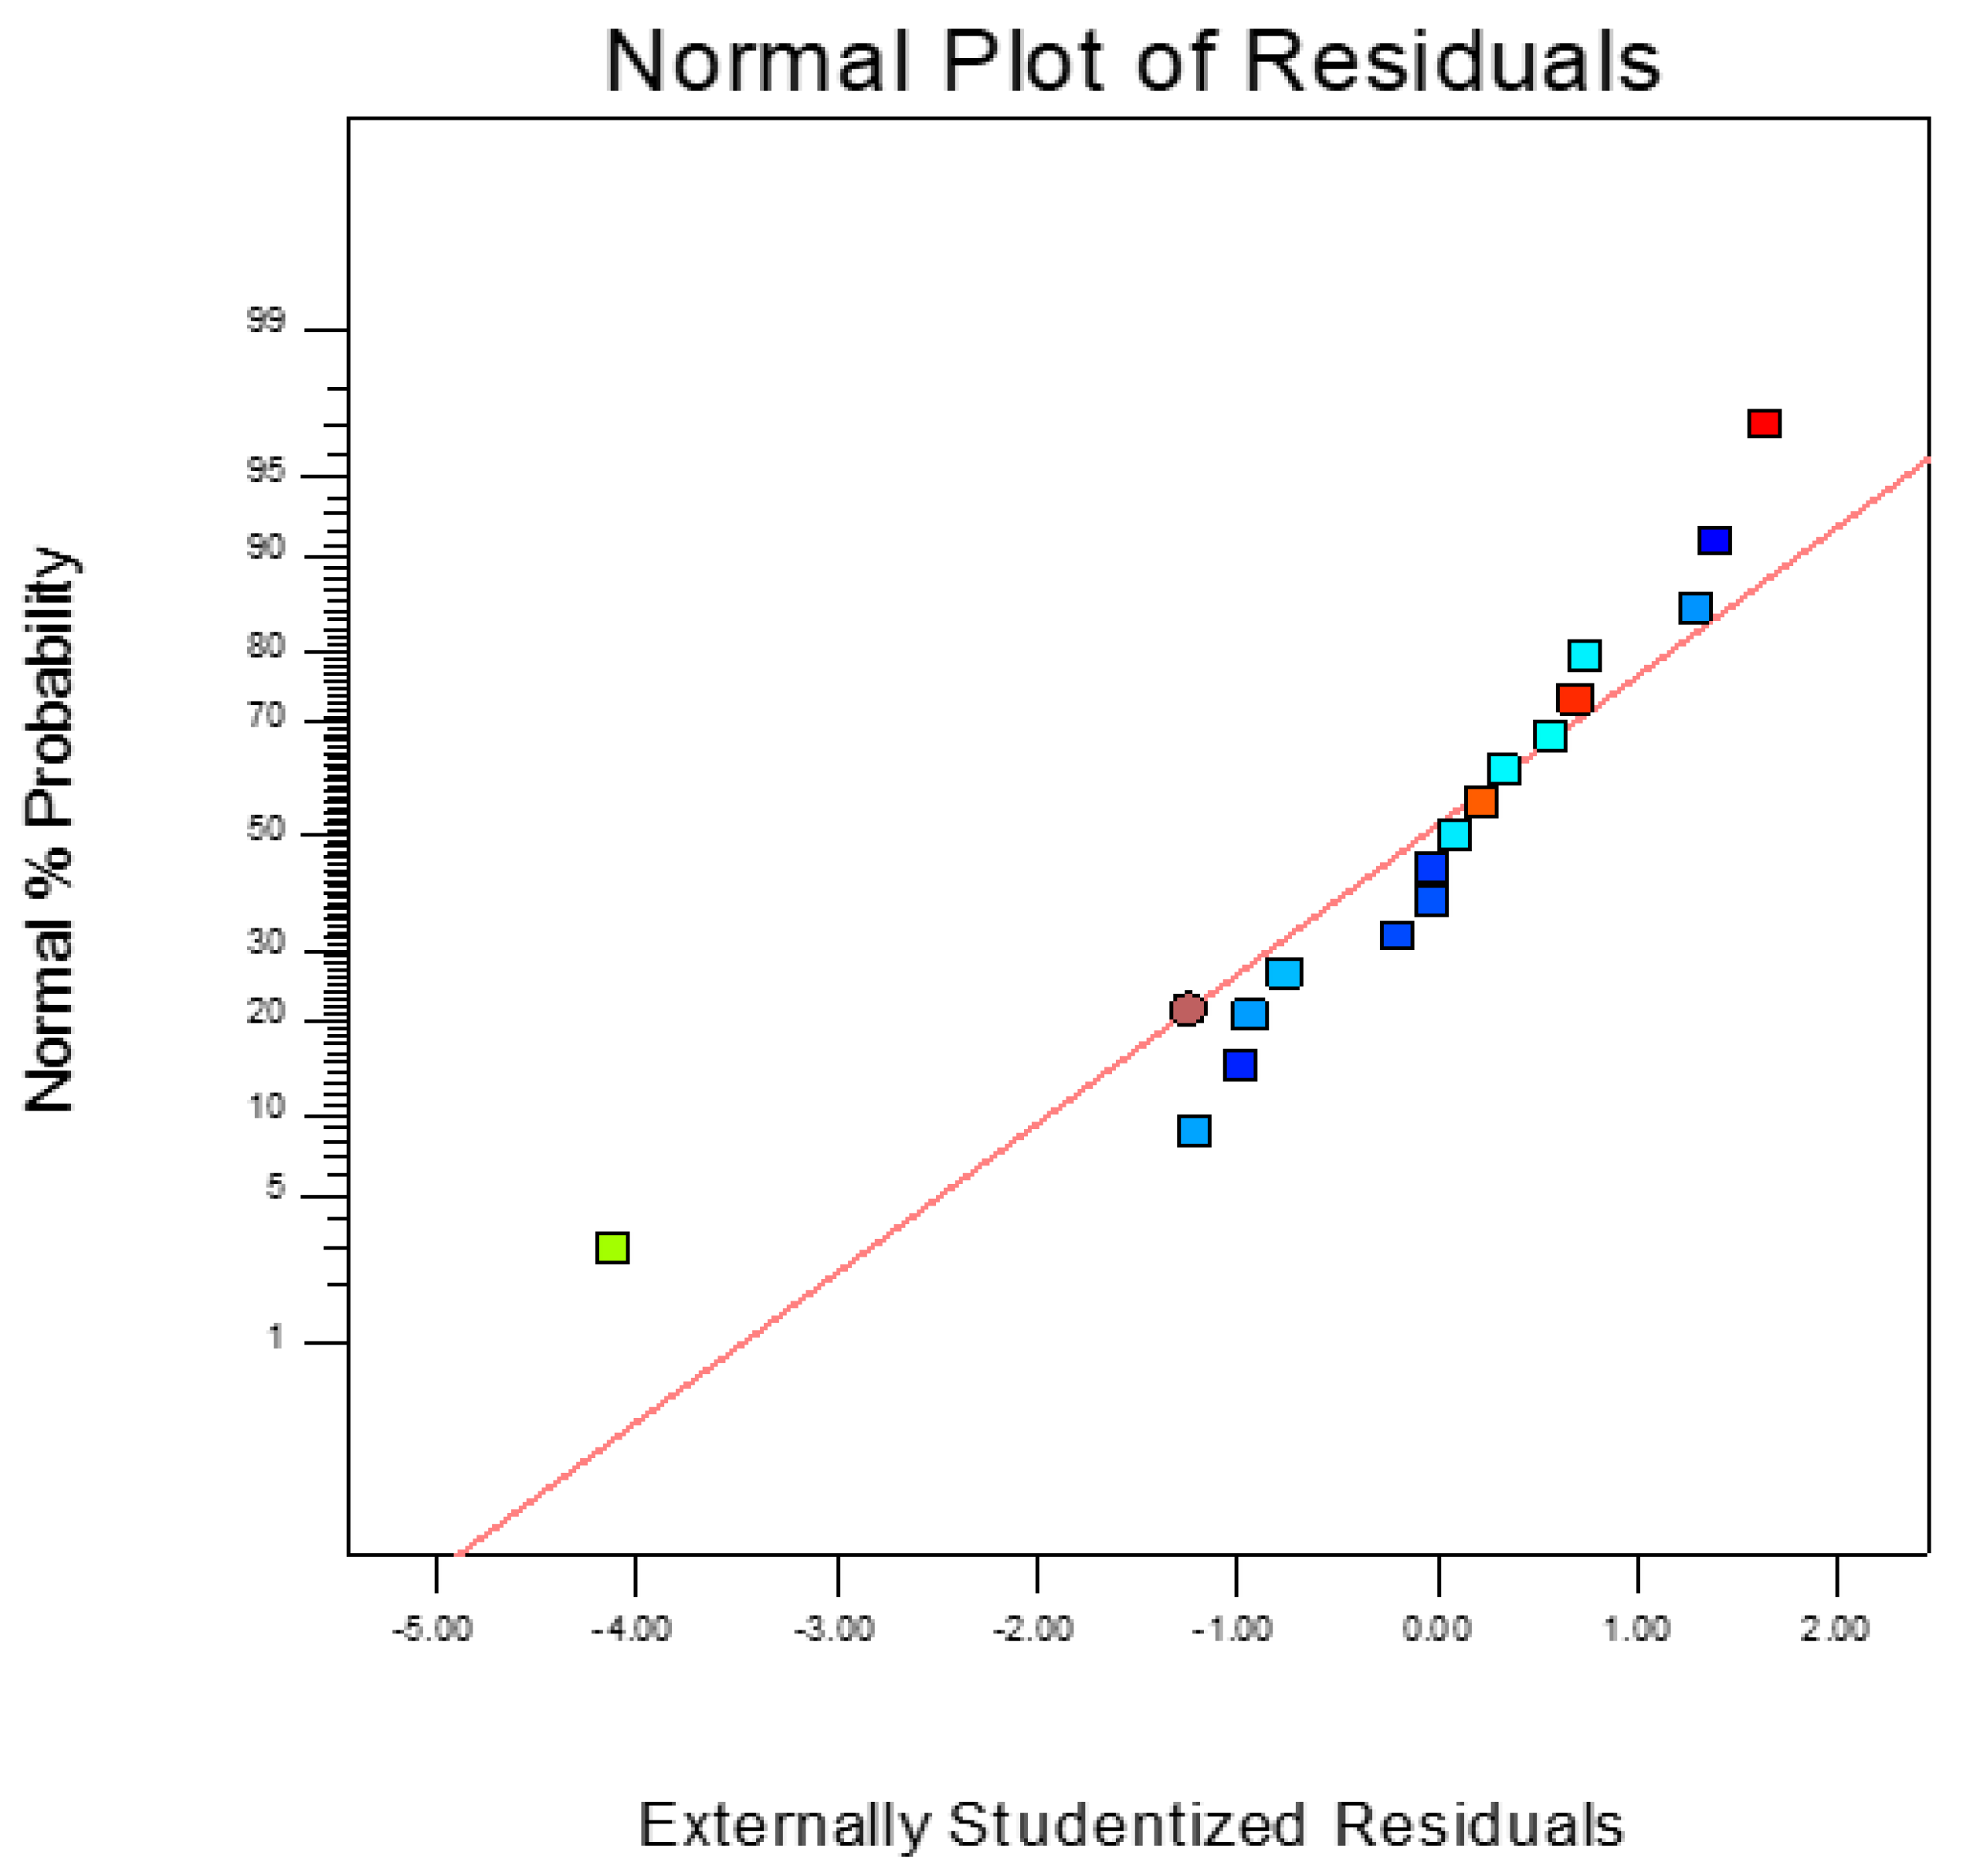
The diagnosis of the estimated models was performed by the same software as part of the post statistical analysis. The diagnostic plots, the normal plot of residuals and the predicted vs. actual plot for AD of pot ale, are given in
Figure 6 and
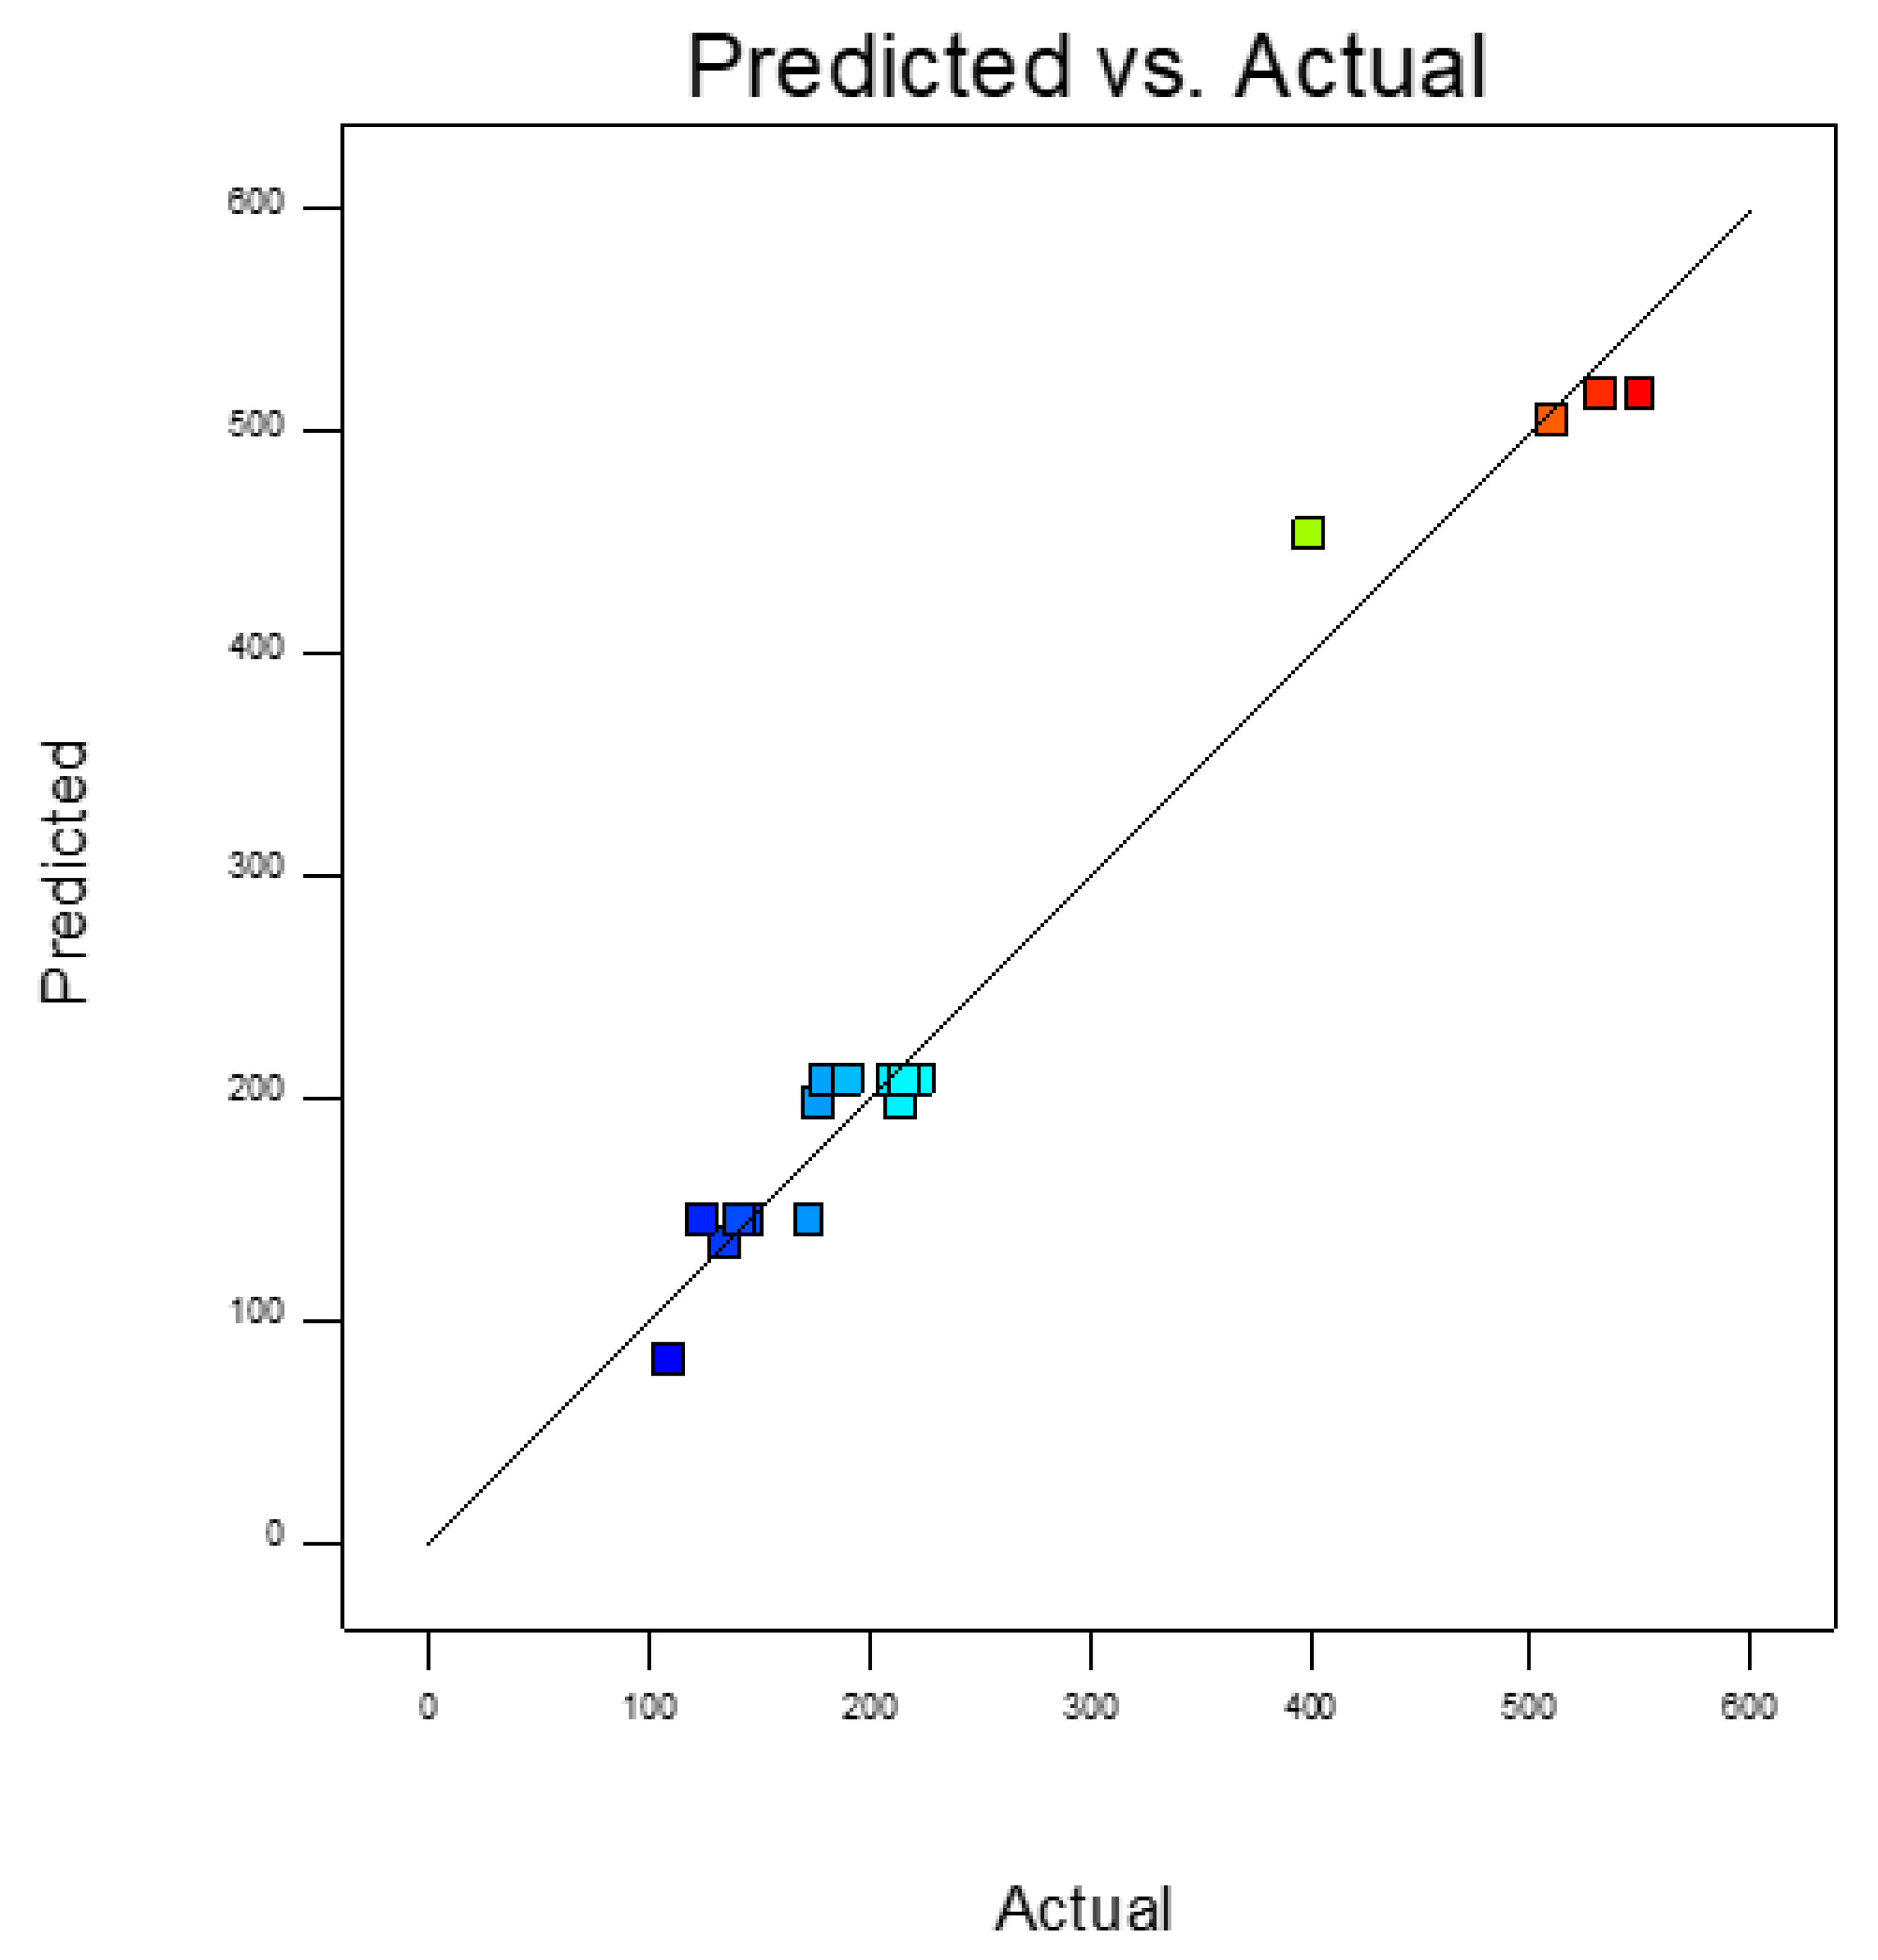
Figure 7 respectively.
The normal distribution of residual data in
Figure 6 proves that ANOVA can be applied to the dataset.
Figure 7 gives the comparison between the actual data set and the predicted data set by developed model. It is seen that the residuals are minimum since all the design points tend to be close to the diagonal line. The developed mathematical model is therefore adequate. The similar trend in both normal plot of residuals and actual vs. predicted plot is seen for the built models on CH
4 and CO
2 percentages for AD pot ale as well as all models developed for AD of spent grain and pot ale mixture.
In addition to post analysis, the models were challenged by independent experiments for a further validation step. Three validation points for validating the models on AD of pot ale and two validation points for validating models on AD pot ale and spent grain (which were not used for model development) were decided and the results of the experiments were given in
Table 17 and
Table 18 respectively along with the predicted values by the models in terms of actual factors for each interest of response. The Equations (4), (8), and (12) were used to predict the results, given in
Table 17, of the validation for biogas yield, CH
4% and CO
2% by AD of pot ale respectively. Likewise, the Equations (5), (9), and (13) were used for the predictions, given in
Table 18 on biogas yield, CH
4% and CO
2% respectively though AD of spent grain and pot ale mix. The difference between the predicted and the experimental results were then statistically analysed by
t-test (2-tailed distribution with unequal variance). The modelling of the biogas quality and the quantity was validated for both designs within a 95% confidence interval in accordance according to the
p-values in
Table 17 and
Table 18.
3.5. Model Graphs
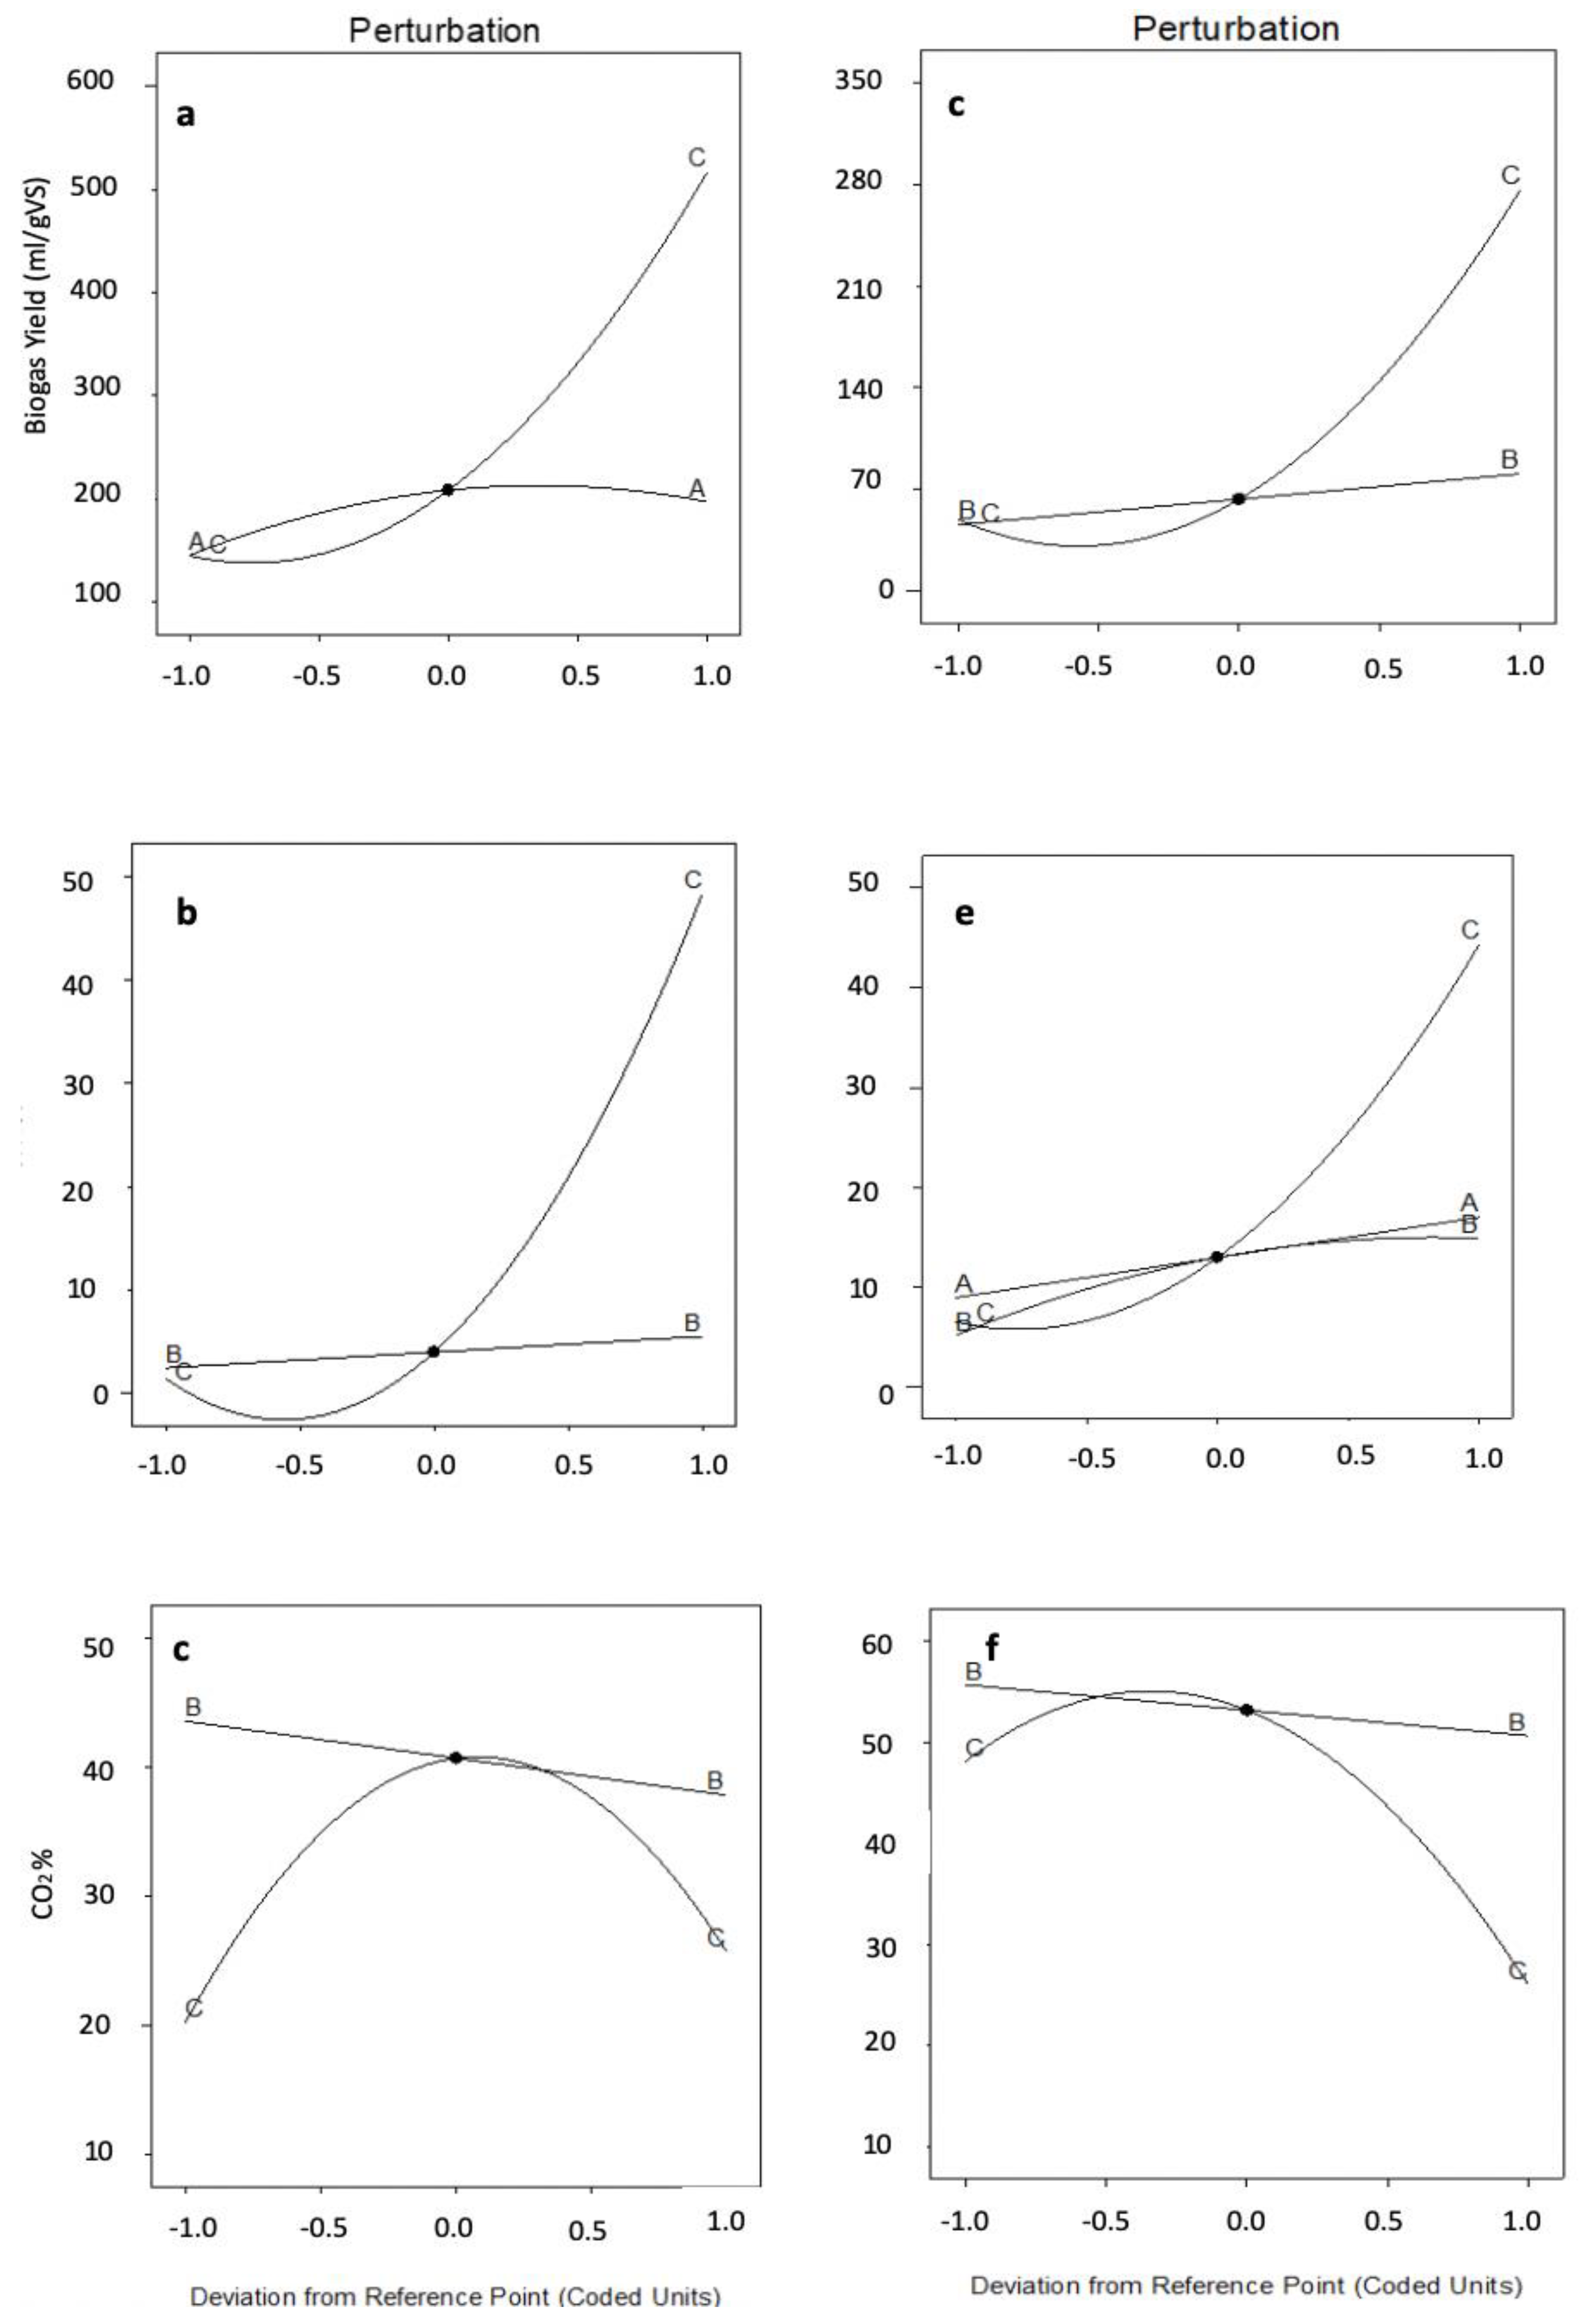
The perturbation plots give the effect of all factors, which have different units, on the same graph since it is plotted in terms of coded factors. The lines show the individual behaviour of each factor while keeping the other at a constant ratio (their centre points by default). It can be used to identify which factor affects the response of interest the most.
Figure 8a–c and d–f shows the perturbation graphs for biogas yield, CH
4% and CO
2% for AD of pot ale and AcoD of spent grain pot ale mix respectively. In both cases, the curvature related to the sludge percentages (C) showed that this factor had a greater impact on the response than the beating time (A) and the digestion temperature (B). Although results were different, the digestion temperature (B) and the sludge ratio (C) had similar effects on CH
4% and CO
2% for both DOE experiments (
Figure 8b,e) and
Figure 8c,f respectively.
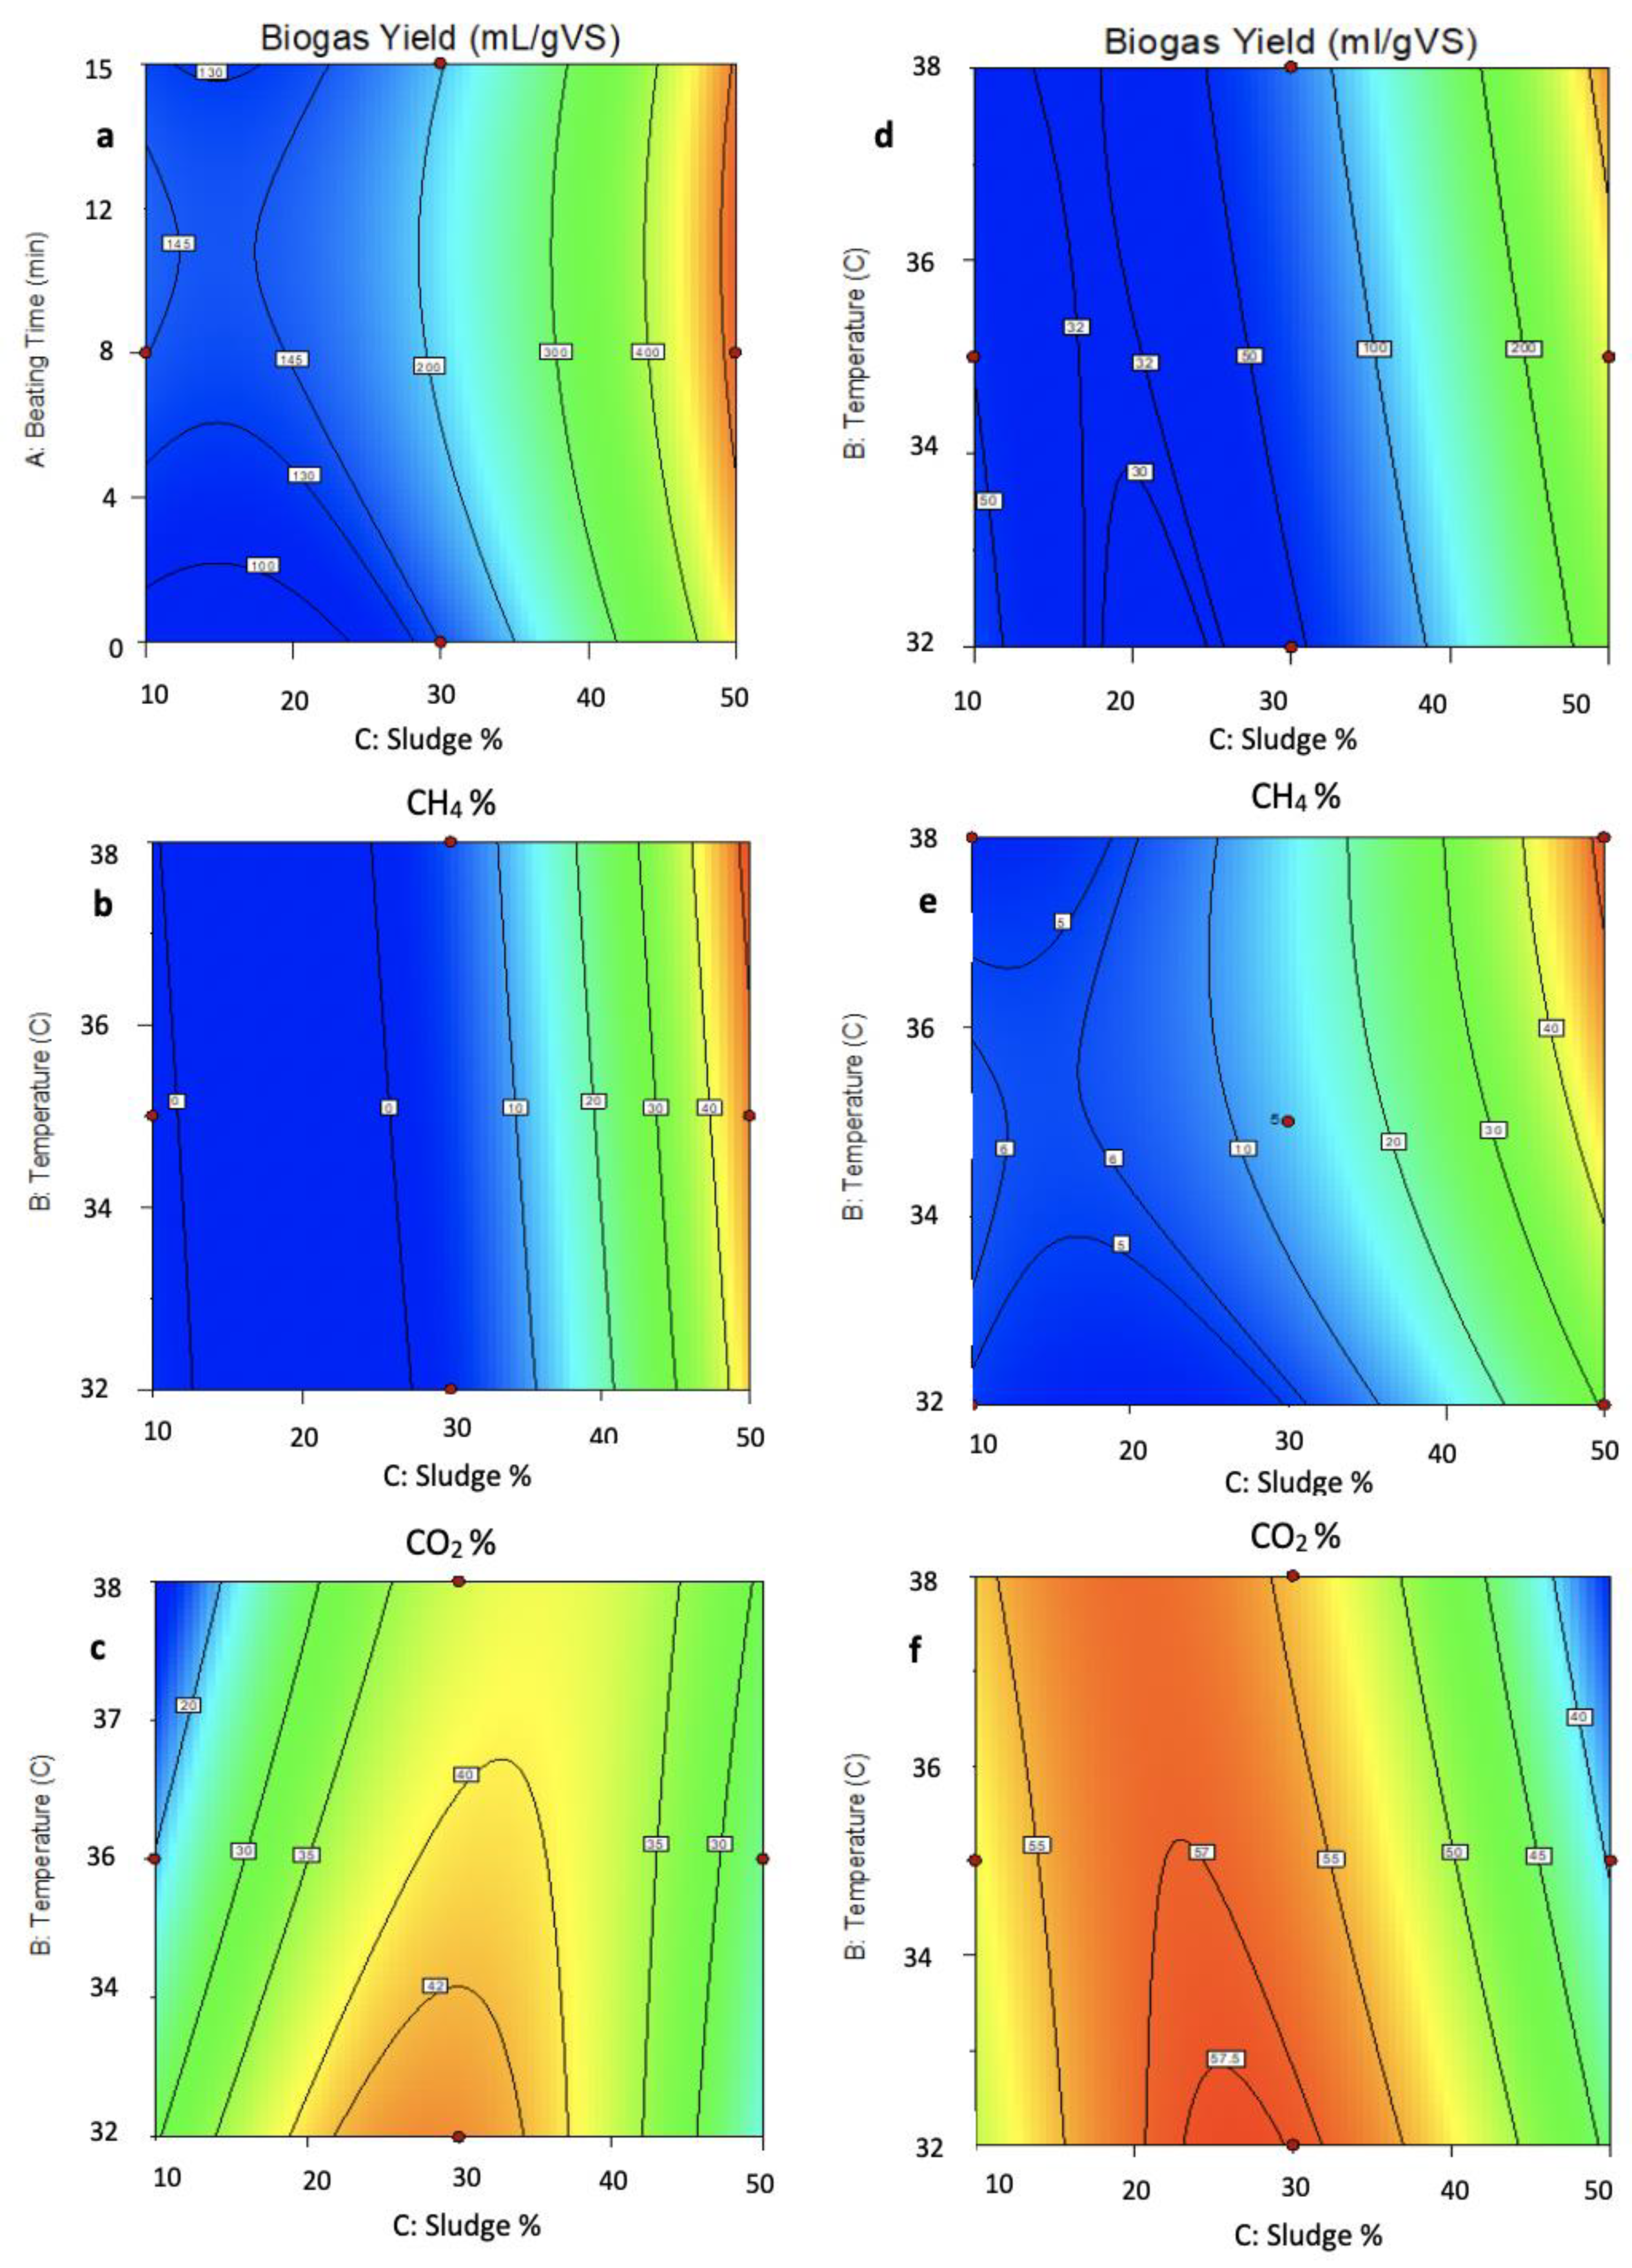
Figure 9a–c and d–f give the contour graphs for biogas yield, CH
4% and CO
2% for AD of pot ale and AcoD of spent grain pot ale mix respectively. The effects of temperature and sludge percentages mainly have straight lines on all responses. However, a peak was seen for the area around 20–30% sludge for biogas yield, CH
4 and CO
2% for AcoD of spent grain and pot ale (
Figure 9d–f) as well as CO
2% of the biogas produced by AD of pot ale (
Figure 9c). In both experiments, the greatest biogas generation and the highest CH
4 percentage are achieved under the condition of higher sludge seeding ratio and digestion temperature, while the same conditions resulted in lower CO
2%.
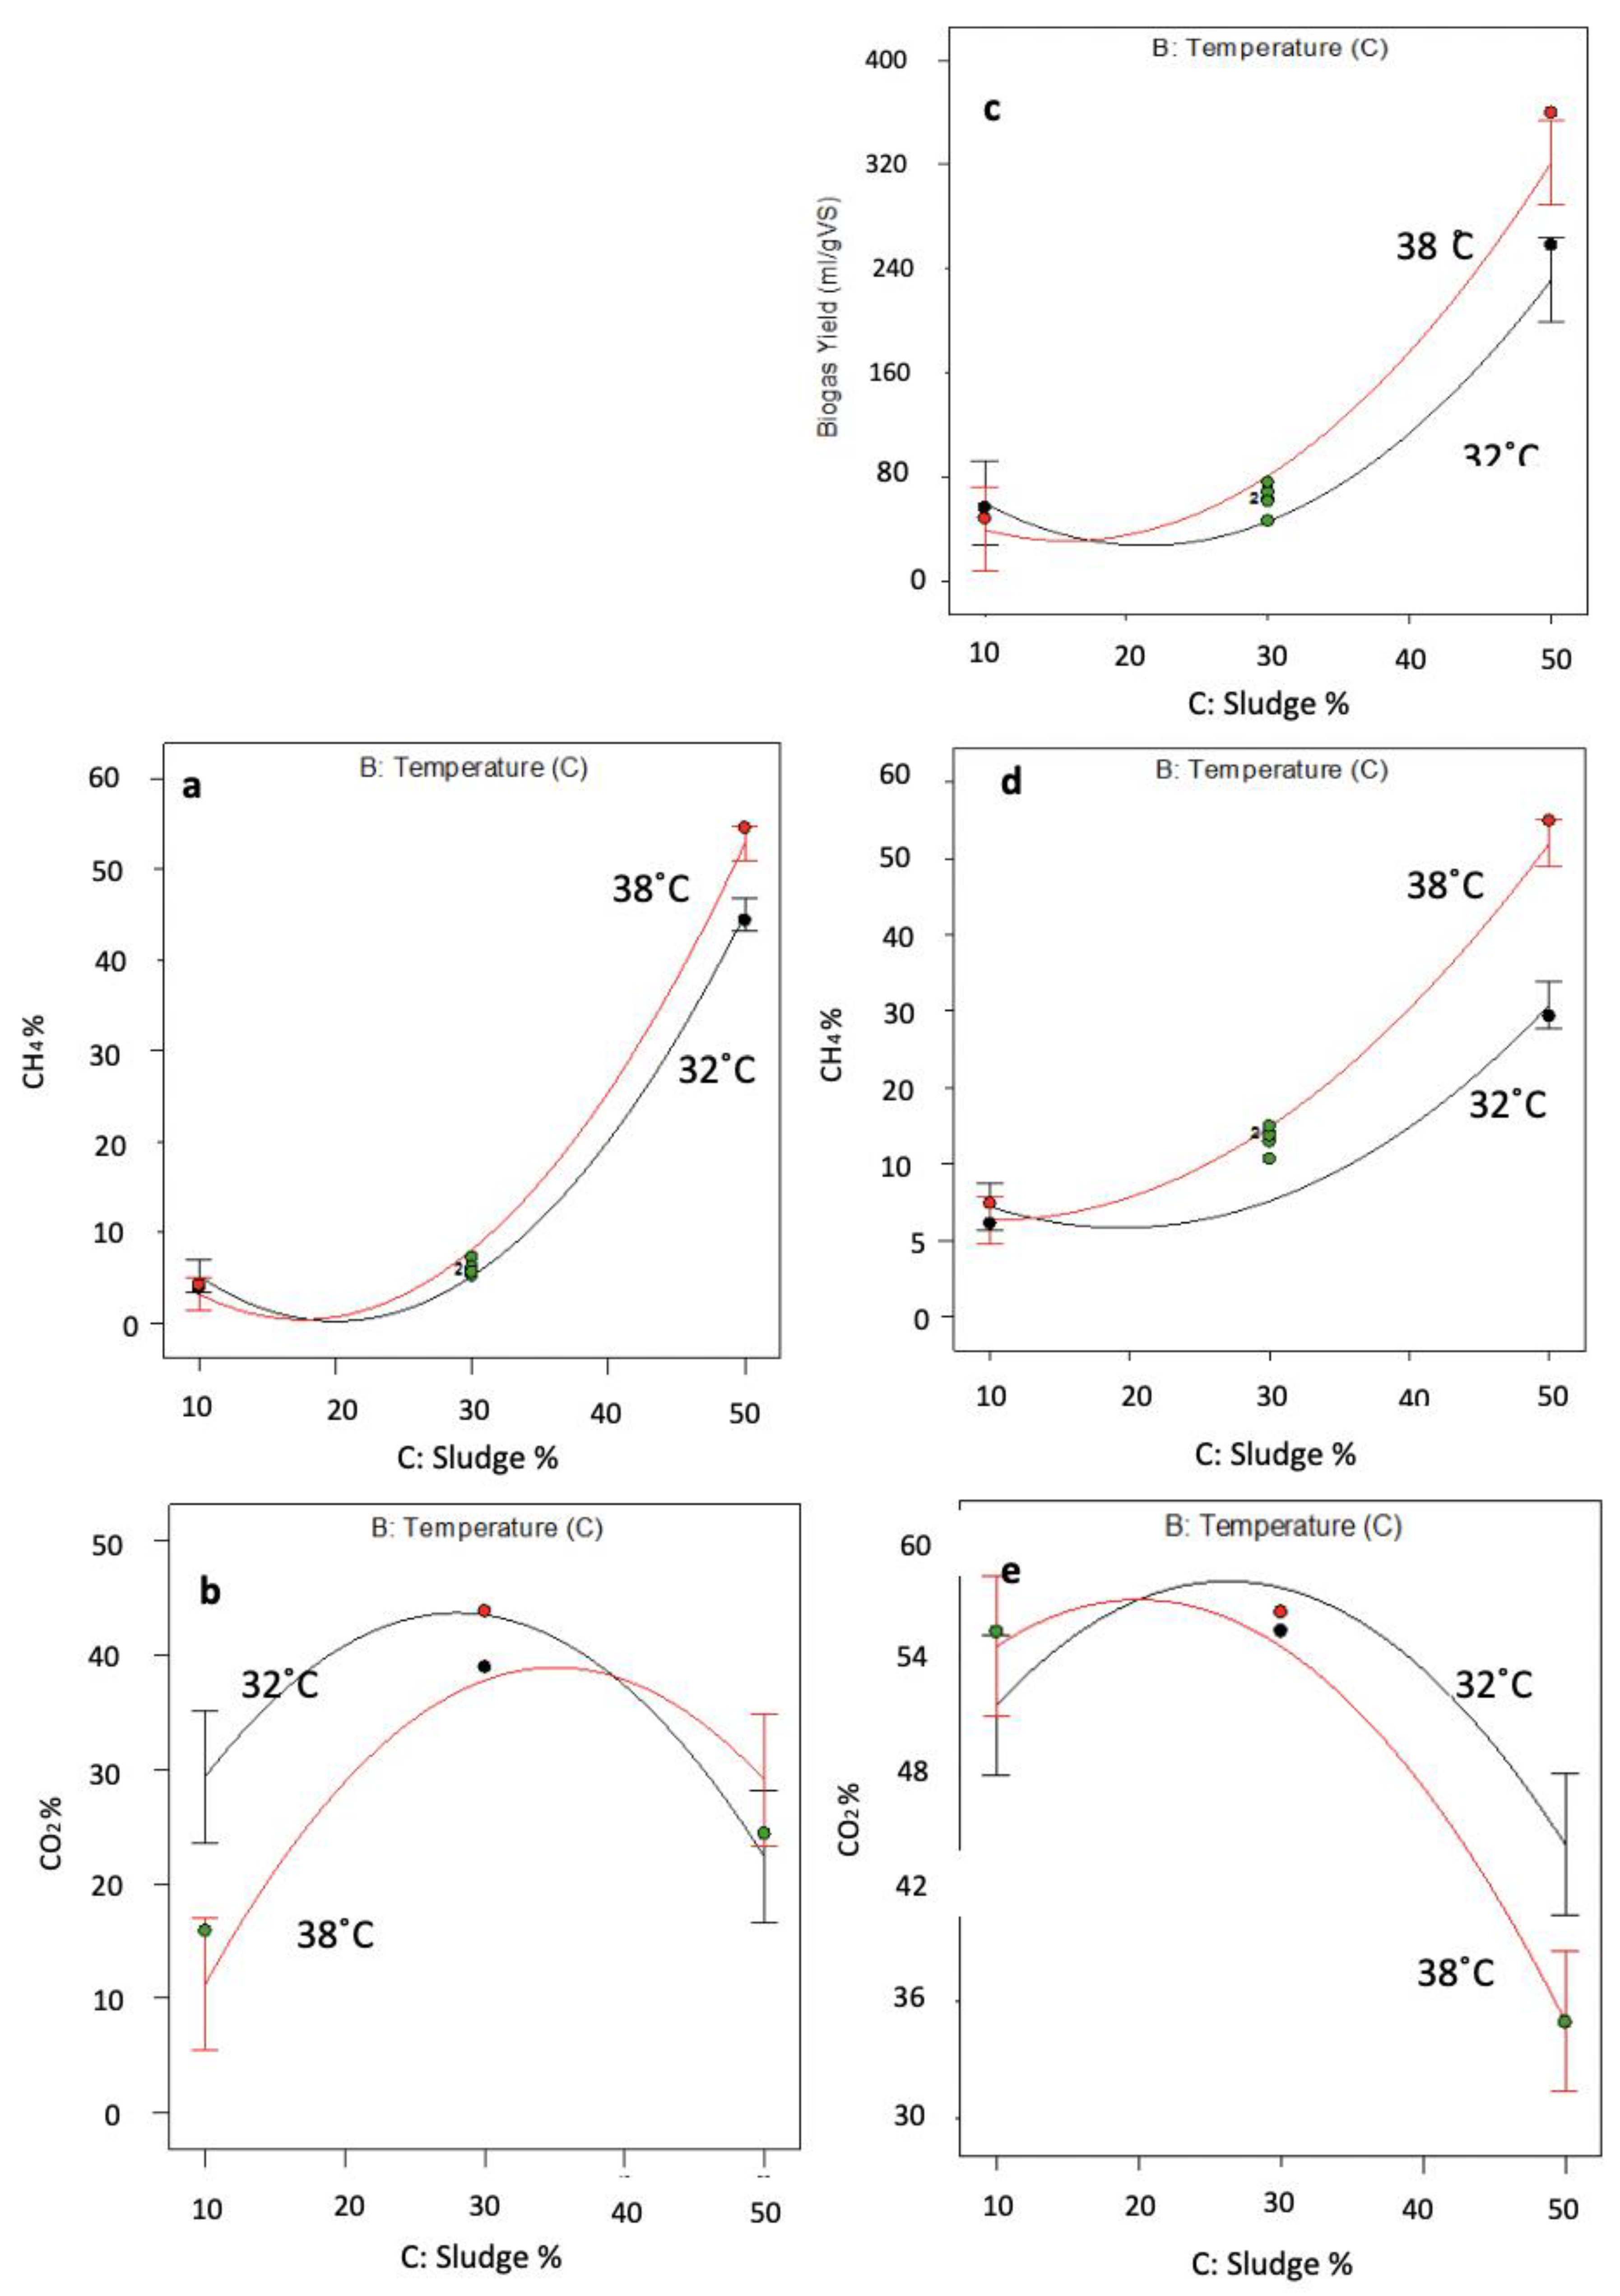
There was no interaction between the factors for the model developed on biogas yield for AD of pot ale. The interactions between the sludge percentages and the digestion temperatures for the quality of biogas produced by AD of pot ale is given in
Figure 10a,b along with the interactions for biogas yield CH
4 and CO
2 percentages for AcoD for spent grain pot ale. The digestion temperature had no significant influence at low sludge seeding ratios (<20%). However, once the sludge ratio was increased, the digestion at 38 °C has significantly increased the biogas production by AcoD of spent grain and pot ale and its CH
4 content (
Figure 10c,d) as well as the biogas quality of AD of pot ale (
Figure 10a). In contrast, a completely opposite interaction was seen on CO
2 contents of the biogas produced by AD of pot ale and AcoD of spent grain pot ale mix. Digestion at 38 °C had a significantly lower CO
2% within the biogas produced by AD of pot ale (
Figure 10b). However, the effect of digestion temperature on it became insignificant once the sludge seeding ratio is increased. An opposite figure was seen on CO
2 content of for AcoD of spent grain pot ale (
Figure 10e).

 ,
, 


