1. Introduction
The Internet of Things (IoT) connects objects such as sensors, smart devices, appliances and other everyday items between them and with people to realize novel functionalities [
1,
2,
3]. IoT applications cover a broad spectrum of domains, e.g., smart homes and smart cities [
4,
5,
6,
7], smart monitoring [
8,
9,
10,
11,
12], healthcare [
13,
14,
15], and industrial automation [
16,
17,
18,
19,
20]. The heterogeneity of the IoT scenarios results in a large spectrum of wireless communication technologies that are candidate to be adopted and fulfill the different objectives of the diverse IoT applications [
21,
22]. Among them, there are short-range low-power technologies, such as Radio-Frequency IDentification (RFID) and Bluetooth Low Energy (BLE) [
23,
24,
25,
26], some amendments to the IEEE 802.15.4 and the IEEE 802.11 standards for Industrial IoT [
27,
28,
29,
30], cellular networks [
31,
32], and Low Power Wide Area Networks (LPWANs). In particular, LPWANs are an attractive option for those IoT applications that do not need high throughput, but require to connect low-cost devices over a wide coverage range with low power consumption [
33]. Thanks to their ability to connect a large number of nodes spread over wide areas, LPWANs are a suitable alternative to cellular networks and a nice complement to short-range ones [
34,
35,
36,
37,
38].
One of the LPWAN standards is the Long Range Wide Area Network (LoRaWAN) [
39], which on top of the Long Range (LoRa) modulation [
40] defines a network architecture and a protocol stack that offer connectivity at low cost and low power consumption, mobility support, and network reconfiguration [
41,
42,
43,
44,
45].
LoRaWAN is a LPWAN protocol that is gaining ground, as it supports wide communication ranges using a low-cost network infrastructure consisting of low-power devices. However, as LoRaWAN implements single-hop LoRa-based transmissions, it is not possible to set the LoRa modulation parameters so as to achieve wide coverage with relatively high bit rates. Due to this LoRaWAN limitation, a number of novel medium access strategies and routing protocols for LoRa-based networks were proposed [
46,
47,
48,
49,
50]. Some of them, i.e., the ones presented in [
49,
50] leverage the Software-Defined Networking (SDN) paradigm to realize priority-based traffic management and load balancing [
51,
52].
Depending on the geographical region in which the LoRaWAN devices work, both the medium access strategy and the configuration of the parameters vary [
53].
In particular, in Europe, according to the European Telecommunications Standards Institute (ETSI) regulations, two different channel access methods are allowed, i.e., a Pure ALOHA approach with duty-cycle limitations and a polite spectrum access method based on Listen Before Talk (LBT) Adaptive Frequency Agility (AFA). In particular, the LoRaWAN specification [
39] only refers to the duty cycle limitations, while the LoRaWAN regional parameters document [
53] clarifies that an LBT AFA Medium Access Control (MAC) strategy can also be adopted. Several works in the literature proposed and assessed LBT-based medium access control protocols for LoRaWAN [
54,
55,
56,
57,
58]. However, to the best of our knowledge, none of them provides an extensive performance evaluation of a LoRaWAN network in which the nodes use an LBT AFA approach and work in compliance with the ETSI regulations [
59,
60].
This paper presents an assessment that provides quantitative insights on the performance that can be obtained by using LBT AFA in several scenarios by varying the number of LoRaWAN nodes and the MAC parameters.
The methodology of the presented assessment is of general validity and can be useful to the network designer in the network configuration phase to properly select the MAC parameters based on the application requirements of the network under consideration.
The structure of the paper is the following.
Section 2 overviews related works, while
Section 3 recaps the main LoRaWAN features.
Section 4 describes the LBT AFA MAC protocol.
Section 5 presents the simulation results obtained using the Objective Modular Network Testbed in C++ (OMNeT++) simulation framework varying the MAC parameters of an LBT-based protocol and discusses their impact on the protocol performance.
Section 6 provides a comparative discussion between the findings of this work and the ones of relevant works. Finally,
Section 7 summarizes the paper and gives hints for future work.
2. Related Work
As it was mentioned in
Section 1, LoRaWAN supports two kinds of random MAC protocols [
61], i.e., Pure ALOHA and channel access strategies based on LBT AFA, respectively. Previous works [
62,
63,
64] compared the performance of approaches based on ALOHA and that of LBT-based ones, but, differently from this work, they do not provide extensive assessments of LBT AFA with different MAC configuration parameters.
Several uncoordinated MAC protocols for LoRaWAN similar to the standard ones were proposed and evaluated in the literature. In particular, some of them are based on Slotted ALOHA [
65,
66], while other ones propose medium access strategies based on LBT [
54,
55,
56,
57,
58,
63,
64,
67].
Table 1 provides a qualitative comparison among some of the above mentioned related works. In particular, the first row refers to the compliance with the current ETSI regulations. The second row gives the number of nodes in the considered scenarios. The third row indicates if the assessment is performed varying some MAC parameters, while the fourth row refers to the support for mobile nodes. The fifth row specifies the adopted evaluation method, i.e., analytical (an.), simulative (sim.) or experimental (exp.). Finally, the sixth and seventh rows indicate if the message loss/delivery ratio and the delay are evaluated, respectively.
The work in [
62] presents a simulative performance assessment of a Pure ALOHA and an LBT AFA protocol in a LoRaWAN network with a varying number of nodes (up to 200) under different workload conditions. The comparative evaluations refer to the percentage of lost messages. The results obtained in [
62] show that LBT AFA obtains better results than Pure ALOHA with higher traffic generation rate. For instance, under an exponentially distributed message generation pattern with mean between 15 s and 60 s for stationary nodes and between 5 s and 20 s for mobile nodes, LBT AFA improves the message loss ratio value by 1.40% to 2.47% on Pure ALOHA. The reason for the message loss ratio improvement is that, whenever the channel is found busy, LBT either exploits an AFA mechanism or waits for a backoff delay before retrying the transmission, thus reducing the message loss. Conversely, with Pure ALOHA each node transmits without performing any Clear Channel Assessment (CCA), i.e., without sensing the channel. As a result, a number of messages can be lost due to collisions. Under lower traffic conditions than those described before, instead, the performance of Pure ALOHA and LBT AFA are similar.
The work in [
54] focuses on LBT and compares four different LBT-based MAC protocols for LoRaWAN through simulations with a varying number of stationary nodes (up to 2000). The assessments presents results on the message delivery ratio, but does not provide delay results and does not deal with mobile nodes or different MAC parameters.
The papers [
55,
57] provide insights on the message delivery ratio and the average delays of a LoRaWAN network in which some nodes adopt ALOHA and others the LBT-based MAC protocol. The evaluation is performed considering a fixed number of stationary nodes (i.e., 300) in [
57] and a variable number of stationary nodes (from 60 to 780) in [
55], respectively. No assessment varying the LBT MAC parameters is made.
In [
56] the two MAC protocols supported by LoRaWAN are compared through simulations varying the number of nodes from 1000 to 4000. However, the considered performance metrics do not include either message loss/delivery ratio or delay and no assessments varying the LBT MAC parameters are made.
The Authors of [
58] present a simulative assessment of a LoRaWAN network in which the number of nodes varies from 1 to 10,000. The work evaluates the message delivery ratio comparing ALOHA with two different LBT-based protocols. The results show significantly higher message delivery ratio values than the ones obtained by all the other works in the literature discussed in this Section. This result could be explained with a very low network traffic load, but the message generation pattern is not specified in the paper, therefore it is not possible to make a comparison with our results. Moreover, in [
58] mobility support is not addressed and this is another difference with our work.
The simulative assessments in [
63] are made varying the number of nodes (up to 3000) and the distance between the nodes and the gateway. However, the work does not provide results on either message loss/delivery ratio or delay.
The work in [
64] assesses a LoRaWAN network in which both time scheduled transmissions and random transmissions are considered. The nodes adopt either an LBT-based approach or ALOHA. However, there are no mobile nodes in the simulations and the assessment adopts different performance metrics than the ones considered in this paper.
The work in [
67] presents the implementation and message delivery ratio results obtained through experimental evaluations of an LBT-based LoRaWAN network in a 50-node lab testbed. Differently from our work, the nodes are stationary and no assessments with varying MAC parameters are performed.
The qualitative comparison between the state-of-the-art literature shown in
Table 1 allows to select the works with which the findings obtained in this work can be compared, i.e., [
54,
55,
62,
67]. A discussion on the comparisons between the results obtained in this work and the ones presented in the other relevant works in the literature is provided in
Section 6.
3. LoRaWAN Background
LoRaWAN defines a network architecture, shown in
Figure 1, and a protocol stack, shown in
Figure 2, optimized for IoT applications that provides low-cost, mobile and bi-directional communications.
The LoRaWAN network architecture (in
Figure 1) consists of a high number of LoRaWAN end-devices (EDs), a lower number of gateways and one network server, connected according to a star-of-stars topology.
The bi-directional communication between the EDs and the network server goes through the gateways. The EDs exchange messages with the gateways through single-hop LoRa transmissions, while each gateway is connected to the network server via a standard IP connection. The gateways forward the messages from the EDs to the network server (uplink) and vice versa (downlink). Uplink messages are sent by an ED to the network server through one or multiple gateways. Each downlink message, instead, is sent by the network server to a single ED through one gateway.
The protocol stack in
Figure 2 shows that each LoRaWAN application runs over the LoRaWAN Link Layer, which defines three different classes of EDs (discussed in
Section 3.4). The Link Layer builds upon the Regional Parameters regulations as some of the Link Layer configuration parameters depend on the geographical area in which a LoRaWAN ED works. The lowest layer, i.e., the Physical Layer, is the LoRa modulation technique (discussed in
Section 3.1). A Strengths, Weaknesses, Opportunities, and Threats (SWOT) analysis of LoRa/LoRaWAN is presented in
Section 3.5.
3.1. LoRa Physical Layer
LoRaWAN builds upon LoRa [
40], which is a spread spectrum modulation technique derived from chirp spread spectrum (CSS) technology. The LoRa modulation allows to configure multiple parameters [
69] that influence the bit rate, coverage range, energy consumption, and robustness to noise or interference. The main LoRa parameters are the Carrier Frequency (CF), Bandwidth (BW), Spreading Factor (SF), Coding Rate (CR), and Transmission Power (TP). The time required to transmit a LoRaWAN message using specific LoRa parameters is called the Time on Air (ToA) and is obtained through the Equation (
1) provided in [
70],
where
CRC is a boolean flag referring to the Cyclic Redundancy Check (CRC) presence
DE is a boolean flag referring to the data rate optimization status
IH is a boolean flag referring to the physical header presence
NP is the number of preamble symbols
PL is the Physical payload length in bytes
SW is the length of the synchronization word
is the value of the parameter in the formula .
Based on the region in which the LoRaWAN devices operate, the LoRa parameters can assume different values, as specified in [
53]. Configuring these parameters it is possible to tune the bit rate, coverage range and energy consumption. To give an example, in [
71,
72] it is shown that an increase in SF broadens the coverage and approximately halves the bit rate, thus approximately doubling both the ToA and the energy consumption.
According to [
73,
74] the SFs are quasi-orthogonal, therefore simultaneous transmissions with different SFs on the same channel are not totally immune to each other. Despite this, the transmitted messages can be correctly interpreted if their Signal-to-Interference Ratio (SIR) is higher than the isolation threshold stated in [
73].
3.2. LoRaWAN Regional Parameters
The LoRaWAN regional parameters document [
53] provides, among other things, the transmissions management strategies and the channel frequencies to be used for LoRaWAN communications. The document also recommends that, to obtain authoritative information, one has to refer to the specific laws and regulations of the country or region in which the LoRaWAN EDs operate.
For instance, in Europe the operation in the EU868 band is regulated by the ETSI regulations EN 300 220 [
59,
60], in the sub-bands specified in the ERC Recommendation 70-03. For the medium access, the ETSI regulations allow to choose either a Pure ALOHA MAC protocol with duty-cycle limitation or a polite medium access based on LBT AFA. However, these MAC protocols [
61] are not suitable for real-time communications, as they lack predictability and do not provide time or frequency reservation mechanisms. Consequently, no end-to-end delay bound can be calculated, either exactly or stochastically [
75,
76,
77].
3.3. Adaptive Data Rate
The LoRaWAN Adaptive Data Rate (ADR) [
78] is a mechanism for optimizing bit rates, ToA and energy consumption in the EDs. When the ADR is in use, the management of the bit rate and TP of the EDs is up to the network server. This way, the network server will command the ED to reduce the TP or increase the bit rate. Instead, when the ADR mechanism is disabled, each ED has to manage its bit rate and TP. ADR should be enabled whenever an ED has sufficiently stable radio frequency conditions. For this reason, mobile EDs typically disable the ADR mechanism as, depending on the dynamics of the radio channel attenuation variation, the network server could not perform the runtime configuration of the bit rate and TP of the EDs in an efficient way.
3.4. LoRaWAN ED Classes
LoRaWAN defines three different classes of EDs, namely Class A (All), B (Beaconing) and C (Continuously listening). The classes differ for the performance target they aim to achieve, i.e., the reduction of the power consumption or the reduction of the latency for downlink communications. In particular, Class A enables bi-directional communications with the lowest power consumption. Class B supports predefined receive windows for downlink communications, thus achieving a trade-off between power consumption and downlink latency. Class C always allows downlink communications except during the transmissions, thus achieving the lowest downlink latency. Since the Class A features shall be supported by all the LoRaWAN commercial-off-the-shelf (COTS) devices, in this paper we focus on Class A EDs.
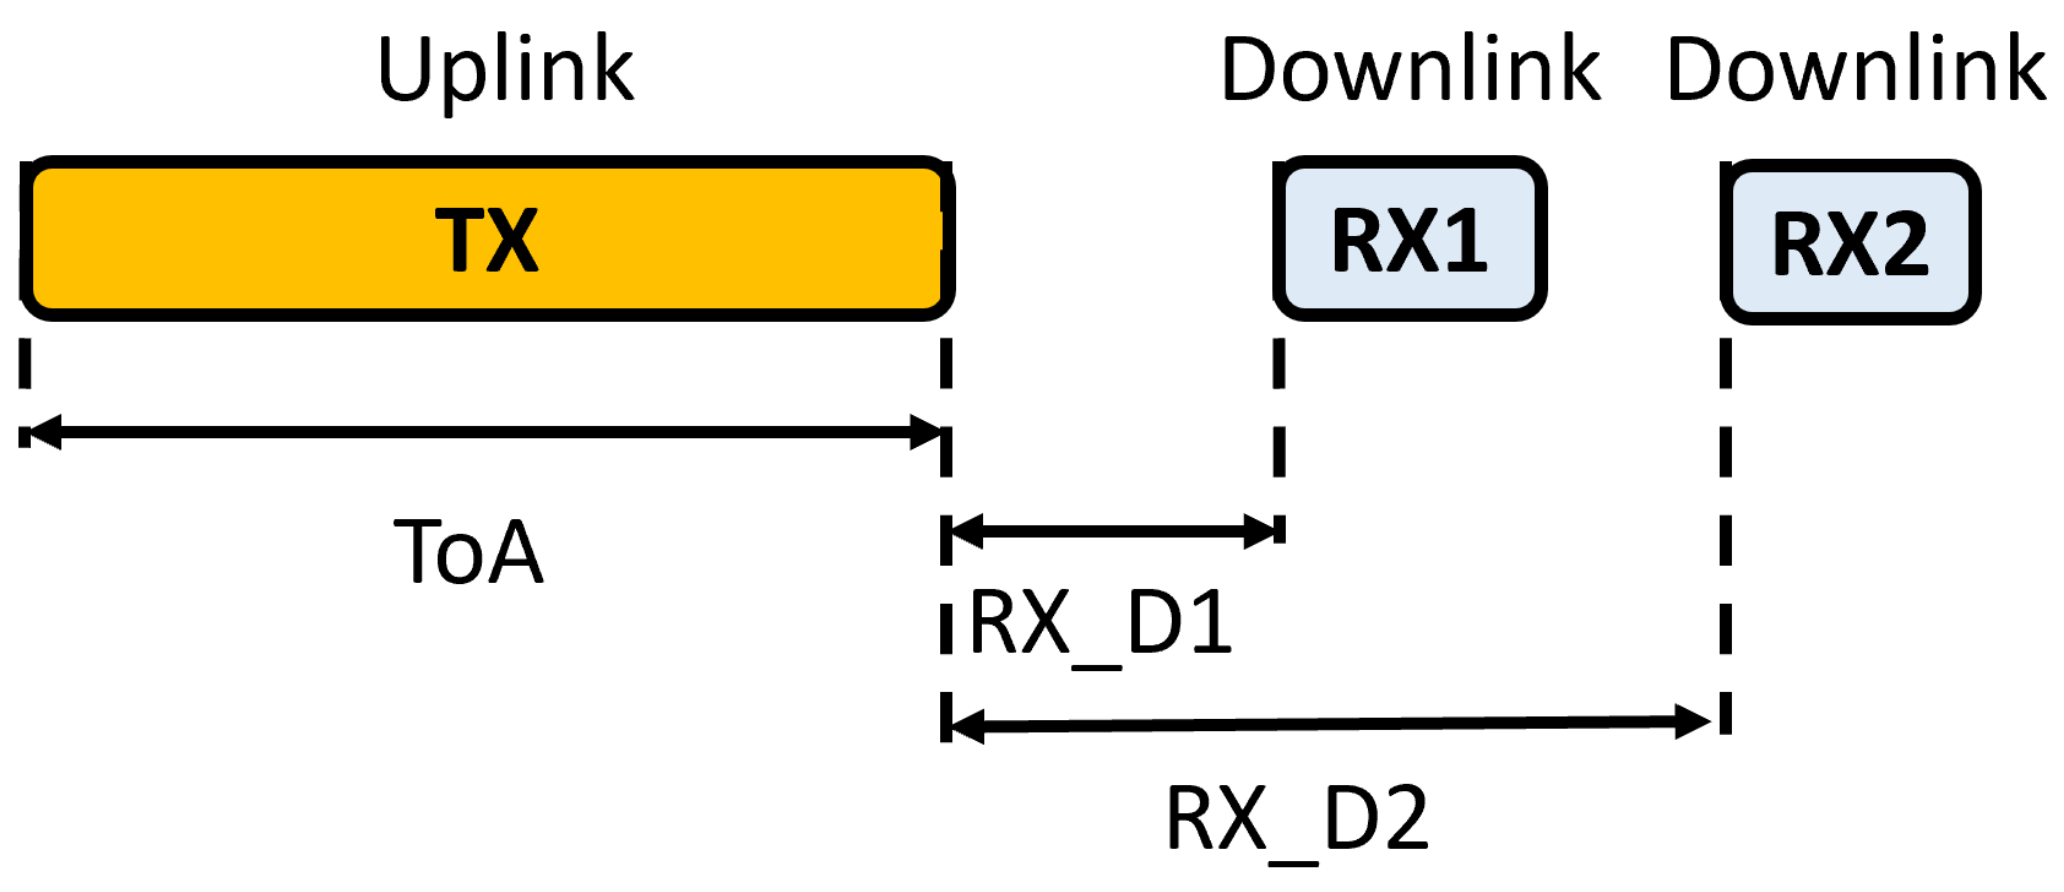
Class A communications are always started by an ED. An ED can send an uplink message at any time. Once the uplink transmission is finished, after a delay whose duration is defined in the specifications, the ED opens two short receive (downlink) windows following the scheme in
Figure 3.
The minimum duration of a receive window corresponds to the time taken by the ED radio transceiver to sense the downlink message preamble. Once a preamble is detected, the receiver remains active until the downlink message is received. The NS can respond during either the first (RX1) or the second receive window (RX2), but does not use both.
3.5. LoRa/LoRaWAN SWOT Analysis
Table 2 presents the SWOT analysis for LoRa/LoRaWAN in the context of this work. Other interesting works in the literature present SWOT analysis for LoRaWAN from a general point of view [
41] and in the context of smart cities [
79].
LoRaWAN is considered one of the most successful LPWAN technologies [
41,
86,
87]. As
Table 2 shows, the main strengths of LoRaWAN are that it offers cheap EDs with long battery lifetime and the possibility to easily develop private networks. Other strengths include the large coverage (up to 15 km in outdoor environments [
79]). Among the weaknesses, it is known that the bit rates supported by LoRaWAN are limited, therefore LoRaWAN is not recommended for applications that require high bit rates. In addition, as it was discussed in
Section 3.4 uplink communications are strongly favored for Class A EDs, therefore they are not suitable for bidirectional communications. A weakness is represented by the limitations of the plain ADR algorithm when it works with mobile EDs. However, some works in the literature [
80,
81] propose promising alternative ADR algorithms to cope with this limitation.
The lack of support for industrial communications is because the uncoordinated channel access mechanisms supported by LoRaWAN cannot provide bounded delivery times to real-time messages. However, some existing works in the literature [
82,
83,
84] proposed techniques that enable predictable communications over LoRa leveraging TDMA-based channel access.
As LoRaWAN operates in unlicensed bands the main threat is the outside interference, therefore techniques to quantify and alleviate it should be considered in the future. Another potential threat is represented by the competing IoT LPWAN technologies [
88], such as Sigfox and NB-IoT. However LoRaWAN offers a higher bit rate than Sigfox and, differently from NB-IoT, which uses licensed frequency bands, operates in the license-free spectrum. Using LoRaWAN, differently from Sigfox and NB-IoT, there is no need for subscription and this reduces the operating costs especially for dense IoT deployments. Moreover, as mentioned in the Opportunities, some technology-agnostic solutions could leverage the convergence of multiple technologies to improve the offered services. Moreover, the interest of big Information Technology (IT) companies in developing or supporting LoRa products paves the way for the growth and establishment of a rich LoRa/LoRaWAN ecosystem.
5. Simulative Assessment
Here a simulative performance assessment of a LoRaWAN network working with the LBT AFA MAC protocol described in
Section 4 is presented.
Simulations were run using OMNeT++ [
89,
90] and the Framework for LoRa (FLoRa) [
91], which in turn adopts components of the Internet Networking (INET) Framework [
92], for modeling the LoRaWAN class A EDs, the LoRa physical layer, and the wireless channel. Conversely, the LBT AFA medium access mechanism was implemented from scratch.
The LoRa SFs imperfect-orthogonality is implemented as in [
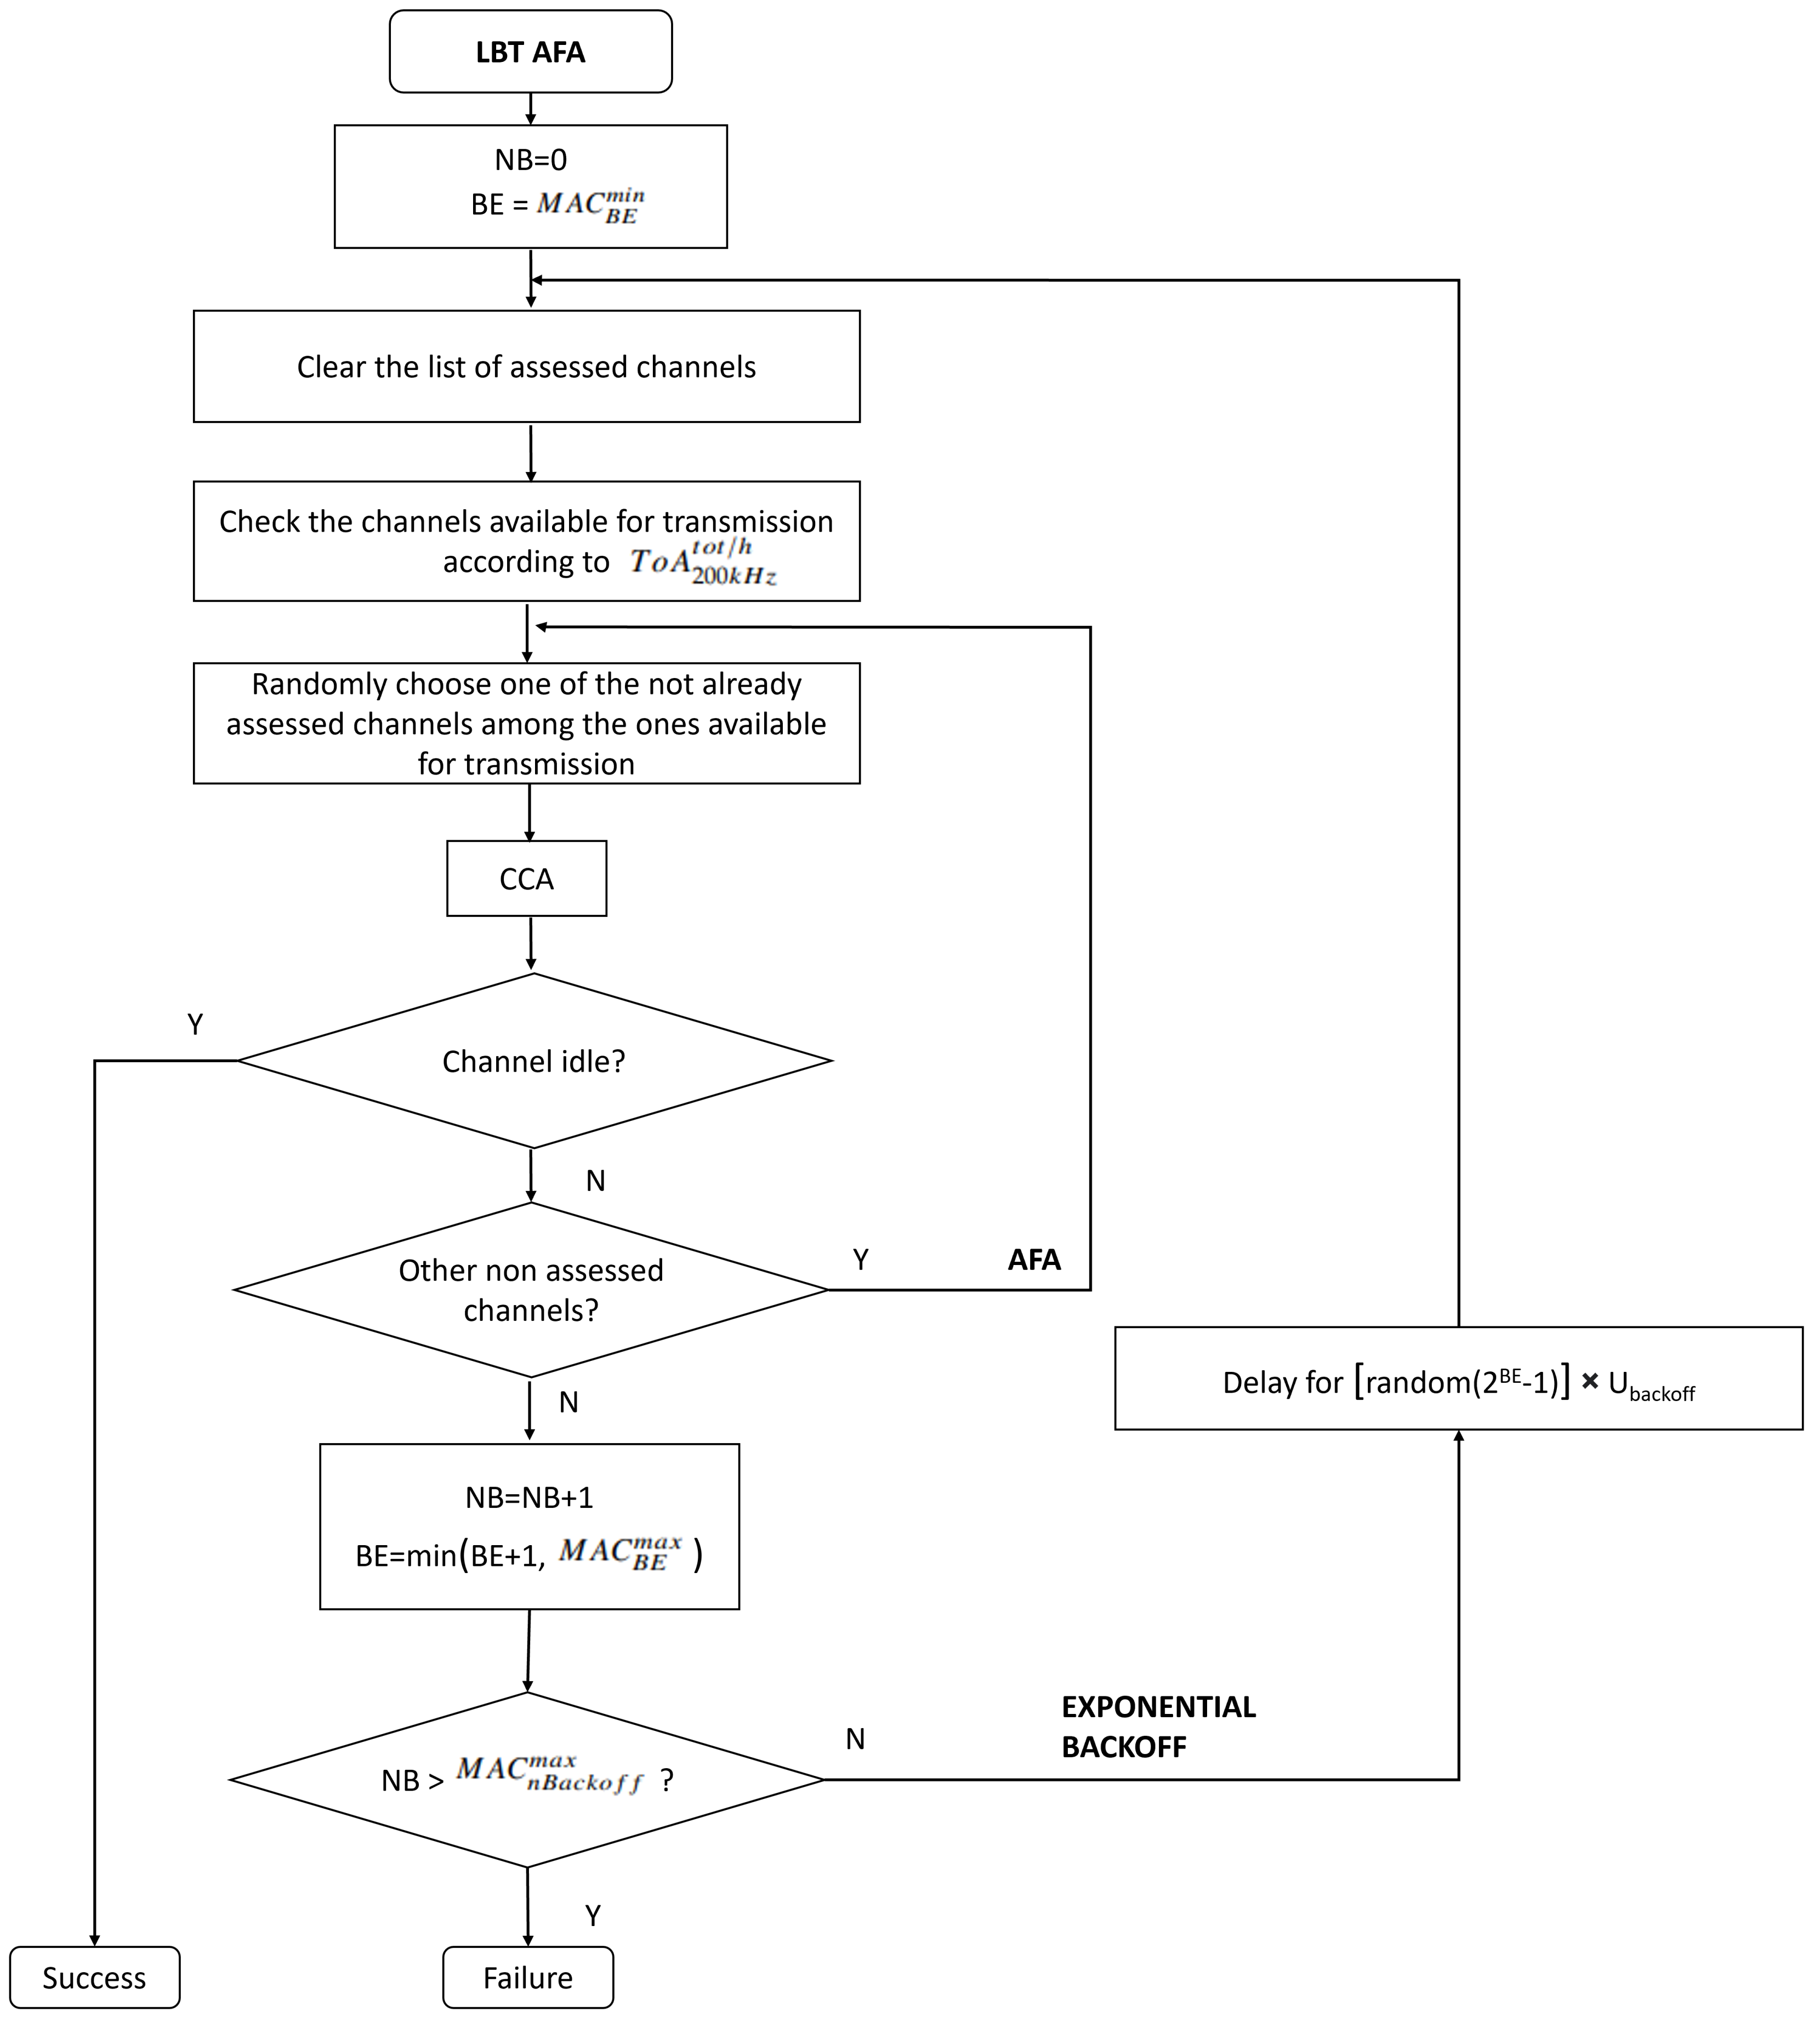
73]. As shown in
Figure 4, before a message transmission attempt each ED runs a check function to create the list of channels available for transmission according to the ETSI limitations on the maximum allowed cumulative ToA per hour (
). This function runs when the LBT AFA procedure starts and after each backoff.
The metrics here chosen to evaluate the LoRaWAN network performance are the Message Loss Ratio (MLossR), the Message Drop Ratio (MDropR), the Message Delivery Ratio (MDelivR), and the end-to-end delay (e2eD).
The MLossR refers to the percentage of lost messages over the total number of transmitted messages, measured at the Application layer, according to Equation (
2),
where
,
, and
are the number of messages transmitted, correctly received and lost, respectively, measured by each ED.
The MDropR refers to the percentage of messages that are discarded due to exceeding the maximum number of backoffs over the total number of Application layer messages received by the MAC layer, measured by each ED, according to Equation (
3),
where
and
are, respectively, the number of messages received from the Application layer and discarded by the MAC layer after reaching the maximum number of backoffs, measured by each ED.
The MDelivR represents the ratio between the number of delivered messages and the number of sent messages, measured at the Application layer and expressed as a percentage, according to Equation (
4),
The e2eD is the time difference between the message generation at the source node (
) and the message reception at the destination node (
), measured at the application level, according to Equation (
5).
In the simulations the source is an ED, the destination is the network server and the delay introduced by the communication between the gateway and the network server is assumed equal to 0.
5.1. Simulated Scenarios
The simulative assessment is performed in realistic scenarios similar to the ones in [
62,
93]. The evaluated scenarios consist of a large number of EDs that send messages to the network server while on the move in an industrial plant over a 1000 m × 1000 m sensing area.
The simulated LoRaWAN networks include a network server, a gateway and a varying number of Class A EDs.
Both the network server and the gateway are stationary nodes placed in the center of the industrial plant. All the EDs are mobile and move with an average speed of 0.3 m/s according to the ChiangMobility model, as in [
48,
62,
94].
The EDs generate and transmit unconfirmed messages with a physical payload of 32 bytes, as in [
93], following an exponential distribution with a mean of 60 s. No retransmission mechanism is adopted. We consider EDs that are not synchronized with each other, thus allowing multiple EDs to start a transmission attempt at the same time.
The plain ADR algorithm is disabled for the EDs. In fact, as it was discussed in
Section 3.3, the network server could not efficiently perform the runtime configuration of the mobile EDs LoRa parameters due to the dynamics of the radio channel. As a result, each ED has to individually manage the LoRa parameters for transmissions. For this reason, instead of the ADR algorithm, we developed a custom algorithm that runs on each ED using a predefined switching table to change the LoRa configuration parameters. The table is obtained as follows. During the configuration phase, a test application runs on a probe ED. Such a probe ED, while moving in the sensing area, computes the parameters that guarantee a MDelivR higher than a configurable threshold (e.g., 96% in our simulations) in multiple points, which correspond to multiple distances from the gateway. For example, in the simulations we evaluated distances from the gateway in steps of 10 m (a configurable value in the simulator). Based on the outcome of the probe ED assessment, the network designer configures all the EDs so that they switch their LoRa configuration based on their distance from the gateway. If the sensing area RF status is highly changing, the probing procedure may be repeated and the new switching table can be communicated to the EDs through downlink messages sent by the network server.
The LoRa Path Loss Oulu propagation model [
91] was used for the simulative assessment. In particular, we used the parameters of a suburban area that were obtained through experimental evaluations in [
95].
Each simulation runs for 12 h and is repeated five times varying the seed to collect a significant amount of data. OMNeT++ and MATrix LABoratory (MATLAB) were used to analyze the obtained data.
The configuration parameters are shown in
Table 5.
The performance assessment is performed in several scenarios varying the number of EDs and two MAC parameters, i.e., and .
5.2. Simulation Results
This subsection presents the results obtained in several scenarios and discusses the impact on the performance of several simulation parameters, i.e., the number of EDs, the maximum number of backoffs, and the duration of a backoff unit.
5.2.1. Impact of the Number of EDs
In this experiment the duration of a backoff unit () and the maximum number of backoffs () were heuristically chosen based on both the network workload and the typical ToA duration for LoRaWAN transmissions. In particular, the duration of a backoff unit was set to 5 ms and the maximum number of backoffs was set to 5. Four different scenarios were evaluated with an increasing number of EDs from 50 to 200, in steps of 50 EDs.
Table 6 shows the average values of MLossR, MDropR and MDelivR obtained by varying the number of EDs.
The measured MLossR in all the evaluated scenarios maintains values around 2%, with negligible variations (less than 0.05%). A possible explanation is that in this case the 2% value mainly depends on other factors, e.g., the wireless channel properties, therefore the effect of increasing the number of EDs from 50 to 200 is not significant. Instead, when the number of EDs increases, the MDropR also increases, as there are more EDs competing for the same channels. In fact, with a high number of EDs, the channels are sensed busy multiple times and several messages, after exceeding the maximum number of backoffs (5 in these simulations), are discarded. For the same reason, the MDelivR decreases as the number of EDs grow. Note that, in the evaluated scenarios, all the messages generated are transmitted. This means that the number of messages transmitted by the MAC layer is equal to the number of messages that the MAC layer received from the Application layer, therefore the measured MDelivR value corresponds to that calculated as the difference .
Table 7 shows the average and the maximum e2eDs obtained in the evaluated scenarios.
As it can be seen, the highest e2eD values are experienced in the scenario with the highest number of EDs, as on average the EDs run more backoffs when the workload increases.
5.2.2. Impact of the Maximum Number of Backoffs
In this experiment a LoRaWAN network with 200 EDs is assessed. The duration of a backoff unit () is heuristically set to 5 ms. To evaluate the impact of the maximum number of backoffs, the value of varies from 5 to 15, in steps of 2.
Table 8 shows the average values of MLossR, MDropR and MDelivR.
The results show that also in this case the MLossR value remains around 2%, without significant variations, thus confirming that in the evaluated scenarios the value mainly depends on the wireless channel properties. Conversely, the MDropR decreases when the value of the parameter grows. In fact, an increase of corresponds to a higher probability that a message will be transmitted before reaching the maximum number of backoffs, as a higher number of transmission attempts can be run for each message. For the same reason, MDelivR grows with the parameter, which also entails a higher energy consumption due to the larger number of CCAs performed. Also in these scenarios, all the messages generated are transmitted.
Table 9 shows the average and the maximum e2eDs.
The results in
Table 9 show that when the maximum number of allowed backoffs grows, both the average and maximum e2eDs increase. This results is because some of the messages experience a high number of backoffs before being transmitted. For this reason, the maximum number of backoffs shall be set depending on the application requirements in terms of both average MDelivR and e2eDs.
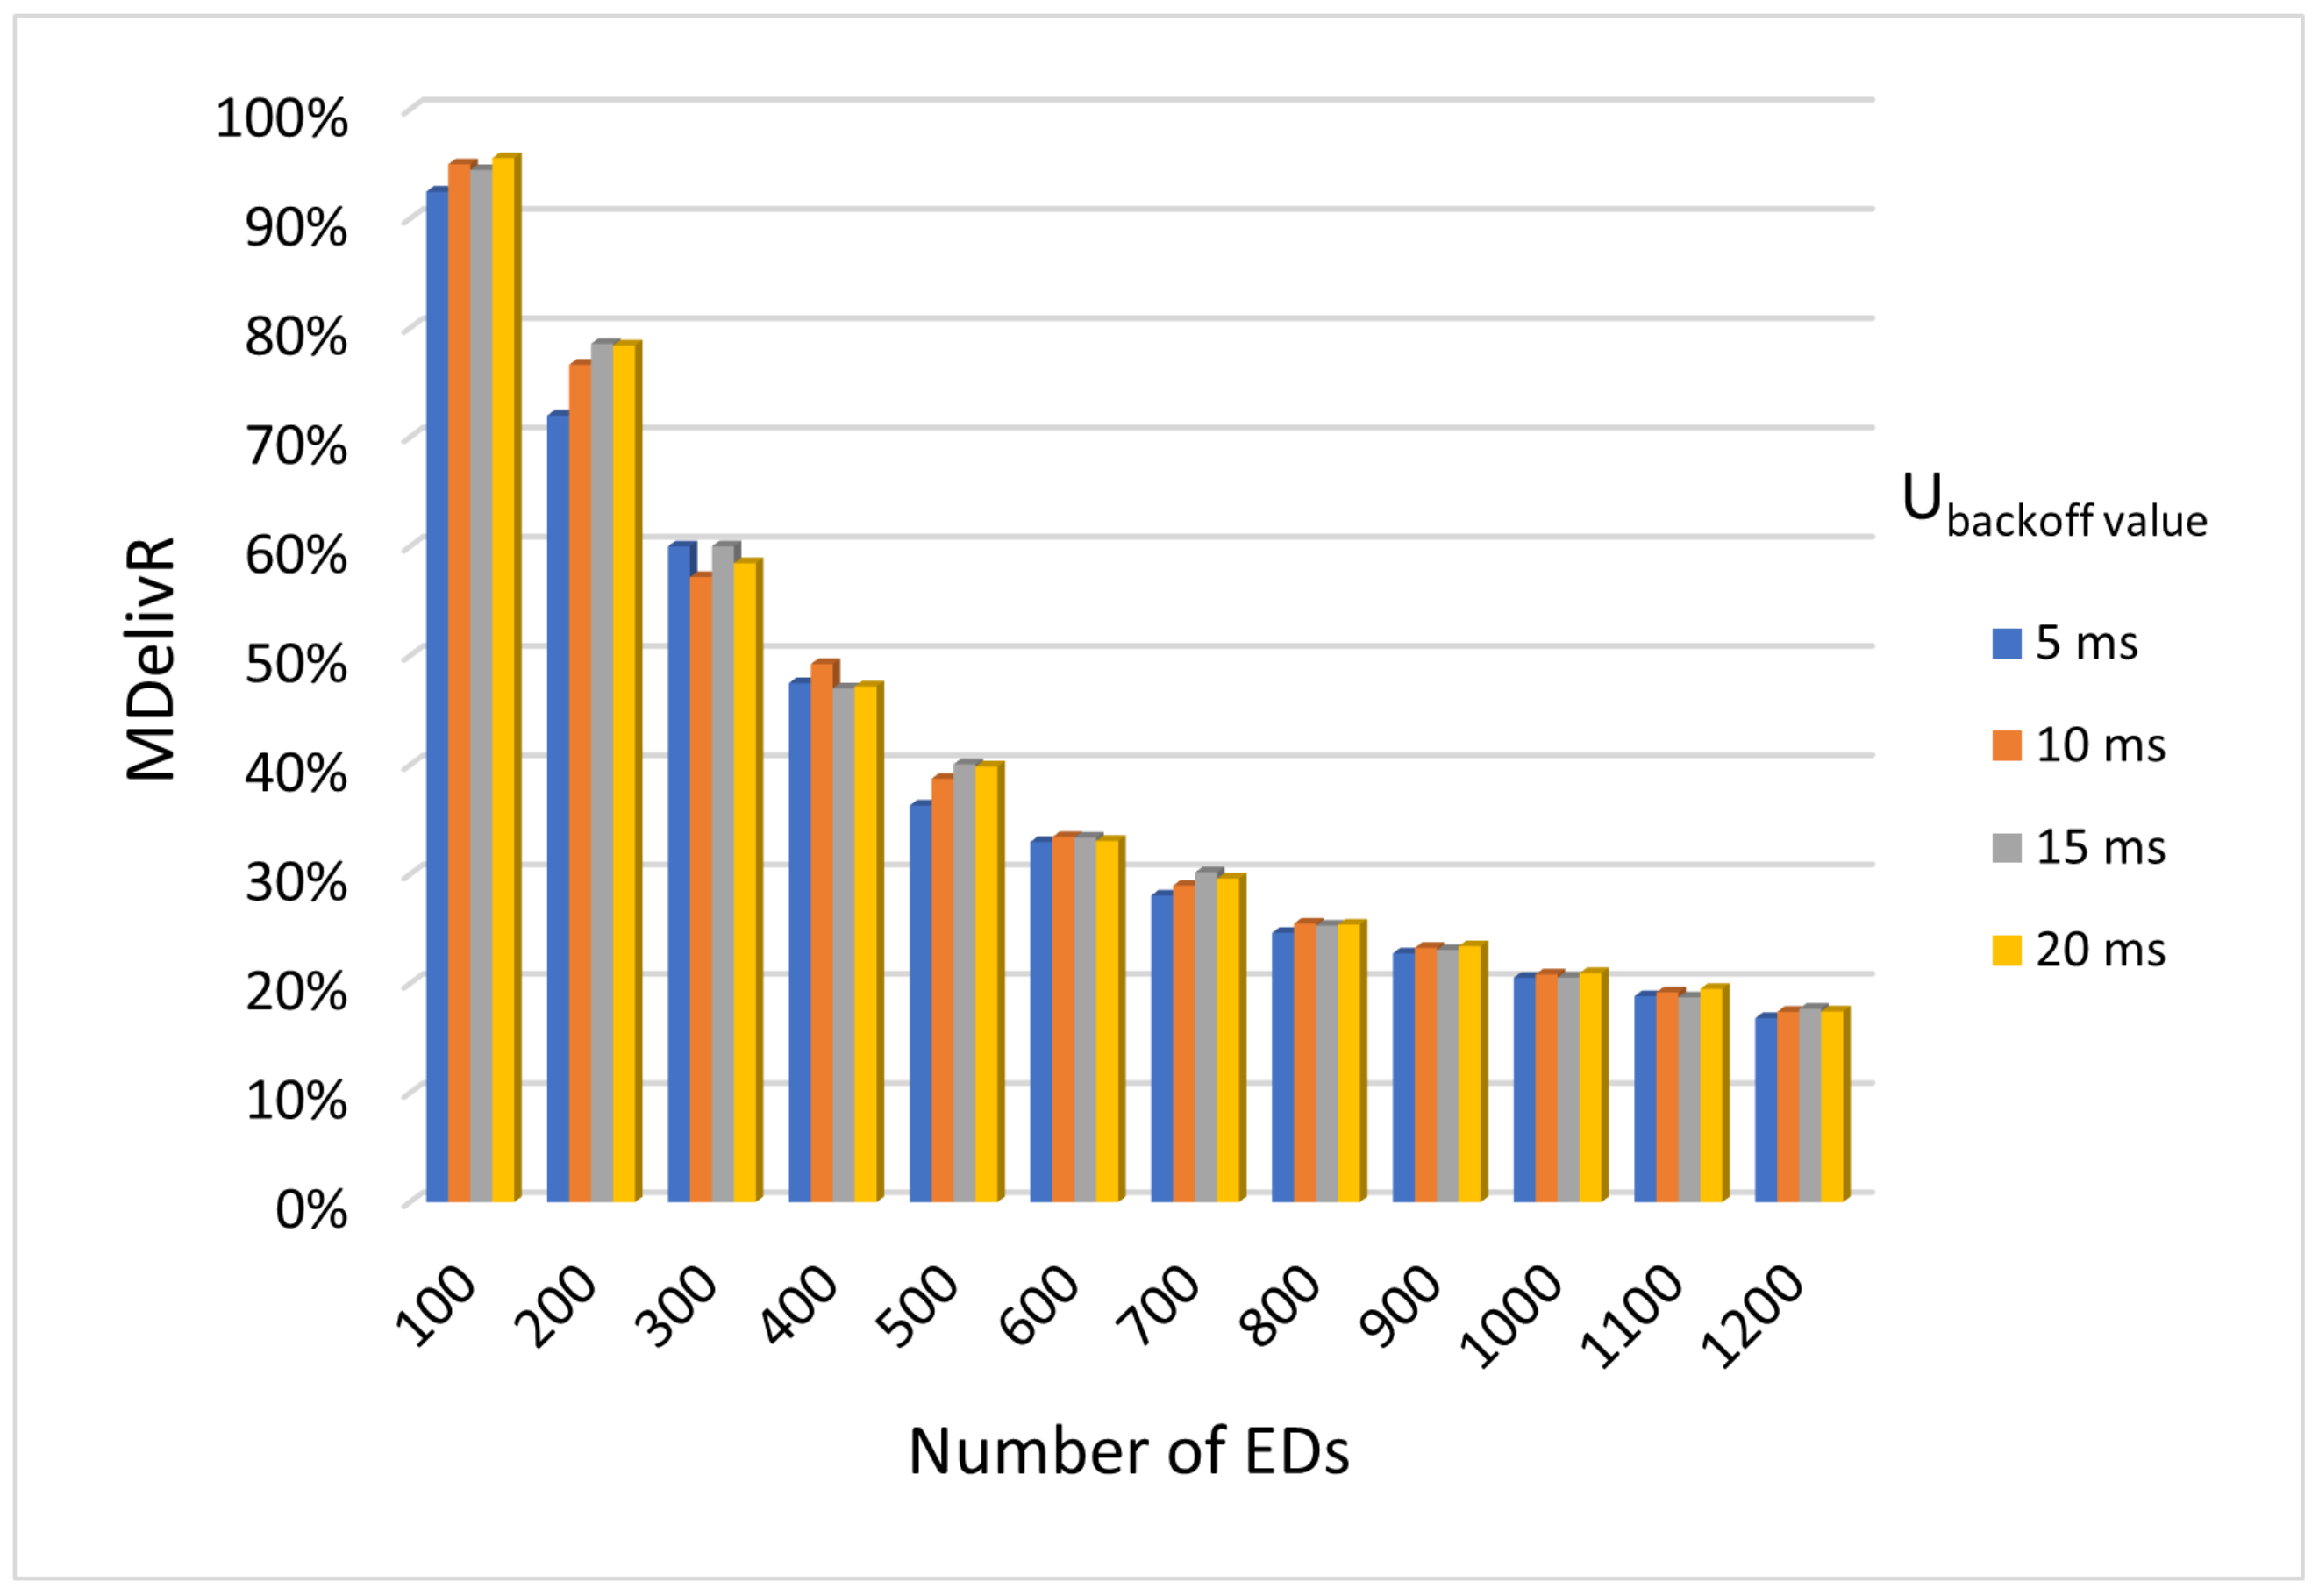
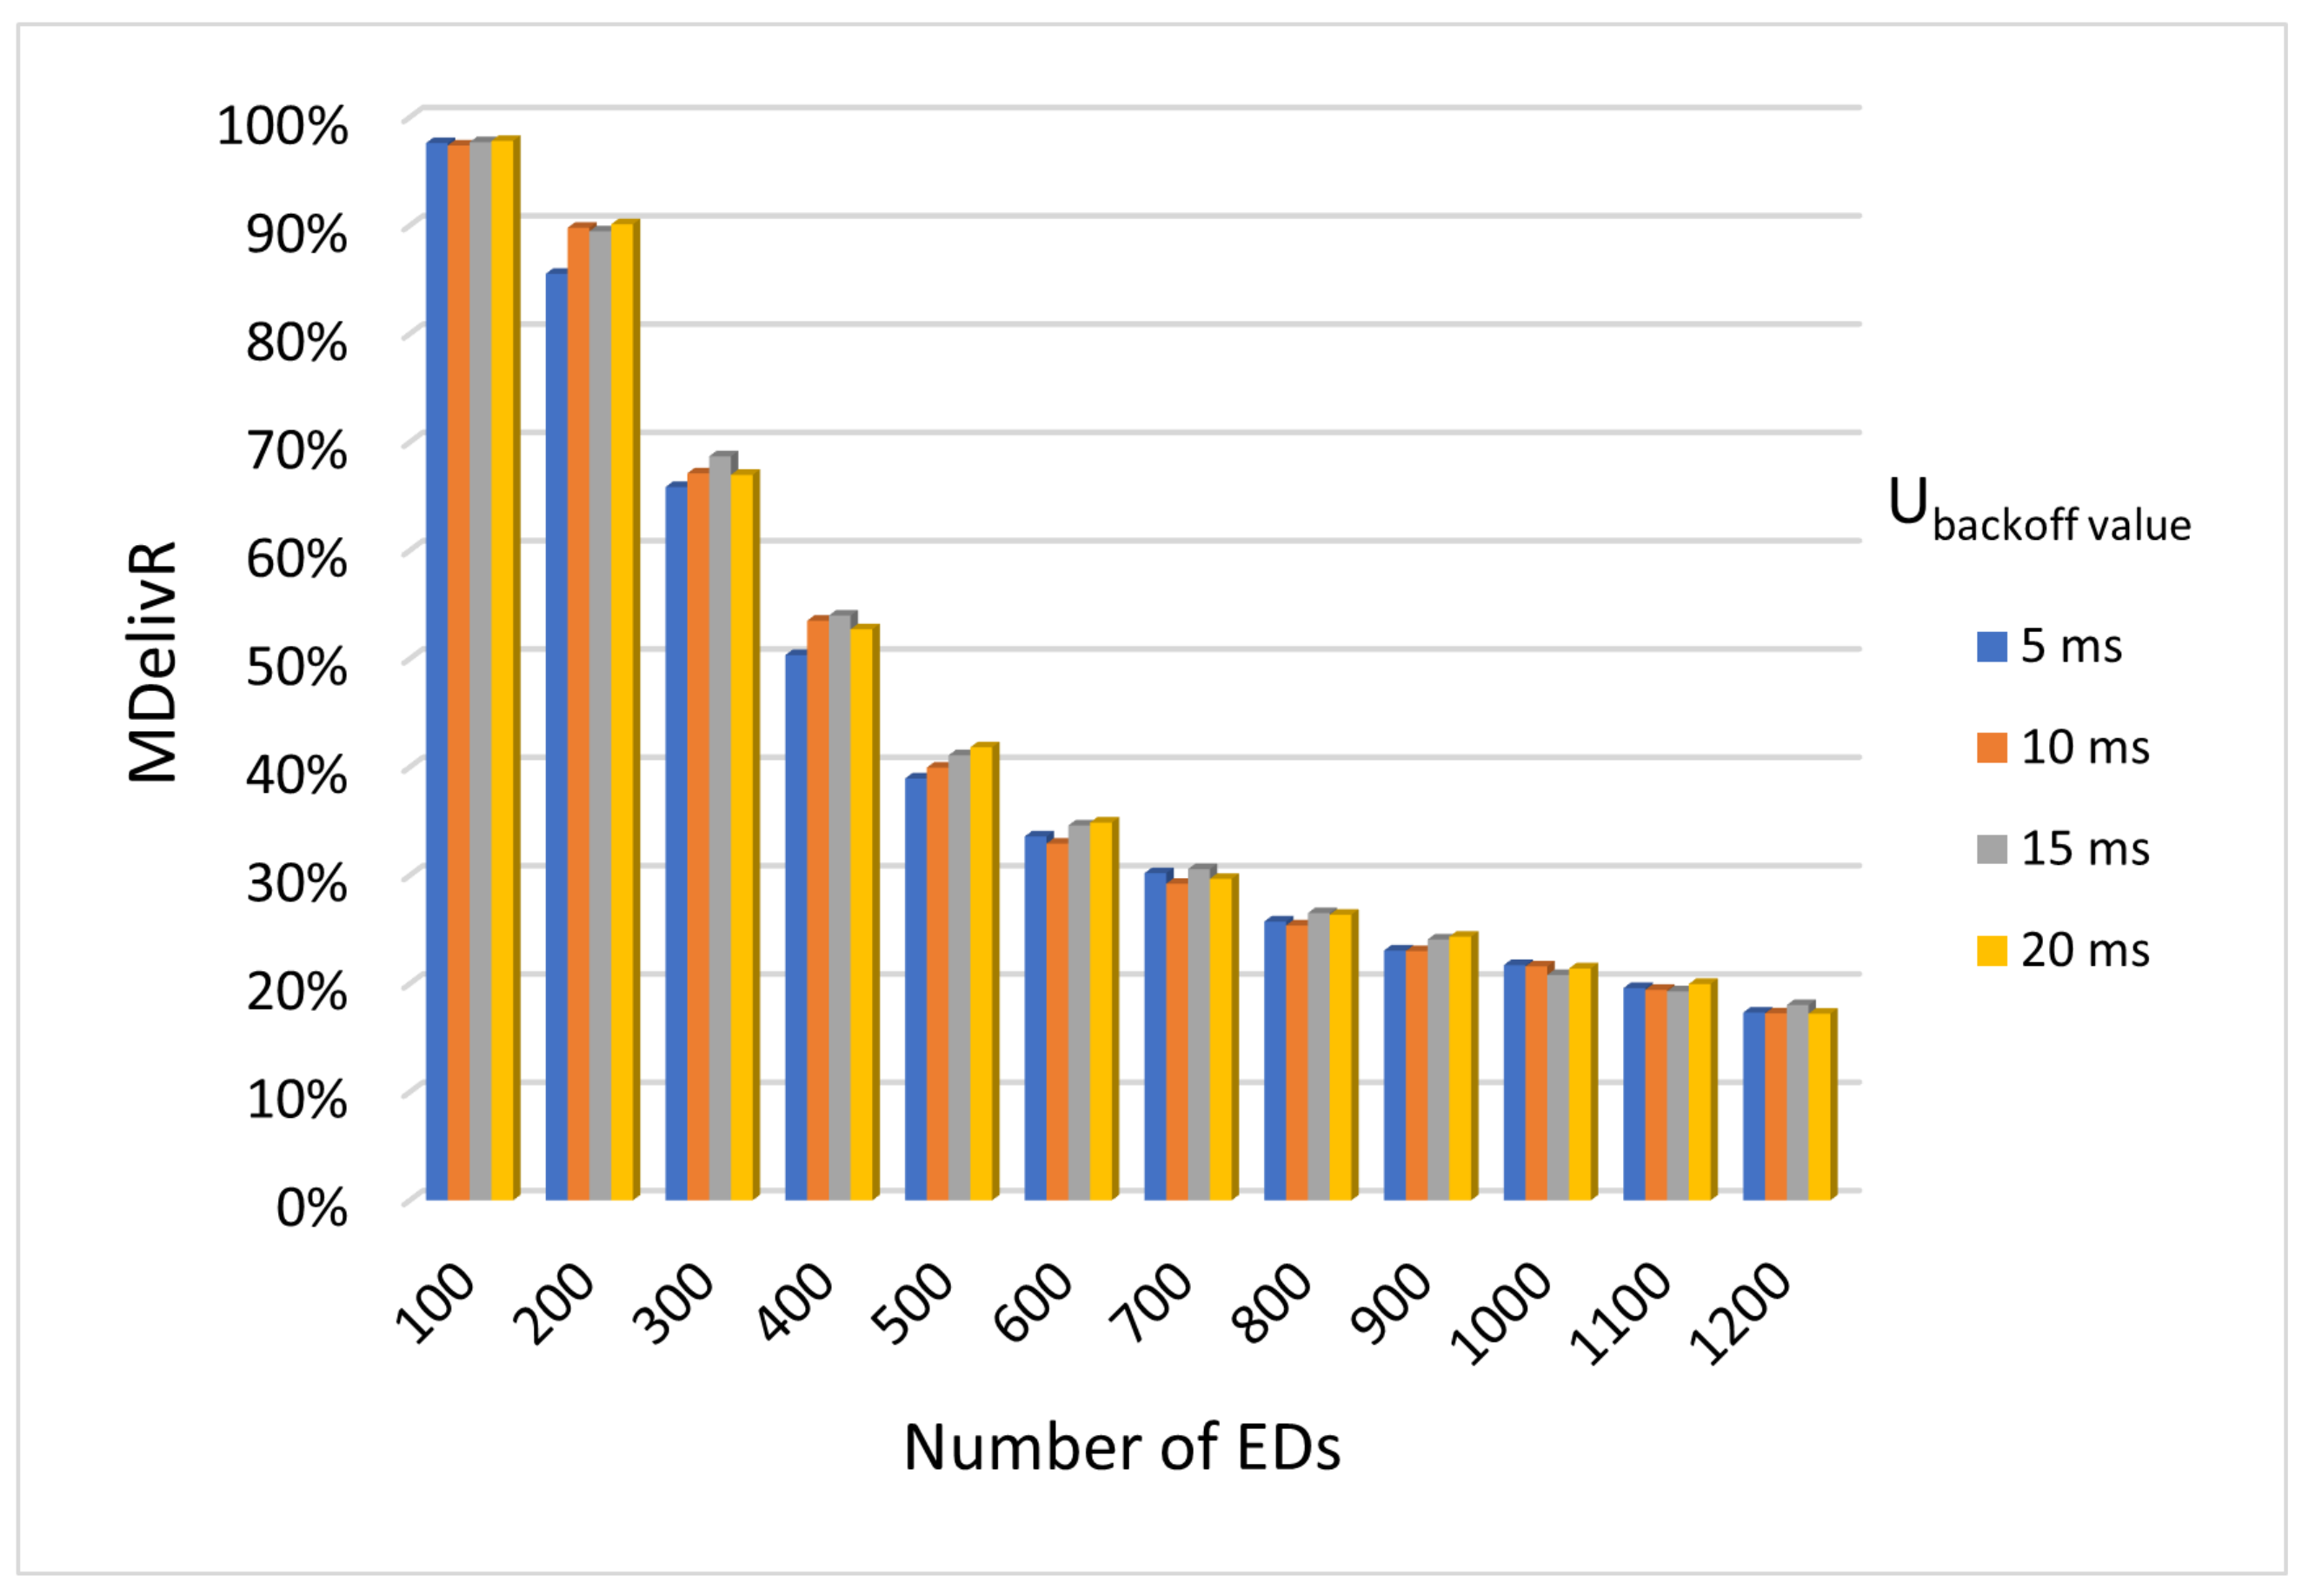
5.2.3. Scalability Assessment
The simulations aimed to evaluate of the scalability of the LBT AFA MAC protocol were run in several scenarios by varying the number of EDs from 100 to 1200, in steps of 100 EDs. For a given number of EDs, three cases (A, B, and C) are considered, each one with a different value for the maximum number of backoffs, i.e., 5, 10, and 15. Moreover, for each of such cases, four backoff unit duration () values are considered, i.e., 5 ms, 10 ms, 15 ms, and 20 ms. The performance metrics used are the average MDelivR and the e2eDs.
Figure 5,
Figure 6 and
Figure 7 show the MDelivR obtained in all the considered scenarios varying the number of EDs and the
parameter with a maximum number of backoffs of 5, 10, and 15, respectively.
Moreover,
Table 10,
Table 11 and
Table 12 show the corresponding average and maximum e2eDs obtained. To provide a comprehensive comparison of all the obtained results, i.e., both the ones plotted in the graphs and the ones shown in the tables, a summative discussion is provided right below
Table 12.
Comparing the three
Figure 5,
Figure 6 and
Figure 7 it can be seen that in all the three cases A, B and C, the higher the number of EDs the lower the MDelivR. In fact, the graphs in the
Figure 5,
Figure 6 and
Figure 7 show similar trends. The difference lays in the highest MDelivR value achievable, as Case B and Case C, where the maximum number of backoffs is set to 10 and 15, respectively, obtain higher MDelivR values than Case A.
In all the considered cases, the effect of the backoff unit duration on the ability to provide acceptable MDelivR values to a large number of EDs is more evident for a number of EDs between 100 and 400. In fact, when the number of EDs exceeds 400 the impact of the backoff unit duration becomes less significant for any maximum number of backoffs. The difference between the obtained MDelivR values is limited, as it is always lower than 7% for each configuration with a given number of EDs. Conversely, the impact on the e2eD is more significant.
The results of this assessment can be exploited by the network designer during the network configuration phase. In fact, based on both the number of EDs in the network and the application requirements, the networks designer can combine the results plotted in the
Figure 5,
Figure 6 and
Figure 7 with the e2eD values in the
Table 10,
Table 11 and
Table 12 to choose the best combination of the MAC parameters for the network under consideration. For example, assuming a network with 200 EDs, a required average MDelivR of 82% and a required average e2eD of 3.0 s, the network designer from the graphs in
Figure 5,
Figure 6 and
Figure 7 and the values in
Table 10,
Table 11 and
Table 12 can pick the combinations (
,
) that correspond to the targeted MDelivR and e2eD, i.e., either (i)
(
Figure 6) and
(
Table 11) or (ii)
(
Figure 7) and
(
Table 12). When multiple options are available, as in this case, the designer can make the choice also on the basis of other factors, e.g., selecting the configuration with the lowest
parameter.
6. Comparative Discussion
Most of the works in the relevant literature assess several LBT-based protocols or compare them with other MAC protocols, such as ALOHA or Slotted ALOHA with the different goal to show the performance comparison of these different approaches. For instance, the work in [
67] provides an experimental assessment with 50 EDs comparing ALOHA with three LBT-based access mechanisms, called LMAC-1, LMAC-2, LMAC-3. The results in terms of MDelivR show that the LMAC approaches obtained values higher than 90% in an indoor scenario and higher than 80% in a outdoor scenario. Although the number of EDs for the experiment is limited, the obtained experimental results are in line with the simulative ones presented in this work when 100 EDs are used.
The work in [
62] shows a simulative comparative assessment between Pure ALOHA and the LBT. The work assessed a scenario with up to 200 EDs evaluating the MLossR. The simulation results in [
62] show that the MLossR increases with the number of EDs. This confirms the trend of MDelivR obtained in this work, i.e., the higher the number of EDs the lower the MDelivR. However, in [
62] only one backoff value is used, consequently it is not possible to analyze in details the performance varying the LBT parameters. Moreover, [
62] does not provide any result in terms of message e2eDs.
The work in [
54] compares four different LBT-based medium access protocols for LoRaWAN, using random payload-size and random transmission times. The simulation results show that using random transmission parameters three of the four assessed LBT-based approaches obtained a MDelivR higher than 80% with 1400 EDs. However, in [
54] the EDs send their message according to a random interval in the order of one hour, so quite sparingly compared to our work, where the EDs generate messages following an exponential distribution with a mean of 60 s. As the assessment in [
54] does not provide results varying the MAC parameters and EDs are not mobile, it is not possible to directly compare the results of [
54] with the ones presented in this paper.
The work in [
55] provides simulative evaluations of a LoRaWAN network in which some EDs adopt ALOHA and others the LBT-based MAC protocol. Due to the different channel model parameters and the different scenario, as in [
55] there are no mobile EDs, it is not possible to compare the MDelivR results obtained by [
55] with the ones presented in this paper. However, with the same number of EDs the average e2eDs are comparable with the ones obtained in this paper. While in this paper we demonstrate that the backoff parameters significantly affect the average e2eDs, the work in [
55] does not address the influence of the MAC parameters on the e2eD.
7. Conclusions and Future Work
This paper presented a simulative performance assessment of LoRaWAN networks in which the EDs use the LBT AFA MAC protocol in compliance with the ETSI regulations. The methodology of this assessment has general validity, as no limiting assumptions are made, but all the involved parameters (e.g., traffic generation patterns, payload size, EDs mobility patterns, channel model, and the LoRa parameters) are configurable depending on the application. In the network configuration phase, the designer can follow the methodology presented in this work to select, given the number of EDs, the most suitable combination of the MAC parameters to fulfill the application requirements.
The paper presented the results obtained in several scenarios with a varying number of LoRaWAN EDs and different configurations of the MAC parameters. These parameters remain fixed during the simulation. It would be interesting to evaluate the effects on the performance of varying such parameters during the simulations, therefore further investigations will address how to dynamically change the MAC parameters in the EDs exploiting the SDN paradigm. Future work will also deal with the combination of the assessed LBT AFA with a backoff algorithm able to provide prioritized channel access to time-critical messages.


