
SumVg: Total Heritability Explained by All Variants in Genome-Wide Association Studies Based on Summary Statistics with Standard Error Estimates


Abstract
:1. Introduction
2. Results
2.1. Overview of Methods
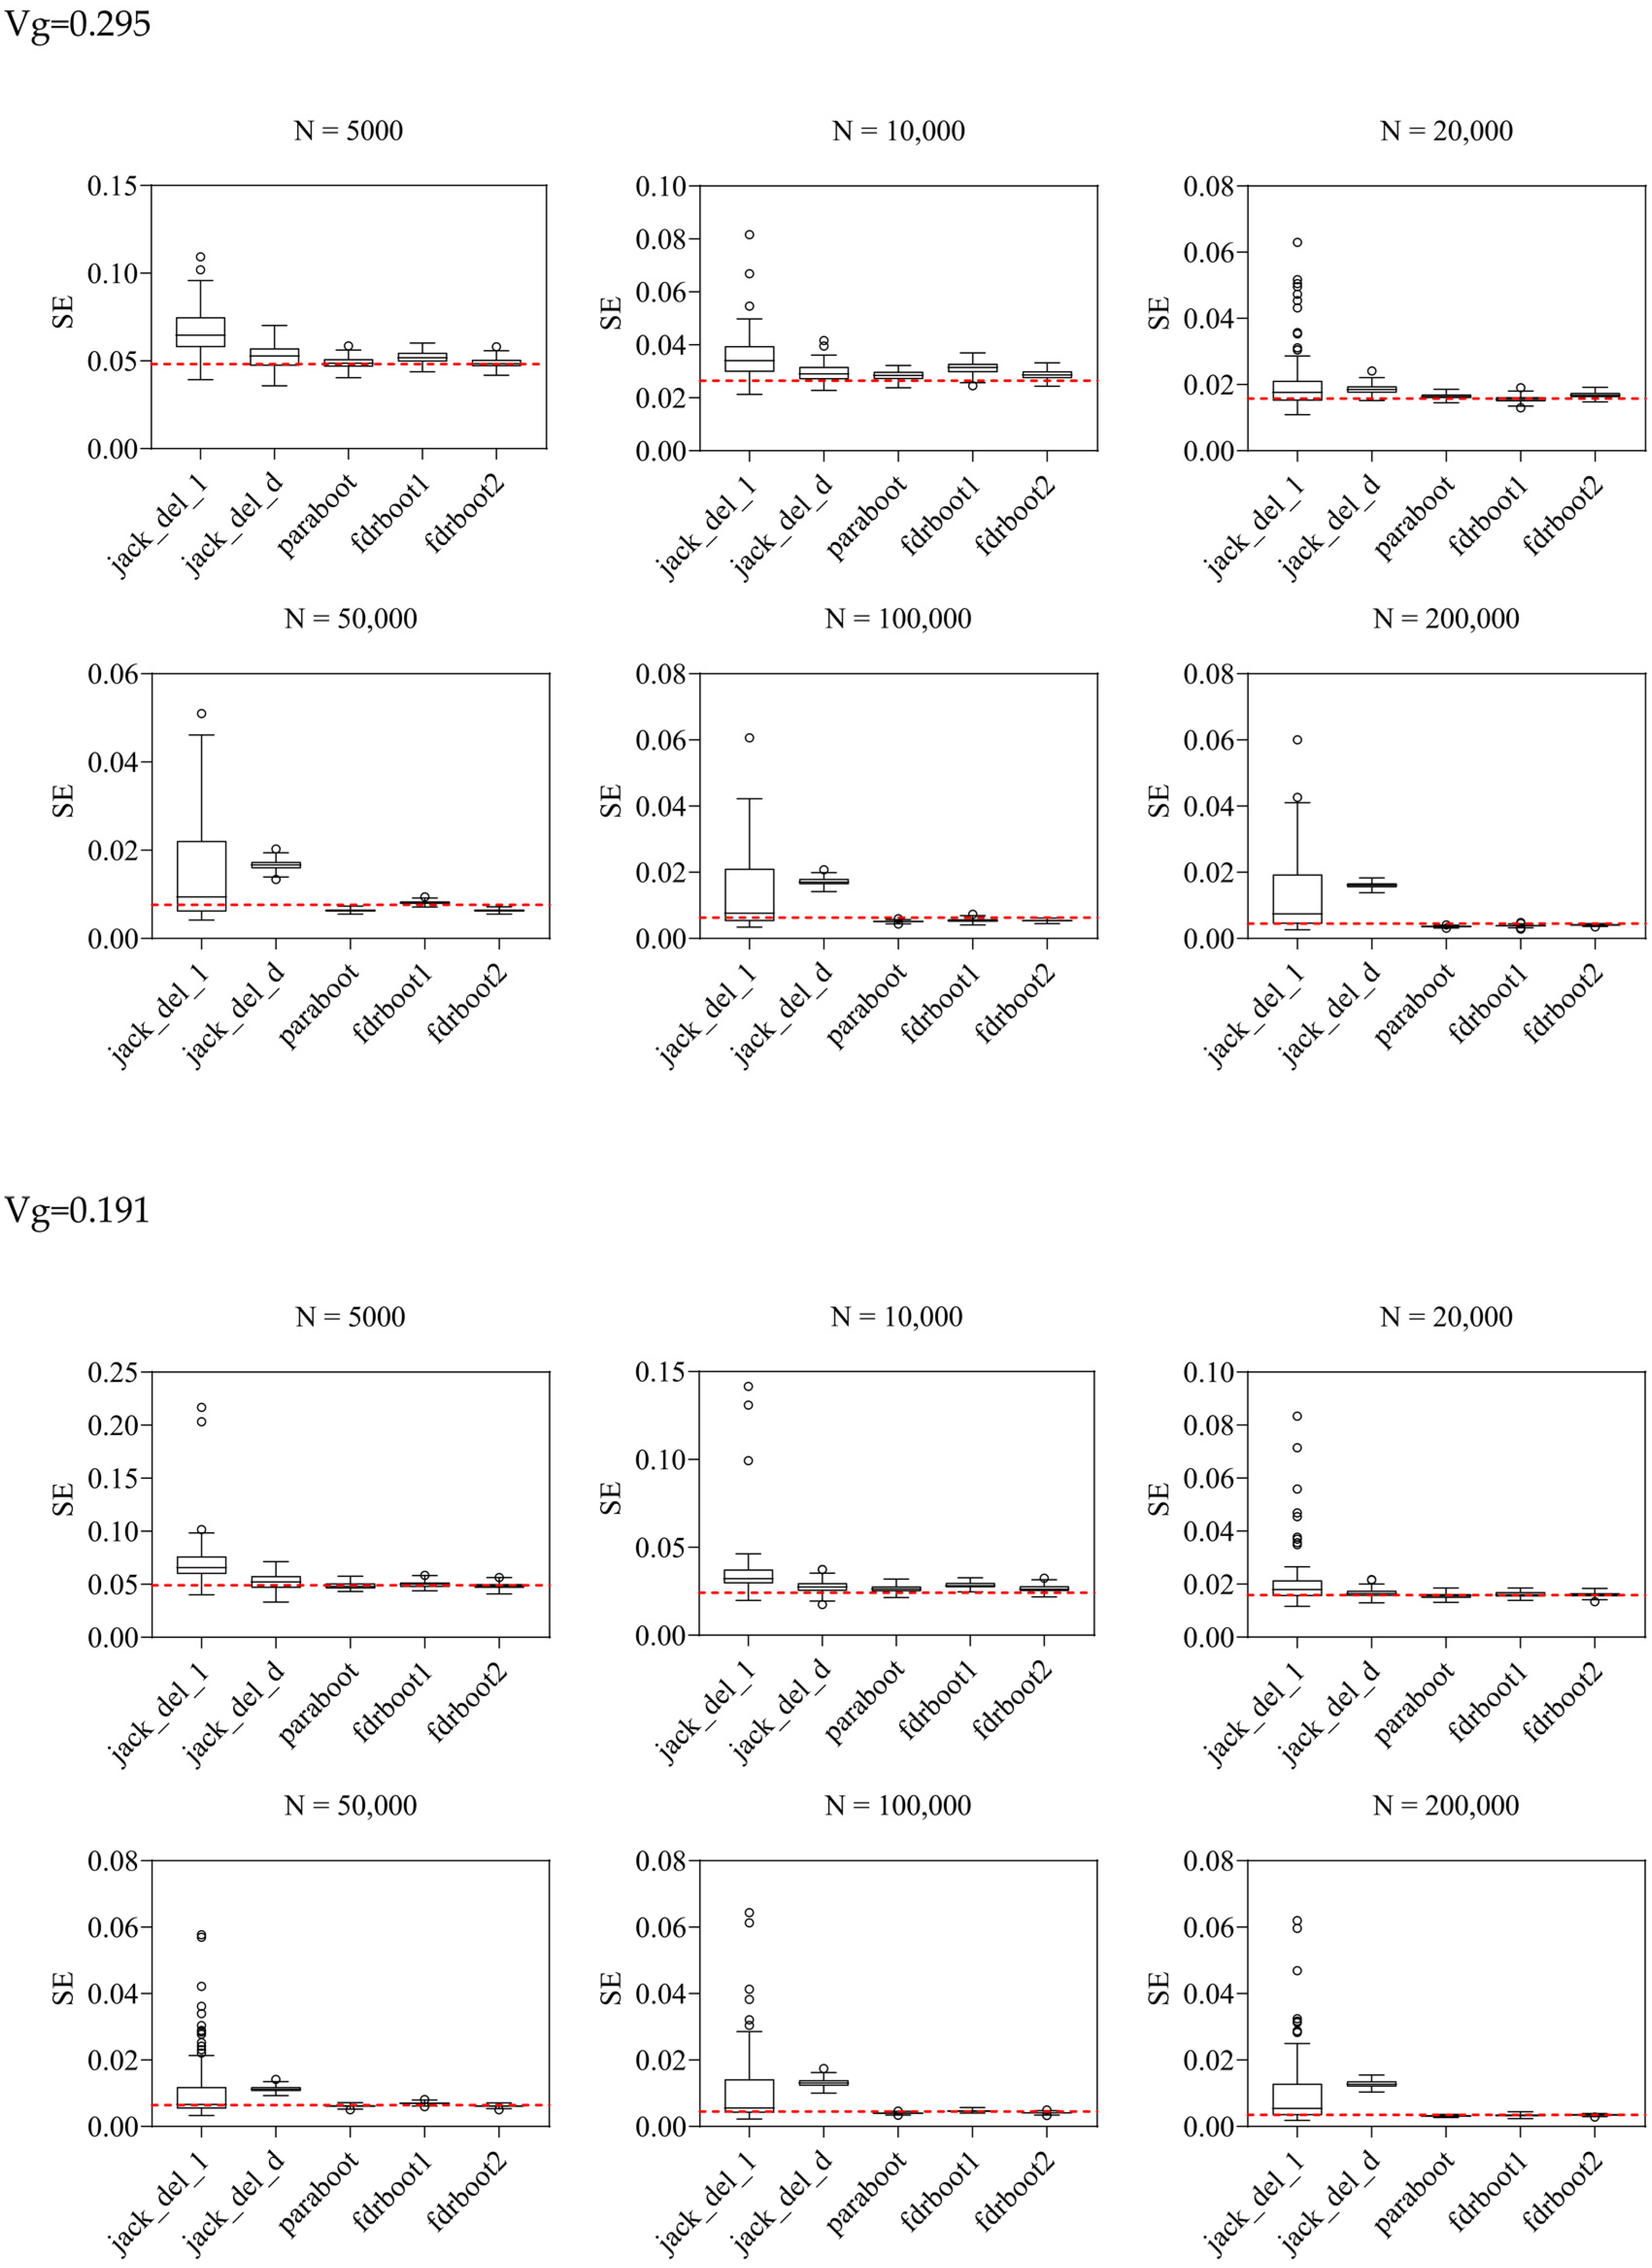
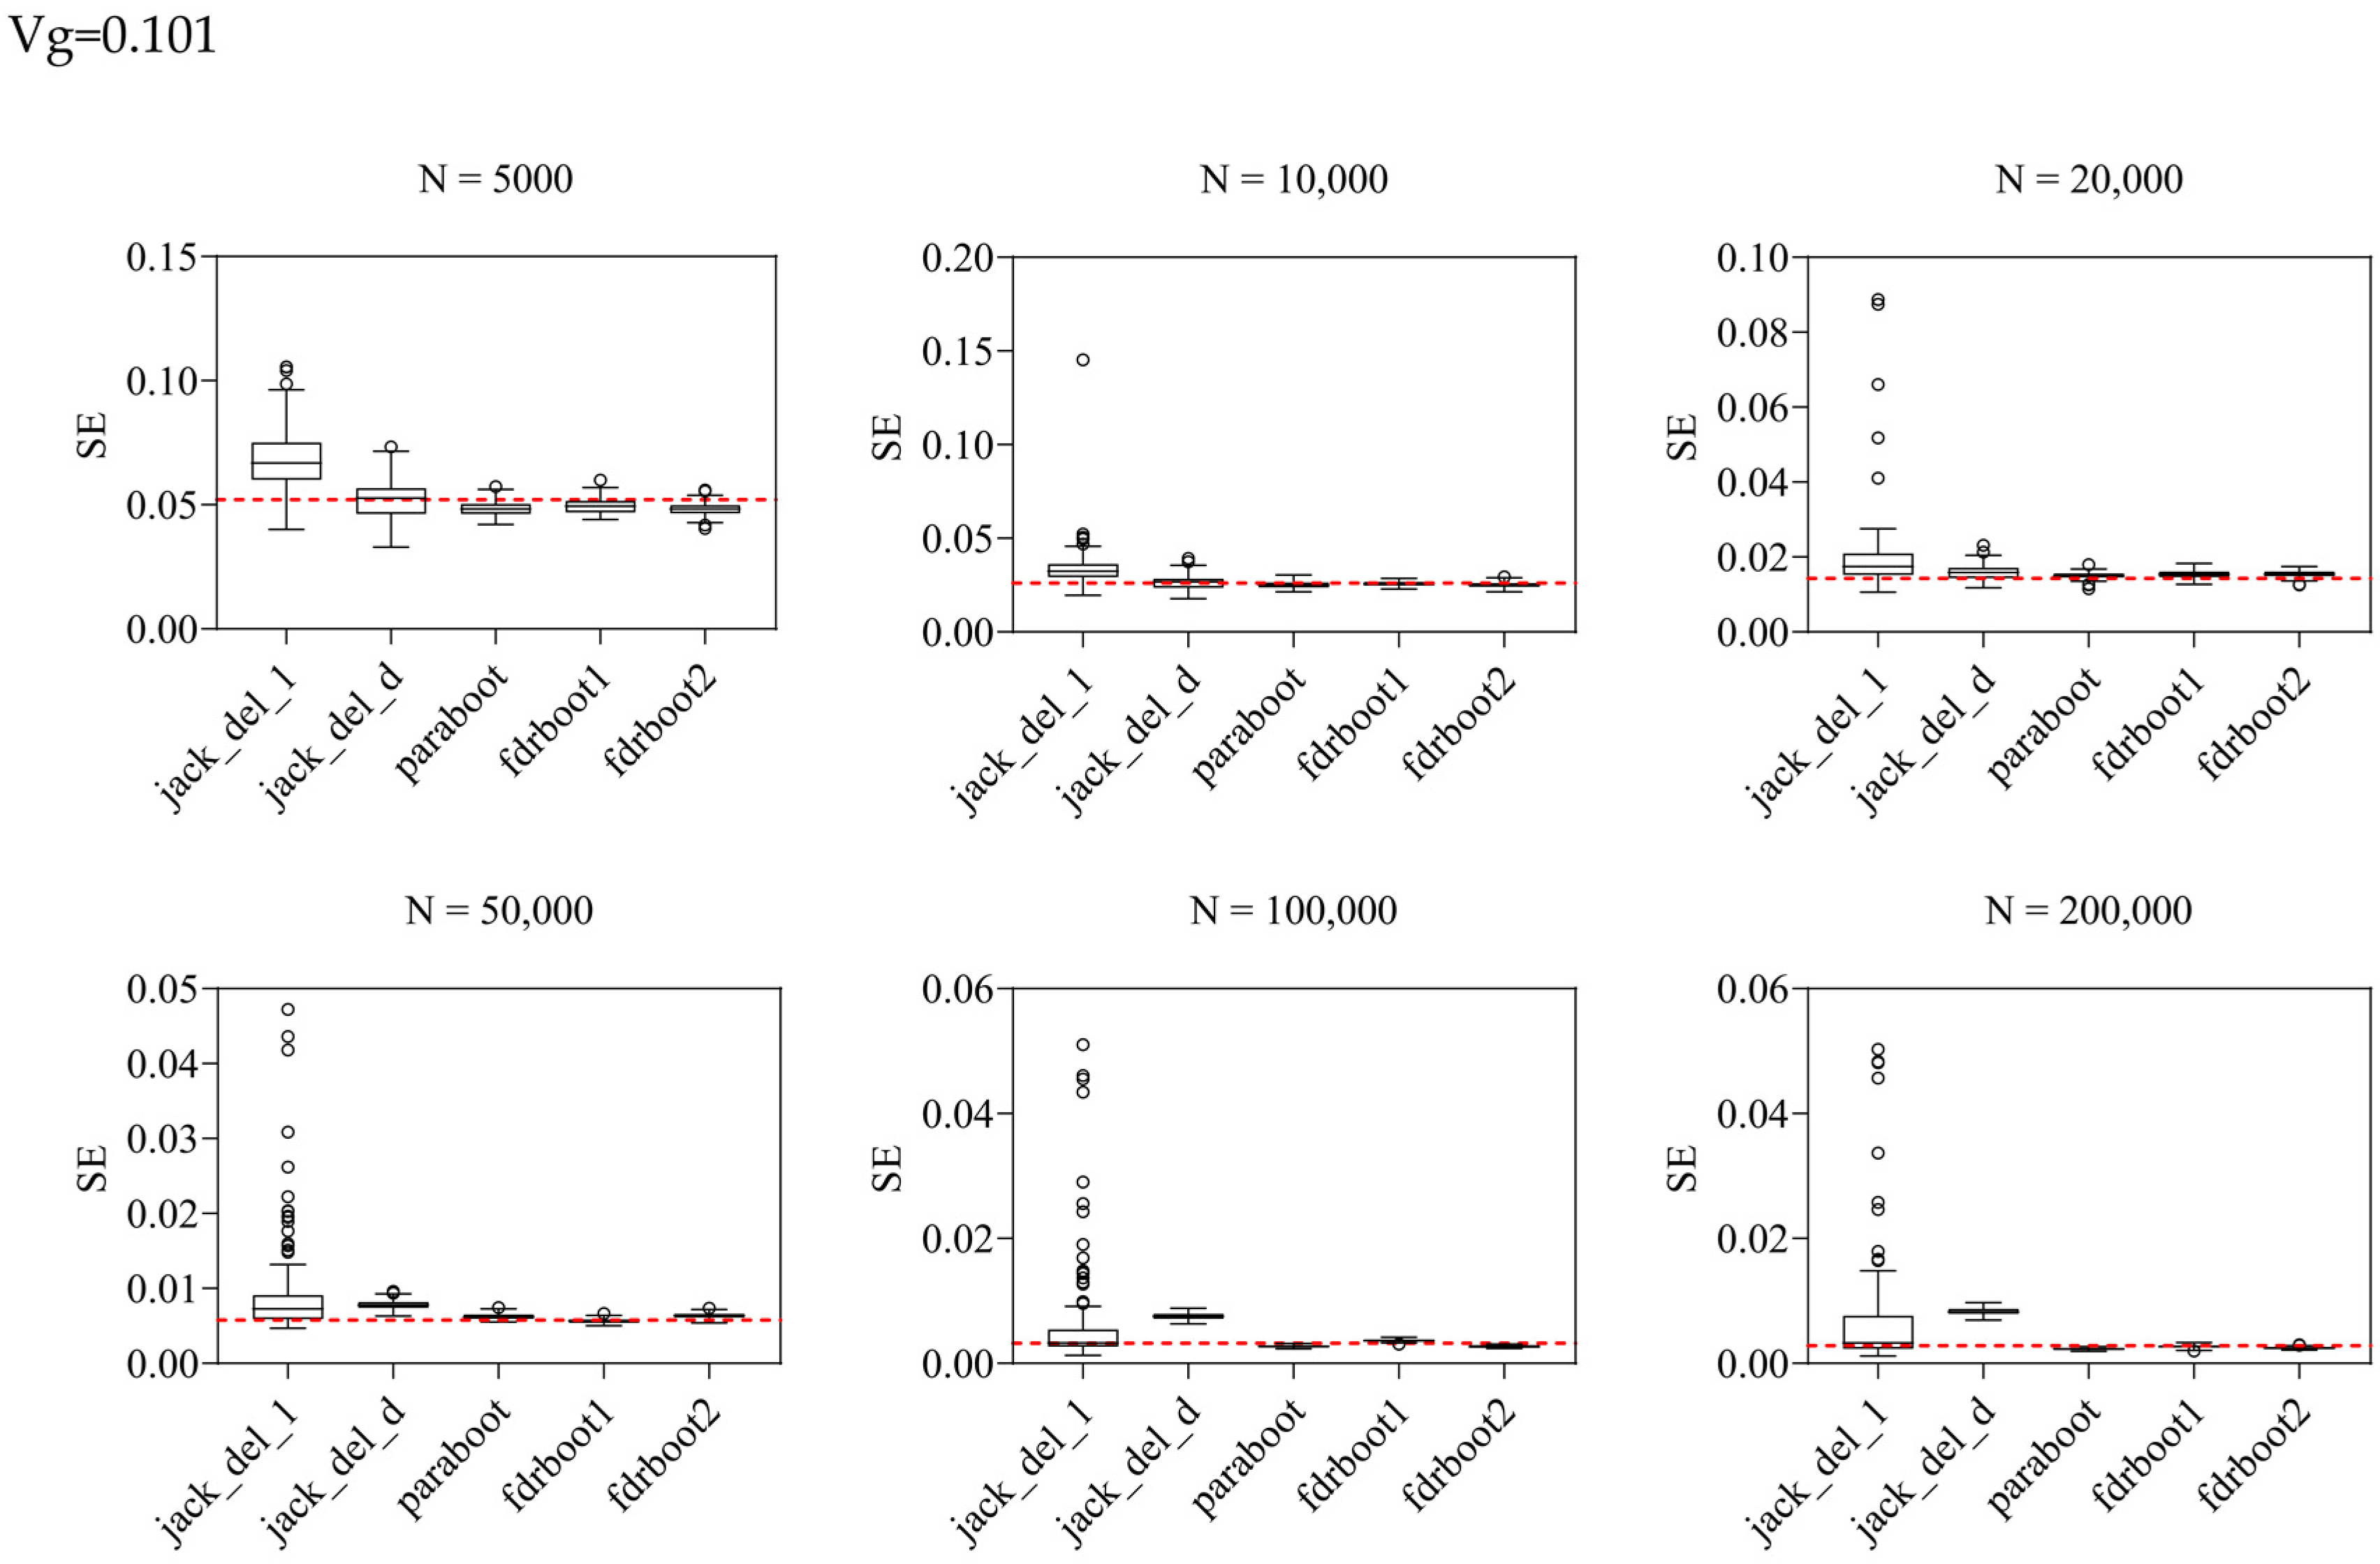
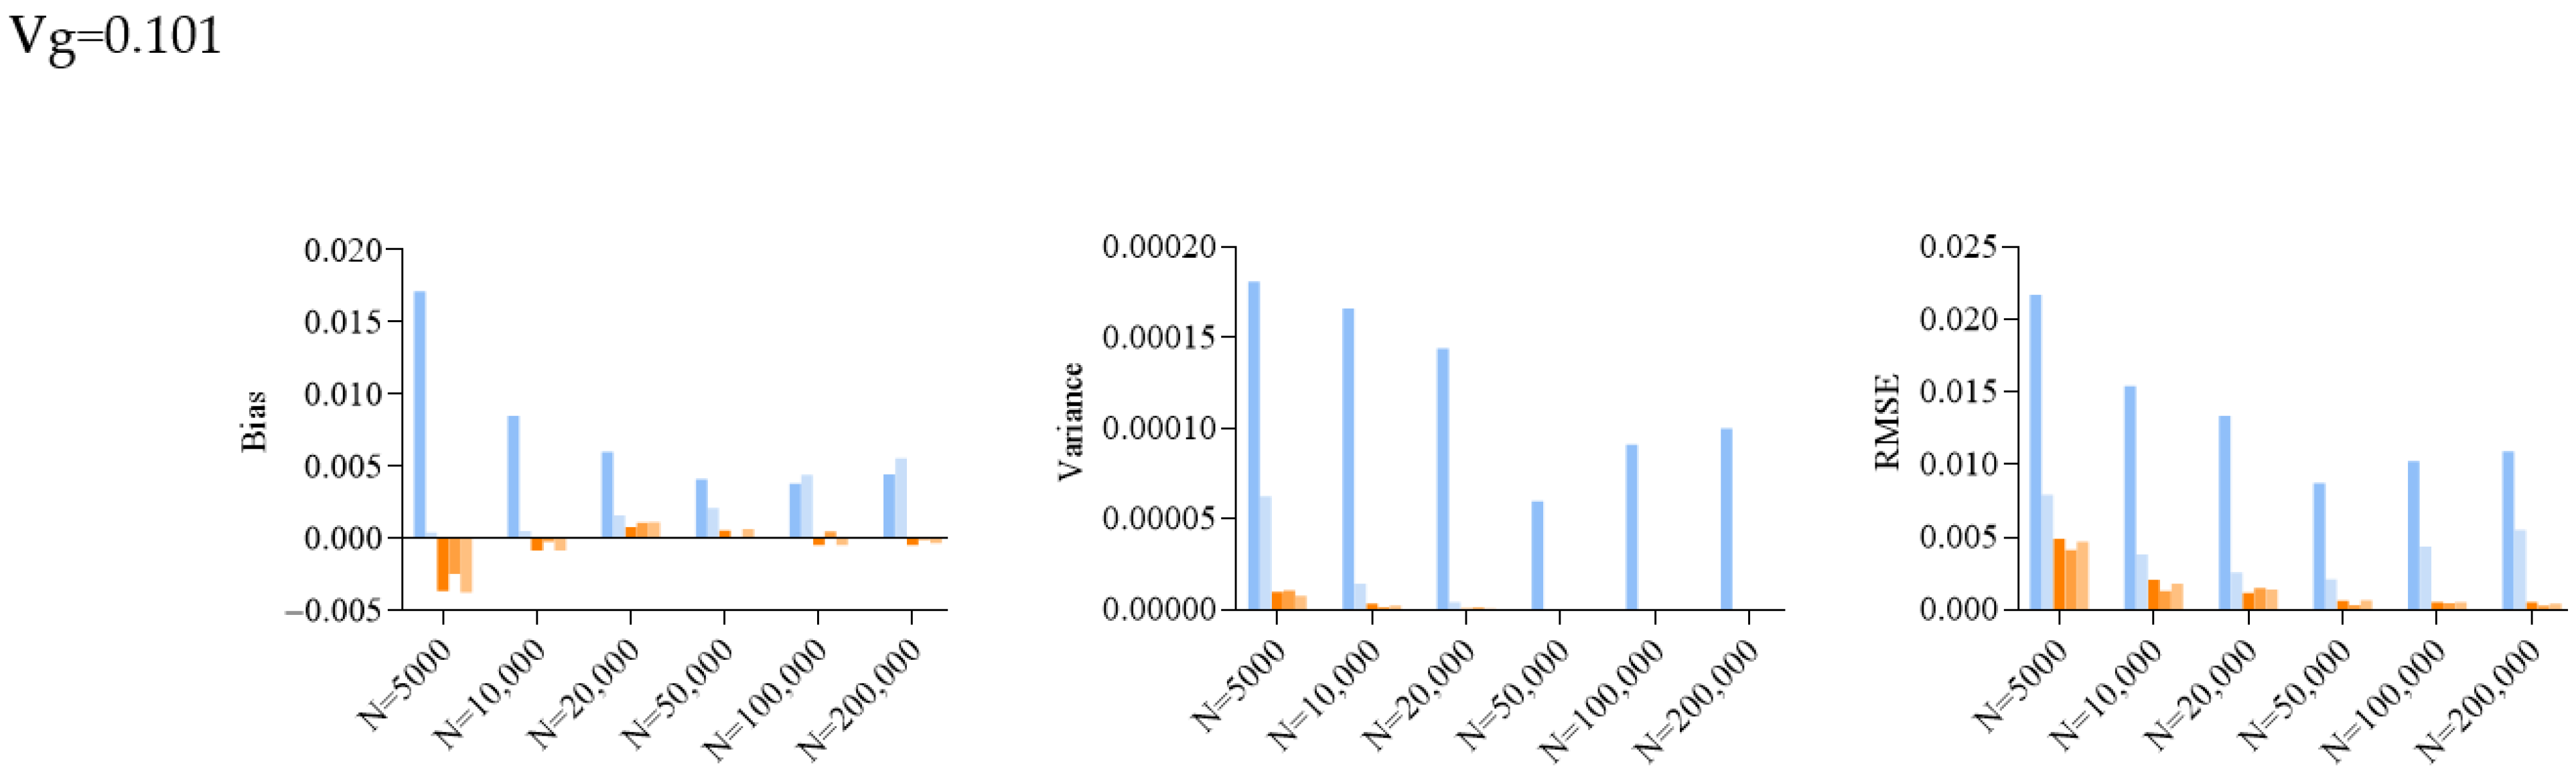
2.2. Simulation Results for SE Estimation
2.3. Performance of Different CI Construction Methods
2.4. Results on Immune Traits
2.5. R Package Implementation
3. Discussion
4. Materials and Methods
4.1. Estimation of the Total Heritability Explained (Vg)
4.1.1. Estimation of Total Vg Based on Tweedie’s Formula
4.1.2. Conversion of z-Statistics to Vg
4.1.3. Assumptions
4.1.4. An Alternative Conditional Estimator
4.2. Estimation of the Standard Error (SE) of Vg
4.2.1. Standard and Delete-d-Jackknife to Estimate SE
4.2.2. Parametric Bootstrap Approaches for Estimating SE
4.3. Construction of Confidence Intervals (CIs): An Exploratory Analysis
4.3.1. Normal Approximation (Standard Approach)
4.3.2. Percentile Approach
4.3.3. Union CI
- Normal approximation (standard approach), without bias correction (one estimator) or with bootstrap bias correction (3 estimators), then take the union of CIs;
- Percentile approach, without bias correction (3 estimators) and with bias correction (3 estimators), then take the union of CIs;
- Union of the final CI obtained from 1 and 2.
4.4. Simulation Studies
4.5. Application to Immune Traits
Supplementary Materials
Author Contributions
Funding
Institutional Review Board Statement
Informed Consent Statement
Data Availability Statement
Acknowledgments
Conflicts of Interest
References
- Yang, J.; Benyamin, B.; McEvoy, B.P.; Gordon, S.; Henders, A.K.; Nyholt, D.R.; Madden, P.A.; Heath, A.C.; Martin, N.G.; Montgomery, G.W. Common SNPs explain a large proportion of the heritability for human height. Nat. Genet. 2010, 42, 565–569. [Google Scholar] [CrossRef] [PubMed]
- Speed, D.; Hemani, G.; Johnson, M.R.; Balding, D.J. Improved heritability estimation from genome-wide SNPs. Am. J. Hum. Genet. 2012, 91, 1011–1021. [Google Scholar] [CrossRef] [PubMed]
- Bulik-Sullivan, B.K.; Loh, P.R.; Finucane, H.K.; Ripke, S.; Yang, J.; Schizophrenia Working Group of the Psychiatric Genomics Consortium; Patterson, N.; Daly, M.J.; Price, A.L.; Neale, B.M. LD Score regression distinguishes confounding from polygenicity in genome-wide association studies. Nat. Genet. 2015, 47, 291–295. [Google Scholar] [CrossRef] [PubMed]
- Speed, D.; Balding, D.J. SumHer better estimates the SNP heritability of complex traits from summary statistics. Nat. Genet. 2019, 51, 277–284. [Google Scholar] [CrossRef]
- Zhu, H.; Zhou, X. Statistical methods for SNP heritability estimation and partition: A review. Comput. Struct. Biotechnol. J. 2020, 18, 1557–1568. [Google Scholar] [CrossRef]
- Barry, C.-J.S.; Walker, V.M.; Cheesman, R.; Davey Smith, G.; Morris, T.T.; Davies, N.M. How to estimate heritability: A guide for genetic epidemiologists. Int. J. Epidemiol. 2023, 52, 624–632. [Google Scholar] [CrossRef]
- Zuk, O.; Hechter, E.; Sunyaev, S.R.; Lander, E.S. The mystery of missing heritability: Genetic interactions create phantom heritability. Proc. Natl. Acad. Sci. USA 2012, 109, 1193–1198. [Google Scholar] [CrossRef]
- Brandes, N.; Weissbrod, O.; Linial, M. Open problems in human trait genetics. Genome Biol. 2022, 23, 131. [Google Scholar] [CrossRef] [PubMed]
- Young, A.I. Solving the missing heritability problem. PLoS Genet. 2019, 15, e1008222. [Google Scholar] [CrossRef]
- So, H.C.; Li, M.; Sham, P.C. Uncovering the total heritability explained by all true susceptibility variants in a genome-wide association study. Genet. Epidemiol. 2011, 35, 447–456. [Google Scholar] [CrossRef]
- Robbins, H. An empirical Bayes approach to statistics. In Proceedings of the Third Berkeley Symposium on Mathematical Statistics and Probability, Cambridge, UK, 26–31 December 1954, July and August 1955; University of California Press: Berkeley, CA, USA; Los Angeles, CA, USA, 1956; Volume 1, pp. 157–163. [Google Scholar]
- Brown, L.D. Admissible estimators, recurrent diffusions, and insoluble boundary value problems. Ann. Math. Stat. 1971, 42, 855–903. [Google Scholar] [CrossRef]
- Efron, B. Empirical Bayes estimates for large-scale prediction problems. J. Am. Stat. Assoc. 2009, 104, 1015–1028. [Google Scholar] [CrossRef]
- Zhang, Y.; Cheng, Y.; Jiang, W.; Ye, Y.; Lu, Q.; Zhao, H. Comparison of methods for estimating genetic correlation between complex traits using GWAS summary statistics. Brief. Bioinform. 2021, 22, bbaa442. [Google Scholar] [CrossRef] [PubMed]
- Benke, K.S.; Nivard, M.G.; Velders, F.P.; Walters, R.K.; Pappa, I.; Scheet, P.A.; Xiao, X.; Ehli, E.A.; Palmer, L.J.; Whitehouse, A.J.; et al. A genome-wide association meta-analysis of preschool internalizing problems. J. Am. Acad. Child. Adolesc. Psychiatry 2014, 53, 667–676.e667. [Google Scholar] [CrossRef] [PubMed]
- Lubke, G.H.; Hottenga, J.J.; Walters, R.; Laurin, C.; de Geus, E.J.; Willemsen, G.; Smit, J.H.; Middeldorp, C.M.; Penninx, B.W.; Vink, J.M.; et al. Estimating the genetic variance of major depressive disorder due to all single nucleotide polymorphisms. Biol. Psychiatry 2012, 72, 707–709. [Google Scholar] [CrossRef]
- van Beek, J.H.; Lubke, G.H.; de Moor, M.H.; Willemsen, G.; de Geus, E.J.; Hottenga, J.J.; Walters, R.K.; Smit, J.H.; Penninx, B.W.; Boomsma, D.I. Heritability of liver enzyme levels estimated from genome-wide SNP data. Eur. J. Hum. Genet. 2014, 23, 1223–1228. [Google Scholar] [CrossRef]
- Hibar, D.P.; Stein, J.L.; Renteria, M.E.; Arias-Vasquez, A.; Desrivieres, S.; Jahanshad, N.; Toro, R.; Wittfeld, K.; Abramovic, L.; Andersson, M.; et al. Common genetic variants influence human subcortical brain structures. Nature 2015, 520, 224–229. [Google Scholar] [CrossRef]
- Paternoster, L.; Standl, M.; Waage, J.; Baurecht, H.; Hotze, M.; Strachan, D.P.; Curtin, J.A.; Bonnelykke, K.; Tian, C.; Takahashi, A.; et al. Multi-ancestry genome-wide association study of 21,000 cases and 95,000 controls identifies new risk loci for atopic dermatitis. Nat. Genet. 2015, 47, 1449–1456. [Google Scholar] [CrossRef]
- Lo, M.T.; Hinds, D.A.; Tung, J.Y.; Franz, C.; Fan, C.C.; Wang, Y.; Smeland, O.B.; Schork, A.; Holland, D.; Kauppi, K.; et al. Genome-wide analyses for personality traits identify six genomic loci and show correlations with psychiatric disorders. Nat. Genet. 2017, 49, 152–156. [Google Scholar] [CrossRef] [PubMed]
- Minica, C.C.; Verweij, K.J.H.; van der Most, P.J.; Mbarek, H.; Bernard, M.; van Eijk, K.R.; Lind, P.A.; Liu, M.Z.; Maciejewski, D.F.; Palviainen, T.; et al. Genome-wide association meta-analysis of age at first cannabis use. Addiction 2018, 113, 2073–2086. [Google Scholar] [CrossRef] [PubMed]
- Ahluwalia, T.S.; Prins, B.P.; Abdollahi, M.; Armstrong, N.J.; Aslibekyan, S.; Bain, L.; Jefferis, B.; Baumert, J.; Beekman, M.; Ben-Shlomo, Y.; et al. Genome-wide association study of circulating interleukin 6 levels identifies novel loci. Hum. Mol. Genet. 2021, 30, 393–409. [Google Scholar] [CrossRef]
- Shin, S.H.; Park, S.; Wright, C.; D’Astous, V.A.; Kim, G. The Role of Polygenic Score and Cognitive Activity in Cognitive Functioning Among Older Adults. Gerontologist 2021, 61, 319–329. [Google Scholar] [CrossRef] [PubMed]
- Ahola-Olli, A.V.; Würtz, P.; Havulinna, A.S.; Aalto, K.; Pitkänen, N.; Lehtimäki, T.; Kähönen, M.; Lyytikäinen, L.P.; Raitoharju, E.; Seppälä, I.; et al. Genome-wide Association Study Identifies 27 Loci Influencing Concentrations of Circulating Cytokines and Growth Factors. Am. J. Hum. Genet. 2017, 100, 40–50. [Google Scholar] [CrossRef] [PubMed]
- Turner, M.D.; Nedjai, B.; Hurst, T.; Pennington, D.J. Cytokines and chemokines: At the crossroads of cell signalling and inflammatory disease. Biochim. Biophys. Acta (BBA)—Mol. Cell Res. 2014, 1843, 2563–2582. [Google Scholar] [CrossRef] [PubMed]
- Steinsaltz, D.; Dahl, A.; Wachter, K.W. On Negative Heritability and Negative Estimates of Heritability. Genetics 2020, 215, 343–357. [Google Scholar] [CrossRef] [PubMed]
- Wied, D.; Weißbach, R. Consistency of the kernel density estimator: A survey. Stat. Pap. 2012, 53, 1–21. [Google Scholar] [CrossRef]
- Efron, B. Tweedie’s formula and selection bias. J. Am. Stat. Assoc. 2011, 106, 1602. [Google Scholar] [CrossRef] [PubMed]
- Carry, P.M.; Vanderlinden, L.A.; Dong, F.; Buckner, T.; Litkowski, E.; Vigers, T.; Norris, J.M.; Kechris, K. Inverse probability weighting is an effective method to address selection bias during the analysis of high dimensional data. Genet. Epidemiol. 2021, 45, 593–603. [Google Scholar] [CrossRef]
- Horowitz, J.L. Bootstrap methods in econometrics. Annu. Rev. Econ. 2019, 11, 193–224. [Google Scholar] [CrossRef]
- Shao, J.; Wu, C.J. A general theory for jackknife variance estimation. Ann. Stat. 1989, 17, 1176–1197. [Google Scholar] [CrossRef]
- Zhong, H.; Prentice, R.L. Bias-reduced estimators and confidence intervals for odds ratios in genome-wide association studies. Biostatistics 2008, 9, 621–634. [Google Scholar] [CrossRef] [PubMed]
- Sun, L.; Bull, S.B. Reduction of selection bias in genomewide studies by resampling. Genet. Epidemiol. Off. Publ. Int. Genet. Epidemiol. Soc. 2005, 28, 352–367. [Google Scholar] [CrossRef] [PubMed]
- Zöllner, S.; Pritchard, J.K. Overcoming the winner’s curse: Estimating penetrance parameters from case-control data. Am. J. Hum. Genet. 2007, 80, 605–615. [Google Scholar] [CrossRef] [PubMed]
- Gillett, A.C.; Vassos, E.; Lewis, C.M. Transforming summary statistics from logistic regression to the liability scale: Application to genetic and environmental risk scores. Hum. Hered. 2019, 83, 210–224. [Google Scholar] [CrossRef]
- Efron, B.; Tibshirani, R.; Storey, J.D.; Tusher, V. Empirical Bayes analysis of a microarray experiment. J. Am. Stat. Assoc. 2001, 96, 1151–1160. [Google Scholar] [CrossRef]
- Miller, R.G. The jackknife—A review. Biometrika 1974, 61, 1–15. [Google Scholar]
- Chatterjee, S. Another look at the jackknife: Further examples of generalized bootstrap. Stat. Probab. Lett. 1998, 40, 307–319. [Google Scholar] [CrossRef]
- Efron, B.; Tibshirani, R.J. An Introduction to the Bootstrap; CRC Press: Boca Raton, FL, USA, 1994. [Google Scholar]
- Conley, T.G.; Hansen, C.B.; Rossi, P.E. Plausibly exogenous. Rev. Econ. Stat. 2012, 94, 260–272. [Google Scholar] [CrossRef]


| Sum_of_Vg | Sample_Size | Mean_Est | TRUE_SE | SE | ||||
|---|---|---|---|---|---|---|---|---|
| jack_del_1 | jack_del_d | paraboot | fdrboot1 | fdrboot2 | ||||
| 0.295 | 5000 | 0.232 | 0.0482 | 0.0672 | 0.0524 | 0.0488 | 0.0519 | 0.0489 |
| 10,000 | 0.210 | 0.0265 | 0.0353 | 0.0295 | 0.0285 | 0.0312 | 0.0287 | |
| 20,000 | 0.244 | 0.0158 | 0.0208 | 0.0185 | 0.0165 | 0.0156 | 0.0168 | |
| 50,000 | 0.283 | 0.0076 | 0.0149 | 0.0167 | 0.0063 | 0.0081 | 0.0063 | |
| 0.312 | 0.0063 | 0.0143 | 0.0172 | 0.0051 | 0.0055 | 0.0054 | ||
| 0.321 | 0.0045 | 0.0134 | 0.0161 | 0.0036 | 0.0038 | 0.0041 | ||
| 0.191 | 5000 | 0.207 | 0.0491 | 0.0706 | 0.0523 | 0.0486 | 0.0500 | 0.0485 |
| 10,000 | 0.147 | 0.0242 | 0.0357 | 0.0274 | 0.0263 | 0.0285 | 0.0265 | |
| 20,000 | 0.158 | 0.0159 | 0.0208 | 0.0166 | 0.0156 | 0.0162 | 0.0160 | |
| 50,000 | 0.174 | 0.0064 | 0.0113 | 0.0113 | 0.0061 | 0.0070 | 0.0061 | |
| 0.195 | 0.0045 | 0.0110 | 0.0131 | 0.0040 | 0.0047 | 0.0041 | ||
| 0.207 | 0.0035 | 0.0103 | 0.0128 | 0.0031 | 0.0034 | 0.0035 | ||
| 0.101 | 5000 | 0.197 | 0.0521 | 0.0692 | 0.0524 | 0.0484 | 0.0496 | 0.0483 |
| 10,000 | 0.116 | 0.0260 | 0.0345 | 0.0265 | 0.0251 | 0.0257 | 0.0251 | |
| 20,000 | 0.098 | 0.0143 | 0.0202 | 0.0159 | 0.0150 | 0.0153 | 0.0154 | |
| 50,000 | 0.091 | 0.0058 | 0.0098 | 0.0078 | 0.0063 | 0.0057 | 0.0063 | |
| 0.094 | 0.0032 | 0.0069 | 0.0076 | 0.0027 | 0.0036 | 0.0027 | ||
| 0.107 | 0.0028 | 0.0072 | 0.0083 | 0.0023 | 0.0027 | 0.0025 | ||
| Sum_Vg | N | Bias of the Estimator for SE | Variance of the Estimator for SE | RMSE of the Estimator for SE | ||||||||||||
|---|---|---|---|---|---|---|---|---|---|---|---|---|---|---|---|---|
| jack_del_1 | jack_del_d | paraboot | fdrboot1 | fdrboot2 | jack_del_1 | jack_del_d | paraboot | fdrboot1 | fdrboot2 | jack_del_1 | jack_del_d | paraboot | fdrboot1 | fdrboot2 | ||
| 0.295 | 5000 | 1.91 | 4.26 | 5.92 × 10⁻⁴ | 3.73 | 7.16 | 1.77 | 5.14 | 1.26 | 1.15 | 9.30 × 10⁻⁶ | 2.32 | 8.34 | 3.59 | 5.04 | 3.13 × 10⁻³ |
| 10,000 | 8.81 | 2.98 | 2.00 × 10⁻³ | 4.66 | 2.25 | 7.34 | 1.21 | 3.87 | 4.99 | 3.62 × 10⁻⁶ | 1.23 | 4.58 | 2.80 × 10⁻³ | 5.17 | 2.94 | |
| 20,000 | 5.04 | 2.78 | 7.37 | −1.46 × 10⁻⁴ | 1.07 | 9.06 | 2.27 | 8.33 × 10⁻⁷ | 1.12 | 1.00 | 1.08 | 3.16 | 1.17 | 1.07 × 10⁻³ | 1.47 | |
| 50,000 | 7.25 | 9.03 | −1.32 | 4.68 × 10⁻⁴ | −1.30 | 1.29 | 1.45 | 1.36 | 1.93 | 1.30 × 10⁻⁷ | 1.35 | 9.11 | 1.37 | 6.42 × 10⁻⁴ | 1.35 | |
| 7.97 | 1.09 | −1.20 | −8.78 × 10⁻⁴ | −9.34 | 1.41 | 1.52 | 8.11 × 10⁻⁸ | 3.48 | 1.00 | 1.43 | 1.10 | 1.23 | 1.06 | 9.86 × 10⁻⁴ | ||
| 8.92 | 1.16 | −8.57 | −6.32 | −3.72 × 10⁻⁴ | 1.37 | 8.70 | 3.49 × 10⁻⁸ | 1.30 | 4.06 | 1.47 | 1.16 | 8.77 | 7.27 | 4.23 × 10⁻⁴ | ||
| 0.191 | 5000 | 2.16 | 3.21 | −5.02 × 10⁻⁴ | 9.69 | −5.23 | 5.53 | 5.41 | 1.07 | 1.02 | 8.58 × 10⁻⁶ | 3.19 | 8.03 | 3.31 | 3.34 | 2.98 × 10⁻³ |
| 10,000 | 1.15 | 3.16 | 2.04 × 10⁻³ | 4.22 | 2.29 | 2.80 | 1.43 | 4.88 | 2.98 × 10⁻⁶ | 5.03 | 2.03 | 4.93 | 3.01 × 10⁻³ | 4.56 | 3.20 | |
| 20,000 | 4.96 | 7.22 | −2.41 | 3.15 | 9.85 × 10⁻⁵ | 1.19 | 2.70 | 1.09 | 1.31 | 7.64 × 10⁻⁷ | 1.20 | 1.79 | 1.07 | 1.19 | 8.80 × 10⁻⁴ | |
| 50,000 | 4.90 | 4.83 | −2.92 × 10⁻⁴ | 5.76 | −2.97 | 1.10 | 8.17 | 1.66 | 1.50 | 1.24 × 10⁻⁷ | 1.16 | 4.91 | 5.01 | 6.94 | 4.60 × 10⁻⁴ | |
| 6.45 | 8.56 | −5.40 | 1.30 × 10⁻⁴ | −4.33 | 1.32 | 1.68 | 6.30 × 10⁻⁸ | 1.32 | 8.37 | 1.32 | 8.65 | 5.96 | 3.85 × 10⁻⁴ | 5.21 | ||
| 6.85 | 9.28 | −3.57 | −1.41 | −3.31 × 10⁻⁵ | 1.28 | 1.06 | 3.04 × 10⁻⁸ | 1.54 | 3.78 | 1.32 | 9.34 | 3.97 | 4.17 | 1.97 × 10⁻⁴ | ||
| 0.101 | 5000 | 1.71 | 3.38 × 10⁻⁴ | −3.72 | −2.54 | −3.81 | 1.81 | 6.26 | 1.01 | 1.07 | 7.70 × 10⁻⁶ | 2.17 | 7.92 | 4.90 | 4.14 × 10⁻³ | 4.71 |
| 10,000 | 8.45 | 4.62 | −8.81 | −2.84 × 10⁻⁴ | −9.03 | 1.66 | 1.45 | 3.49 | 1.66 × 10⁻⁶ | 2.46 | 1.54 | 3.83 | 2.07 | 1.32 × 10⁻³ | 1.81 | |
| 20,000 | 5.92 | 1.56 | 7.21 × 10⁻⁴ | 1.04 | 1.08 | 1.44 | 4.20 | 8.80 | 1.22 | 8.17 × 10⁻⁷ | 1.34 | 2.57 | 1.18 × 10⁻³ | 1.52 | 1.41 | |
| 50,000 | 4.03 | 2.04 | 4.91 | −1.02 × 10⁻⁴ | 5.85 | 6.00 | 4.31 | 1.61 | 1.08 × 10⁻⁷ | 1.26 | 8.73 | 2.15 | 6.34 | 3.44 × 10⁻⁴ | 6.85 | |
| 3.73 | 4.34 | −5.10 | 4.31 × 10⁻⁴ | −5.17 | 9.13 | 3.03 | 2.83 | 4.34 | 2.05 × 10⁻⁸ | 1.03 | 4.38 | 5.37 | 4.79 × 10⁻⁴ | 5.36 | ||
| 4.38 | 5.48 | −5.31 | −1.61 × 10⁻⁴ | −3.81 | 1.00 | 3.41 | 2.22 × 10⁻⁸ | 7.06 | 2.88 | 1.09 | 5.51 | 5.52 | 3.11 × 10⁻⁴ | 4.17 | ||
| N | Union CI Type | Coverage (Vg = 0.295) | Coverage (Vg = 0.191) | Coverage (Vg = 0.101) |
|---|---|---|---|---|
| 5000 | Standard | 0.75 | 0.97 | 0.77 |
| Percentile | 1 | 1 | 0.78 | |
| Standard + Percentile | 1 | 1 | 0.78 | |
| 10,000 | Standard | 0.6 | 0.67 | 0.94 |
| Percentile | 0.99 | 1 | 1 | |
| Standard + Percentile | 0.99 | 1 | 1 | |
| 20,000 | Standard | 0.89 | 0.84 | 0.96 |
| Percentile | 0.91 | 1 | 1 | |
| Standard + Percentile | 0.97 | 1 | 1 | |
| 50,000 | Standard | 1 | 1 | 0.9 |
| Percentile | 1 | 1 | 1 | |
| Standard + Percentile | 1 | 1 | 1 | |
| Standard | 1 | 1 | 1 | |
| Percentile | 1 | 1 | 1 | |
| Standard + Percentile | 1 | 1 | 1 | |
| Standard | 0.96 | 1 | 1 | |
| Percentile | 0.13 | 0.66 | 1 | |
| Standard+Percentile | 0.96 | 1 | 1 |
| Trait | Abbreviation | GWAS ID | N | SNP_h2 (LDSC) | SNP_h2_se (LDSC) |
|---|---|---|---|---|---|
| Stem cell factor | SCF | ebi-a-GCST004429 | 8290 | −0.06 | 0.055 |
| Interleukin-4 | IL4 | ebi-a-GCST004453 | 8124 | −0.0446 | 0.0595 |
| Interleukin-17 | IL17 | ebi-a-GCST004442 | 7760 | −0.0407 | 0.0623 |
| Hepatocyte growth factor | HGF | ebi-a-GCST004449 | 8292 | −0.0311 | 0.0579 |
| Basic fibroblast growth factor | FGFBasic | ebi-a-GCST004459 | 7565 | −0.0159 | 0.0597 |
| Stromal cell-derived factor-1 alpha (CXCL12) | SDF1a | ebi-a-GCST004427 | 5998 | −0.0116 | 0.0713 |
| Interleukin-6 | IL6 | ebi-a-GCST004446 | 8189 | −0.0071 | 0.0568 |
| Platelet derived growth factor BB | PDGFbb | ebi-a-GCST004432 | 8293 | −0.0043 | 0.0624 |
| TNF-related apoptosis inducing ligand | TRAIL | ebi-a-GCST004424 | 8186 | 0.0125 | 0.0613 |
| Interferon-gamma | IFNg | ebi-a-GCST004456 | 7701 | 0.0134 | 0.0624 |
| Granulocyte colony-stimulating factor | GCSF | ebi-a-GCST004458 | 7904 | 0.0173 | 0.0601 |
| Interleukin-10 | IL10 | ebi-a-GCST004444 | 7681 | 0.0186 | 0.0691 |
| Trait | N | LDSC | SumVg | ||||||||
|---|---|---|---|---|---|---|---|---|---|---|---|
| h2 | se | h2 | r2 | n_pruned_snp | se_jack1 | se_jack_del_d | se_paraboot | se_fdrboot1 | se_fdrboot2 | ||
| SCF | 8290 | −0.06 | 0.055 | 0.333 | 0.1 | 428,593 | 0.0926 | 0.0822 | 0.0679 | 0.0443 | 0.0514 |
| 0.185 | 0.05 | 251,008 | 0.0526 | 0.0456 | 0.0467 | 0.0502 | 0.0517 | ||||
| 0.105 | 0.025 | 127,908 | 0.0307 | 0.0313 | 0.0272 | 0.0397 | 0.0335 | ||||
| 0.100 | 0.01 | 61,938 | 0.0310 | 0.0200 | 0.0220 | 0.0252 | 0.0265 | ||||
| 0.092 | 0.005 | 51,370 | 0.0229 | 0.0169 | 0.0201 | 0.0235 | 0.0230 | ||||
| 0.101 | 0.002 | 48,088 | 0.0319 | 0.0153 | 0.0220 | 0.0226 | 0.0198 | ||||
| 0.102 | 0.001 | 47,108 | 0.0316 | 0.0155 | 0.0223 | 0.0216 | 0.0188 | ||||
| IL4 | 8124 | −0.0446 | 0.0595 | 0.503 | 0.1 | 427,005 | 0.1218 | 0.1133 | 0.0616 | 0.0563 | 0.0569 |
| 0.377 | 0.05 | 249,710 | 0.1000 | 0.0823 | 0.0484 | 0.0445 | 0.0453 | ||||
| 0.302 | 0.025 | 127,248 | 0.0650 | 0.0594 | 0.0318 | 0.0365 | 0.0336 | ||||
| 0.235 | 0.01 | 61,685 | 0.0529 | 0.0313 | 0.0247 | 0.0240 | 0.0236 | ||||
| 0.215 | 0.005 | 51,196 | 0.0472 | 0.0278 | 0.0227 | 0.0217 | 0.0221 | ||||
| 0.197 | 0.002 | 47,878 | 0.0571 | 0.0273 | 0.0228 | 0.0225 | 0.0253 | ||||
| 0.187 | 0.001 | 46,911 | 0.0482 | 0.0244 | 0.0198 | 0.0226 | 0.0242 | ||||
| IL17 | 7760 | −0.0407 | 0.0623 | 0.352 | 0.1 | 427,226 | 0.1240 | 0.0946 | 0.0692 | 0.0625 | 0.0609 |
| 0.228 | 0.05 | 250,259 | 0.0683 | 0.0668 | 0.0499 | 0.0495 | 0.0495 | ||||
| 0.299 | 0.025 | 127,479 | 0.0877 | 0.0568 | 0.0360 | 0.0380 | 0.0323 | ||||
| 0.234 | 0.01 | 61,756 | 0.0485 | 0.0340 | 0.0239 | 0.0267 | 0.0256 | ||||
| 0.196 | 0.005 | 51,215 | 0.0475 | 0.0295 | 0.0237 | 0.0190 | 0.0249 | ||||
| 0.195 | 0.002 | 47,887 | 0.0634 | 0.0231 | 0.0231 | 0.0226 | 0.0210 | ||||
| 0.188 | 0.001 | 46,931 | 0.0568 | 0.0242 | 0.0183 | 0.0211 | 0.0215 | ||||
| HGF | 8292 | −0.0311 | 0.0579 | 0.366 | 0.1 | 428,318 | 0.0917 | 0.0864 | 0.0569 | 0.0642 | 0.0593 |
| 0.242 | 0.05 | 250,843 | 0.0812 | 0.0722 | 0.0483 | 0.0492 | 0.0491 | ||||
| 0.205 | 0.025 | 127,850 | 0.0657 | 0.0488 | 0.0327 | 0.0326 | 0.0357 | ||||
| 0.098 | 0.01 | 61,906 | 0.0379 | 0.0224 | 0.0225 | 0.0260 | 0.0242 | ||||
| 0.115 | 0.005 | 51,301 | 0.0347 | 0.0199 | 0.0224 | 0.0230 | 0.0203 | ||||
| 0.111 | 0.002 | 47,878 | 0.0414 | 0.0162 | 0.0189 | 0.0211 | 0.0215 | ||||
| 0.108 | 0.001 | 46,934 | 0.0312 | 0.0171 | 0.0221 | 0.0208 | 0.0211 | ||||
| FGFBasic | 7565 | −0.0159 | 0.0597 | 0.269 | 0.1 | 427,284 | 0.0835 | 0.0902 | 0.0656 | 0.0530 | 0.0577 |
| 0.217 | 0.05 | 249,930 | 0.0891 | 0.0604 | 0.0473 | 0.0504 | 0.0468 | ||||
| 0.117 | 0.025 | 127,587 | 0.0452 | 0.0431 | 0.0340 | 0.0363 | 0.0358 | ||||
| 0.133 | 0.01 | 61,911 | 0.0408 | 0.0301 | 0.0232 | 0.0239 | 0.0275 | ||||
| 0.135 | 0.005 | 51,259 | 0.0376 | 0.0243 | 0.0242 | 0.0267 | 0.0219 | ||||
| 0.143 | 0.002 | 47,874 | 0.0362 | 0.0218 | 0.0185 | 0.0233 | 0.0245 | ||||
| 0.126 | 0.001 | 46,914 | 0.0392 | 0.0206 | 0.0227 | 0.0214 | 0.0208 | ||||
| SDF1a | 5998 | −0.0116 | 0.0713 | 0.395 | 0.1 | 425,165 | 0.1120 | 0.1068 | 0.0731 | 0.0757 | 0.0870 |
| 0.256 | 0.05 | 248,727 | 0.0872 | 0.0750 | 0.0580 | 0.0565 | 0.0631 | ||||
| 0.213 | 0.025 | 126,986 | 0.0707 | 0.0462 | 0.0431 | 0.0472 | 0.0468 | ||||
| 0.163 | 0.01 | 61,680 | 0.0497 | 0.0380 | 0.0359 | 0.0349 | 0.0324 | ||||
| 0.190 | 0.005 | 51,092 | 0.0708 | 0.0318 | 0.0250 | 0.0297 | 0.0270 | ||||
| 0.165 | 0.002 | 47,702 | 0.0447 | 0.0270 | 0.0294 | 0.0304 | 0.0301 | ||||
| 0.159 | 0.001 | 46,789 | 0.0512 | 0.0232 | 0.0279 | 0.0258 | 0.0308 | ||||
| IL6 | 8189 | −0.0071 | 0.0568 | 0.422 | 0.1 | 427,566 | 0.0878 | 0.0896 | 0.0510 | 0.0575 | 0.0594 |
| 0.227 | 0.05 | 250,247 | 0.0620 | 0.0713 | 0.0402 | 0.0463 | 0.0468 | ||||
| 0.158 | 0.025 | 127,503 | 0.0672 | 0.0457 | 0.0372 | 0.0300 | 0.0360 | ||||
| 0.139 | 0.01 | 61,931 | 0.0606 | 0.0258 | 0.0220 | 0.0247 | 0.0220 | ||||
| 0.114 | 0.005 | 51,332 | 0.0288 | 0.0176 | 0.0196 | 0.0227 | 0.0236 | ||||
| 0.115 | 0.002 | 47,930 | 0.0302 | 0.0164 | 0.0191 | 0.0226 | 0.0202 | ||||
| 0.117 | 0.001 | 46,944 | 0.0319 | 0.0175 | 0.0227 | 0.0209 | 0.0211 | ||||
| PDGFbb | 8293 | −0.0043 | 0.0624 | 0.432 | 0.1 | 427,743 | 0.0907 | 0.0993 | 0.0726 | 0.0653 | 0.0676 |
| 0.341 | 0.05 | 250,325 | 0.0670 | 0.0808 | 0.0600 | 0.0496 | 0.0576 | ||||
| 0.307 | 0.025 | 127,567 | 0.0735 | 0.0554 | 0.0370 | 0.0334 | 0.0326 | ||||
| 0.154 | 0.01 | 61,789 | 0.0372 | 0.0250 | 0.0213 | 0.0245 | 0.0243 | ||||
| 0.125 | 0.005 | 51,140 | 0.0310 | 0.0226 | 0.0234 | 0.0230 | 0.0221 | ||||
| 0.120 | 0.002 | 47,822 | 0.0258 | 0.0205 | 0.0214 | 0.0208 | 0.0233 | ||||
| 0.117 | 0.001 | 46,853 | 0.0392 | 0.0192 | 0.0201 | 0.0209 | 0.0226 | ||||
| TRAIL | 8186 | 0.0125 | 0.0613 | 0.559 | 0.1 | 423,391 | 0.0613 | 0.1018 | 0.0785 | 0.0790 | 0.0750 |
| 0.304 | 0.05 | 247,717 | 0.0543 | 0.1190 | 0.0526 | 0.0503 | 0.0439 | ||||
| 0.242 | 0.025 | 126,350 | 0.0607 | 0.0647 | 0.0321 | 0.0362 | 0.0370 | ||||
| 0.128 | 0.01 | 61,114 | 0.0316 | 0.0251 | 0.0242 | 0.0229 | 0.0277 | ||||
| 0.127 | 0.005 | 50,633 | 0.0298 | 0.0231 | 0.0255 | 0.0239 | 0.0268 | ||||
| 0.128 | 0.002 | 47,359 | 0.0332 | 0.0216 | 0.0233 | 0.0215 | 0.0266 | ||||
| 0.121 | 0.001 | 46,415 | 0.0358 | 0.0195 | 0.0222 | 0.0229 | 0.0256 | ||||
| IFNg | 7701 | 0.0134 | 0.0624 | 0.393 | 0.1 | 426,740 | 0.0946 | 0.0811 | 0.0528 | 0.0590 | 0.0594 |
| 0.241 | 0.05 | 249,818 | 0.0655 | 0.0628 | 0.0553 | 0.0520 | 0.0509 | ||||
| 0.244 | 0.025 | 127,514 | 0.0734 | 0.0582 | 0.0330 | 0.0406 | 0.0320 | ||||
| 0.138 | 0.01 | 61,890 | 0.0289 | 0.0303 | 0.0267 | 0.0239 | 0.0257 | ||||
| 0.138 | 0.005 | 51,314 | 0.0424 | 0.0201 | 0.0222 | 0.0248 | 0.0293 | ||||
| 0.141 | 0.002 | 47,918 | 0.0321 | 0.0204 | 0.0251 | 0.0248 | 0.0286 | ||||
| 0.137 | 0.001 | 46,934 | 0.0253 | 0.0183 | 0.0223 | 0.0246 | 0.0233 | ||||
| GCSF | 7904 | 0.0173 | 0.0601 | 0.246 | 0.1 | 427,393 | 0.0707 | 0.0820 | 0.0620 | 0.0604 | 0.0580 |
| 0.198 | 0.05 | 250,222 | 0.0636 | 0.0607 | 0.0402 | 0.0436 | 0.0486 | ||||
| 0.164 | 0.025 | 127,583 | 0.0501 | 0.0415 | 0.0302 | 0.0360 | 0.0327 | ||||
| 0.142 | 0.01 | 61,846 | 0.0434 | 0.0257 | 0.0280 | 0.0239 | 0.0257 | ||||
| 0.122 | 0.005 | 51,266 | 0.0379 | 0.0196 | 0.0205 | 0.0247 | 0.0238 | ||||
| 0.120 | 0.002 | 47,919 | 0.0413 | 0.0183 | 0.0219 | 0.0236 | 0.0201 | ||||
| 0.112 | 0.001 | 46,939 | 0.0312 | 0.0159 | 0.0234 | 0.0207 | 0.0202 | ||||
| IL10 | 7681 | 0.0186 | 0.0691 | 0.331 | 0.1 | 427,218 | 0.0621 | 0.1019 | 0.0584 | NA | NA |
| 0.310 | 0.05 | 250,109 | 0.0670 | 0.0858 | 0.0448 | NA | NA | ||||
| 0.198 | 0.025 | 127,543 | 0.0566 | 0.0463 | 0.0356 | 0.0382 | 0.0406 | ||||
| 0.130 | 0.01 | 61,944 | 0.0328 | 0.0225 | 0.0251 | 0.0268 | 0.0258 | ||||
| 0.141 | 0.005 | 51,257 | 0.0400 | 0.0220 | 0.0237 | 0.0282 | 0.0238 | ||||
| 0.148 | 0.002 | 47,880 | 0.0433 | 0.0183 | 0.0204 | 0.0271 | 0.0231 | ||||
| 0.142 | 0.001 | 46,898 | 0.0317 | 0.0194 | 0.0219 | 0.0261 | 0.0228 | ||||
Disclaimer/Publisher’s Note: The statements, opinions and data contained in all publications are solely those of the individual author(s) and contributor(s) and not of MDPI and/or the editor(s). MDPI and/or the editor(s) disclaim responsibility for any injury to people or property resulting from any ideas, methods, instructions or products referred to in the content. |
© 2024 by the authors. Licensee MDPI, Basel, Switzerland. This article is an open access article distributed under the terms and conditions of the Creative Commons Attribution (CC BY) license (https://creativecommons.org/licenses/by/4.0/).
Share and Cite
So, H.-C.; Xue, X.; Ma, Z.; Sham, P.-C. SumVg: Total Heritability Explained by All Variants in Genome-Wide Association Studies Based on Summary Statistics with Standard Error Estimates. Int. J. Mol. Sci. 2024, 25, 1347. https://doi.org/10.3390/ijms25021347
So H-C, Xue X, Ma Z, Sham P-C. SumVg: Total Heritability Explained by All Variants in Genome-Wide Association Studies Based on Summary Statistics with Standard Error Estimates. International Journal of Molecular Sciences. 2024; 25(2):1347. https://doi.org/10.3390/ijms25021347
Chicago/Turabian StyleSo, Hon-Cheong, Xiao Xue, Zhijie Ma, and Pak-Chung Sham. 2024. "SumVg: Total Heritability Explained by All Variants in Genome-Wide Association Studies Based on Summary Statistics with Standard Error Estimates" International Journal of Molecular Sciences 25, no. 2: 1347. https://doi.org/10.3390/ijms25021347
APA StyleSo, H.-C., Xue, X., Ma, Z., & Sham, P.-C. (2024). SumVg: Total Heritability Explained by All Variants in Genome-Wide Association Studies Based on Summary Statistics with Standard Error Estimates. International Journal of Molecular Sciences, 25(2), 1347. https://doi.org/10.3390/ijms25021347