Statistical Approaches Based on Deep Learning Regression for Verification of Normality of Blood Pressure Estimates


Abstract
:1. Introduction
- We propose a new approach for estimating BP parameters that mitigates uncertainties (physiological variability), such as the CLs and standard deviation of errors, using the deep learning technique. To do so, we use a small sample of oscillometric BP measurements and bootstrap techniques for individual subjects.
- First, we perform the kurtosis and skewness tests to verify the normality of the BP measurements for individual subjects.
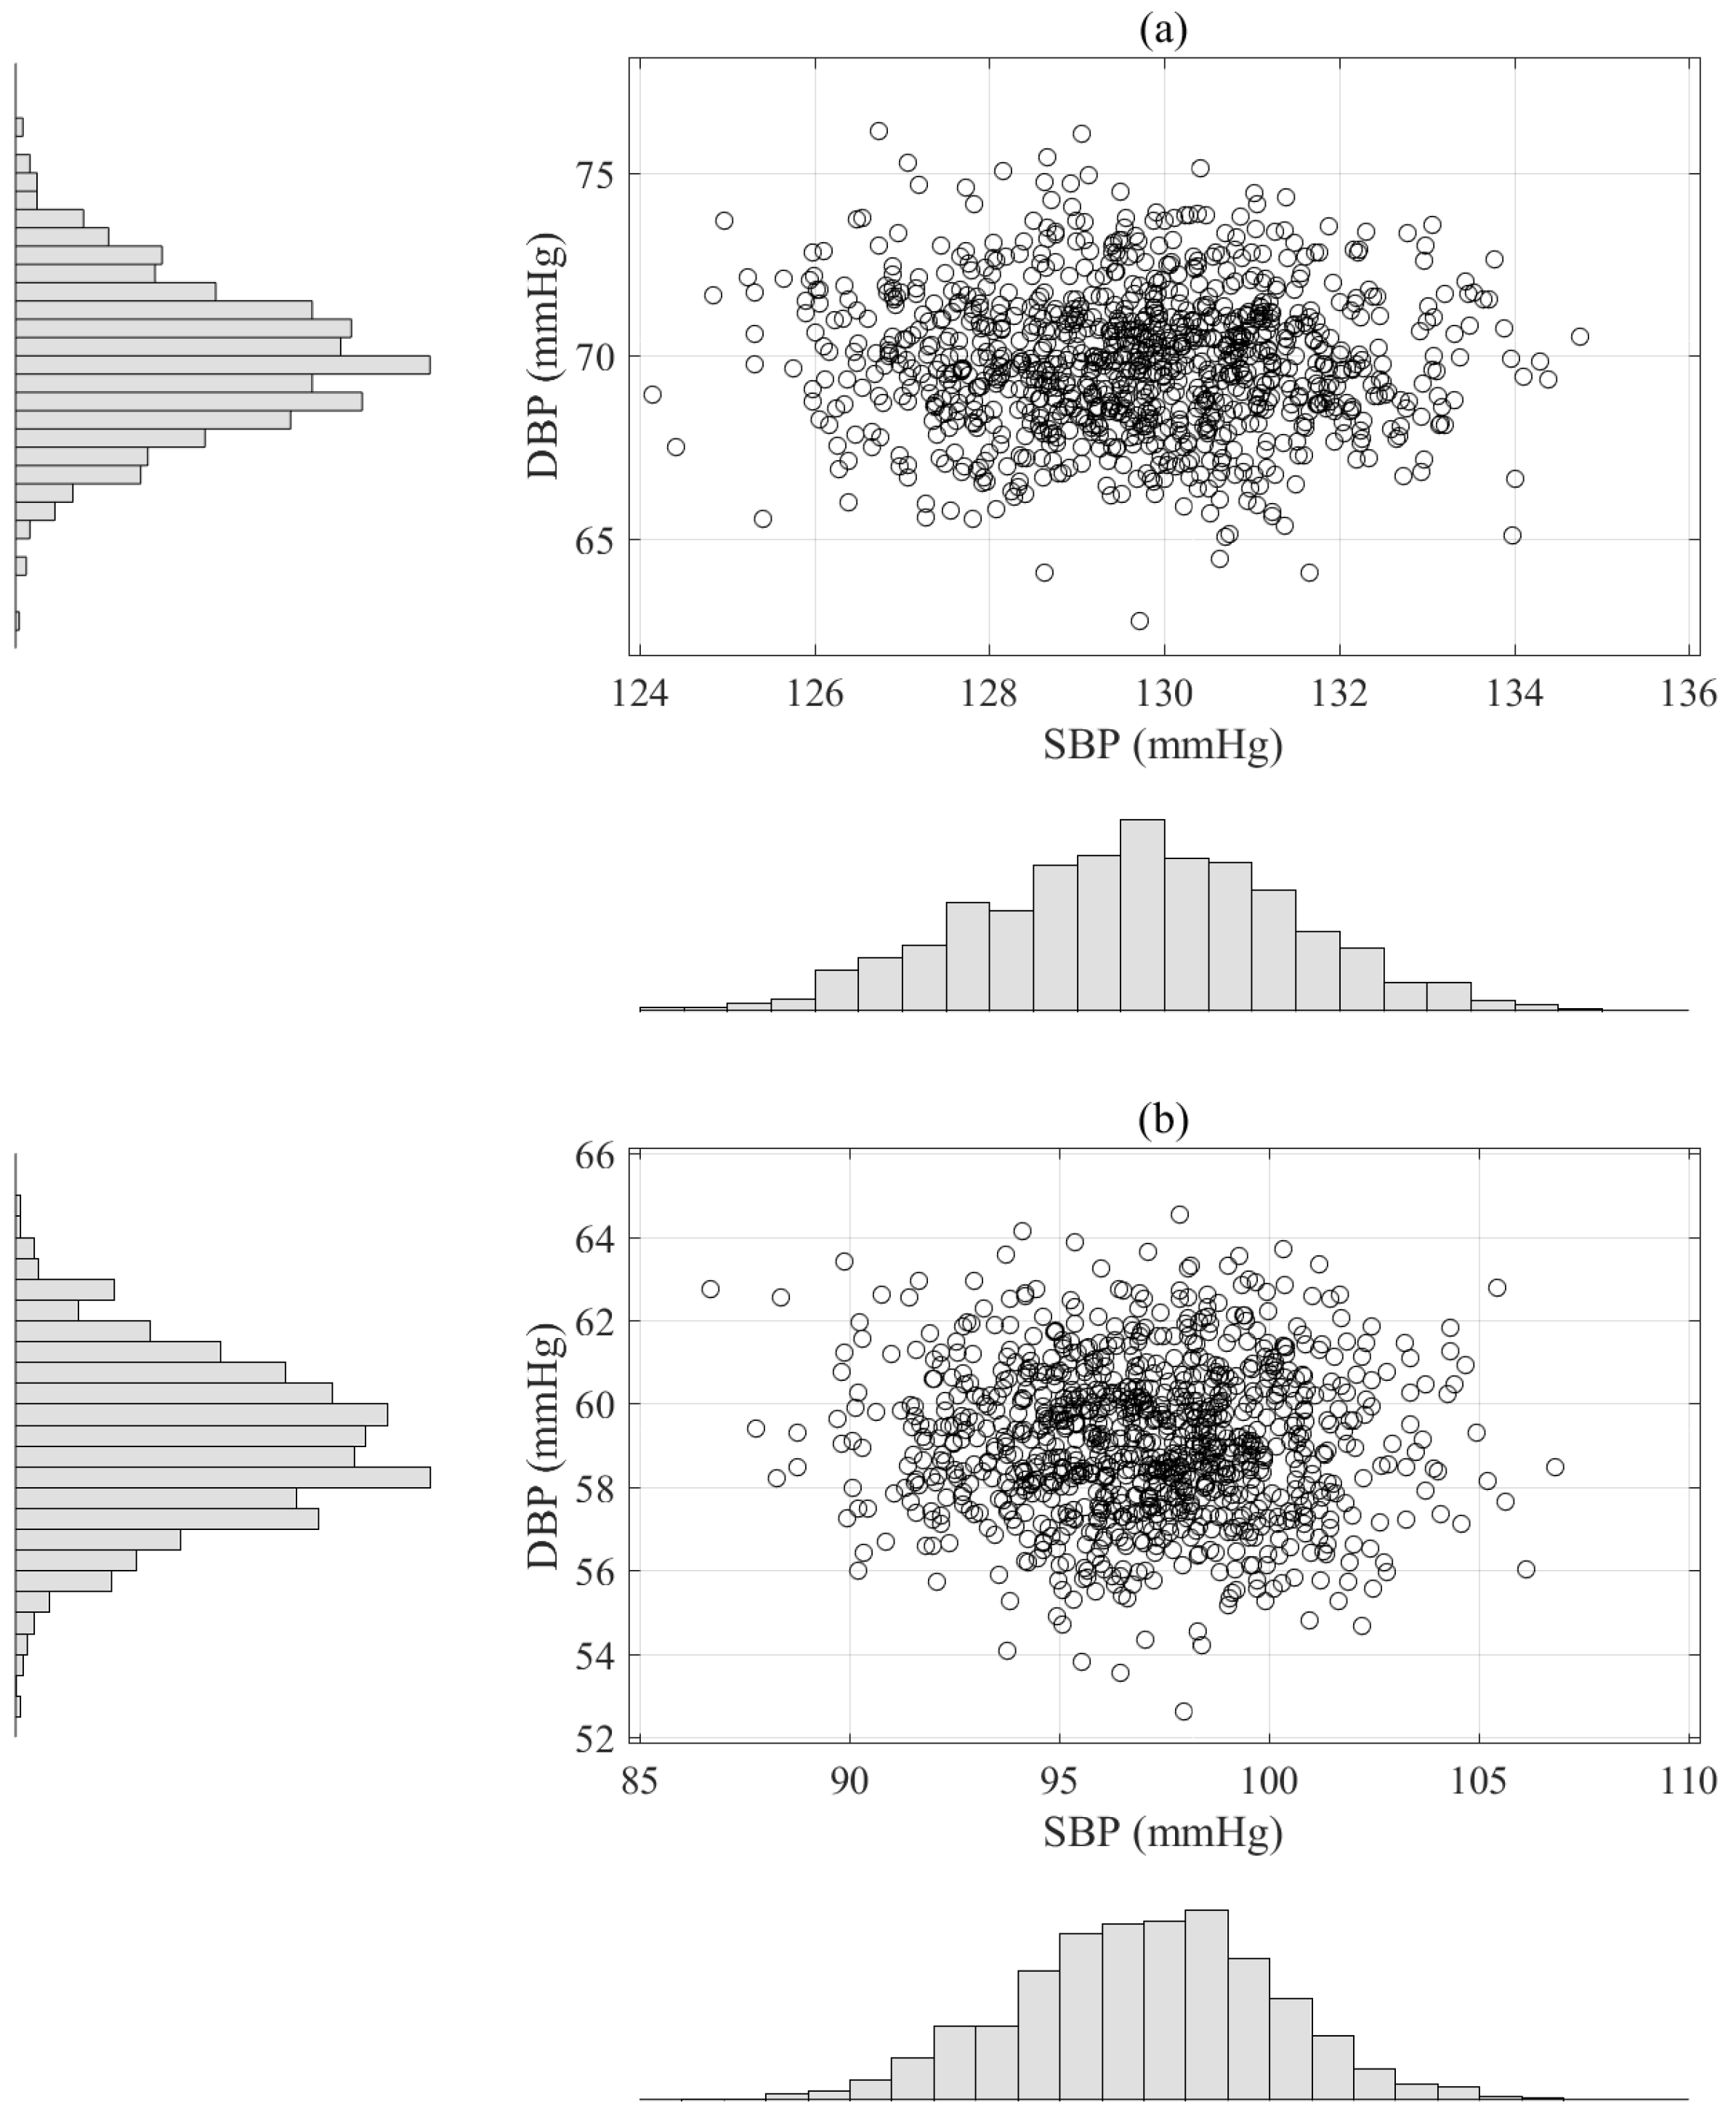
- We then use a rank test to analyze the independence between the artificial BPs estimations.
2. Data Set
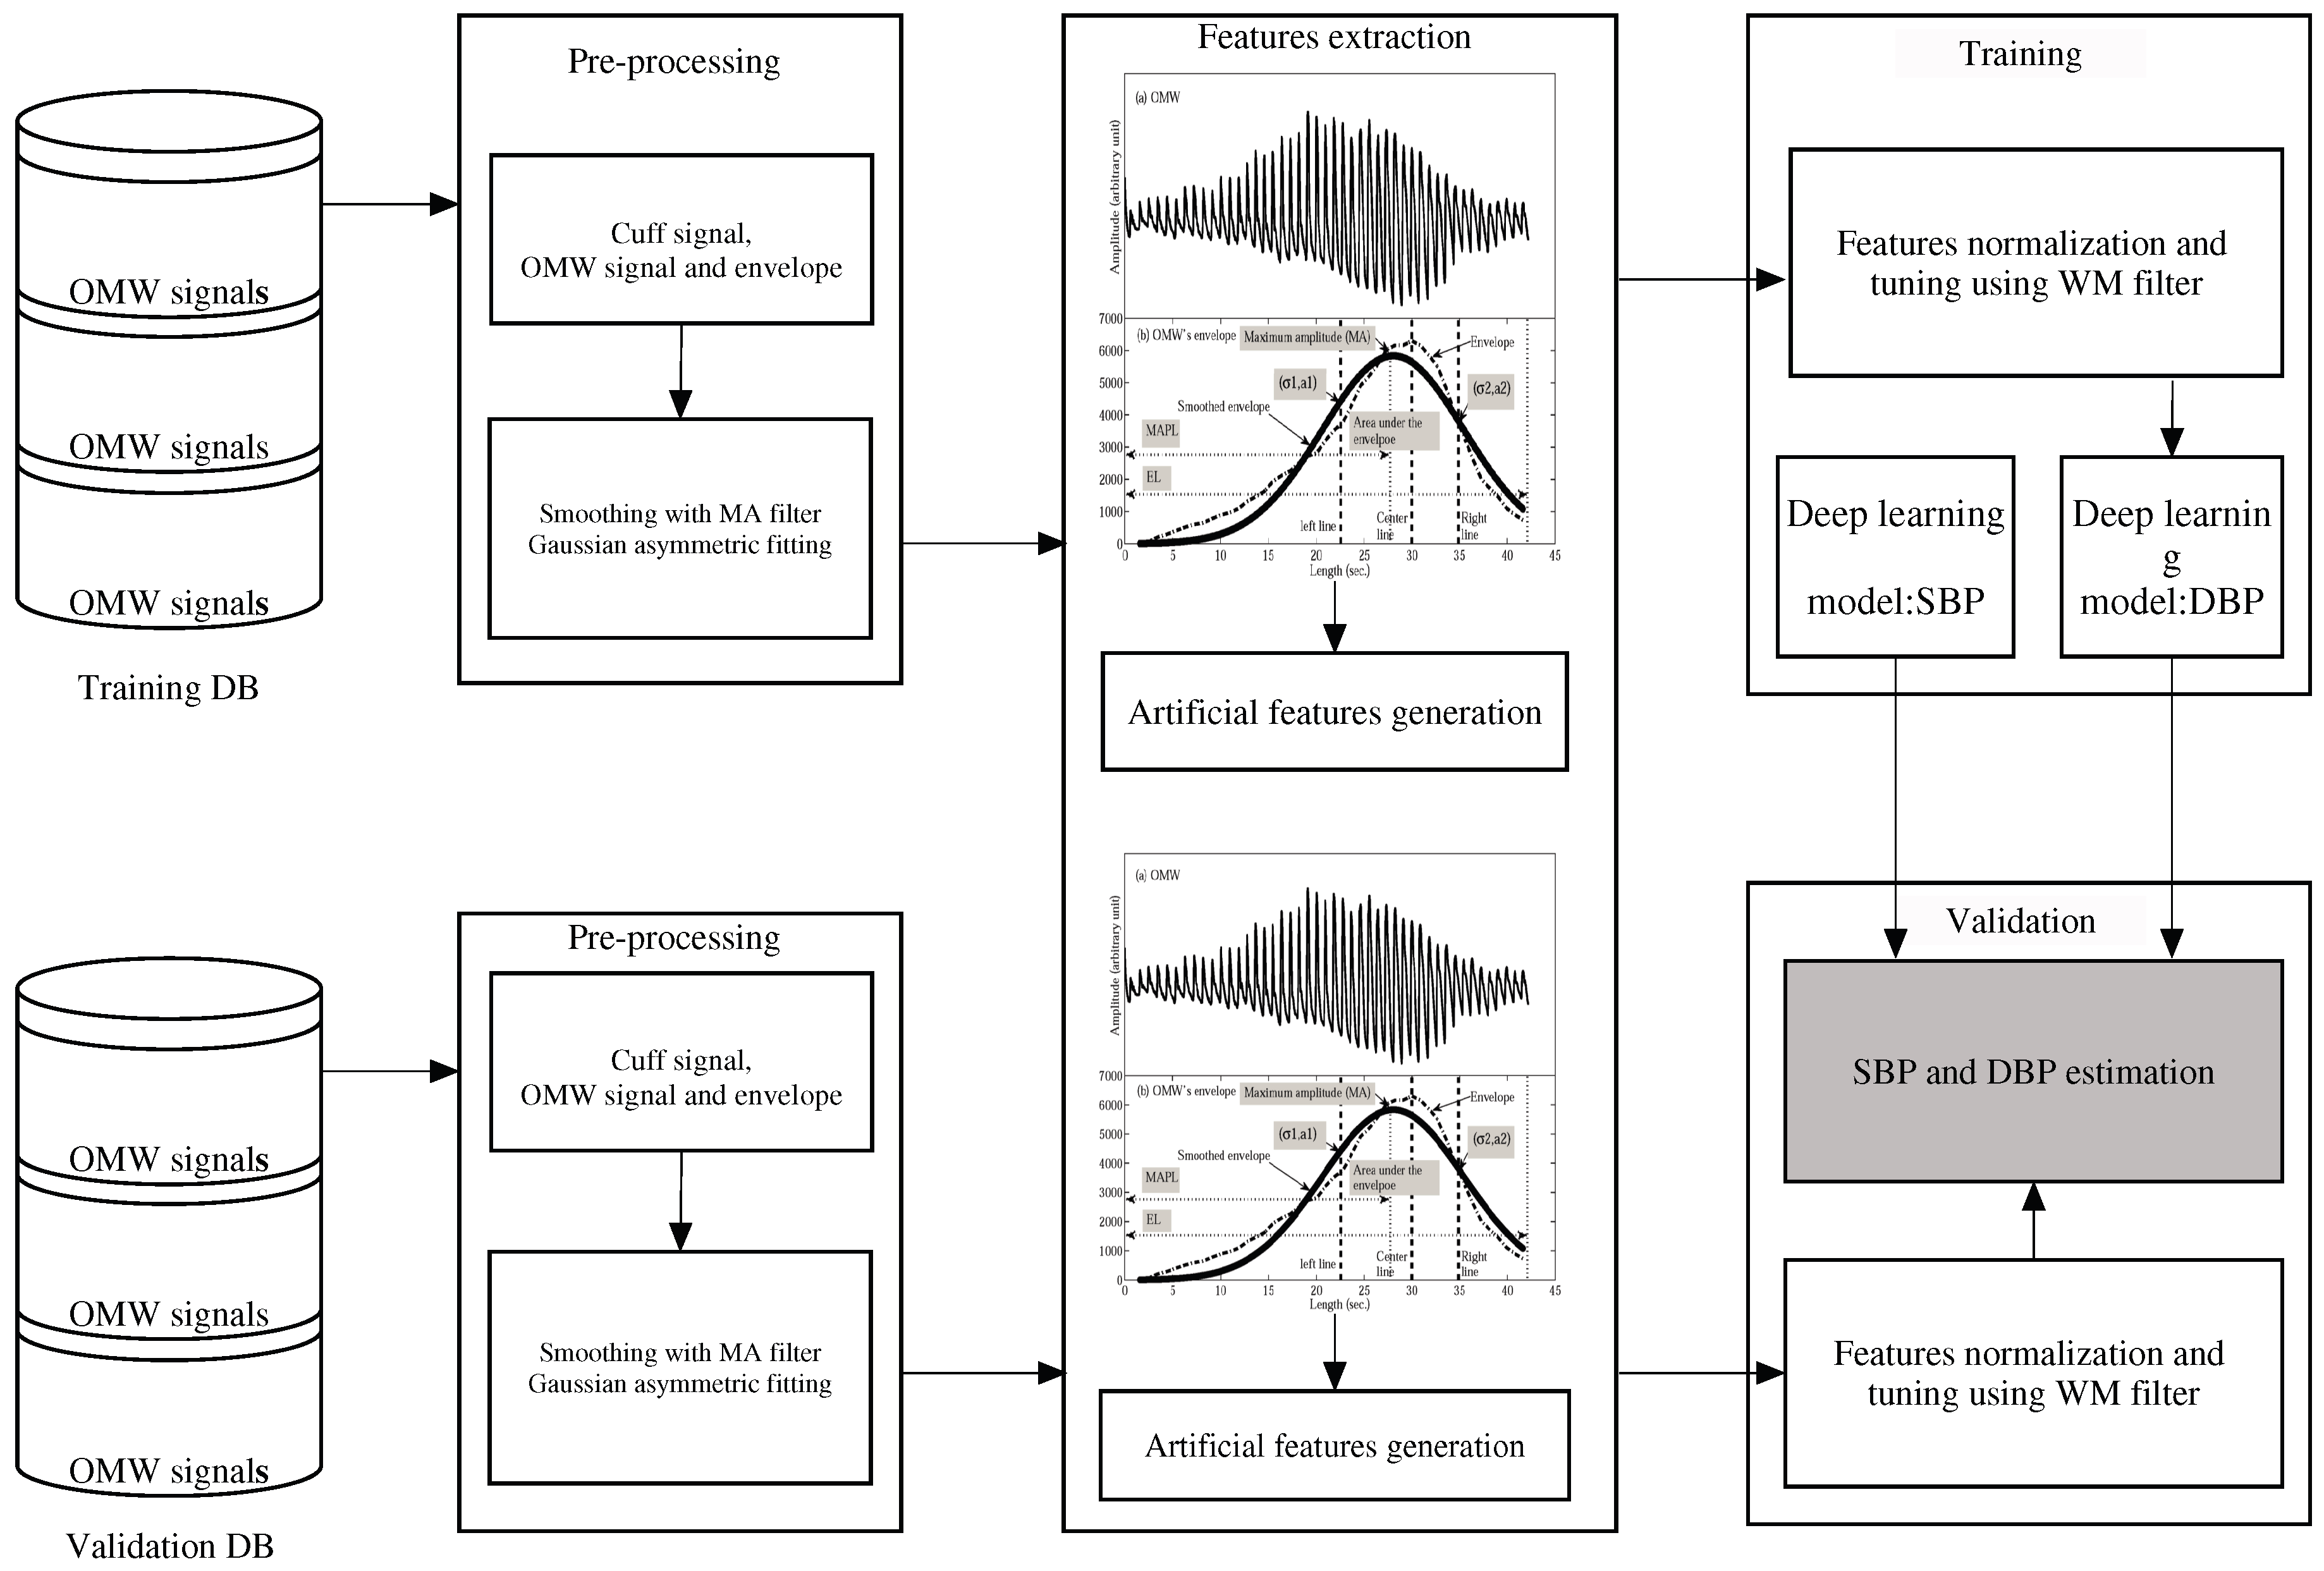
3. Deep Learning-Based Regression Estimator
3.1. Features Obtained from Oscillometric Signals
3.2. Artificial Data Obtained Using Bootstrap
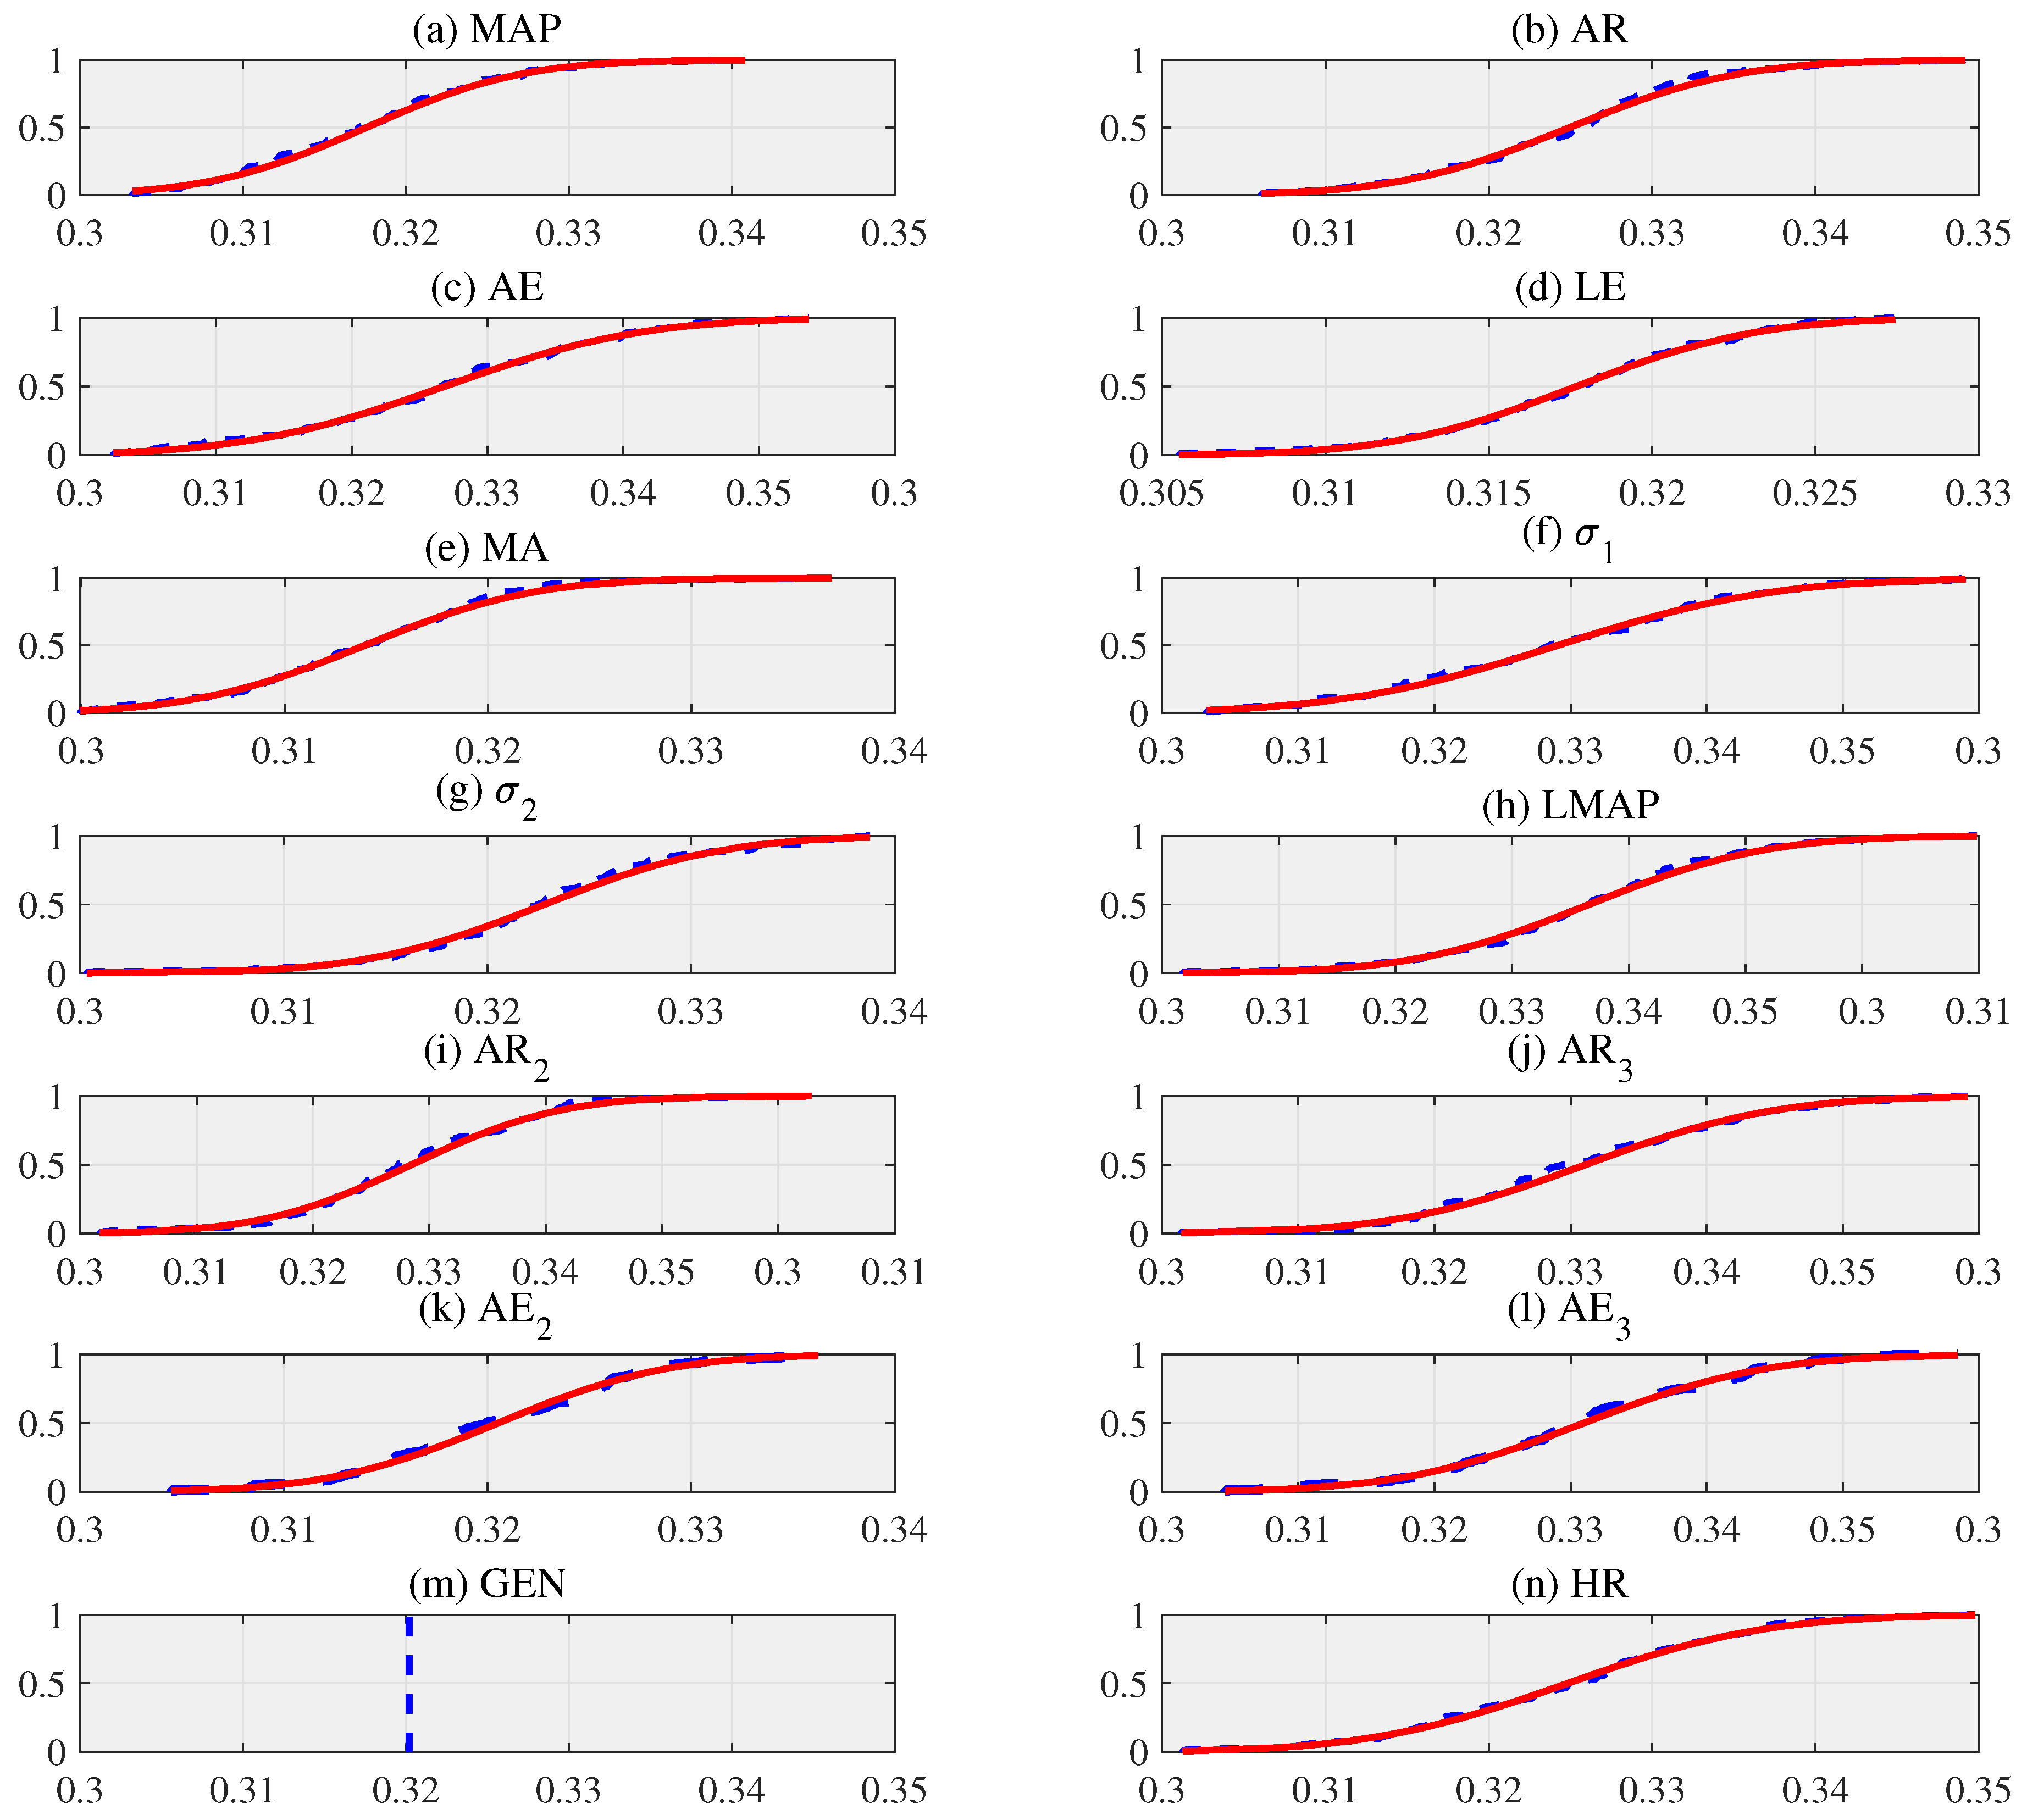
3.3. KS Analysis for Data
3.4. Deep Learning Based Regression
4. Statistical Analysis for BP Estimation
4.1. CL Estimation
| Algorithm 1: CL using bootstrap based on deep learning. |
| Procedure CL () 1. For and 2. and 3. and 4. = 5. = 6. For do 7. = 8. = 9. End For 10. = 11. = 12. End For End Procedure |
4.2. Computing and Testing for Kurtosis and Skewness
4.3. Normality Test Using KS
4.4. Independence Test Based on Rank
5. Experimental Results and Comparison
Statistical Analysis
6. Conclusions
Author Contributions
Funding
Acknowledgments
Conflicts of Interest
References
- Lee, S.; Bolic, M.; Groza, V.; Dajani, H.; Rajan, S. Confidence interval estimation for oscillometric blood pressure measurements using bootstrap approaches. IEEE Trans. Instrum. Meas. 2011, 60, 3405–3415. [Google Scholar] [CrossRef]
- Soueidan, K.; Chen, S.; Dajani, H.; Bolic, M.; Groza, V. Augmented blood pressure measurement through the noninvasive estimation of physiological arterial pressure variability. Physiol. Meas. 2012, 33, 881–899. [Google Scholar] [CrossRef] [PubMed]
- Hansen, S.; Staber, M. Oscillometric blood pressure measurement used for calibration of the arterial tonometry method contributes significantly to error. Eur. J. Anaesthesiol. 2006, 23, 781–787. [Google Scholar] [CrossRef] [PubMed]
- Lee, S.; Park, C.-H.; Chang, J.-H. Improved Gaussian mixture regression based on pseudo feature generation using bootstrap in blood pressure measurement. IEEE Trans. Ind. Inform. 2016, 12, 2269–2280. [Google Scholar] [CrossRef]
- Jones, D.W.; Hall, J.E. Hypertension-pathways to success. Hypertension 2008, 51, 1249–1251. [Google Scholar] [CrossRef] [PubMed]
- Association for the Advancement of Medical Instrumentation (AAMI). Manual, Electronic, or Automated Sphygmomanometers. AASI/AAMI SP 10:2002. Available online: https://webstore.ansi.org/standards/aami/ansiaamisp102002a12003 (accessed on 25 March 2019).
- Galvao, A.F.; Rojas, G.M.; Escudero, W.S. Test for skeness and kurtosis in the one-way error component model. J. Multivar. Anal. 2013, 122, 35–52. [Google Scholar] [CrossRef]
- Hinton, G.; Osindero, S.; Teh, Y.W. A fast learning algorithm for deep belief nets. Neural Comput. 2006, 18, 1527–1554. [Google Scholar] [CrossRef] [PubMed]
- Bengio, Y. Learning deep architectures for AI. Foundat. Trends Mach. Learn. 2009, 2, 1–127. [Google Scholar] [CrossRef]
- Lee, S.; Chang, J.-H. Oscillometric Blood Pressure Estimation Based on Deep Learning. IEEE Trans. Ind. Inform. 2017, 13, 461–472. [Google Scholar] [CrossRef]
- Lee, S.; Rajan, S.; Park, C.H.; Chang, J.-H.; Dajani, H.; Groza, V. Estimated confidence interval from single blood pressure measurement based on algorithm fusion. Comput. Biol. Med. 2015, 62, 154–163. [Google Scholar] [CrossRef] [PubMed]
- Efron, B. Introduction to the Bootstrap; Chapman & Hall: London, UK, 1993. [Google Scholar]
- Hollander, M.; Wolfe, D.A. Nonparametric Statistical Methods; Willey: NewYork, NY, USA, 1999. [Google Scholar]
- Lee, S.; Ahmad, A.; Jeon, G. Combining Bootstrap Aggregation with Support Vector Regression for Small Blood Pressure Measurement. J. Med. Syst. 2018, 42, 1–7. [Google Scholar] [CrossRef] [PubMed]
- Singh, K. On the asymptotic accuracy of Efron’s bootstrap. Ann. Stat. 1981, 9, 1187–1195. [Google Scholar] [CrossRef]
- Moller, M. A scaled conjugate gradient algorithm for fast supervised learning. Neural Netw. 1993, 6, 525–533. [Google Scholar] [CrossRef]
- Corder, G.W.; Foreman, D.I. Nonparametric Statistics for Non-Statisticians; Willey: Hoboken, NJ, USA, 2009. [Google Scholar]
- O’Brien, E.; Petrie, J.; Littler, W.; Swiet, M.D.; Padfield, P.L.; Altman, D.G.; Bland, M.; Coate, A.; Atkins, N. The British hypertension society protocol for the evaluation of blood pressure measuring devices. J. Hypertens. 1993, 11, 43–62. [Google Scholar]
- Ghasemi, A.; Zahediasl, S. Normality tests for statistical analysis: A guide for non-statisticians. Int. J. Endocrinol. Metab. 2012, 10, 486–489. [Google Scholar] [CrossRef] [PubMed]


| Statistical Information | Value |
|---|---|
| Age (Male) | 12 to 80 |
| Age (Female) | 17 to 65 |
| Arm size | 25 (cm) to 42 (cm) |
| Wrist size | 13.5 (cm) to 23 (cm) |
| Deflation rate | 3.0 (mmHg/s) |
| Male | 48 of 85 (56.5%) |
| Female | 37 of 85 (43.5%) |
| Feature/Test Values | h | p | ks | cv |
|---|---|---|---|---|
| MAP | 0 | 0.900 | 0.056 | 0.134 |
| AR | 0 | 0.904 | 0.055 | 0.134 |
| AE | 0 | 0.885 | 0.057 | 0.134 |
| EL | 0 | 0.716 | 0.068 | 0.134 |
| MA | 0 | 0.599 | 0.075 | 0.134 |
| 0 | 0.996 | 0.040 | 0.134 | |
| 0 | 0.949 | 0.051 | 0.134 | |
| MAPL | 0 | 0.969 | 0.048 | 0.134 |
| Features | |||||||
|---|---|---|---|---|---|---|---|
| TSBP | 95.4 (3.4) | 95.5(1.6) | 92.3 | 98.9 | 0.1 | 3.36 | 1.59 |
| TDBP | 64.8 (3.6) | 64.7(1.7) | 61.3 | 68.6 | −0.1 | 3.63 | 1.70 |
| MAP | 0.3703 (0.07) | 0.3707(0.03) | 0.031 | 0.045 | 0.0004 | 0.07 | 0.03 |
| AR | 0.4960 (0.05) | 0.4930 (0.03) | 0.440 | 0.547 | −0.003 | 0.047 | 0.025 |
| AE | 0.0670 (0.007) | 0.0680 (0.003) | 0.061 | 0.074 | 0.001 | 0.008 | 0.003 |
| EL | 0.0480 (0.023) | 0.0478 (0.010) | 0.029 | 0.068 | −0.0002 | 0.023 | 0.01 |
| Number of the Hidden Unit in Three Layers: | |
|---|---|
| Size of input vector X | 11 |
| Size of output vector Y | 2 |
| Number of sample over each pseudo feature | 100 |
| Number of sample over each original feature | 5 |
| Number of hidden layers | 3 |
| Number of hidden unit on the layers | 16 to 256 |
| Number of ensemble | 50 |
| Learning rate for weight | 0.001 |
| Learning rate for biases of visible units | 0.01 |
| Learning rate for biases of hidden units | 0.01 |
| Momentum rate | 0.9 |
| Activation type | sigmoid type function |
| Maximum epoch in the pre-training | 200 |
| Maximum epoch in the fine-tuning | 200 |
| Initial weights and biases | randomly between (−1, 1) |
| mmHg | MAA | NN | SVR | DNN | ||||
|---|---|---|---|---|---|---|---|---|
| Test | SBP | DBP | SBP | DBP | SBP | DBP | SBP | DBP |
| ME | 0.07 | −0.89 | 0.25 | −0.22 | −0.51 | 0.17 | 0.36 | −0.61 |
| SDE | 9.28 | 7.76 | 7.48 | 6.80 | 7.20 | 6.18 | 6.30 | 5.45 |
| SBP | DBP | Standard (SBP/DBP) | |||||
|---|---|---|---|---|---|---|---|
| Tests | Absolute Difference (%) | Absolute Difference (%) | BHS | ||||
| ≤5 mmHg | ≤10 mmHg | ≤15 mmHg | ≤5 mmHg | ≤10 mmHg | ≤15 mmHg | Grade | |
| MAA | 47.06 | 85.88 | 96.47 | 56.47 | 88.24 | 97.65 | C/B |
| NN | 53.88 | 85.65 | 95.53 | 66.12 | 94.12 | 98.82 | B/A |
| SVR | 62.59 | 86.12 | 95.53 | 74.12 | 93.65 | 96.94 | A/A |
| DNN | 69.18 | 88.71 | 97.18 | 76.24 | 93.17 | 98.12 | A/A |
| BP (mmHg) | SBP (SDE) | DBP (SDE) | SBP L (SDE) | SBP U (SDE) | DBP L (SDE) | DBP U (SDE) |
|---|---|---|---|---|---|---|
| 95%CI | 95%CI | |||||
| [1] | 13.2 (8.0) | 9.4 (5.8) | 106.7 (14.3) | 120.2 (16.5) | 62.4 (10.4) | 71.7 (11.0) |
| [1] | 13.9 (7.9) | 10.0 (5.4) | 106.4 (14.3) | 120.5 (16.4) | 62.0 (10.4) | 72.1 (10.9) |
| [1] | 2.8 (3.3) | 1.7 (2.4) | 112.4 (13.9) | 115.7 (14.1) | 66.7 (10.5) | 68.2 (9.9) |
| 5.5 (1.3) | 4.2 (0.8) | 107.4 (12.7) | 113.0 (12.6) | 64.5 (8.3) | 68.6 (8.4) |
| Tests | KS Test | Normality Test | |||||
|---|---|---|---|---|---|---|---|
| (=0.05) | h (std) | p (std) | ks (std) | cv (std) | Kurtosis (std) | Skewness (std) | corr (std) |
| SBP | 0 (0) | 0.78 (0.2) | 0.02 (0.00) | 0.04 (0.00) | 2.99 (0.14) | −0.01 (0.08) | 0.01 (0.03) |
| DBP | 0 (0) | 0.79 (0.2) | 0.02 (0.01) | 0.04 (0.00) | 3.01 (0.16) | −0.01 (0.07) | 0.01 (0.03) |
© 2019 by the authors. Licensee MDPI, Basel, Switzerland. This article is an open access article distributed under the terms and conditions of the Creative Commons Attribution (CC BY) license (http://creativecommons.org/licenses/by/4.0/).
Share and Cite
Lee, S.; Lee, G.; Jeon, G. Statistical Approaches Based on Deep Learning Regression for Verification of Normality of Blood Pressure Estimates. Sensors 2019, 19, 2137. https://doi.org/10.3390/s19092137
Lee S, Lee G, Jeon G. Statistical Approaches Based on Deep Learning Regression for Verification of Normality of Blood Pressure Estimates. Sensors. 2019; 19(9):2137. https://doi.org/10.3390/s19092137
Chicago/Turabian StyleLee, Soojeong, Gangseong Lee, and Gwanggil Jeon. 2019. "Statistical Approaches Based on Deep Learning Regression for Verification of Normality of Blood Pressure Estimates" Sensors 19, no. 9: 2137. https://doi.org/10.3390/s19092137
APA StyleLee, S., Lee, G., & Jeon, G. (2019). Statistical Approaches Based on Deep Learning Regression for Verification of Normality of Blood Pressure Estimates. Sensors, 19(9), 2137. https://doi.org/10.3390/s19092137