


Green-Biased Technical Change and Its Influencing Factors of Agriculture Industry: Empirical Evidence at the Provincial Level in China

Abstract
:1. Introduction
2. Literature Review
3. Methods
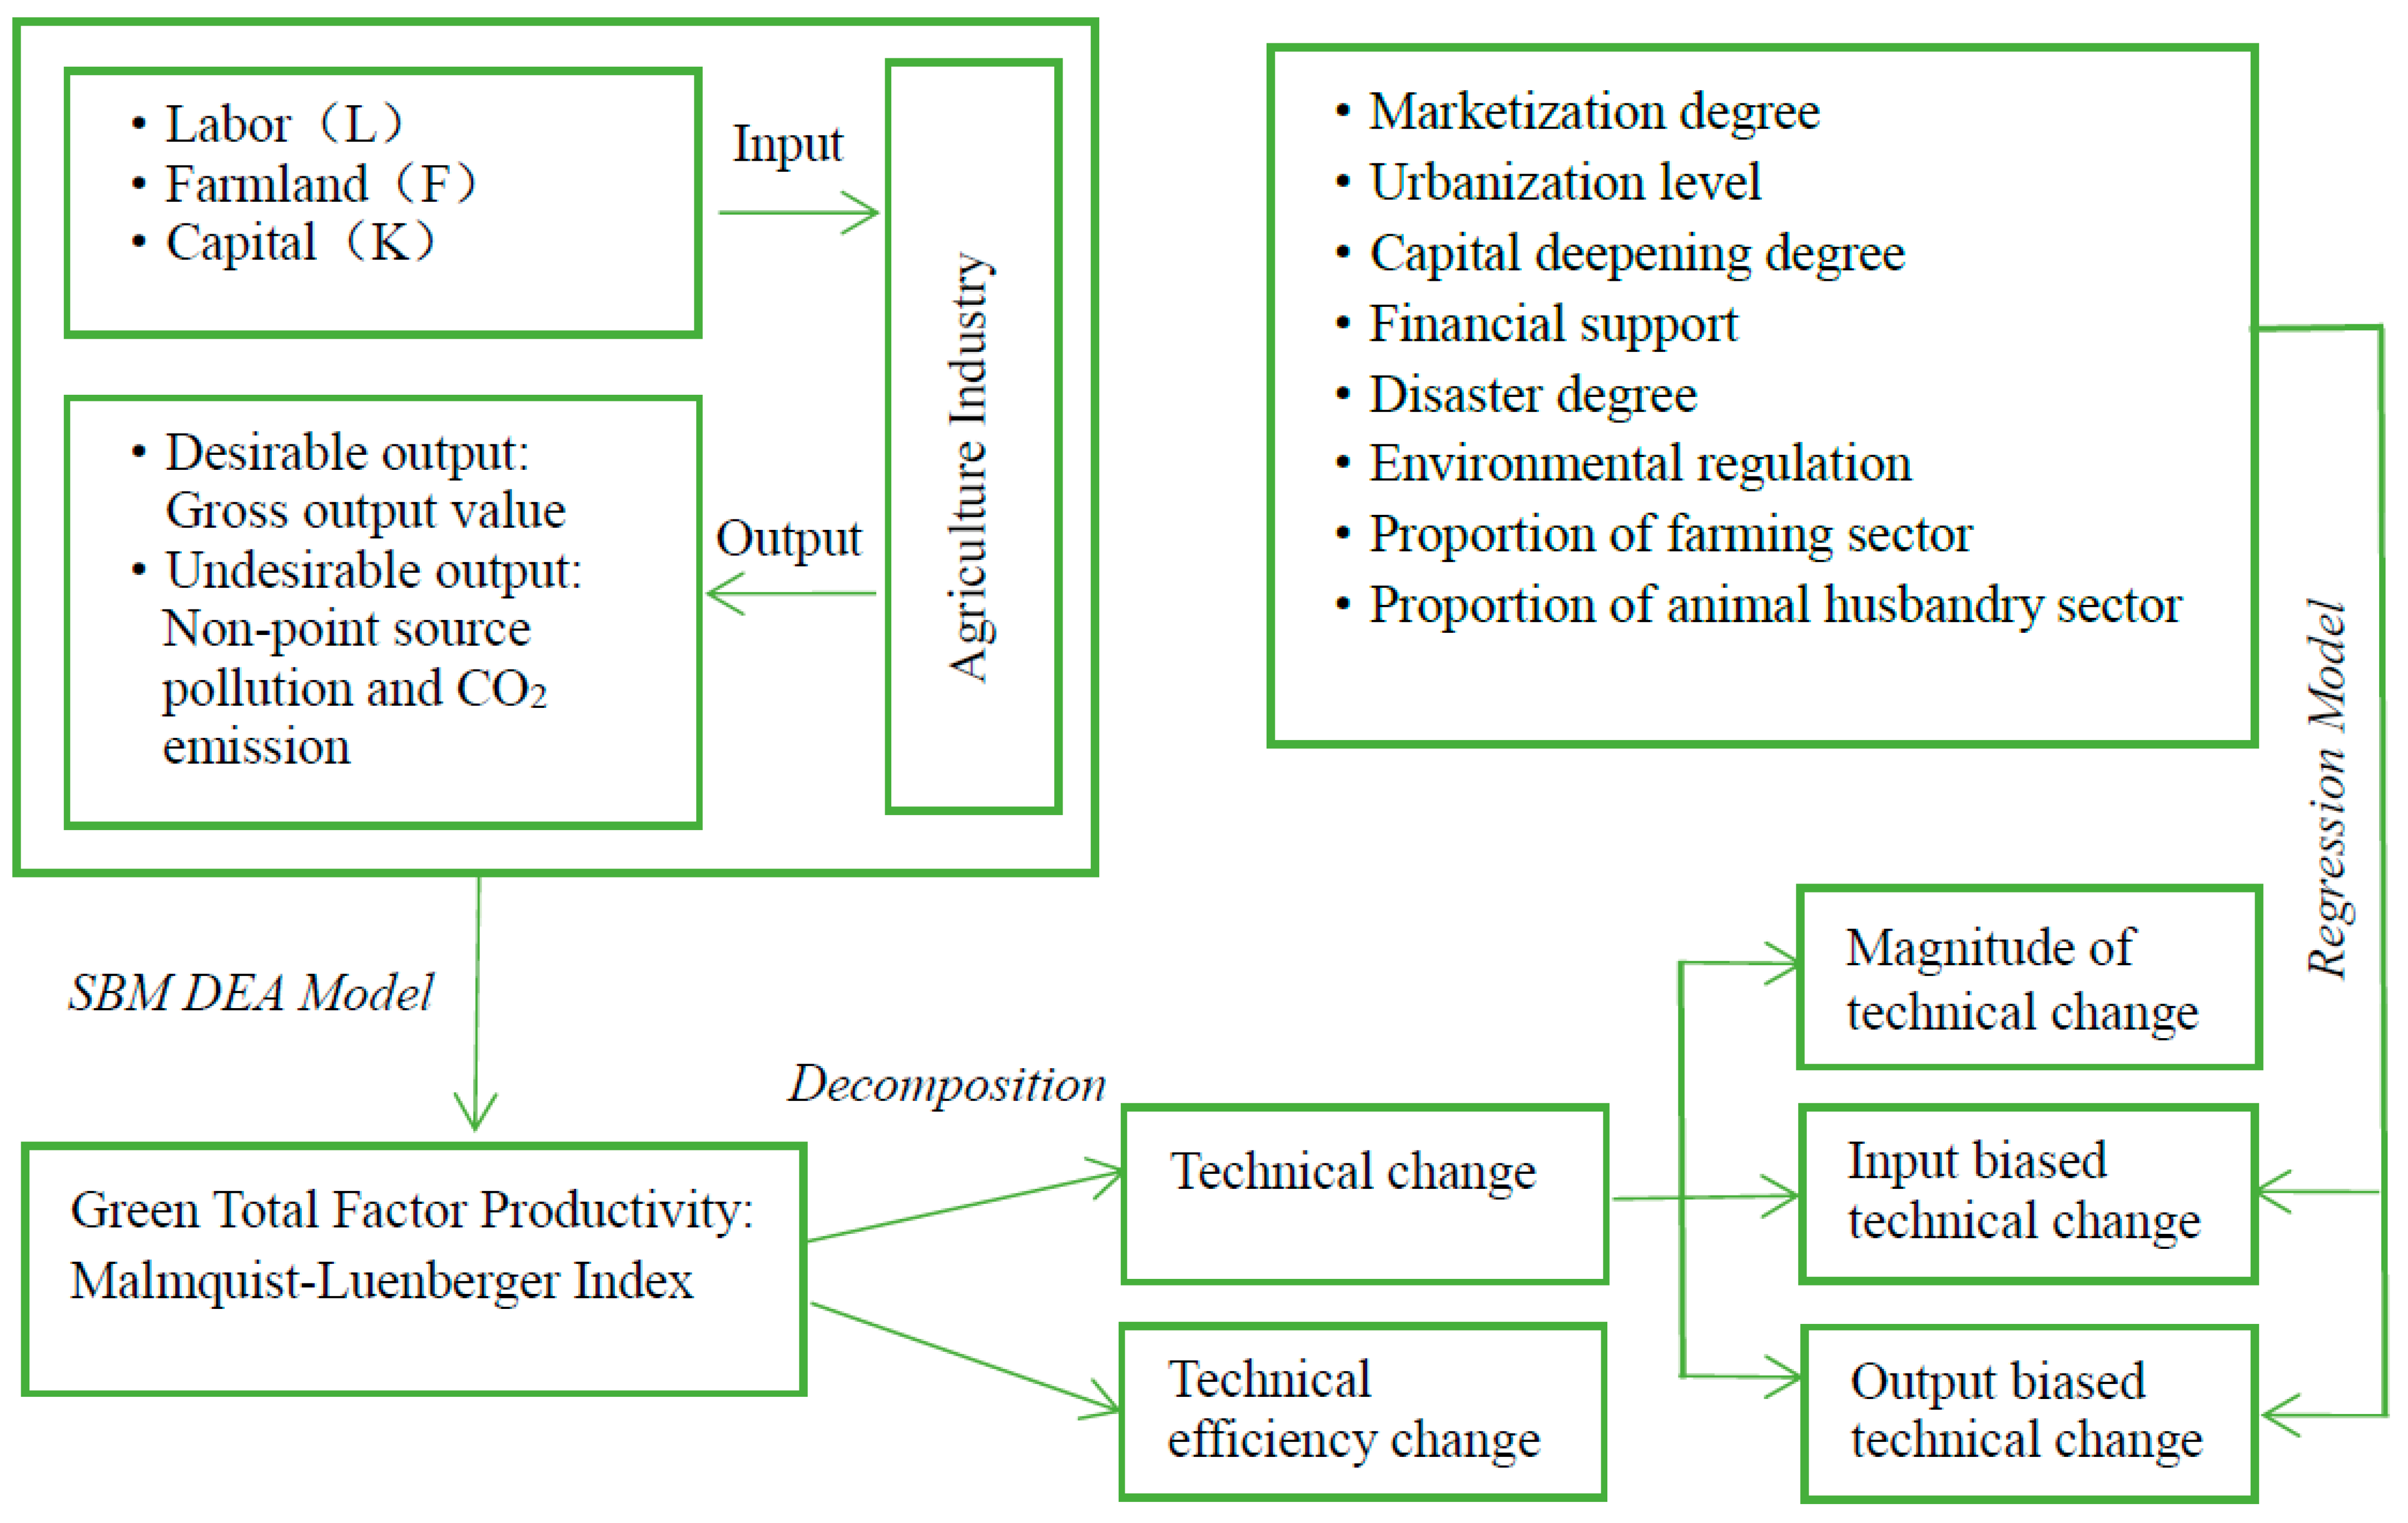
3.1. Framework of Method Analysis
3.2. Calculation Method of Green-Biased Technical Change in Chinese Agriculture
3.2.1. SBM Model Setting and Green Total Factor Productivity Decomposition
3.2.2. Identification Method of Green Technical Change Bias
3.3. Regression Analysis of Factors Affecting Green-Biased Technical Change
- (1)
- Degree of marketization (MA). The degree of marketization is regarded as a significant index used to indicate the marketization mobility of agricultural products and agricultural factors [33]. Herein, Fan Gang’s marketization index is adopted to measure the depth and breadth of marketization reform carried out in each province.
- (2)
- (3)
- Agricultural capital deepening (CD). Capital accumulation and its deepening provide a crucial driving force for agricultural growth. According to the study of Li et al. (2014) and that of Kong et al. (2018) [2,58], there are three indicators selected: total power of agricultural machinery/10,000 people, fertilizer application amount (net)/1000 hectares, and effective irrigation area/1000 hectares. Then, the entropy method is applied to calculate the variables used to characterize the degree of agricultural capital deepening.
- (4)
- Financial support for agriculture (FS). The financial support offered for agriculture reflects, to a large extent, the shift in the agricultural support policy enforced by the government and the actual strength of the agricultural public investment [5,52]. Herein, this paper uses the proportion of agricultural expenditure in total fiscal expenditure to measure it.
- (5)
- Environmental regulation intensity (ER). It represents the trade-off made by the government between economic output and green development. Based on the research of Tian et al. (2022), this paper uses the proportion of investment in environmental pollution control in regional GDP to measure the intensity of environmental regulation [5]. In the meantime, to overcome the data missing in individual years of investment in environmental pollution control, the missing data are estimated by using the average proportion of the investment completed in anti-industrial pollution projects to the investment in environmental pollution control over the years. In addition, in order to study the nonlinear impact of environmental regulation intensity on biased technical change, the quadratic term of this variable is also included in the model.
- (6)
- Agricultural disaster rate (DR). Given the special attributes of intertwined natural reproduction and economic reproduction for agriculture industry, consideration is given in this study to the impact of uncontrollable natural factors, such as agricultural disasters on the bias of technical change, which is based on the reference made to the study of Liu et al. (2021) [48]. In this paper, the agricultural disaster rate is measured by the proportion of agricultural disaster area to total sown area.
- (7)
- Structure of agricultural sector. Allowing for farming and animal husbandry as the two major sectors of agricultural productions, as well as the significant contributors to non-point environmental pollution and carbon emissions [5,59], the impact of different sectors within agriculture on the green-biased technical change is investigated by using two indicators. They are the ratio/share of the two segments: farming (PF) and animal husbandry (AH), respectively.
4. Variable Definition and Data Sources
- (1)
- Input factors. Three input factors, namely, labor (L), farmland (F), and capital (K), are adopted. Among them, the labor input is represented by the number of employees in the first industry at the end of the year; the farmland input is indicated by the sown area of crops, considering the multiple cropping index; the capital input is based on the treatment method proposed in the study of Li et al. (2014) and Feenstra et al. (2015) [58,60], so as to estimate agricultural capital stock (at constant prices in 1978) through the perpetual inventory method. The key data of agricultural capital stock accounting are sourced from Historical Data of China’s GDP Accounting and Statistical Yearbook of China’s Fixed Assets Investment. Additionally, the sample data used in this study are only available until 2017 because provincial fixed asset investment statistics have ceased to be published since 2017.
- (2)
- Output. Desirable output (Y) is defined as the gross output value of farming, forestry, animal husbandry, and fishery (constant price in 1978). With regard to undesirable output (B), there are two pollution sources adopted: agricultural carbon emission (CO2) and agricultural non-point source pollution (ANSP, including chemical oxygen demand (CODcr), total nitrogen (TN), total phosphorus (TP) emissions). Moreover, the entropy method is applied to obtain the comprehensive index of agricultural environmental pollution.
- (3)
- Agricultural carbon emissions (CO2) estimation and data sources. This paper takes into account a number of research results [5,6,61,62], with four aspects (agricultural materials, livestock breeding, rice cultivation, and agricultural energy) selected to measure the sources of agricultural carbon emission. Table 2 lists the specific reference sources of emission coefficient. The first category, the carbon emissions from agricultural materials, includes carbon emissions from the production and subsequent utilization of chemical fertilizers, pesticides, and agricultural films. As chemical fertilizer is an important contributor to China’s agricultural carbon emissions, its accounting results will directly affect the accuracy of the total agricultural carbon emissions. Therefore, unlike previous studies, this paper subdivides chemical fertilizers into nitrogen, phosphorus, potassium, and compound fertilizers, and uses carbon emission coefficients of different chemical fertilizer varieties that reflect China’s actual conditions to calculate them, respectively [63]. The second category is the carbon emissions from rice planting, with the dual differences of rice planting cycle and region taken into account for the choice over the rice carbon emission coefficient. The third category, the carbon emissions from livestock and poultry breeding, includes CH4 and N2O emissions from livestock and poultry intestinal fermentation and excreta. This is purposed mainly to investigate cattle (including beef cattle, dairy cattle, buffalo), sheep (including goats and sheep), pigs, poultry, and other major livestock and poultry varieties. The fourth category, agricultural energy carbon emissions, involves agricultural diesel oil as a major contributor. Therefore, the calculation formula for agricultural carbon emission is expressed as follows:
- (4)
- Agricultural non-point source pollution (ANSP) estimation and data sources. The unit analysis method is developed to investigate and calculate agricultural non-point source pollution, including chemical oxygen demand (CODcr), total nitrogen (TN), and total phosphorus (TP). According to the studies of Lai et al. (2004), Chen et al. (2006), and Chen et al. (2021) [49,66,67], the following formula is used to calculate the emissions of ANSP:
5. Empirical Results
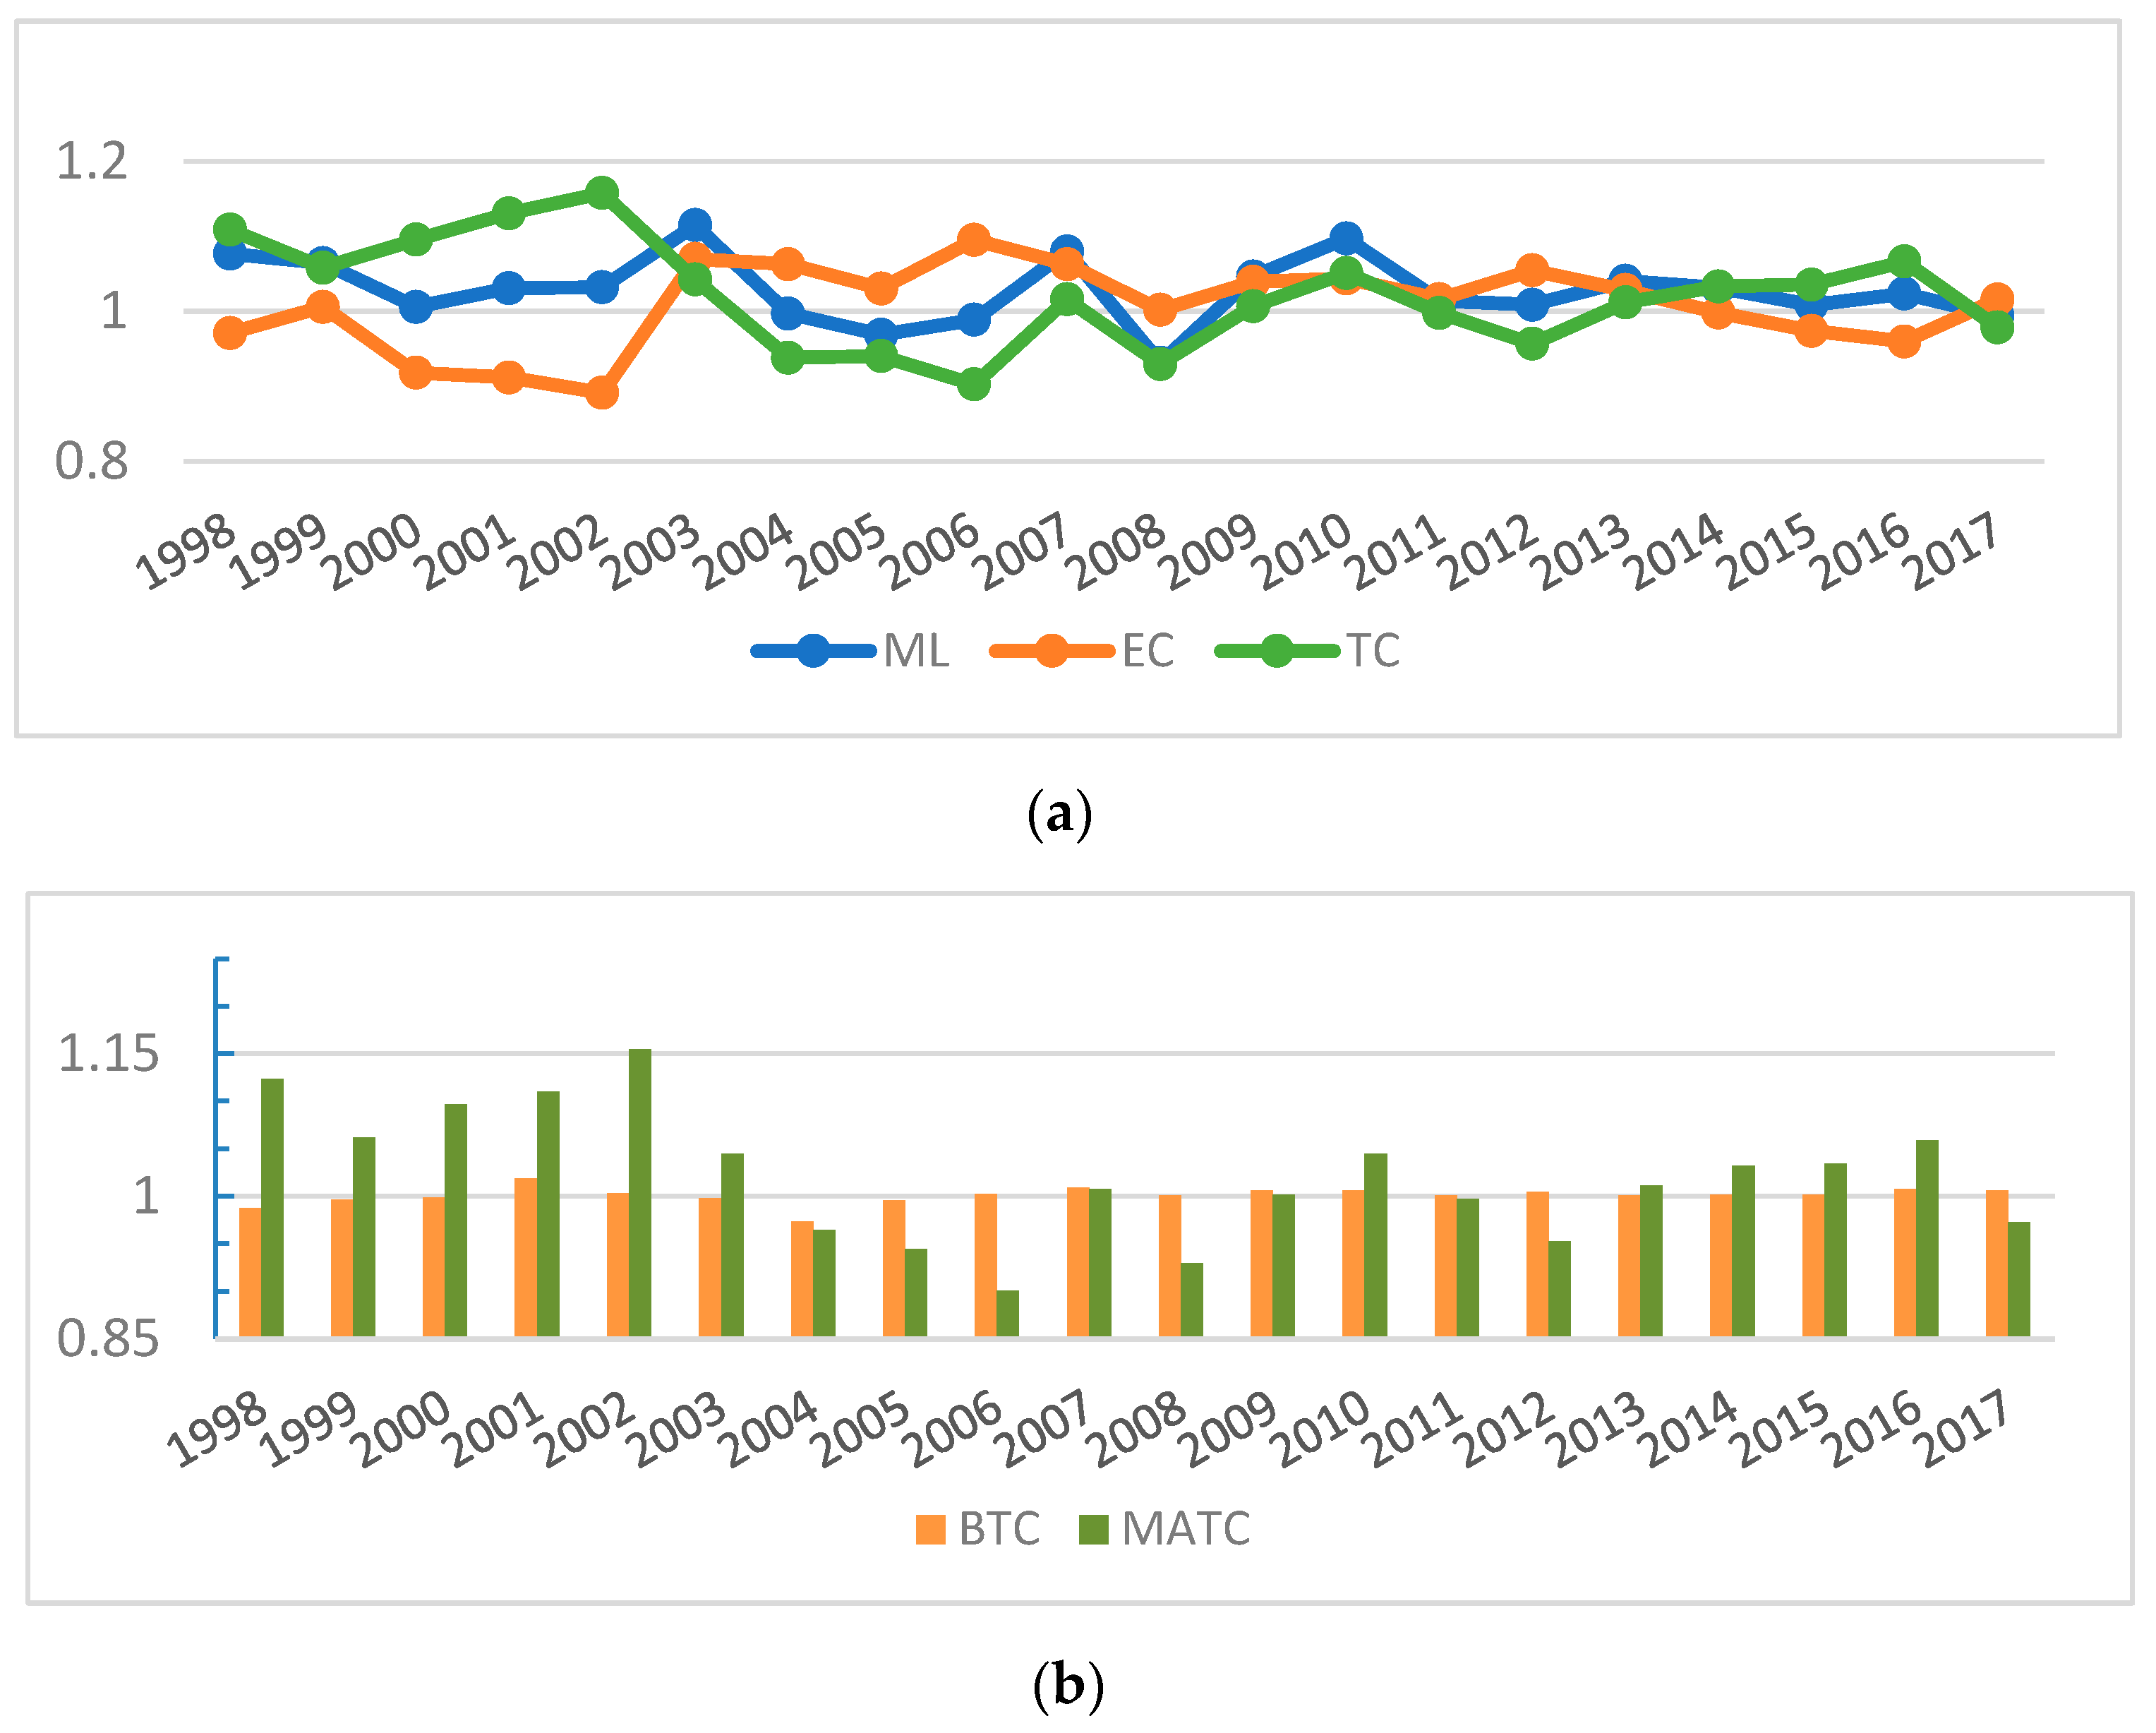
5.1. Analysis of Green-Biased Technical Change in Chinese Agriculture
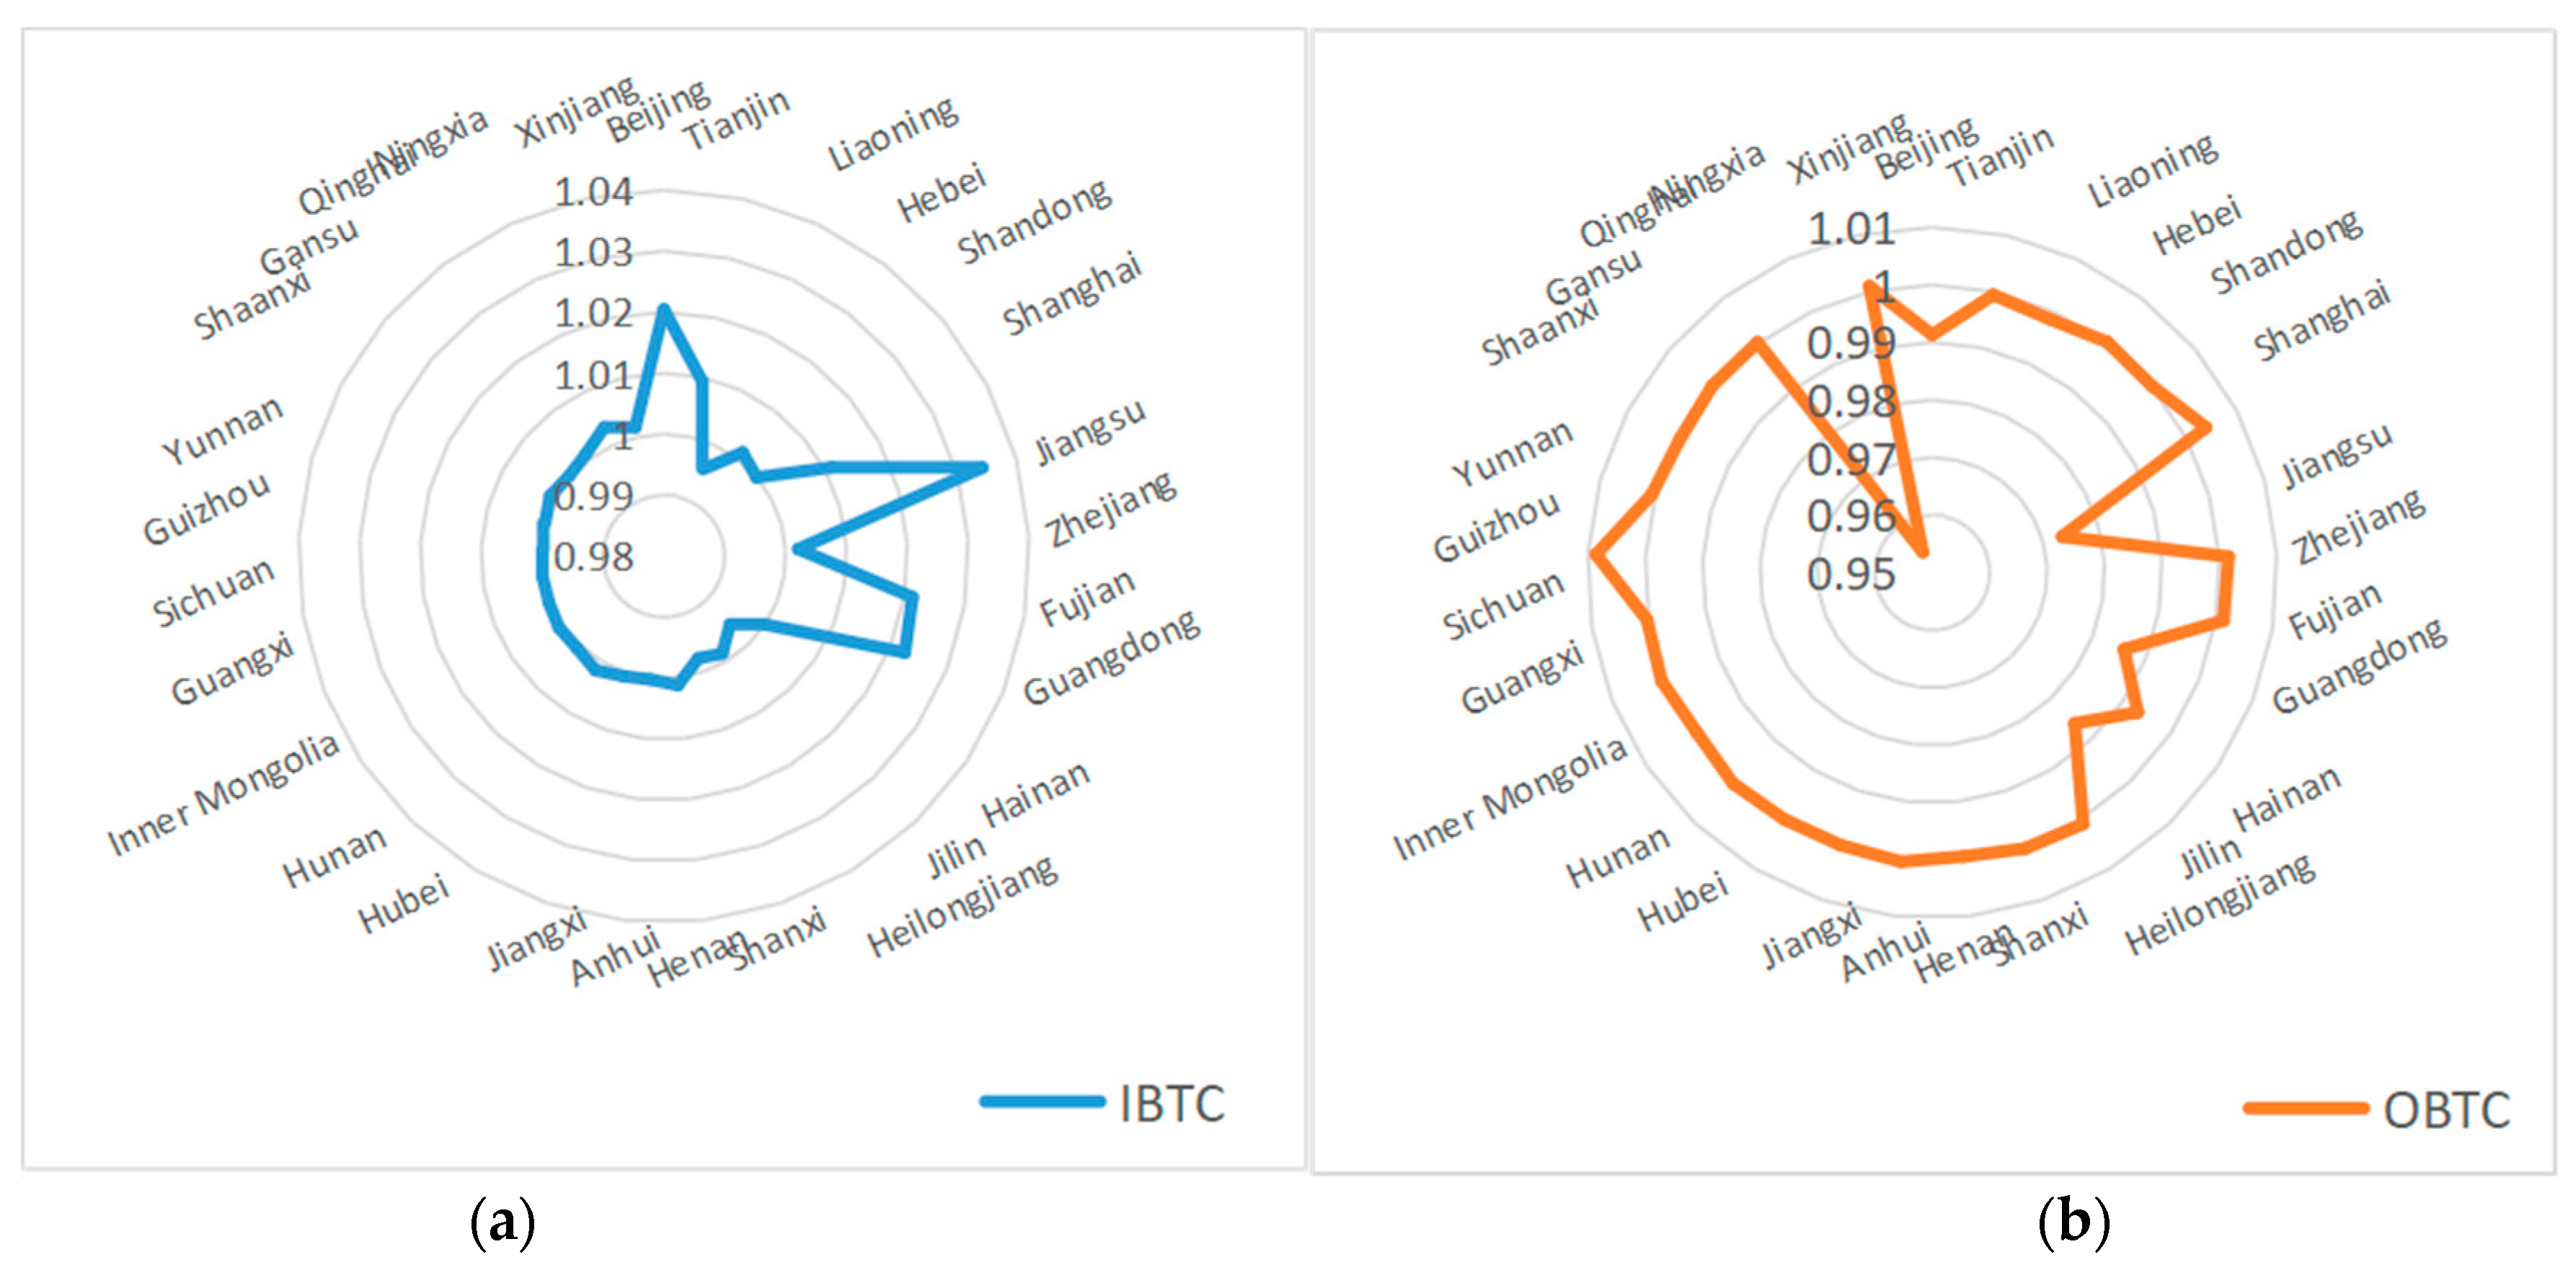
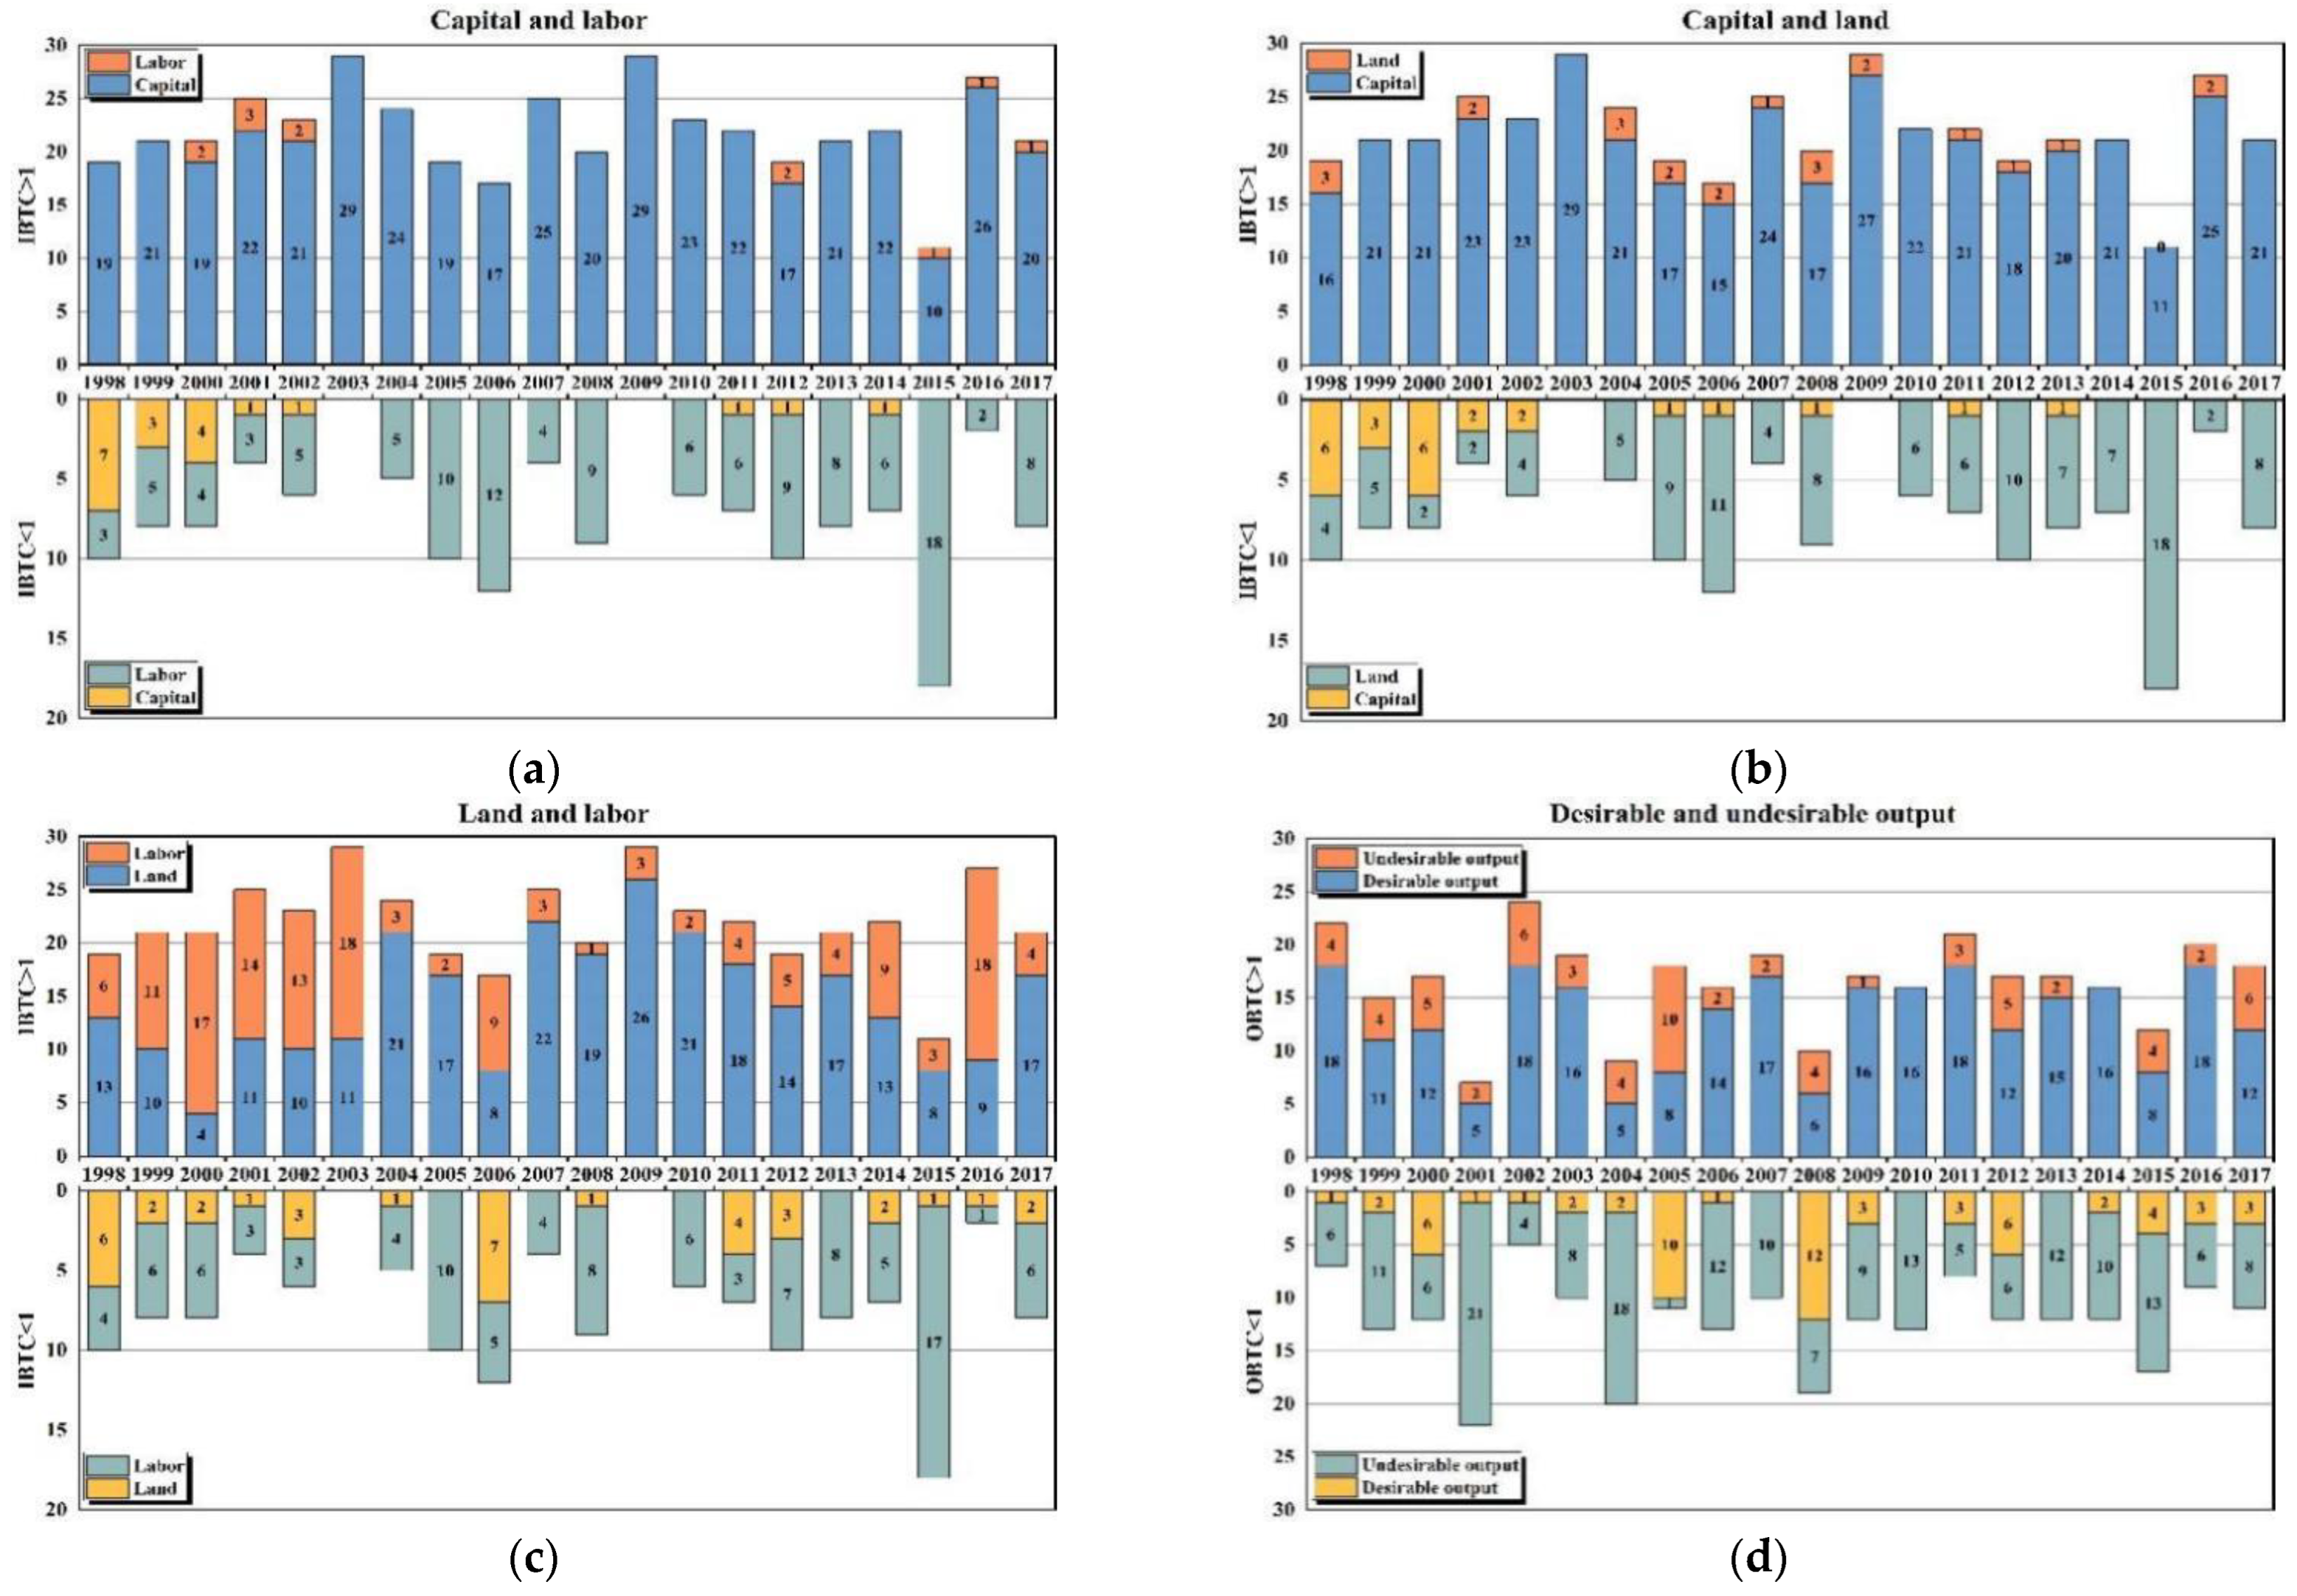
5.2. Bias Identification Analysis of Green Technical Change in Chinese Agriculture
5.3. Analysis of Influencing Factors on Green-Biased Technical Change in Chinese Agriculture
6. Conclusions and Policy Implications
- (1)
- During the research period from 1998 to 2017, technical change is the key driving force for improving China’s agricultural green total factor productivity, and green-biased technical change is crucial to maintaining the long-term and stable improvement of technical change. In contrast, the IBTC index plays a significant role in promoting technological progress, whereas the OBTC index impedes technological progress to some degree. According to the results of regional comparison, the BTC index in the eastern region shows a trend of “one high and one low”. Specifically, among all regions, the eastern region has the highest IBTC index, whereas its OBTC index is the lowest.
- (2)
- According to the identification results about the characteristics of green-biased technical change, China’s agricultural production shows a clear tendency of capital substituting for labor and land during the period from 1998 to 2017. On the one hand, it promotes the growth of IBTC, thus enhancing the improvement of agricultural GTFP. On the other hand, the application of agricultural technology with capital support continues to cause severe environmental problems. In general, the substitution effect of desirable output on undesirable output at the national level is slightly stronger and the advantage is not immediately apparent, but there has been a positive trend over the recent few years. The results of the regional comparison show that the eastern region has the most severe environmental problems with agricultural production.
- (3)
- As indicated by the regional grouping regression results obtained for the influencing factors of green-biased technical change, IBTC is promoted by the degree of marketization, the level of urbanization, the degree of capital deepening, and the intensity of financial support for agriculture. By contrast, the OBTC is mostly inhibited by these variables. As for the proportion of the farming sector and animal husbandry, it only has a positive impact on the growth of IBTC in the central region. Differently, the proportion of animal husbandry exerts a negative effect on OBTC to some extent. There is regional heterogeneity observed in the impact of environmental regulation intensity on biased technical change. In the eastern region, there is a period of transition from the “compliance costs” stage to the “innovation compensation” stage, whereas in the western region, there is a positive impact on biased technical change, which is due to its special resource endowment and economic development characteristics. However, a further enhancement of environmental regulation in the western region will make it counterproductive.
- (1)
- There is a close correlation between the biased changes in agricultural technology progress and the factor endowment structure of agricultural development in different periods. As an important source of agricultural growth in China’s transition period, the substitution of agricultural capital for labor and land factors represents an inevitable choice to ensure the continued balance between the supply and demand of agricultural products, given the current conflict between people and land and the development of a new period of urbanization. For compliance with this change in the mode of agricultural production, it is necessary to deepen the market-oriented reform of factors while giving full play to the market mechanism, and to provide an institutional guarantee for the deepening of agricultural capital, the transfer of agricultural labor force, and the orderly circulation and large-scale use of land.
- (2)
- The biased technical change of agriculture should be evaluated differently based on the circumstances of various provinces. Regions should seize the opportunities presented by the changes in factor endowments during the transformation of agriculture, maximizing the use of the regional advantages’ resource endowments and adapting their resources to local conditions in order to optimize the allocation and combination of capital, labor, and land. Through the optimization of industrial structure, operations on a moderate size and related facilities are enhanced, the regional comparative advantage is exerted, and the biased technical progress is steered in accordance with the regional agricultural production mode.
- (3)
- The development of agricultural green technology should be actively guided toward the stage of “innovation compensation” by implementing effective strategies of integrated innovation and demonstration promotion; for example: strengthening the guiding role of financial, taxation, fiscal, and other preferential means in the investment of agricultural enterprises in green technology R&D development; establishing a mechanism for the in-depth integration of industry, university, and research institutes, strengthening green-oriented technology research in agriculture, and bringing into play the synergistic innovation effect; stimulating the transformation and application of green technology achievements in agriculture by improving a multi-body and multi-dimensional agricultural science and technology promotion network, as well as pilot demonstrations in agricultural green development pioneer areas.
- (4)
- Reasonable environmental regulations may effectively minimize pollution emissions in the production process, conserve the input of production factors, and hasten the transformation of agricultural technology progress towards energy conservation and emission reduction. On the one hand, local governments should control the intensity of environmental regulations and properly balance economic performance and environmental performance based on the phased characteristics of regional agricultural development. On the basis of the comprehensive treatment of agricultural pollution, the reduction of agricultural inputs and their scientific use should be further promoted, and the resource utilization of livestock and poultry manure should be strengthened. On the other side, the government should energize the market-driven environmental regulations and build and enhance ecological compensation methods such as resource use rights, emissions trading, and carbon emissions trading.
- (5)
- Lastly, from the perspective of strategic foresight, with the rapid development of digitalization and intelligence and their deep penetration into agriculture, as well as other industries, the trend of capital substituting for labor and land will become increasingly apparent, having a revolutionary effect on the development of agricultural green technology. To promote the high-quality development of agriculture, it is essential to seize this period of strategic opportunity and layout in advance, and effectively implement the effective agglomeration and optimal allocation of agricultural capital, land, labor, and so on.
Author Contributions
Funding
Institutional Review Board Statement
Informed Consent Statement
Data Availability Statement
Conflicts of Interest
References
- Huang, J.; Yang, G. Understanding recent challenges and new food policy in China. Glob. Food Secur. 2017, 12, 119–126. [Google Scholar] [CrossRef]
- Kong, X.Z.; Zhang, C.; Zhang, X.R. Change of factor endowment and improvement of organic composition of agricultural capital: An explanation of China’s agricultural development path since 1978. Manag. World 2018, 34, 147–160. [Google Scholar]
- Yin, C.J.; Fu, M.H.; Li, G.C. Biased Technological Progress, Biased Factor Allocation and Agricultural TFP Growth in China. J. Huazhong Univ. Sci. Technol. (Soc. Sci. Ed.) 2018, 32, 50–59. [Google Scholar]
- Xu, X.; Huang, X.; Huang, J.; Gao, X.; Chen, L. Spatial-Temporal Characteristics of Agriculture Green Total Factor Productivity in China, 1998–2016: Based on More Sophisticated Calculations of Carbon Emissions. Int. J. Environ. Res. Public Health 2019, 16, 3932. [Google Scholar] [CrossRef] [PubMed] [Green Version]
- Tian, Y.; Yin, M.H. Re-evaluation of China’s Agricultural Carbon Emissions: Basic Status, Dynamic Evolution and Spatial Spillover Effects. China Rural Econ. 2022, 3, 104–127. [Google Scholar]
- Huang, X.; Feng, C.; Qin, J.; Wang, X.; Zhang, T. Measuring China’s agricultural green total factor productivity and its drivers during 1998–2019. Sci. Total Environ. 2022, 829, 154477. [Google Scholar] [CrossRef]
- Solow, R.M. A contribution to the theory of economic growth. Q. J. Econ. 1956, 70, 65–94. [Google Scholar] [CrossRef]
- Swan, T.W. Economic Growth and Capital Accumulation. Econ. Rec. 1956, 32, 334–361. [Google Scholar] [CrossRef]
- Hicks, J. The Theory of Wages; Macmillan: London, UK, 1932. [Google Scholar]
- Hayami, Y.; Ruttan, V.W. Agricultural Development: An International Perspective; The Johns Hopkins Press: Baltimore, MD, USA, 1971. [Google Scholar]
- Acemoglu, D. Why Do New Technologies Complement Skills? Directed Technical Change and Wage Inequality. Q. J. Econ. 1998, 113, 1055–1089. [Google Scholar] [CrossRef] [Green Version]
- Liu, W.J.; Du, M.Z.; Bai, Y. Impact of environmental regulations on green total factor productivity. China Popul. Resour. Environ. 2022, 32, 11–23. [Google Scholar]
- Lv, K.; Yu, S.; Fu, D.; Wang, J.; Wang, C.; Pan, J. The Impact of Financial Development and Green Finance on Regional Energy Intensity: New Evidence from 30 Chinese Provinces. Sustainability 2022, 14, 9207. [Google Scholar] [CrossRef]
- Acemoglu, D. Directed technical change. Rev. Econ. Stud. 2002, 69, 781–809. [Google Scholar] [CrossRef] [Green Version]
- Acemoglu, D. Labor and capital augmenting technical change. J. Eur. Econ. Assoc. 2003, 1, 1–37. [Google Scholar] [CrossRef] [Green Version]
- Acemoglu, D. Equilibrium bias of technology. Econometrica 2007, 75, 1371–1409. [Google Scholar] [CrossRef]
- Gong, B.L. Agricultural reforms and production in China: Changes in provincial production function and productivity in 1978–2015. J. Dev. Econ. 2018, 132, 18–31. [Google Scholar] [CrossRef]
- Klump, R.; McAdam, P.; Willman, A. Factor substitution and factor-augmenting technical progress in the United States: A normalized supply-side system approach. Rev. Econ. Stat. 2007, 89, 183–192. [Google Scholar] [CrossRef]
- Klump, R.; McAdam, P.; Willman, A. Unwrapping some euro area growth puzzles: Factor substitution, productivity and unemployment. J. Macroecon. 2008, 30, 645–666. [Google Scholar] [CrossRef]
- Young, A.T. US elasticities of substitution and factor-augmentation at the industry level. Macroecon. Dyn. 2013, 17, 861–897. [Google Scholar] [CrossRef]
- Chen, X. Biased technical change, scale, and factor substitution in U.S. manufacturing industries. Macroecon. Dyn. 2016, 1, 488–514. [Google Scholar] [CrossRef]
- Zhu, X.H.; Zeng, A.Q.; Zhong, M.R.; Huang, J.B. Elasticity of substitution and biased technical change in the CES production function for China’s metal-intensive industries. Resour. Policy 2021, 73, 102216. [Google Scholar] [CrossRef]
- Wang, L.H.; Yuan, L. Factor abundance, Directed Technical Change and Factor Income Distribution Structure of Agriculture in China. J. Northeast Norm. Univ. (Philos. Soc. Sci.) 2015, 1, 70–80. [Google Scholar]
- Yang, X.; Li, X.P.; Zhong, C.P. Study on the revolution Trend and Influencing Factors of China’s Industrail Directed Technical Change. J. Quant. Technol. Econ. 2019, 36, 101–119. [Google Scholar]
- Shao, S.; Luan, R.R.; Yang, Z.B.; Li, C.Y. Does directed technological change get greener: Empirical evidence from Shanghai’s industrial green development transformation. Ecol. Indic. 2016, 69, 758–770. [Google Scholar] [CrossRef]
- Yang, Z.B.; Shao, S.; Li, C.Y.; Yang, L.L. Alleviating the misallocation of R&D inputs in China’s manufacturing sector: From the perspectives of factor-biased technological innovation and substitution elasticity. Technol. Forecast. Soc. Chang. 2020, 151, 119878. [Google Scholar] [CrossRef]
- Taylor, T.G.; Shonkwiler, J.S. Alternative stochastic specifications of the frontier production function in the analysis of agricultural credit programs and technical efficiency. J. Dev. Econ. 1986, 21, 149–160. [Google Scholar] [CrossRef]
- Battese, G.E. Frontier production functions and technical efficiency: A survey of empirical applications in agricultural economics. Agric. Econ. 1992, 7, 185–208. [Google Scholar] [CrossRef]
- Kalirajan, K.P.; Obwona, M.B.; Zhao, S. A decomposition of total factor productivity growth: The case of Chinese agricultural growth before and after reforms. Am. J. Agric. Econ. 1996, 78, 331–338. [Google Scholar] [CrossRef]
- Caves, D.W.; Christensen, L.R.; Diewert, W.E. Multilateral Comparisons of Output, Input, and Productivity Using Superlative Index Numbers. Econ. J. 1982, 92, 73–86. [Google Scholar] [CrossRef]
- Färe, R.; Grosskopf, S.; Norris, M.; Zhang, Z. Productivity Growth, Technical Progress, and Efficiency Change in Industrialized Countries. Am. Econ. Rev. 1994, 84, 66–83. [Google Scholar]
- Färe, R.; Grifell-Tatjé, E.; Grosskopf, S.; Knox Lovell, C.A. Biased technical change and the Malmquist productivity index. Scand. J. Econ. 1997, 99, 119–127. [Google Scholar] [CrossRef]
- Huang, J.B.; Zou, H.; Song, Y. Biased technical change and its influencing factors of iron and steel industry: Evidence from provincial panel data in China. J. Clean. Prod. 2020, 283, 124558. [Google Scholar] [CrossRef]
- Lv, C.; Shao, C.; Lee, C. Green technology innovation and fifinancial development: Do environmental regulation and innovation output matter? Energy Econ. 2021, 98, 105237. [Google Scholar] [CrossRef]
- Zhang, X.; Sun, F.; Wang, H.; Qu, Y. Green Biased Technical Change in Terms of Industrial Water Resources in China’s Yangtze River Economic Belt. Int. J. Environ. Res. Public Health 2020, 17, 2789. [Google Scholar] [CrossRef] [PubMed] [Green Version]
- Zhong, J.D. Biased Technical Change, Factor Substitution, and Carbon Emissions Efficiency in China. Sustainability 2019, 11, 955. [Google Scholar] [CrossRef] [Green Version]
- Ding, L.L.; Zhang, K.X.; Yang, Y. Carbon emission intensity and biased technical change in China’s different regions: A novel multidimensional decomposition approach. Environ. Sci. Pollut. Res. 2022, 29, 38083–38096. [Google Scholar] [CrossRef] [PubMed]
- Managi, S.; Karemera, D. Input and output biased technological change in US agriculture. Appl. Econ. Lett. 2004, 11, 283–286. [Google Scholar] [CrossRef]
- Singh, P.; Singh, A. Decomposition of technical change and productivity growth in Indian agriculture using non-parametric Malmquist index. Eurasian J. Bus. Econ. 2012, 5, 187–202. [Google Scholar]
- Hu, J.F.; Wang, Z.; Huang, Q.H. Factor allocation structure and green-biased technological progress in Chinese agriculture. Econ. Res.-Ekon. Istraž. 2021, 34, 2034–2058. [Google Scholar] [CrossRef]
- Jaffe, A.; Palmer, K. Environmental regulation and innovation: A panel data study. Rev. Econ. Stat. 1997, 79, 610–619. [Google Scholar] [CrossRef]
- Porter, M.E.; Linde, C.D. Toward a new conception of the environment-competitiveness relationship. J. Econ. Perspect. 1995, 9, 97–118. [Google Scholar] [CrossRef] [Green Version]
- Chen, C.; Lan, Q.; Gao, M.; Sun, Y. Green Total Factor Productivity Growth and Its Determinants in China’s Industrial Economy. Sustainability 2018, 10, 1052. [Google Scholar] [CrossRef] [Green Version]
- Zhang, M.; Liu, X.; Ding, Y.; Wang, W. How does environmental regulation affect haze pollution governance? An empirical test based on Chinese provincial panel data. Sci. Total Environ. 2019, 695, 133905. [Google Scholar] [CrossRef] [PubMed]
- Liu, Y.; Zhu, J.; Li, E.; Mong, Z.; Song, Y. Environmental regulation, green technological innovation, and eco-efficiency: The case of Yangtze river economic belt in China. Technol. Forecast. Soc. Chang. 2020, 155, 119993. [Google Scholar] [CrossRef]
- Ding, L.L.; Yang, Y.; Zheng, H.; Wang, L. Heterogeneity and the influencing factors of provincial green-biased technological progress in China. China Popul. Resour. Environ. 2020, 30, 84–92. [Google Scholar]
- Acemoglu, D. Patterns of Skill Premia. Rev. Econ. Stud. 2003, 70, 199–230. [Google Scholar] [CrossRef]
- Liu, D.D.; Zhu, X.Y.; Wang, Y.F. China’s agricultural green total factor productivity based on carbon emission: An analysis of evolution trend and influencing factors. J. Clean. Prod. 2021, 278, 123692. [Google Scholar] [CrossRef]
- Chen, Y.F.; Miao, J.F.; Zhu, Z.T. Measuring green total factor productivity of China’s agricultural sector: A three-stage SBM-DEA model with non-point source pollution and CO2 emissions. J. Clean. Prod. 2021, 318, 128543. [Google Scholar] [CrossRef]
- Hu, J.; Zhang, X.; Wang, T. Spatial Spillover Effects of Resource Misallocation on the Green Total Factor Productivity in Chinese Agriculture. Int. J. Environ. Res. Public Health 2022, 19, 15718. [Google Scholar] [CrossRef]
- Zhu, L.; Shi, R.; Mi, L.; Liu, P.; Wang, G. Spatial Distribution and Convergence of Agricultural Green Total Factor Productivity in China. Int. J. Environ. Res. Public Health 2022, 19, 8786. [Google Scholar] [CrossRef] [PubMed]
- Gong, B.L. The Impact of Public Expenditure and International Trade on Agricultural Productivity in China. Emerg. Mark. Financ. Trade 2018, 54, 3438–3453. [Google Scholar] [CrossRef]
- Wu, G.; Fan, Y.; Riaz, N. Spatial Analysis of Agriculture Ecological Effificiency and Its Inflfluence on Fiscal Expenditures. Sustainability 2022, 14, 9994. [Google Scholar] [CrossRef]
- Tone, K. A slacks-based measure of efficiency in data envelopment analysis. Eur. J. Oper. Res. 2001, 130, 498–509. [Google Scholar] [CrossRef] [Green Version]
- Tone, K.; Sahoo, B.K. Degree of scale economies and congestion: A unified DEA approach. Eur. J. Oper. Res. 2004, 158, 755–772. [Google Scholar] [CrossRef] [Green Version]
- Chung, Y.H.; Färe, R.; Grosskopf, S. Productivity and undesirable outputs: A directional distance function approach. J. Environ. Manag. 1997, 51, 229–240. [Google Scholar] [CrossRef] [Green Version]
- Weber, W.L.; Domazlicky, B.R. Total factor productivity growth in manufacturing: A regional approach using linear programming. Reg. Sci. Urban Econ. 1999, 29, 105–122. [Google Scholar] [CrossRef]
- Li, G.C.; Fan, L.X.; Feng, Z.C. Capital Accumulation, Institutional Change and Agricultural Growth: An Empirical Estimation of China’s Agricultural Growth and Capital Stock from 1978 to 2011. Manag. Sci. 2014, 14, 67–79. [Google Scholar]
- Huang, X.Q.; Xu, X.C.; Wang, Q.Q.; Zhang, L.; Gao, X.; Chen, L.H. Assessment of agricultural carbon emissions and their spatiotemporal changes in China, 1997–2016. Int. J. Environ. Res. Public Health 2019, 16, 3105. [Google Scholar] [CrossRef] [Green Version]
- Feenstra, R.C.; Inklaar, R.; Timmer, M.P. The Next Generation of the Penn World Table. Am. Econ. Rev. 2015, 105, 3150–3182. [Google Scholar] [CrossRef] [Green Version]
- Min, J.S.; Hu, H. Calculation of Greenhouse Gases Emission from Agricultural Production in China. China Popul. Resour. Environ. 2012, 22, 21–27. [Google Scholar]
- Wu, X.R.; Zhang, J.B.; You, L.Z. Marginal Abatement Cost of Agricultural Carbon Emissions in China: 1993–2015. China Agric. Econ. Rev. 2018, 10, 558–571. [Google Scholar] [CrossRef]
- Zhang, G.; Sun, B.F.; Zhao, H.; Wang, X.K.; Zheng, C.Y.; Xiong, K.N.; Ouyang, Z.Y.; Lu, F.; Yuan, Y.F. Estimation of greenhouse gas mitigation potential through optimized application of synthetic N, P and K fertilizer to major cereal crops: A case study from China. J. Clean. Prod. 2019, 237, 117650. [Google Scholar] [CrossRef]
- West, T.O.; Marland, G. A synthesis of carbon sequestration, carbon emissions, and net carbon flux in agriculture: Comparing tillage practices in the United States. Agric. Ecosyst. Environ. 2002, 91, 217–232. [Google Scholar] [CrossRef]
- Cheng, K.; Pan, G.X.; Smith, P.; Luo, T.; Li, L.Q.; Zheng, J.W.; Zhang, X.H.; Han, X.J.; Yan, M. Carbon footprint of China’s crop production: An estimation using agro-statistics data over 1993–2007. Agric. Ecosyst. Environ. 2011, 142, 231–237. [Google Scholar] [CrossRef]
- Lai, S.Y.; Du, P.F.; Chen, J.N. Evaluation of non-point source pollution based on unit analysis. J. Tsinghua Univ. (Sci. Technol. Ed.) 2004, 44, 1184–1187. [Google Scholar]
- Chen, M.; Chen, J.; Du, P. An inventory analysis of rural pollution loads in China. Water Sci. Technol. 2006, 54, 65–74. [Google Scholar] [CrossRef]
- Studenmund, A.H. Using Econometrics: A Practical Guide, 7th ed.; Pearson Education Inc.: New York, NY, USA, 2016. [Google Scholar]
- Vancea, D.P.C.; Aivaz, K.A.; Simion, L.; Vanghele, D. Export Expansion Policies. An Analysis of Romanian Exports Between 2005–2020 Using the Principal Component Analysis Method and Short Recommandations for Increasing this Activity. Transform. Bus. Econ. 2021, 20, 614–634. [Google Scholar]
- Determinants of Economic Growth for the Last Half Century: A Panel Data Analysis on 50 Countries. Available online: https://www.researchgate.net/publication/358983224_Determinants_of_Economic_Growth_for_the_Last_Half_of_Century_A_Panel_Data_Analysis_on_50_Countries (accessed on 5 October 2022).
- Driscoll, J.C.; Kraay, A.C. Consistent covariance matrix estimation with spatially dependent data. Rev. Econ. Stat. 1998, 80, 549–560. [Google Scholar] [CrossRef]
- Daniel, H. Robust Standard Errors for Panel Regressions with Cross-sectional Dependence. Stata J. 2007, 7, 281–312. [Google Scholar] [CrossRef]


| Input | IBTC > 1 | IBTC = 1 | IBTC < 1 |
| Technological progress of using and saving | Neutral | Technological progress of using and saving | |
| Technological progress of using and saving | Neutral | Technological progress of using and saving | |
| Output | OBTC > 1 | OBTC = 1 | OBTC < 1 |
| Environmentally friendly technological progress | Neutral | Environmental degradation technological progress | |
| Environmental degradation technological progress | Neutral | Environmentally friendly technological progress |
| Source | Sub Source | Reference Sources for Carbon Emission Coefficient |
|---|---|---|
| Agricultural materials | Chemical fertilizers (including nitrogen, phosphorus, potassium and compound fertilizers), pesticides, and agricultural films | Zhang et al. (2019), West (2002), Cheng et al. (2011) [63,64,65] |
| Rice cultivation | Early rice, middle rice, and late rice | Min et al. (2012), Tian et al. (2022) [5,61] |
| Livestock breeding * | Cattle (including beef cattle, dairy cattle, buffalo), sheep (including goats and sheep), pigs, poultry | Min et al. (2012), Huang et al. (2022) [6,61] |
| Agricultural energy | Agricultural diesel oil | IPCC |
| Activity | Class | Unit | Indicator | Discharged Pollutants |
|---|---|---|---|---|
| Fertilizer runoff | Nitrogenous Fertilizer (NF) | NF use for grain crops NF use for vegetables NF use for other crops | NF consumption (104 t) | TN, TP |
| Phosphate Fertilizer (PF) | PF use for grain crops PF use for vegetables PF use for other crops | PF consumption (104 t) | ||
| Compound Fertilizer (CF) | CF use for grain crops CF use for vegetables CF use for other crops | CF consumption (104 t) | ||
| Livestock and poultry breeding * | Livestock | Cow and cattle | Year-end inventory (104 head) | CODcr, TN, TP |
| Pig | Slaughtered number (104 head) | |||
| Sheep | Year-end inventory (104 head) | |||
| poultry | Poultry | Slaughtered number (104 head) | ||
| Agricultural organic waste | Grain crops | Rice Wheat Beans Corn | Yield (104 t) | CODcr, TN, TP |
| Economic crops | Oil-bearing crops Vegetables, fruits | Yield (104 t) | ||
| Rural sewage Rural wastes | Rural wastewater Rural solid waste | Person | Rural population (104 person) | CODcr, TN, TP |
| Person | Rural population (104 person) |
| Year | OBTC | IBTC | ||||
|---|---|---|---|---|---|---|
| Eastern Region | Central Region | Western Region | Eastern Region | Central Region | Western Region | |
| 1998–2000 | 0.98259 | 0.99587 | 1.00060 | 1.00291 | 1.00066 | 1.00140 |
| 2001–2005 | 1.00251 | 0.99583 | 0.98209 | 1.00873 | 1.00087 | 1.00107 |
| 2006–2010 | 0.99784 | 0.99993 | 0.99981 | 1.01579 | 0.99761 | 1.00066 |
| 2011–2015 | 0.99211 | 0.99994 | 1.00321 | 1.01090 | 0.99871 | 0.99995 |
| 2016–2017 | 0.99865 | 1.00040 | 1.00165 | 1.01396 | 1.00187 | 1.00280 |
| Average | 0.99535 | 0.99834 | 0.99650 | 1.01068 | 0.99958 | 1.00091 |
| Region | Capital and Labor | Capital and Land | Land and Labor | Desirable and Undesirable Output | ||||
|---|---|---|---|---|---|---|---|---|
| Capital | Labor | Capital | Land | Land | Labor | Desirable Output | Undesirable Output | |
| Eastern Region | 164 | 56 | 156 | 64 | 110 | 110 | 90 | 130 |
| Central Region | 120 | 40 | 121 | 39 | 92 | 68 | 104 | 56 |
| Western Region | 161 | 39 | 160 | 40 | 123 | 77 | 129 | 69 |
| Total samples | 445 | 135 | 437 | 143 | 325 | 255 | 323 | 255 |
| Mean | Standard Dev | Minimum | Maximum | Skewness | Kurtosis | Jarque–Bera Test | Observations | |
|---|---|---|---|---|---|---|---|---|
| lnIBTC | 0.0038 | 0.0173 | −0.00448 | 0.1035 | 2.9596 | 17.7605 | 6112 *** | 580 |
| lnOBTC | −0.0029 | 0.0194 | −0.1116 | 0.0510 | −2.7606 | 16.4924 | 5136 *** | 580 |
| lnMA | 1.8080 | 0.3505 | 0.8078 | 2.3921 | −0.4792 | 2.6509 | 25.15 *** | 580 |
| lnUL | −0.7793 | 0.3308 | −1.6245 | −0.1187 | −0.2409 | 2.7983 | 6.593 ** | 580 |
| lnCD | −1.2450 | 0.7378 | −4.3559 | −0.0721 | −1.8913 | 8.3489 | 1037 *** | 580 |
| lnFS | −2.3735 | 0.4069 | −3.7297 | −1.7259 | −1.0571 | 4.0012 | 132.3 *** | 580 |
| ER | 0.0128 | 0.0072 | 0.0029 | 0.0403 | 1.5223 | 5.5945 | 386.7 *** | 580 |
| ER2 | 0.0002 | 0.0003 | 8.41 × 10⁻⁶ | 0.0016 | 2.8749 | 12.2450 | 2865 *** | 580 |
| lnDR | −1.5735 | 0.7650 | −6.2146 | −0.3368 | −1.3051 | 6.4919 | 453.8 *** | 573 |
| lnPF | −0.6497 | 0.1673 | −1.0023 | −0.3011 | 0.1179 | 2.4222 | 9.412 *** | 580 |
| lnAH | −1.2168 | 0.2899 | −1.8643 | −0.6143 | −0.0849 | 2.5101 | 6.499 ** | 580 |
| lnIBTC | lnOBTC | lnMA | lnUL | lnCD | lnFS | ER | ER2 | lnDR | lnPF | lnAH | |
|---|---|---|---|---|---|---|---|---|---|---|---|
| lnIBTC | 1.0000 | ||||||||||
| lnOBTC | / | 1.0000 | |||||||||
| lnMA | 0.1968 *** | −0.0293 | 1.0000 | ||||||||
| lnUL | 0.1972 *** | −0.0667 | 0.5677 *** | 1.0000 | |||||||
| lnCD | 0.1386 *** | −0.1056 ** | 0.3600 *** | 0.3896 *** | 1.0000 | ||||||
| lnFS | −0.1717 *** | 0.1138 *** | −0.3419 *** | −0.1935 *** | −0.3379 *** | 1.0000 | |||||
| ER | −0.0294 | −0.0767 * | −0.1062 ** | 0.1811 *** | 0.2118 *** | 0.2150 *** | 1.0000 | ||||
| ER2 | 0.0068 | 0.0068 ** | −0.2106 *** | 0.0314 | 0.0927 ** | 0.1328 *** | 0.7102 *** | 1.0000 | |||
| lnDR | −0.1090 *** | −0.0255 | −0.4871 *** | −0.2726 *** | −0.1114 *** | 0.1850 *** | 0.0831 ** | 0.0945 ** | 1.0000 | ||
| lnPF | −0.1444 *** | 0.0941 ** | −0.4583 *** | −0.2931 *** | −0.2013 *** | 0.3939 *** | 0.1514 *** | 0.1651 *** | 0.1151 *** | 1.0000 | |
| lnAH | −0.1063 ** | −0.0005 | −0.1940 *** | −0.0418 | −0.0507 | −0.0616 | 0.0915 ** | 0.0688 * | 0.1643 *** | −0.2792 *** | 1.0000 |
| lnIBTC | lnOBTC | lnMA | lnUL | lnFS | ER | ER2 | lnDR | lnPF | lnAH | |
|---|---|---|---|---|---|---|---|---|---|---|
| lnIBTC | 0.0003 | |||||||||
| lnOBTC | / | 0.0004 | ||||||||
| lnMA | 0.0011 | −0.0003 | 0.1213 | |||||||
| lnUL | 0.0011 | −0.0006 | 0.0628 | 0.1055 | ||||||
| lnCD | 0.0017 | −0.0015 | 0.0921 | 0.0937 | ||||||
| lnFS | −0.0011 | 0.0008 | −0.0456 | −0.0225 | 0.1571 | |||||
| ER | −0.0004 | −0.0012 | 0.0329 | 0.0672 | 0.0856 | 1.0025 | ||||
| ER2 | −0.0003 | −0.0035 | −0.1581 | 0.0252 | 0.1147 | 1.5377 | 4.6386 | |||
| lnDR | −0.0014 | −0.0003 | −0.1298 | −0.0677 | 0.0561 | 0.0636 | 0.1576 | 0.5853 | ||
| lnPF | −0.0004 | 0.0002 | −0.0271 | −0.0164 | 0.0265 | 0.0257 | 0.0571 | 0.0148 | 0.0282 | |
| lnAH | −0.0005 | 0.0001 | −0.0184 | −0.0019 | −0.0087 | 0.0243 | 0.0099 | 0.0364 | −0.0136 | 0.0840 |
| Variables | LLC Test | ADF-Fisher Test | PP-Fisher Test |
|---|---|---|---|
| LnIBTC | −18.2225 *** | 145.8261 *** | 429.1882 *** |
| LnOBTC | −22.0813 *** | 292.1797 *** | 620.4112 *** |
| lnMA | −10.7147 *** | 148.6061 *** | 289.9698 *** |
| lnUL | −31.8652 *** | 381.2459 *** | 87.7849 *** |
| lnCD | −1.2960 * | 107.0598 *** | 78.1833 ** |
| lnFS | −5.7594 *** | 492.2177 *** | 125.3569 *** |
| ER | −10.0466 *** | 135.7645 *** | 218.8106 *** |
| lnDR | −11.8420 *** | 132.1506 *** | 383.0298 *** |
| lnPF | −4.2352 *** | 83.1229 ** | 75.0570 * |
| lnAH | −3.3904 *** | 107.2212 *** | 76.3836 * |
| Explained Variable | Test | Statistics | p Value |
|---|---|---|---|
| lnIBTC | F test | 3.02 *** | 0.0000 |
| Breusch–Pagan LM test | 25.18 *** | 0.0000 | |
| Hausman test (Cross-section Random) | 21.539 ** | 0.0105 | |
| lnOBTC | F test | 1.64 ** | 0.0059 |
| Breusch–Pagan LM test | 2.66 * | 0.0513 | |
| Hausman test (Cross-section Random) | 16.370 * | 0.0595 |
| Variables | lnIBTC | lnOBTC | ||||||
|---|---|---|---|---|---|---|---|---|
| (1) | (2) | (3) | (4) | (5) | (6) | (7) | (8) | |
| Total Samples | Eastern Region | Central Region | Western Region | Total Samples | Eastern Region | Central Region | Western Region | |
| lnMA | 0.0021 (0.0035) | 0.0363 *** (0.0087) | 0.0083 (0.0112) | −0.0001 (0.0033) | 0.0018 (0.0088) | −0.0173 (0.0362) | 0.0198 * (0.0101) | −0.0065 (0.0072) |
| lnUL | 0.0052 * (0.0027) | 0.0027 (0.0077) | 0.0053 (0.0044) | 0.0042 ** (0.0014) | −0.0102 *** (0.0028) | −0.0272 *** (0.0054) | −0.0413 *** (0.0071) | −0.0010 (0.0010) |
| lnCD | −0.0025 (0.0017) | 0.0117 ** (0.0052) | −0.0019 (0.0017) | −0.0013 (0.0009) | −0.0028 (0.0028) | −0.0300 *** (0.0058) | −0.0058 *** (0.0015) | 0.0050 ** (0.0020) |
| lnFS | 0.0100 *** (0.0025) | 0.0229 * (0.0114) | 0.0027 (0.0027) | −0.0003 (0.0022) | −0.0078 (0.0046) | −0.0061 (0.0138) | −0.0006 (0.0048) | −0.0082 (0.0062) |
| ER | −0.7761 *** (0.1574) | −2.0264 *** (0.4751) | −0.1211 (0.3218) | 0.3311 * (0.1608) | −0.1151 (0.2135) | −1.8207 ** (0.7417) | 0.8116 (0.8059) | 0.9338 *** (0.1812) |
| ER2 | 12.7479 *** (4.4072) | 50.7286 *** (16.6306) | −2.9618 (10.5899) | −6.6953 (3.9956) | −1.8625 (6.2291) | 45.4718 *** (12.0672) | −15.2118 (16.2269) | −27.2374 *** (7.4569) |
| lnDR | 0.0006 (0.0004) | 0.0028 ** (0.0011) | 0.0007 (0.0009) | 0.0003 (0.0003) | −0.0027 *** (0.0008) | −0.0040 *** (0.0012) | −0.0006 (0.0009) | −0.0002 (0.0010) |
| lnPF | −0.0503 *** (0.0147) | −0.1131 *** (0.0243) | 0.0499 * (0.0260) | −0.0098 (0.0104) | 0.0144 (0.0121) | 0.0924 * (0.0444) | −0.0420 (0.0266) | 0.0078 (0.0049) |
| lnAH | −0.0147 * (0.0076) | −0.0358 *** (0.0094) | 0.0231 *** (0.0079) | −0.0055 (0.0080) | −0.0177 *** (0.0049) | −0.0088 (0.0123) | −0.0095 (0.0081) | −0.0070 ** (0.0032) |
| Constant | −0.0084 (0.0128) | −0.0702 * (0.0395) | 0.0000 (0.0000) | 0.0000 (0.0000) | −0.0836 ** (0.0343) | −0.0385 (0.0800) | 0.0000 (0.0000) | 0.0000 (0.0000) |
| R2 | 0.2776 | 0.3426 | 0.2151 | 0.2671 | 0.1649 | 0.2386 | 0.3680 | 0.2790 |
| F test | 167.8366 *** | 5028.2179 *** | 76.3014 *** | 205.0315 *** | 179.2126 *** | 1455.8758 *** | 189.5409 *** | 118.9316 *** |
| Sample | 573 | 213 | 160 | 200 | 573 | 213 | 160 | 200 |
| Year Effect | Yes | Yes | Yes | Yes | Yes | Yes | Yes | Yes |
| Region Effect | Yes | Yes | Yes | Yes | Yes | Yes | Yes | Yes |
Publisher’s Note: MDPI stays neutral with regard to jurisdictional claims in published maps and institutional affiliations. |
© 2022 by the authors. Licensee MDPI, Basel, Switzerland. This article is an open access article distributed under the terms and conditions of the Creative Commons Attribution (CC BY) license (https://creativecommons.org/licenses/by/4.0/).
Share and Cite
Wang, Y.; Zuo, L.; Qian, S. Green-Biased Technical Change and Its Influencing Factors of Agriculture Industry: Empirical Evidence at the Provincial Level in China. Int. J. Environ. Res. Public Health 2022, 19, 16369. https://doi.org/10.3390/ijerph192316369
Wang Y, Zuo L, Qian S. Green-Biased Technical Change and Its Influencing Factors of Agriculture Industry: Empirical Evidence at the Provincial Level in China. International Journal of Environmental Research and Public Health. 2022; 19(23):16369. https://doi.org/10.3390/ijerph192316369
Chicago/Turabian StyleWang, Yan, Lingling Zuo, and Shujing Qian. 2022. "Green-Biased Technical Change and Its Influencing Factors of Agriculture Industry: Empirical Evidence at the Provincial Level in China" International Journal of Environmental Research and Public Health 19, no. 23: 16369. https://doi.org/10.3390/ijerph192316369
APA StyleWang, Y., Zuo, L., & Qian, S. (2022). Green-Biased Technical Change and Its Influencing Factors of Agriculture Industry: Empirical Evidence at the Provincial Level in China. International Journal of Environmental Research and Public Health, 19(23), 16369. https://doi.org/10.3390/ijerph192316369