1. Introduction
At present, the importance of predicting the risk of business failure is increasing. There are a number of methods, both theoretical and practical, that measure the financial health of companies, reveal the likelihood of their possible financial failure, and propose solutions to avoid bankruptcy. Several of these methods are based on mathematical and statistical methods, most of which involve the application of regression models and models of discriminant analysis. Authors researching this issue classify these methods and models from different perspectives. According to
Ghodrati and Moghaddam (
2012) (in
Klieštik et al. 2019), models for predicting business bankruptcy are divided into statistical models, artificial intelligence models, and theoretical models. In their study,
Balcaen and Ooghe (
2004) addressed the issue of methods that can be applied to detect possible business failure. They investigated whether sophisticated alternative methods yielded better results than classic statistical methods. In their conclusion they pointed out the significant benefits of these methods. In their work they classified alternative prediction models (
Klieštik et al. 2019) to models based on the fuzzy principle, multi logit model, CUSUM model, DEHA (dynamic event history analysis), models of chaos theory and catastrophic scenarios, models of multidimensional scaling, linear goal programming, multicriteria decision making, models focused on analysis of rough sets, expert systems, and self-organizing maps.
Alternative methods include multidimensional survey techniques, which analyze relationships between groups of variables, relationships within groups of variables, and differences in the behavior of variables in different subgroups. With regard to that, we would like to point out the MDS and PCA methods, as well as the DEA, which are addressed in this paper. The DEA method is one of the non-statistical and non-parametric methods of analyzing the efficiency and financial health of companies as well as predicting possible bankruptcy. It is the opposite of the above-mentioned statistical methods of evaluation and prediction of possible financial distress of companies.
The paper follows our previous research (
Horváthová and Mokrišová 2020;
Štefko et al. 2020) in which we used the same sample of businesses. However, this paper deals with different methods and approaches to the selection of the indicators entering the DEA model. This is related to the identified gap in the research, which is finding a suitable method for selecting indicators to the DEA model. Whereas in the previous studies, we selected indicators based on the correlation matrix or we took over indicators from recognized authors, in this paper, we used the PCA method to point out the predictors of bankruptcy. We also compared the classification ability of the DEA model achieved in this study with the previous research.
Based on the above, the aim of the presented research was to select the inputs and outputs to the DEA model with the use of the PCA method. These inputs and outputs were selected based on the research of
Serrano-Cinca and Mar Molinero (
2004) and the research of
Nasser (
2019). The partial goal was to predict the financial distress of the analyzed sample of businesses using the DEA method and to graphically display the results using MDS and PCA methods. Another partial goal was to compare the results of the applied methods and draw conclusions that affect the applicability of these methods (statistical, but also non-statistical) in the field of predicting the financial distress of companies. In line with the above-mentioned, we set the following hypothesis: We assume that the use of the PCA method to select inputs and outputs to the DEA model will increase the classification ability of the model.
The remainder of the paper is structured as follows.
Section 1 lists the link with the previous research, research gap, aim of the research, and the hypothesis.
Section 2 outlines the theoretical basis of the studied problem. This part of the paper describes the use of the DEA, the PCA, and the MDS in financial health analysis and bankruptcy prediction.
Section 3 describes the data, the analyzed sample of businesses, and the processing methods. When addressing the research problem, we made use of selected financial indicators, the MDS, the PCA, and the DEA.
Section 4 lists the results of the PCA and the MDS, which were used to analyze the data and select the input parameters to the DEA model. This section also includes the results of the input-oriented BCC DEA model and compares them with the results of our previous research as well as the results of other authors.
Section 5 summarizes the essential conclusions resulting from the research and presents the significant findings.
2. Literature Review
Fitzpatrick (
1931; in
Klieštik et al. 2019) was the first to deal with the prediction of bankruptcy. In his study, he compared the financial indicators of solvent and insolvent companies. The use of simple financial indicators in predicting bankruptcy was questioned by
Beaver (
1966), who used one-dimensional discriminant analysis. After one-dimensional discriminant analysis, methods of multidimensional discriminant analysis were introduced.
Altman (
1968) developed a model of multidimensional discriminant analysis (MDA), known as the Z-score. Based on the shortcomings of discriminant analysis, the next step in the theory of bankruptcy prediction was the development of methods and models that would be able to provide information on the probability of business bankruptcy (
Mihalovič 2015). Therefore, logistic regression began to be preferred. Recently, more than 30 different methods have emerged, which mainly use mathematical programming, operations research, or artificial intelligence in forecasting the financial situation of companies. These methods have been used by
Mahmood and Lawrence (
1987),
Gupta et al. (
1990),
Chen et al. (
2009), and
Cho et al. (
2010).
One of the appropriate mathematical programming methods for predicting bankruptcy that are applied in this research is DEA. This method is based on the work of
Farrell (
1957), who proposed an approach to measuring production efficiency. The pioneers of DEA were
Charnes et al. (
1978), who introduced the first DEA model based on the concept of Farrell’s efficiency. Their model is abbreviated CCR after the names of its founders, and it is based on the assumption of constant returns to scale (CRS). The CCR model defines the relative efficiency for any DMU as the weighted sum of the outputs divided by the weighted sum of the inputs, whereas the efficiency score can only be between 0 and 1. A score less than 1 means that the production unit is below the production frontier (
Thanassoulis 2001). Assuming constant returns to scale, the limit of production possibilities is linear, which means that outputs grow at the same rate as inputs. If we use the CCR model, the estimated efficiency score of the production unit is the same for the input-oriented and output-oriented model.
The second basic model is the BCC DEA model designed by
Banker et al. (
1984). The model is also named after its creators. It assumes variable returns to scale (VRS). The difference between the CCR and BCC model is in the addition of the constraint. Production frontiers of the BCC model are spanned by the convex hull of the existing DMUs (
Vishkaeii et al. 2020). It results in a larger number of units being marked as effective when using this model (
Kočišová 2012).
The first idea associated with the use of the DEA method for predicting bankruptcy was recorded by
Simak (
1997), who first compared its results with the results of Altman’s Z-score. It has been found that this research has various application opportunities. Other authors who predicted bankruptcy using DEA were
Cielen et al. (
2004). These authors used the radial DEA model to predict bankruptcy and compared its results with the results of discriminant analysis (DA). In the same year,
Paradi et al. (
2004) applied the additive and radial model applying peeling technique. This model achieved 100% success in predicting bankrupt companies.
Premachandra et al. (
2009) used the additive DEA model and compared its results with the results of logistic regression. The outcome of this research was a satisfactory level of correct prediction of bankruptcy. The prediction rate for financially healthy businesses was less accurate.
Sueyoshi and Goto (
2009) applied the additive DEA model and created a financial distress frontier. They compared the results of the DEA model with the DEA–DA approach.
Premachandra et al. (
2011) joined the radial and additive DEA model to create a DEA assessment index.
Shetty et al. (
2012) applied the DEA model to determine the assumption of bankruptcy of the analyzed sample of businesses. The result of their study was the proposal of indicators that should be applied as predictors of bankruptcy (in
Horváthová and Mokrišová 2020). It is also possible to mention the research of
Ouenniche and Tone (
2017), who proposed an out-of-sample evaluation framework for DEA and confirmed that DEA as a classifier is a very suitable contender for discriminant analysis. In connection with the research of the application of DEA models, it is necessary to mention the authors
Mousavi et al. (
2015), who proposed an orientation-free super-efficiency DEA model as a multi-criteria assessment framework. They also addressed the issue of to what extent the selection and design of explanatory variables and their nature affect the outcome of modeling frameworks. They confirmed that the choice of explanatory variables affects the results of individual modeling frameworks and even improves them in the case of a mixture of account-based and market-based information.
Several authors have applied the DEA method in combination with PCA in their papers.
Mar Molinero and Ezzamel (
1991) were among the first authors to apply this method in the field of business failure prediction.
Mar-Molinero and Serrano-Cinca (
2001) extended that work and proposed a way to use MDS models as an alternative to discriminant analysis or a logit model to classify companies as failed or continuing.
As early as 1998, Zhu researched the performance of selected Chinese cities using the DEA and PCA methods. In his research he used the non-statistical DEA method, which is based on the use of the linear programming. The results were compared with the results of a multidimensional statistical method. He tested the results of both methods in order to determine their match using selected nonparametric statistical tests.
Premachandra (
2001) followed up on Zhu’s research. He pointed out the need to apply additional parameters to ensure the match of the results of the DEA and PCA model. These are parameters that
Zhu (
1998) did not use in his research. At the same time, he pointed out the fact that if there are few effective units in the analyzed sample, the concordance of the results of both methods is confirmed. However, if we have a sample with a large number of effective units, it is necessary to apply a modified approach when testing the match of the results of given methods.
In their study,
Serrano-Cinca and Mar Molinero (
2004) used the PCA method in selecting the DEA model. They pointed out that the choice of input parameters is very important, as the parameters are crucial to whether the DMU will be effective or not. The authors developed various specifications of the DEA model and analyzed their results using the PCA method. Using this method, it is possible to assess the equivalence, but also the difference of individual DEA models, and at the same time create a ranking of DMUs in terms of their effectiveness. The performance of Internet banking using the DEA and PCA methods was analyzed by
Ho and Wu (
2009). In 2018, the DEA method and the PCA method were used in the field of education by the authors
Jakaitiené et al. (
2018). The PCA and DEA methods were used by
Rahimpour et al. (
2020) to examine the indicators of employee loyalty and intellectual capital.
Another author who used the DEA method and the PCA method is
Nasser (
2019). He used these methods in the analysis of hospitals’ performance. He concluded that PCA plays an important role in reducing the number of input and output variables in performance analysis, helping to identify effective DMUs while improving the classification ability of DEA models.
Garcia-Lacalle and Martin (
2010) (in
Shen 2017) used DEA and MDS techniques in health-care research and compared the results of rural hospitals in Spain with the results of urban hospitals in terms of efficiency and perceived quality. According to these authors, the combination of DEA and MDS can help clarify the map drawn up using MDS observed points, making the relationship between each aspect much clearer. The MDS method in combination with the DEA method was applied by
Lozano and Gutiérrez (
2011) (in
Shen 2017) in order to analyze the effectiveness of the EU-25 countries in terms of tourism.
The DEA and MDS methods were used in the research by
Sagarra et al. (
2017) in the analysis of the effectiveness of selected universities. Other authors who used this method to analyze the effectiveness of universities were
Torre et al. (
2018).
Based on the above starting points, it can be stated that performance analysis with the application of the DEA method and multidimensional analysis techniques can be of a great importance in this area. Therefore, we focused our research on the use of the PCA method as well as the MDS method in relation to the DEA method. In our research, we evaluate the benefits of these methods in predicting the financial distress of companies.
4. Results and Discussion
4.1. The Results of Principal Component Analysis
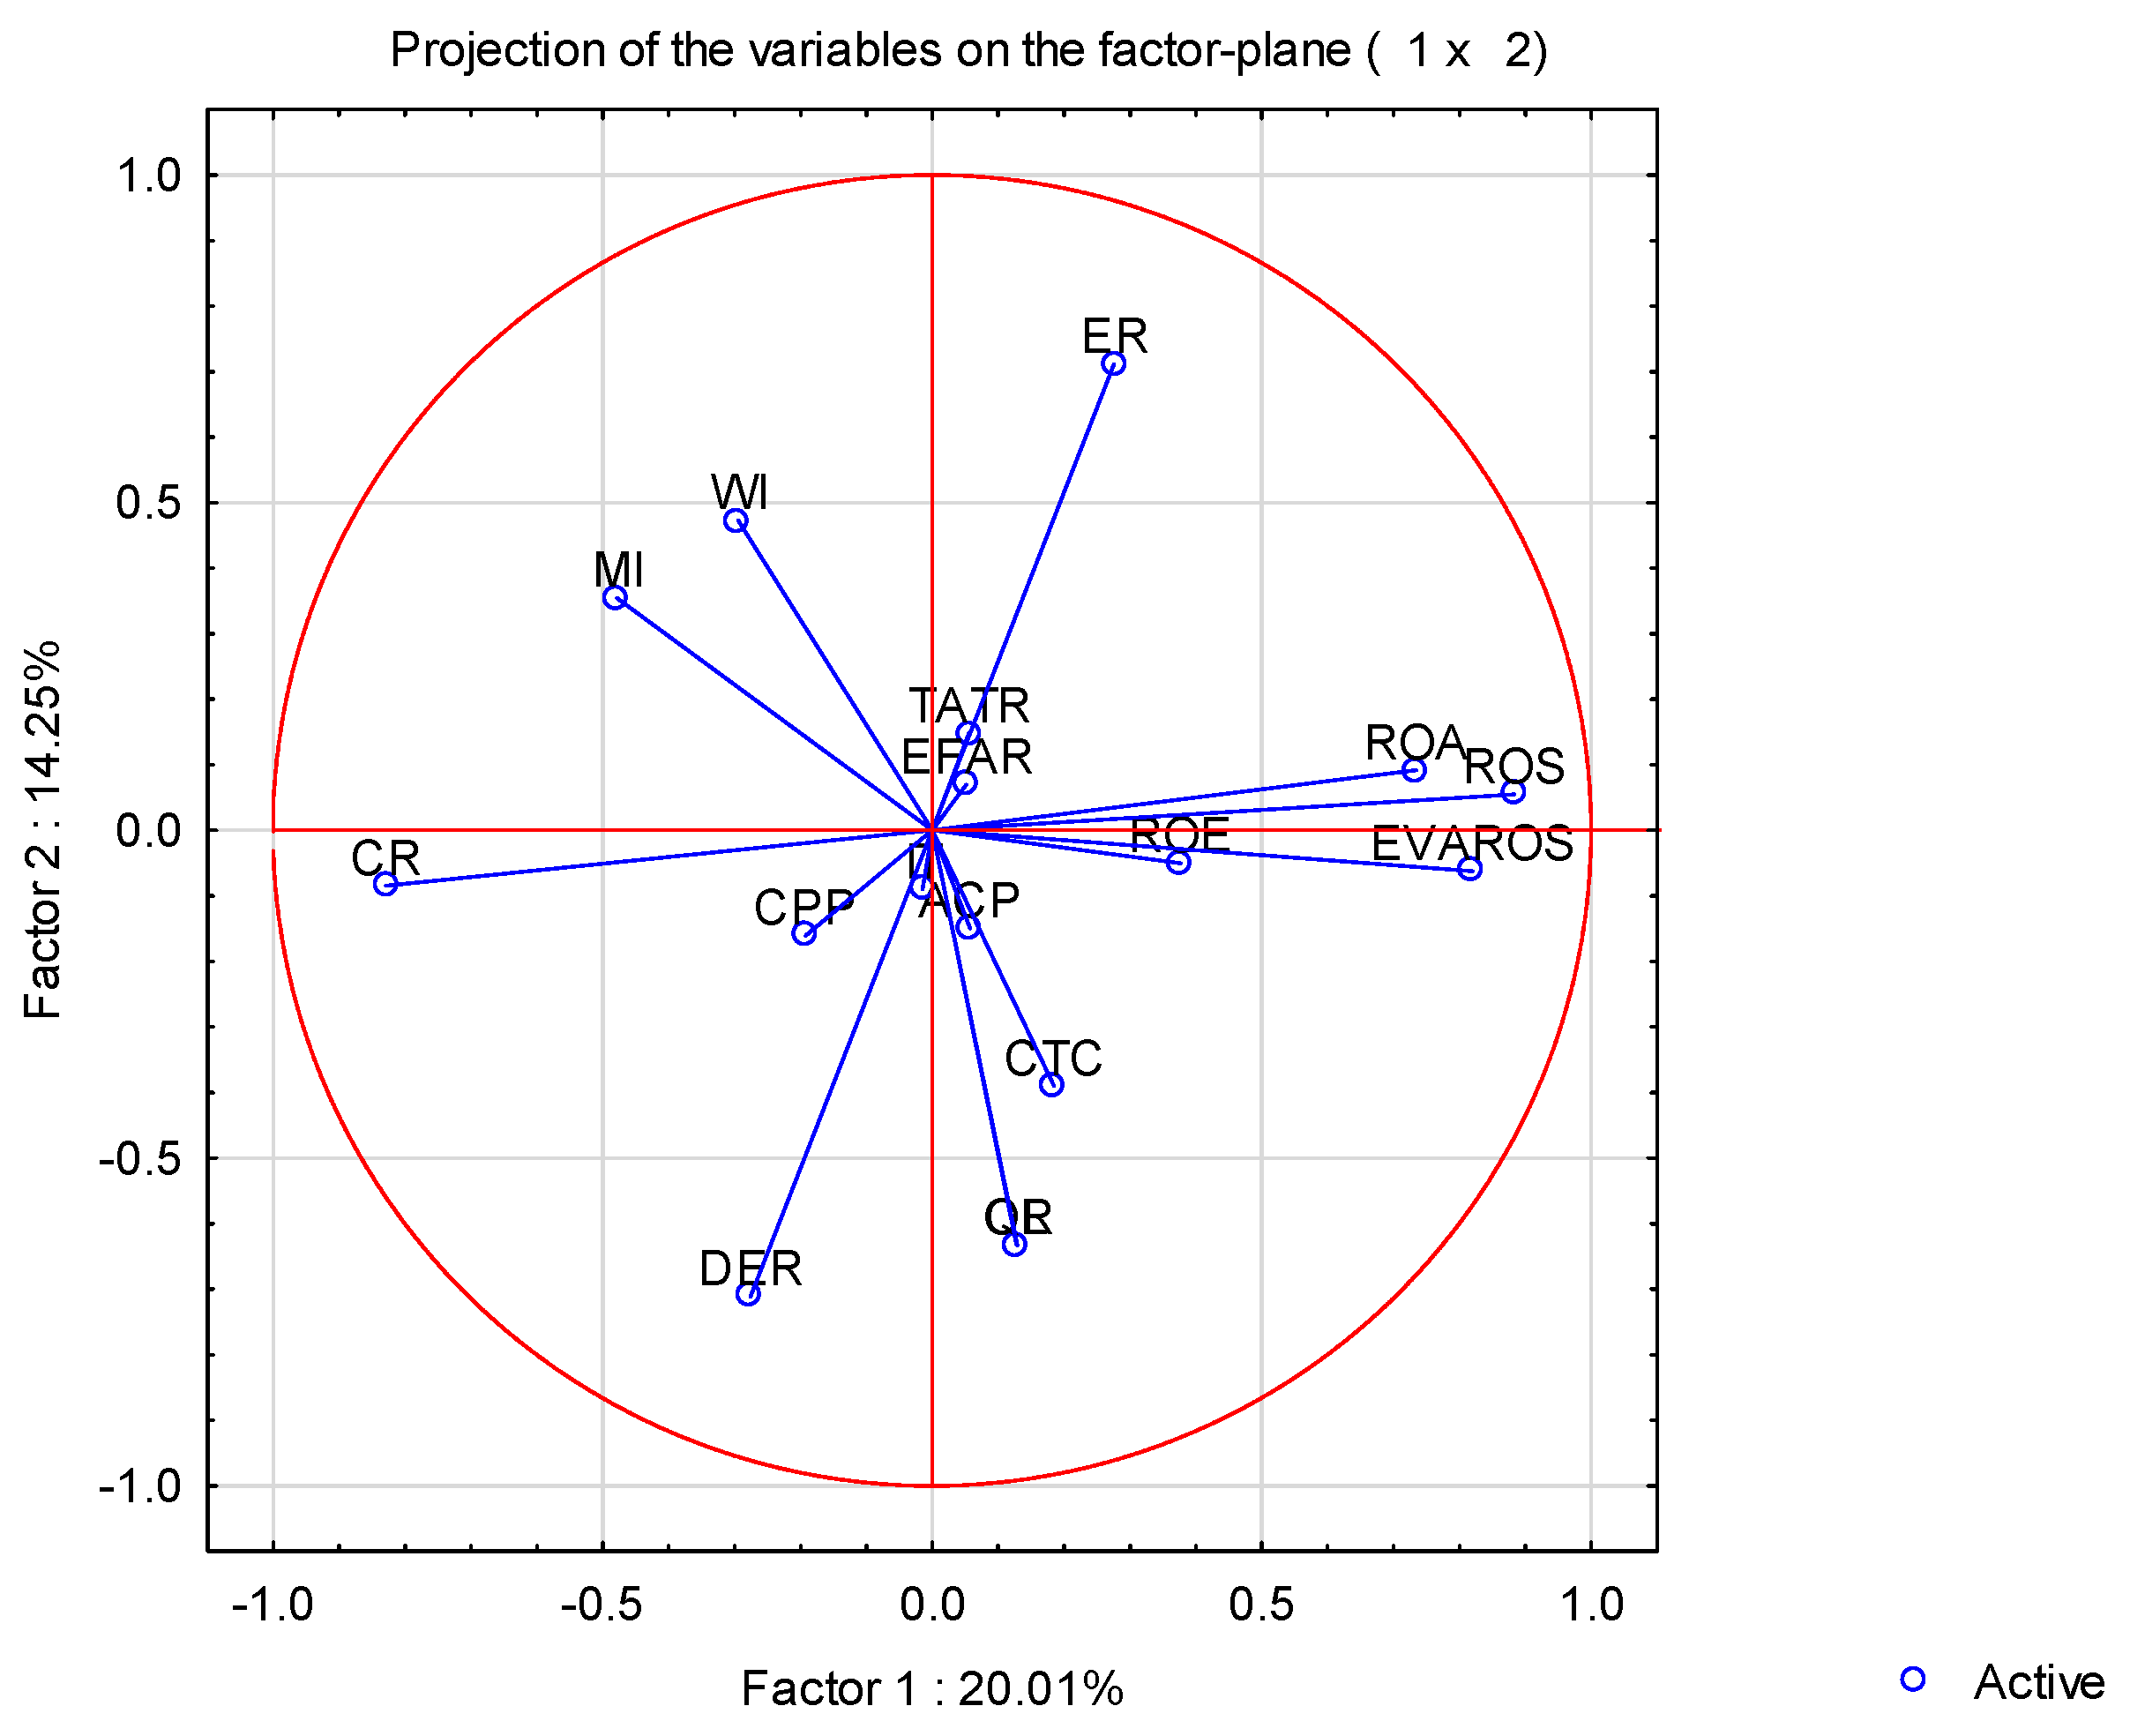
The projection of cases applied in a given research study allows the placement of individual DMUs in two-dimensional space or three-dimensional space, with each DMU and its position being determined by the values of all applied indicators simultaneously. The projection of cases processed by the PCA method indicates that the entire analyzed sample of companies creates a significant cluster in the space around the starting point of the coordinate system. This cluster is given by the coordinates (x: 5, −5; y: −5, 5). Outside this cluster are companies that achieve different results. The space for cluster analysis was defined by factors 1 and 2. Factor 1 captures information on a CPP indicator, and this indicator is inversely proportional to the first factor. Factor 1 has an equally strong and inversely proportional relationship with the indicator (CR). It shows a strong directly proportional relationship with the ROS and EVAROS indicators.
The second factor shows a strong directly proportional relationship with the indicators CL and QR. The third factor captures information on the capital structure of the company through indicators ER and DER.
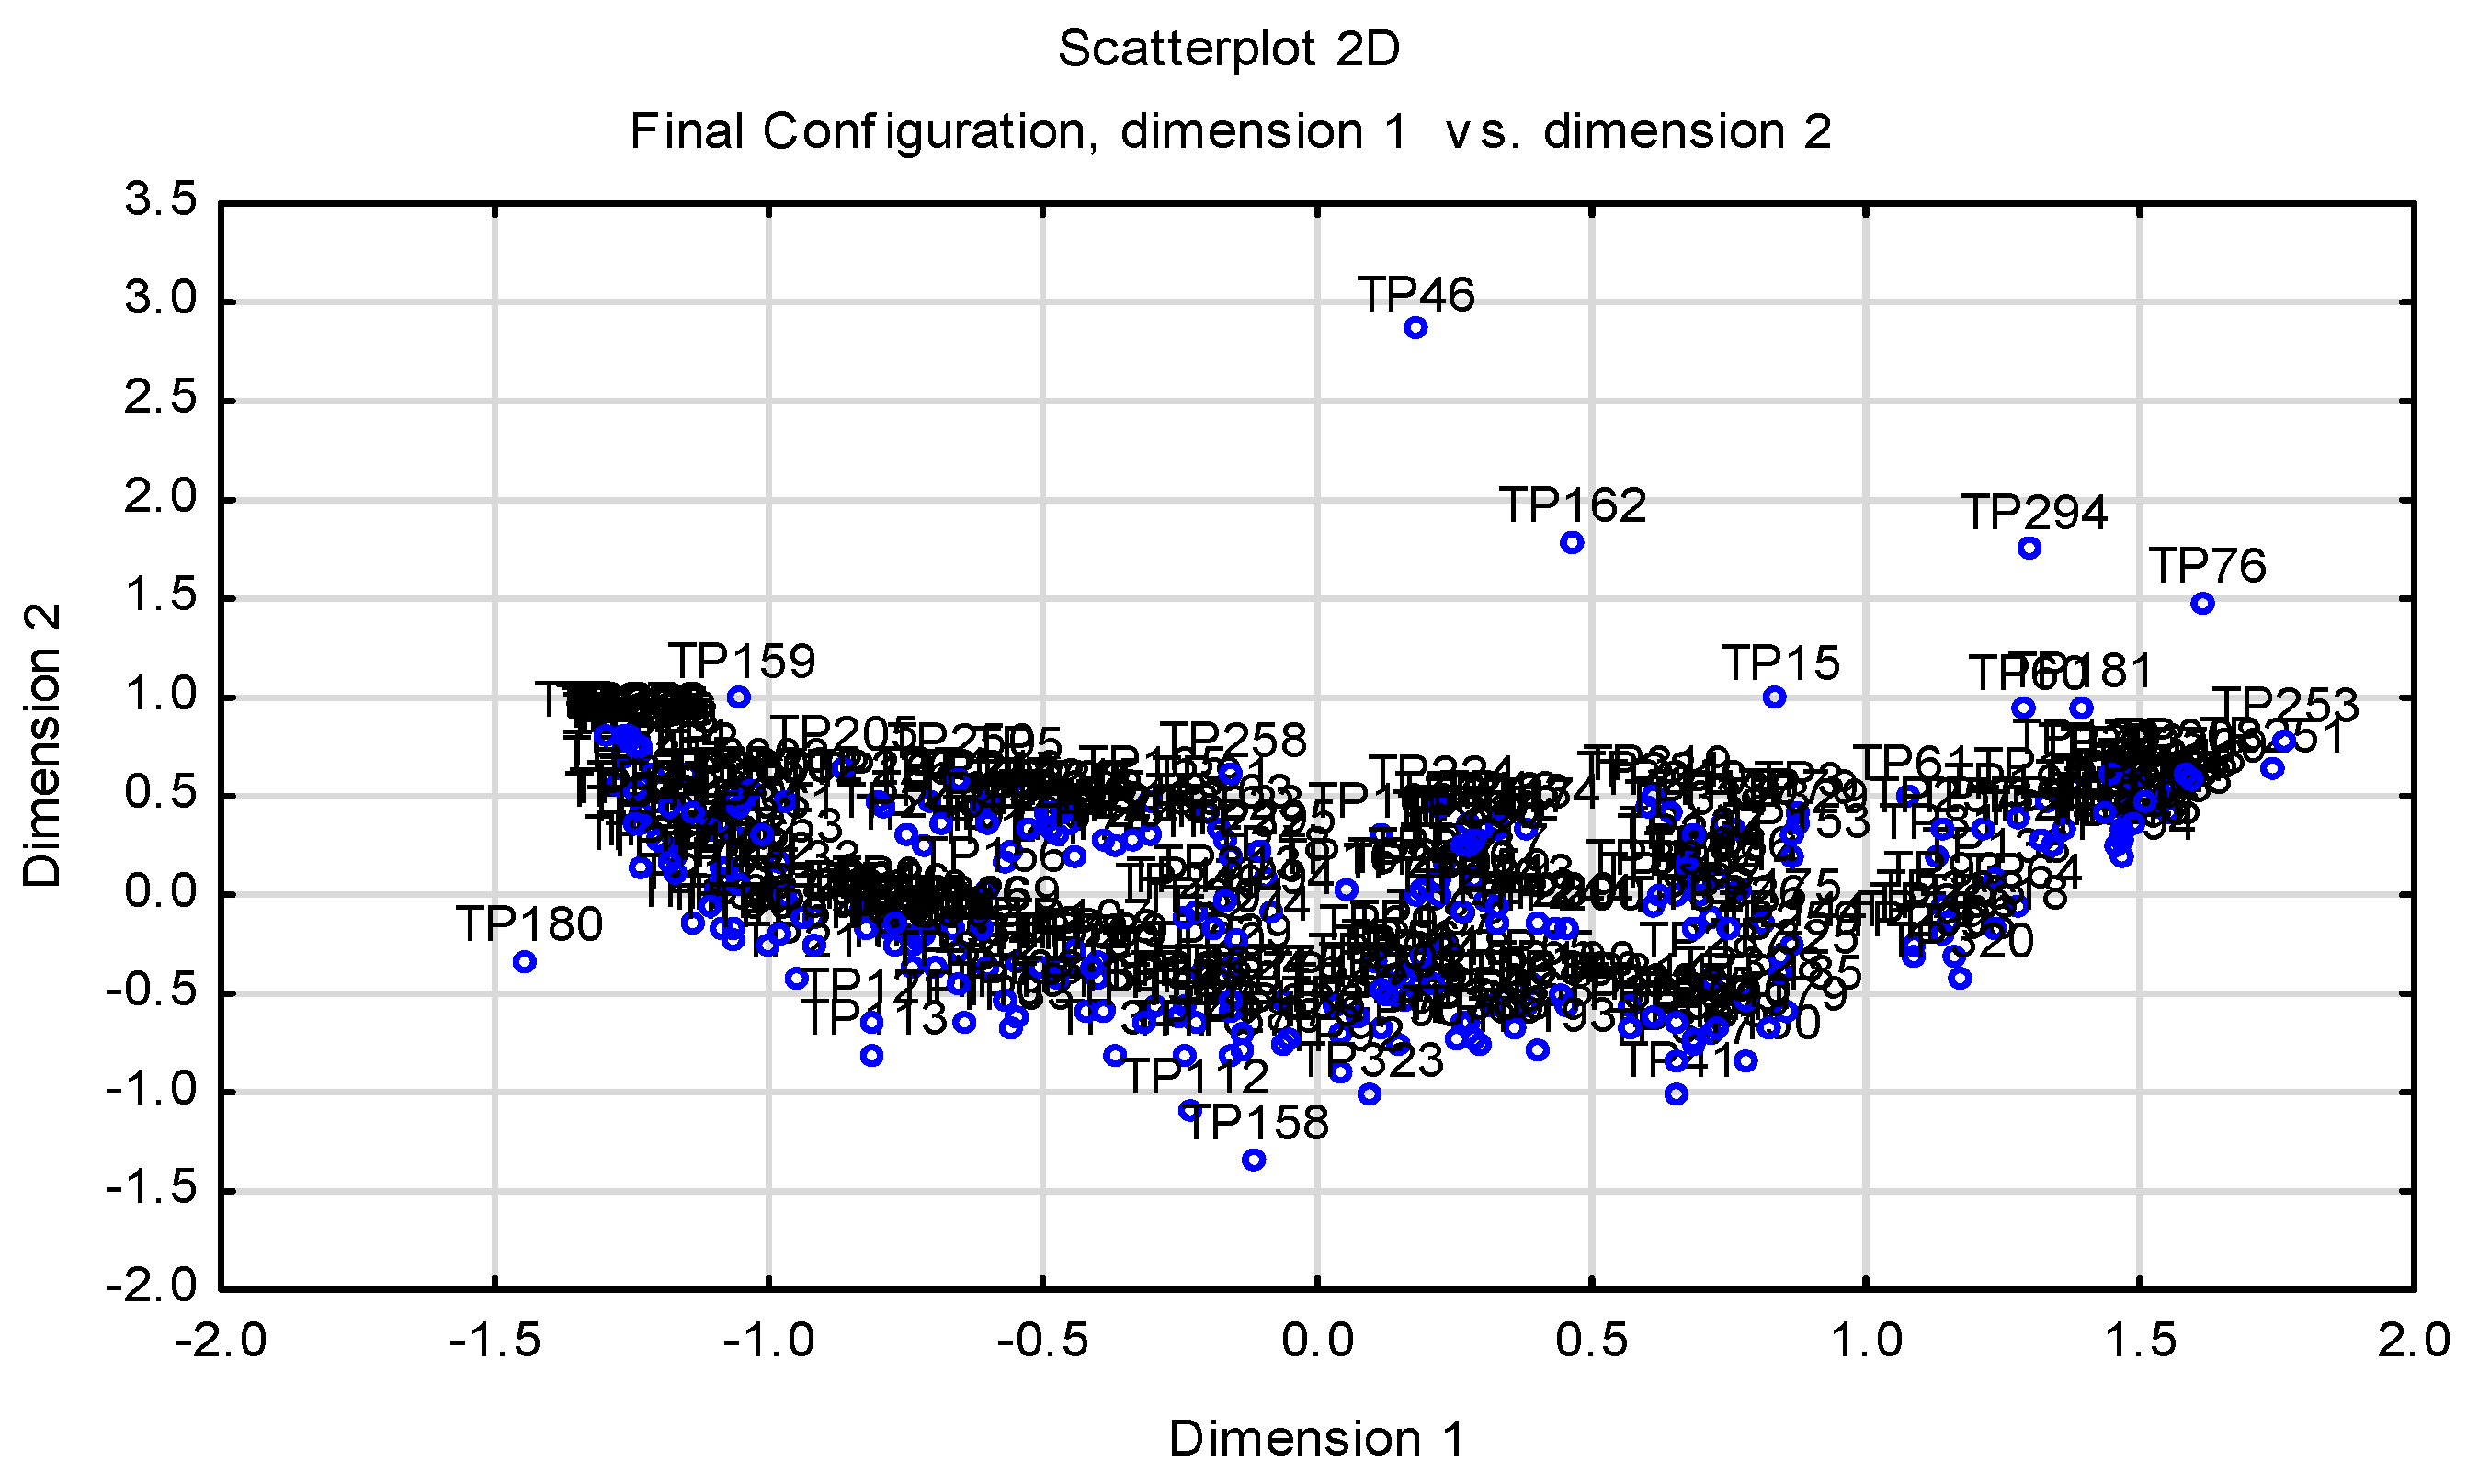
A more detailed analysis of the projection of cases (
Figure 2) shows that two significant sub-clusters of companies were formed within the main cluster. One was created in the space (x: 0, −5; y: 0, 5), and in this space there were companies that showed problems in terms of the CR and profitability. The second significant cluster was in the space (x: 0, 5; y: 0, 5), and in this space there were companies that achieved good results in terms of liquidity as well as profitability. Companies with extreme values that were outside the cluster were excluded from the following analyses. These were the companies TP122, TP176, TP142, TP284, and TP134.
Figure 3 shows the projection of the applied indicators. Using the above projection, it is possible to select indicators that are the basis of the following analyses. As the strong directly proportional relationship between the indicators CL and QR was confirmed in this analysis, only one indicator from these indicators should be selected for the following analyses. The quick ratio indicator was chosen, as this indicator carries financial risk. With regard to measuring the company’s profitability, the ROS indicator was chosen. The third indicator that emerged from this initial analysis was the CPP indicator. The fourth indicator we chose for bankruptcy analysis was the CR indicator.
The projection of cases after the exclusion of TP122, TP176, TP142, TP284, and TP134 is shown in
Figure 4. Again, a significant cluster of companies was formed, which was concentrated in the space (x: 3, −3; y: 3, −4). The space of occurrence of companies narrowed after the selected companies were excluded.
In the space (x: 0, −3; y: 0, 3) there were companies having a problem with profitability. In the space (x: 0, 3; y: 0, −4) there were companies that had a problem with liquidity. The best companies in terms of the analyzed indicators were in the space (x: 0, 5; y: 0, 3); the worst companies were in the space (x: 0, −3; y: 0, −4). After excluding companies with extreme values, the significance of the IT indicator in relation to the first factor was confirmed. In relation to the second factor, the significance of the ER and DER indicators was confirmed. However, companies reaching extreme values were again visible in the sample and were therefore excluded: TP 25, TP278, TP129, TP305, TP280, TP282, TP268, TP49, TP291, TP267, TP275, TP279, TP173, TP204, TP199, TP312, and TP85.
The final projection of cases after excluding the values of these companies is shown in
Figure 5.
The projection (
Figure 4) shows that it was necessary to exclude the companies TP22, TP40, TP82, TP169, TP296, TP196, TP277, TP260, TP267, TP252, TP195, TP255, TP271, TP276, TP172, TP 45, TP74, and TP256.
Based on
Figure 6 we can say that after the exclusion of above-mentioned companies, a significant directly proportional relationship between the first factor and ROA was confirmed.
The PCA method confirmed a small number of companies that were likely to fail in the analyzed sample. A large number of companies was located in an area grouping the companies that were not likely to fail but still reported certain problems in one of the analyzed financial areas. Using the results of this method, it was possible to select significant indicators that described the analyzed sample of companies. Individual factors thus provided sufficient information about the analyzed sample of companies.
Significant indicators that described the financial situation of the analyzed sample of companies in great detail were the following indicators: QR, ROS, and ROA—outputs. The indicators CPP, IT, and CR were confirmed as significant inputs. As outputs, we chose indicators that need to be increased to increase efficiency. Indicators that need to be reduced to increase efficiency were chosen as inputs. The benefit of the analysis (using the PCA method) is a set of financial indicators that can be applied in the analysis of the financial health of companies and in bankruptcy predictions.
This method made it possible to analyze the position of companies in terms of selected indicators as well as create the preconditions for improving the position of companies by improving selected financial indicators. This method should be applied as a benchmarking tool, as it provides a quick overview of the financial health of companies.
4.2. The Results of Multidimensional Scaling
The results of the analysis by the PCA method are also confirmed by
Figure 7, which was processed using the MDS method. The suitability of the model with selected indicators was confirmed by the value of stress, namely, 0.07, which means a sufficient overlap between the calculated and entered coordinates of objects. This represented a significant improvement over the case where all indicators and all companies were applied. In this case the value of stress was 0.22, which represented an insufficient overlap between the calculated and entered object coordinates.
Figure 6 shows the similarities of the analyzed companies.
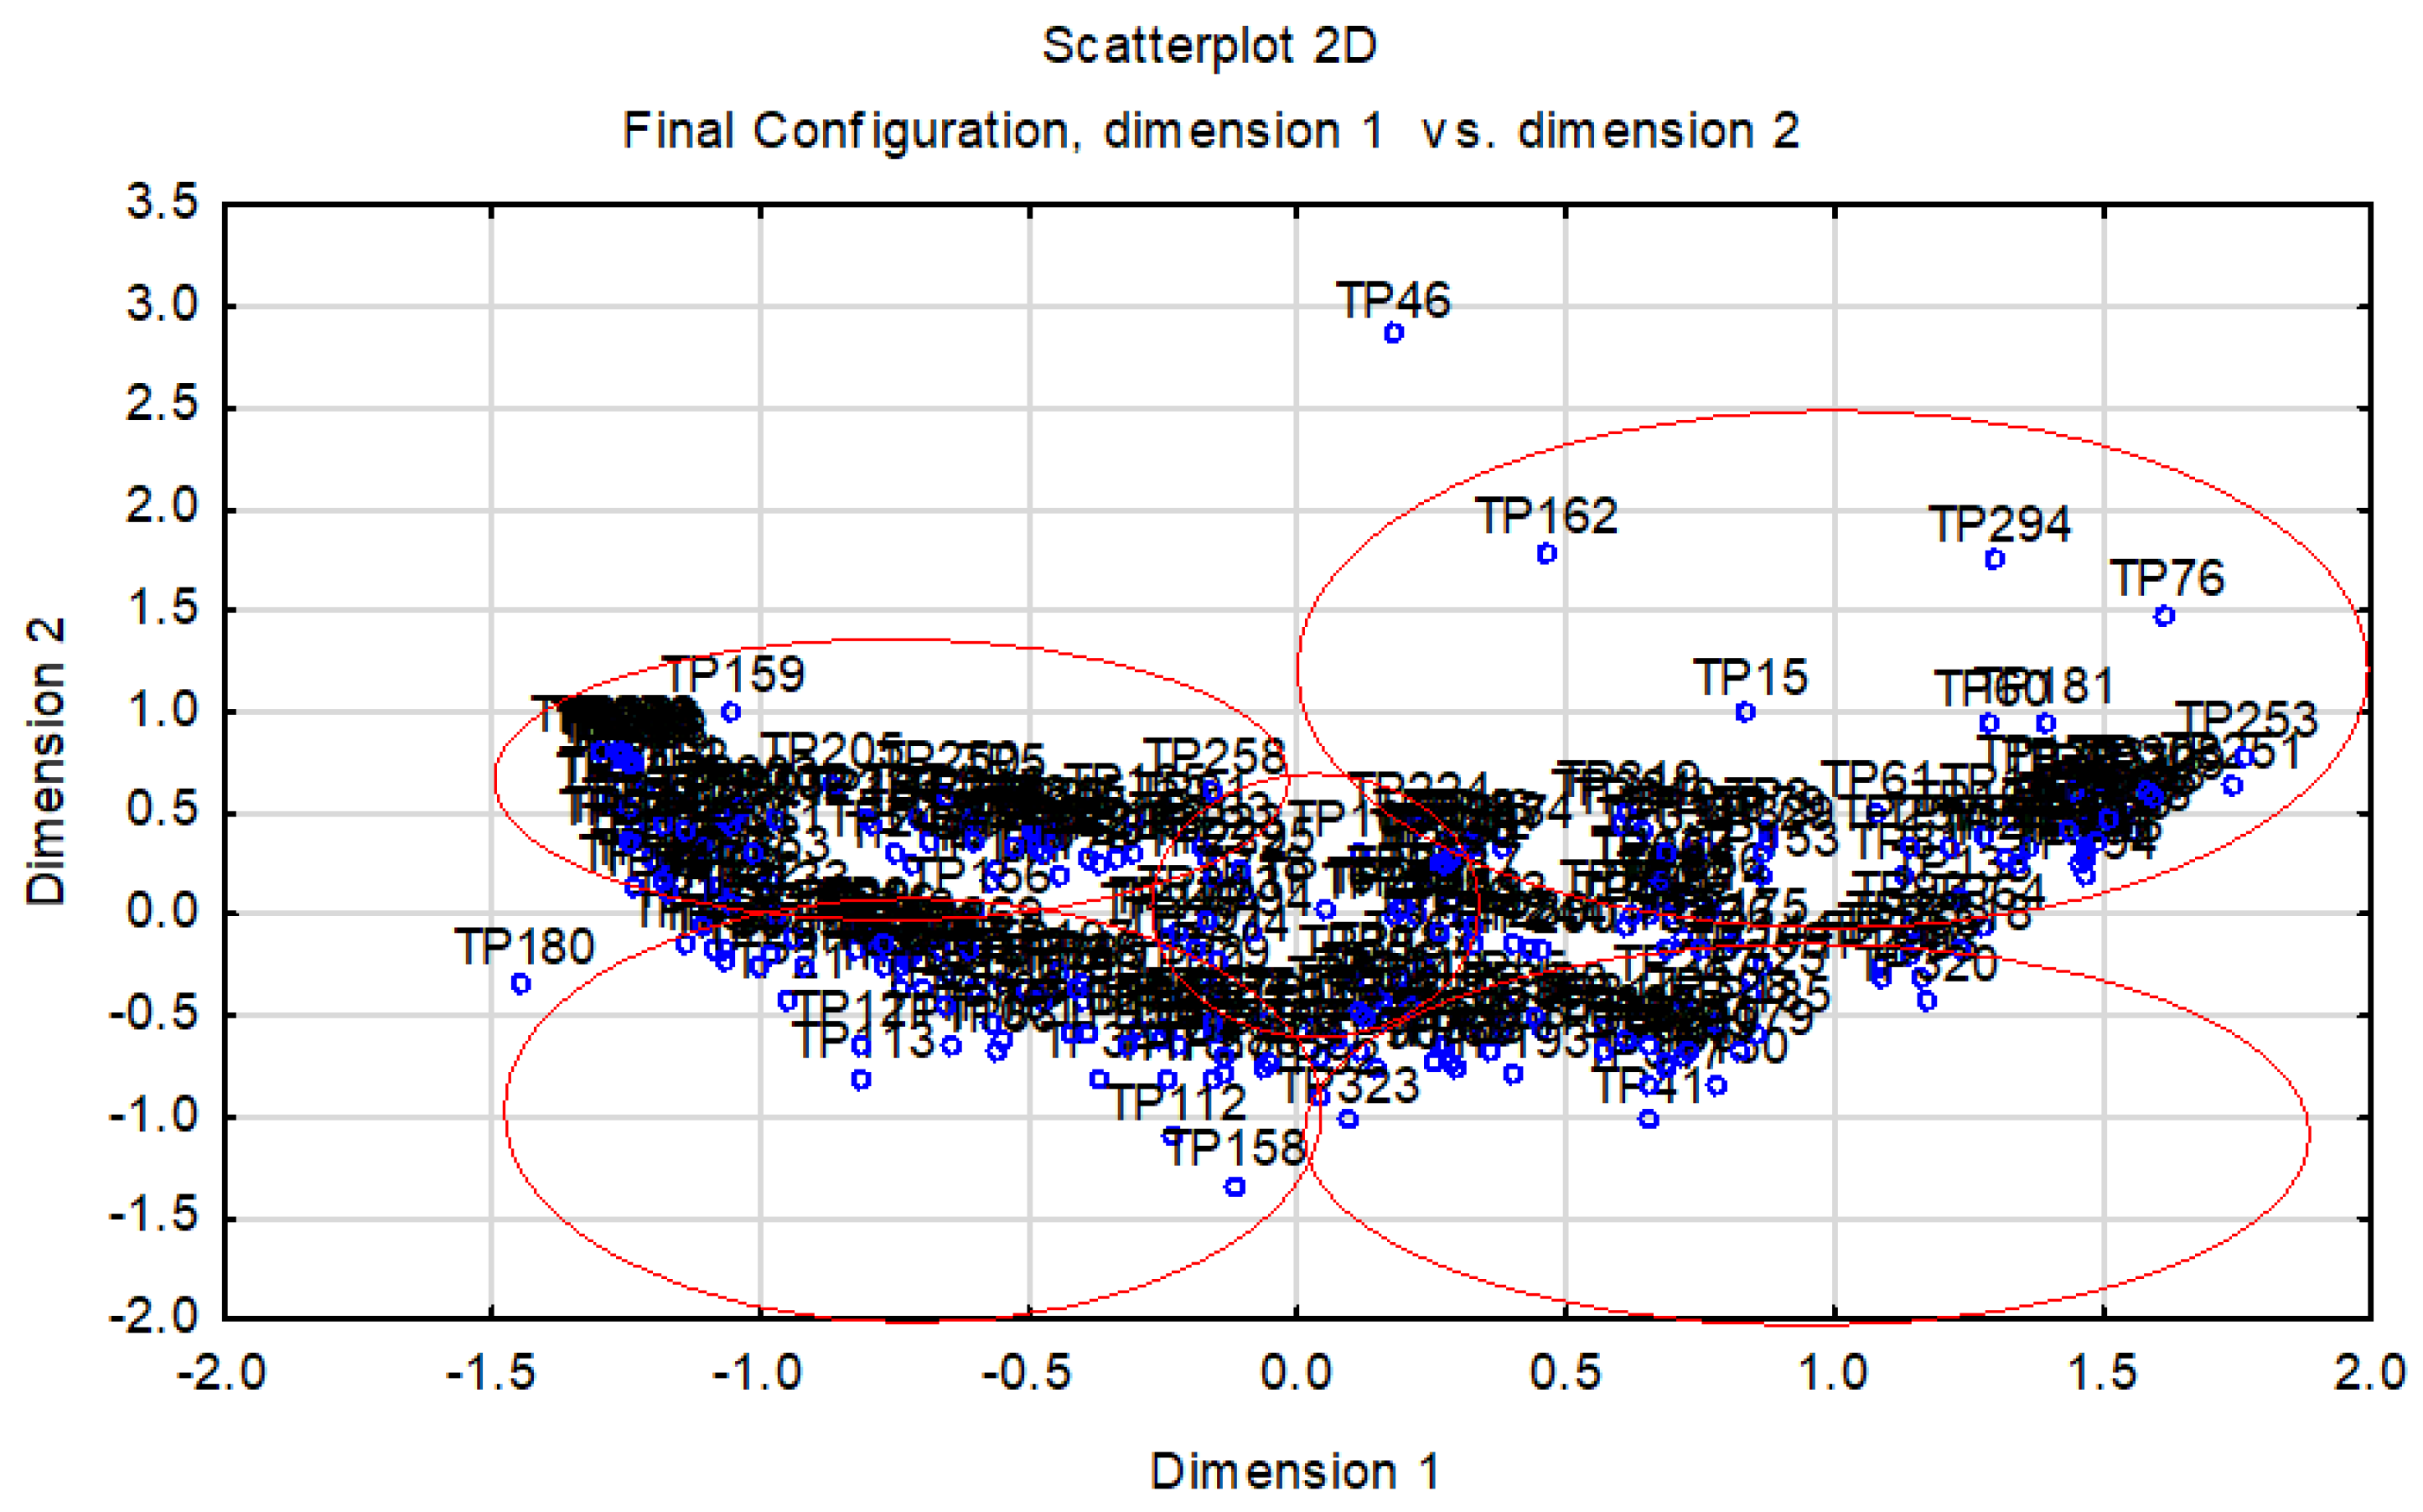
When we marked the clusters of similar companies, we could state that in the given figure there were five significant clusters of companies (
Figure 8). The best companies in terms of their financial health created a cluster in the space (x: 0, 2; y: 0, 2.5) and the worst companies created a cluster in the space (x: 0, −1.5; y: 0, −2). For these companies, it was possible to anticipate problems in the area of their financial health.
4.3. The Results of Data Envelopment Analysis
However, these statistical methods did not offer us a precise definition of companies that were expected to go bankrupt. For this purpose, it was appropriate to apply the non-statistical DEA method, which was described in the theoretical part of the paper. In our research, we applied the input-oriented BCC DEA model. We dealt with two versions of the model, namely the model of financial health and the model of bankruptcy.
Table 2 provides a summary of businesses that were expected to go bankrupt. It can be stated that the BCC DEA model confirmed eight companies. These companies reached a cost ratio of over 1 and a quick ratio of 0.16.
The advantage of the DEA model solution is the design of target values—benchmarks. If a company is able to reach them, it could become financially sound and competitive. The results of the BCC DEA model, which was aimed at revealing financially sound companies, yielded the results shown in
Table 3. From the analyzed sample, 13 companies were on the financial health frontier. As already mentioned, there were eight companies on the bankruptcy frontier. All other companies were in a production possibility set, which means that it would be necessary for them to optimize their inputs or outputs to become financially sound businesses.
The predictive and classification ability of the DEA model in the case of failing companies reached 73%, which can be considered a significant classification ability compared to other studies (
Premachandra et al. (
2009) achieved 84.89% accuracy in predicting failing companies,
Mendelová and Stachová (
2016) 10–42.86%, and
Cielen et al. (
2004) 74.4–75.7%).
Since companies not facing bankruptcy were located not only on the financial health frontier, but also in a production possibility set, we can state that the classification ability in the case of non-bankrupt companies was 98%.
4.4. Comparison of the Results with the Authors’ Previous Studies
The comparison of the results achieved in this paper with our previous studies is given in
Table 2.
Table 4 shows a comparison of the research carried out in this paper with the results obtained in the authors’ previous papers. The indicators, which were applied in all studies, were approximately the same, and the differences between them can be seen in
Table 2. The table also lists methods that were applied in the selection of indicators. An important part of the results presented in the table is the comparison of the classification ability of the models within the given studies. It can be stated that in the case of bankrupt businesses, the hypothesis was confirmed. These businesses achieved 98% classification ability in this research. The classification ability for bankrupt businesses was higher when selecting indicators based on the correlation matrix (
Štefko et al. 2020) compared to the PCA method applied in this paper.
The results of the DEA model can be compared with the results of the logit model, which we processed in our previous research.
Table 5 shows that the classification ability for bankrupt businesses was higher in the case of DEA model than the logit model.
5. Conclusions
The production, distribution, and supply of heat in Slovakia belong to the field of network regulation. Within this issue, it is possible to argue about whether to regulate heat prices or not. Price regulation helps to set low margins. Countries use them to protect risk groups in the population from existential problems. Low energy prices have a positive effect on inflation as well as on business development. However, on the other hand, heat management companies in many cases cannot adjust their variable and fixed costs to the level of regulated prices. They are not able to pay the costs; therefore, they go bankrupt. However, they could be beneficial for the state and its people, as they provide alternative options for heat production and heat supply. It should be pointed out that unregulated prices would instead motivate competition to enter the market and ensure price competition even without the necessary regulation. In addition, the regulator can set prices incorrectly and cause losses to many heat management companies. The regulator may also be subject to political pressure to not adapt heat prices to reality. As a result, many heat management companies do not continue to operate due to losses that have prevented them from operating in the business environment. Businesses themselves are not able to change these conditions. Therefore, in order to ensure the survival of these businesses and their competitiveness, it would be appropriate to revise certain regulatory measures. The effects of these measures are more or less reflected in all financial indicators of businesses.
In this paper, we focused on the identification of specific financial bankruptcy indicators of analyzed businesses. Knowledge of these indicators can help them to overcome their unfavorable position in the country’s economy, survive, and provide their product to the population.
Apart from the external influences on this area of business, it is necessary to pay attention to the financial health of businesses, which is a prerequisite for their existence. Determining the state of financial health of a company as well as its competitive position in the industry is nowadays a significant challenge for all companies. In order to determine the real financial condition of the company, it is necessary to apply adequate methods and tools. In our research, statistical and graphical tools, as well as a non-statistical DEA model, were applied. These offered some important information on how to increase the company’s performance and ensure its financial health.
We used the PCA method to select inputs and outputs to the DEA model that best described the financial health of the research sample. We also used this method to exclude companies, which caused a loss in the value of the research sample. The selected indicators were used as inputs and outputs to the DEA model. The result of the DEA model was the identification of businesses threatened with bankruptcy. In the graphical representation using the PCA and MDS methods, these companies appeared in the same cluster. MDS is an important graphical and benchmarking tool that helps managers understand where their company is in terms of financial health and with which companies it forms a cluster. These companies have similar values of indicators. They also can learn from other businesses how to become better. These are three methods that use their outputs to help each other to identify businesses threatened with bankruptcy, but also offer companies target values to improve their position in space.
The chosen research methods have both positives and negatives. DEA is an important benchmarking tool for improving financial indicators by learning from those in a better position. DEA models can be input or output oriented, and on this basis the target values of inputs or outputs can be calculated. Using the DEA method, it is possible to identify companies that are threatened with bankruptcy and are on the bankruptcy frontier as well as companies that are on the financial health frontier. Using the DEA method, it is possible to assign to each inefficient unit a peer unit or reference unit, which would serve as a pattern for this unit in determining its target values. It is also possible to find out which units are inefficient—we can measure this inefficiency and determine the probability of bankruptcy. A pattern for an inefficient unit is a unit with a similar combination of inputs and outputs. Using suitable software, it is possible to solve a large amount of data. DEA models eliminate subjectivity. A significant benefit of the DEA method is that the solution of DEA models is not based on prior probabilities of bankruptcy. DEA models accept financial and non-financial indicators, as well as environmental and social factors. The reliability of DEA models can be compared with the reliability of logit and probit models. In this regard, a high degree of comparability can be achieved while maintaining a uniform degree of indicators.
The disadvantages of the DEA model include the following: The DEA model is sensitive to extreme values; the financial distress frontier and financial health frontier are constructed of extreme values. As it is not possible for all healthy companies to form the financial health frontier, they can be found in a production possibility set together with companies in financial distress. The results of the DEA model need to be verified with the application of another method for the above reason, with logistic regression appearing to be the most appropriate.
The disadvantages of the DEA model can be eliminated by applying a multi-level DEA model, with the gradual exclusion of companies that are on the financial distress frontier. The advantage is the construction of the prediction coefficient from the two DEA models described above, namely, the model for determining financial health and the model for determining financial failure.
The applied graphical methods, MDS and PCA, facilitate and speed up the processing of large amounts of data, enable the reduction of the number of data dimensions, and thus create a precondition for the application of other important analytical procedures. Thanks to graphic display, the results can be interpreted in a simpler and clearer way. The selected group of variables can be replaced by two or three factors that capture information on the financial situation of a given sample of companies in great detail. These are factors that accumulate information about the company’s profitability, liquidity, and capital structure, and belong to the symptoms of business bankruptcy. Managing them, it is possible to improve the financial position of companies in order to avoid bankruptcy. The MDS method makes it possible to identify clusters of companies that are not distant from each other and have similar characteristics. Based on the above, it is possible to identify a group of companies that is expected to go bankrupt.
In order to improve the interpretation of the results of these methods, it is very appropriate to supplement their results with the results of the DEA model.
The contribution of this study to the literature is the selection of inputs and outputs to the DEA model by the PCA method. We were also able to confirm the significance of ROA by gradually excluding companies with extreme values. At the same time, this study represents a connection between the graphical representation of companies in the financial health portfolio and the exact calculation of businesses’ financial health. We found out that applied methods yield similar results. PCA and MDS can graphically capture the position of bankrupt businesses in space. There was a match between the results of these methods.
In conclusion, it is possible to point out the fact that the given research was significantly limited by the applied sample of data. Heat management companies show significant extreme values and deviations. The database was incomplete and contained a large number of outliers. In future research, we will focus on obtaining a database that is more comprehensive and for a longer period.
The research in this paper is linked to specific aspects of the journal’s and Special Issue’s scope. We applied special and modern methods in the field of bankruptcy prediction of small and medium-sized businesses. We also analyzed a specific regulated industry. In this industry, it is very difficult to find tools to stay in the market. As a result, many small businesses go bankrupt and only large ones survive, gaining an increasing monopoly position. We confirmed important indicators that are predictors of the bankruptcy of heat management companies operating in a regulated environment.


