A New Improved Voltage Stability Assessment Index-centered Integrated Planning Approach for Multiple Asset Placement in Mesh Distribution Systems

Abstract
:
1. Introduction
- (i)
- Improved mathematical expressions of VSAI_B based on an equivalent MDS circuit.
- (ii)
- Loss minimization condition (LMC) for an equivalent electrical MDS circuit.
- (iii)
- Integrated planning approach based on VSAI_B and LMC, for equivalent electrical MDS circuits.
- (iv)
- Simultaneous assets placement with a single run of the respective computation procedure.
- (v)
- Evaluation of the offered approach on a 33-bus test distribution system (TDS).
- (vi)
- Performance evaluation with multiple DGs (siting and sizing) under various PF.
- (vii)
- Performance evaluation of techno-economic objectives with multiple DGs only at various PF.
- (viii)
- Performance evaluation with multiple DGs and D-STATCOMs (DSt).
- (ix)
- Performance evaluation of techno-economic objectives with multiple DGs and DSt.
- (x)
- Performance evaluation of the proposed approach on a 69-bus TDS for benchmarking analysis.
- (xi)
- Validation of the proposed approach via comparison with results reported in the available literature.
2. Improved Voltage Stability Assessment Index (VSAI_B) for Mesh Distribution System
3. Loss Minimization Condition (LMC) in Mesh Distribution System
4. Proposed Improved Integrated Planning Approach
4.1. Computation Procedure
- Step 1:
- Read system data for the multiple loops configured TDS configured to MDS.
- Step 2:
- Run the load (power) flow for test MDS without DG or any asset, at normal load level.
- Step 3:
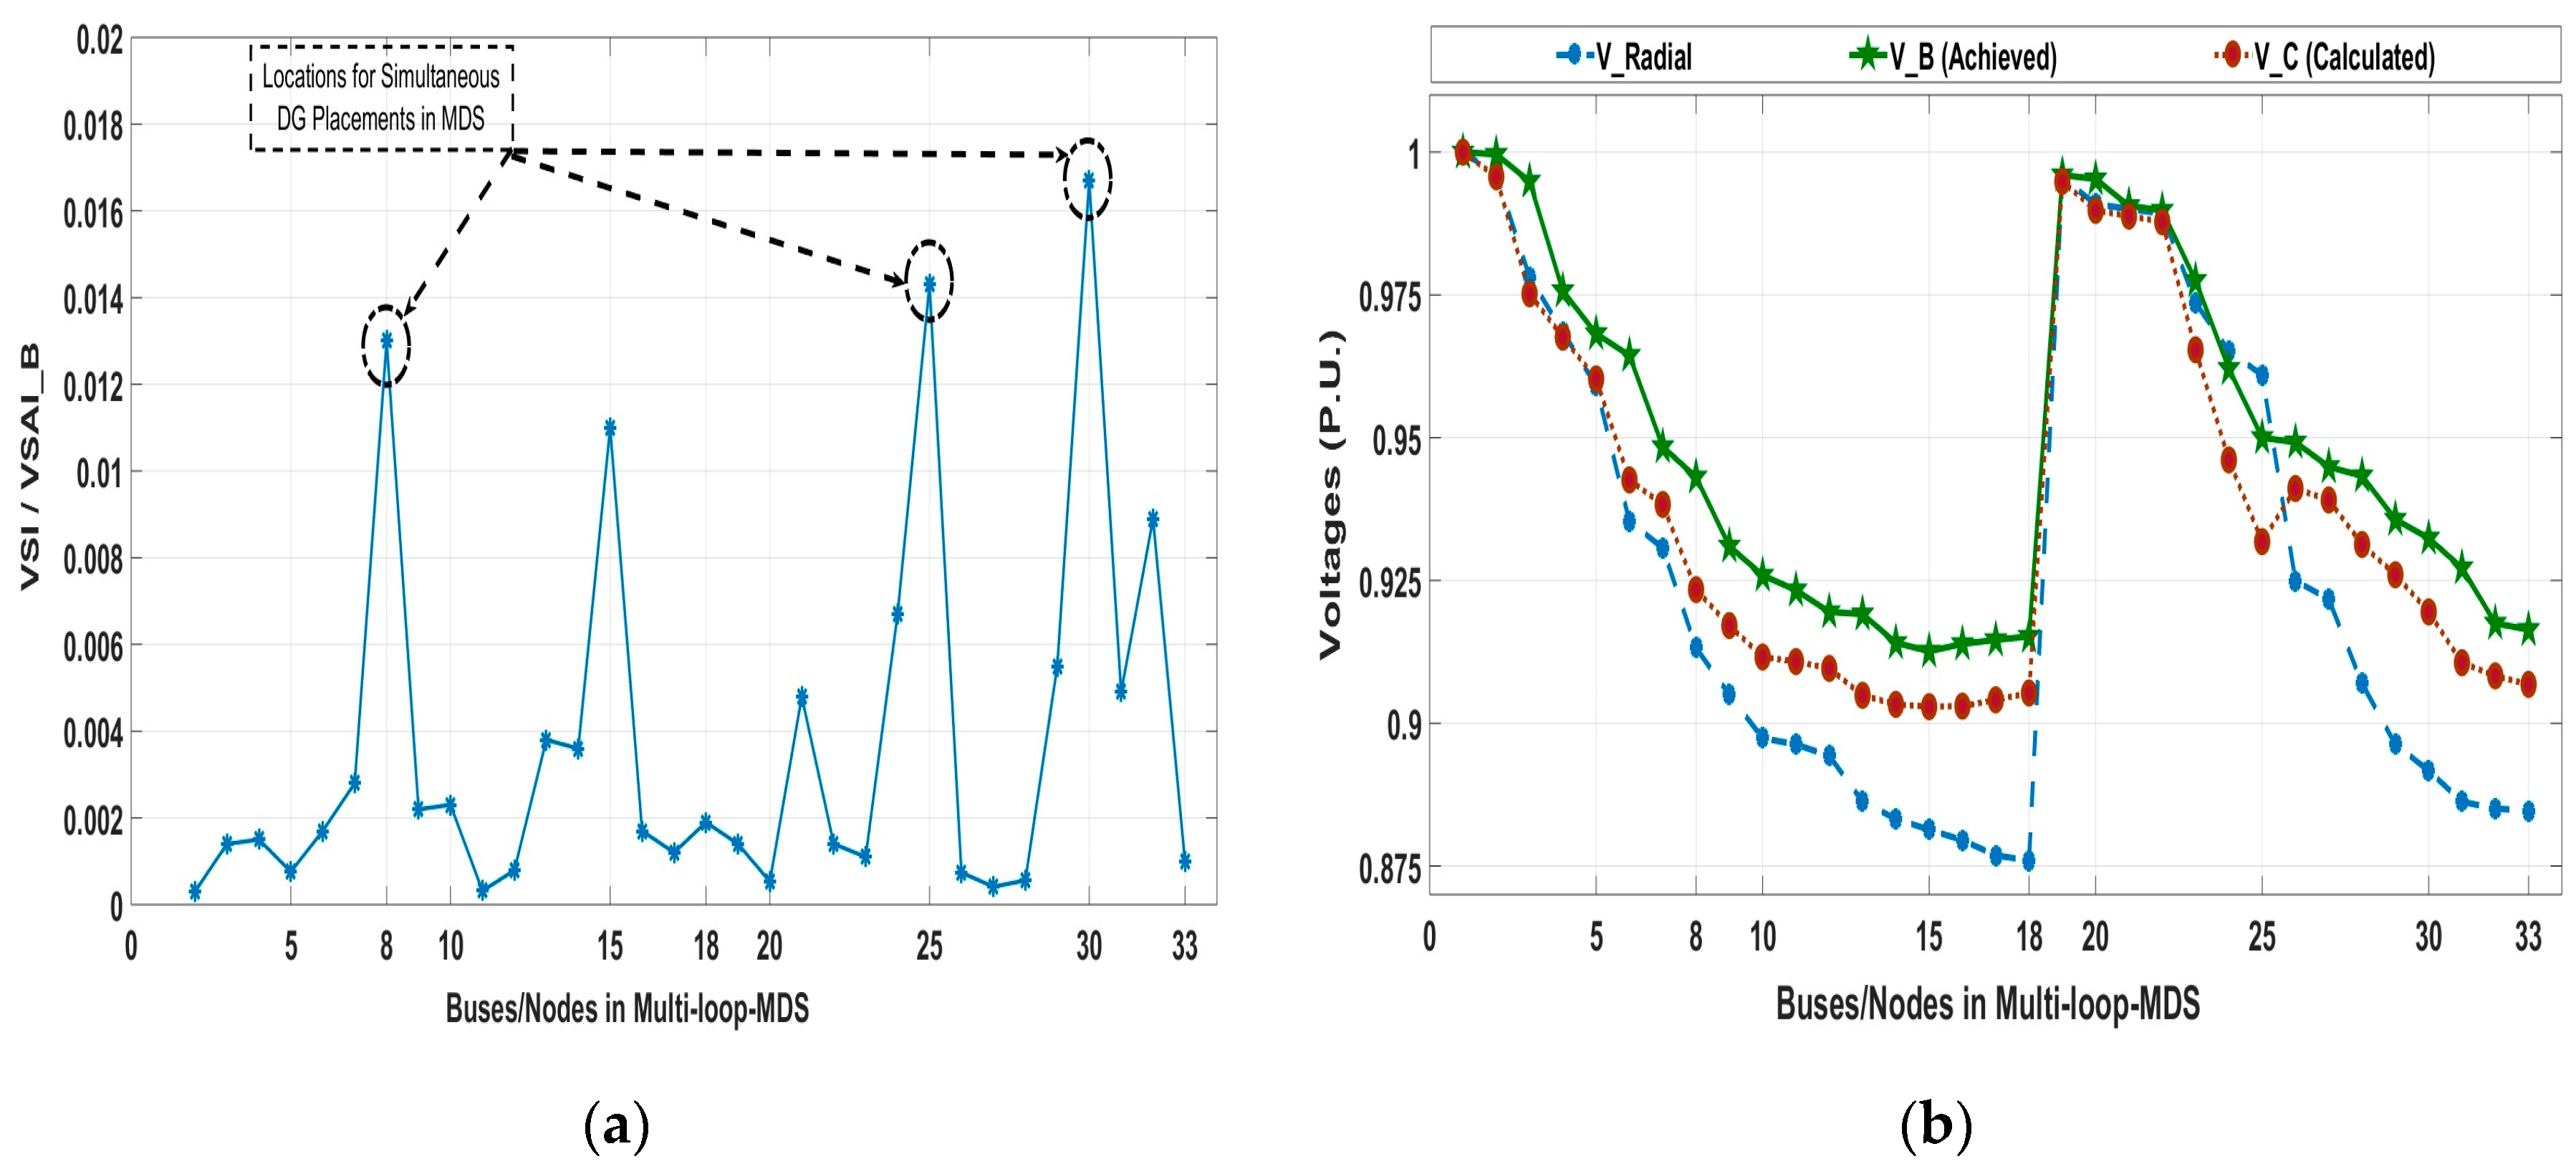
- According to Equation (18); calculate the corresponding VSAI_B at each RB. Moreover, the respective voltage profile as a feasible solution V_B is achieved according to Equation (19).
- Step 4:
- Select the three buses with the highest numerical values of proposed VSAI_B, as prospective candidates for the simultaneous placement of assets such as DGs operating at various PFs.
- Step 5:
- Run load flows for the test MDS after placement of three DGs. Increase the size of each DG at the respective PF with a variation of ± 3% at a relevant bus to a voltage limit that is close to or equal to the 1.0 ± 0.5% per unit (P.U), considering voltage level at substation (SS) as reference.
- Step 6:
- Find out voltage difference across each TB among the three tied feeders. The sizing of DG at a feeder with the highest voltage value is reduced to minimize the tie currents among other tied feeders and vice versa. For example, (refer to Figure 1 and Figure 2) if U2b > U4b and U2b > U6b, then U2b is decreased by decreasing the DG (or DG+D-STATCOM) capacity integrated at a respective bus of feeder 1 to achieve LMC. Similarly, if U4b > U2b and U6b > U2b, then U4b and U6b are decreased by decreasing the DG (or DG+D-STATCOM) capacity integrated at respective buses at feeders 2 and 3; in order to achieve LMC and so on.
- Step 7:
- Repeat the process until the respective VSAI_B trend, results in a voltage profile (V_B) with the least voltage difference across TB1 (U2b to U4b) and TB2 (U4b and U6b), LMC condition along with PLMC’ or QLMC’ or any of them is achieved. When the aforesaid conditions are achieved with the respective DG or other asset sizes, the solution is feasible from the viewpoint of three DGs (or assets) in MDS. The calculated voltage V_C in equivalent Matlab/Simulink model is also provided for comparison and to establish the credibility of the achieved feasible solution V_B via the proposed VSAI_B-LMC approach.
- Step 8:
- Evaluate the concerned technical and cost (economics)-related performance indices on the basis of Steps 1–7, as mentioned in Section 4.4 later in this paper. A simple numerical example for illustration of the computation procedure is shown in Appendix A.
4.2. Assumptions for the Proposed Planning Approach
- The overall protection at the substation (SS) is considered as upgraded.
- Test MDS is 3-phase balanced and can be designated with an equivalent single-line diagram.
- The thermal limits in all branches have considered at a numerical value of 5 MVA ± 5%.
- The maximum number of DGs for integration, is three.
- The maximum number of assets for integration on a single node/bus a set of two assets (DG + DSt).
- DG unit can be integrated on any load bus except a slack bus from the SS.
- It is anticipated that for LMC achievement with planning approaches, if the receiving end buses (RBs at nodes m2b, m4b and m6b) across TBs have ideally zero voltage difference i.e., U(m2b) = U(m4b) = U(m6b) such that no loop current (ITL) flows through, i.e., in this case both ILp1 and ILp2 are zero. The numerical value of ΔU is considered as 1.0% such as convergence criteria in within 0.01.
- Normal loading conditions in TDS have considered in the proposed study, i.e., load model is constant power and single load level.
- The variation in voltage values has considered around ±1.0%.
- The variation in PF (lagging) has considered around of ±3.0% in this study.
- It is assumed that shunt-capacitor banks are loads and line-shunt capacitance is negligible.
4.3. Constraints
4.3.1. Active and Reactive Power Balance
4.3.2. Voltage Constraint
4.3.3. Operating Power Factor (PF) of DG Unit
4.3.4. Active and Reactive Power Limit of DG
4.4. Indices for Performance Evaluation
4.4.1. Performance Indices for Technical Evaluation (TPI or TP)
4.4.2. Performance Indices for Cost-Economic Evaluation
4.4.3. Types of DG in Performance Evaluation
4.5. Simulation Setups for Mesh Distribution System
4.5.1. 33-Bus Mesh configured Test Distribution System
4.5.2. 69-Bus Mesh Configured Test Distribution System
5. Performance Evaluations, Results and Discussions.
- ➢
- Case 0: Base case analysis considering no DG scenarios on the 33-bus and 69-bus MDS.
- ➢
- Case 1: Detailed analysis of DG scenarios at unity PF on the 33-bus MDS.
- ➢
- Case 2: Detailed analysis of DG scenarios at 0.9 ± 3% PF on the 33-bus MDS.
- ➢
- Case 3: Detailed analysis of DG scenarios at 0.85 ± 3% PF on the 33-bus MDS.
- ➢
- Case 4: Detailed analysis of assets (DG + D-STATCOM) placements scenarios in the 33-bus MDS.
- ➢
- Case 5: Detailed analysis of assets (DG + D-STATCOM) placements scenarios in the 33-bus MDS.
- ➢
- Case 6: Benchmark analysis of multiple DG placements (only) scenarios in the 69-bus MDS.
5.1. Base Case Analysis Considering No DG Scenarios on 33- and 69- Bus Systems (Case 0)
- ➢
- Case 0/Scenario 1 (C0/S1). Base case for potential DG/asset location in 33-bus TDS.
- ➢
- Case 0/Scenario 2 (C0/S2). Base case for potential DG/asset location in 69-bus TDS.
5.2. Detailed Analysis of DG Scenarios at Unity, 0.9 and 0.85 PF on 33-Bus System (Cases 1–3)
5.2.1. Evaluation of Case 1: DG Placements at unity PF (Type-1)
- ➢
- Case 1/Scenario 1 (C1/S1). 1 × DG (at unity PF) placement in the 33-bus MDS.
- ➢
- Case 1/Scenario 2 (C1/S2). 2 × DGs (at unity PF) placement in the 33-bus MDS.
- ➢
- Case 1/Scenario 3 (C1/S3). 3 × DGs (at unity PF) placement in the 33-bus MDS.
- ●
- C1/S1: ΔU across TB1 (TS4: node 25–29): V_B at 25: 0.9909; V_B at 29: 0.9983; |ΔU_B| = 0.0074.
- ●
- C1/S1: ΔU across TB2 (TS5: node 18–33): V_B at 18: 0.9878; V_B at 33: 0.9877; |ΔU_B| = 0.0001.
- ●
- C1/S1: ΔU across TB1 (TS4: node 25–29): V_C at 25: 0.9927; V_C at 29: 0.9947; |ΔU_C| = 0.0020.
- ●
- C1/S1: ΔU across TB2 (TS5: node 18–33): V_C at 18: 0.9862; V_C at 33: 0.9882; |ΔU_C| = 0.0020.
- ➢
- C1/S2: ΔU across TB1 (TS4: node 25–29): V_B at 25: 1.0000; V_B at 29: 0.9983; |ΔU_B| = 0.0017.
- ➢
- C1/S2: ΔU across TB2 (TS5: node 18–33): V_B at 18: 0.9880; V_B at 33: 0.9887; |ΔU_B| = 0.0007.
- ➢
- C1/S2: ΔU across TB1 (TS4: node 25–29): V_C at 25: 0.9989; V_C at 29: 0.9977; |ΔU_C| = 0.0012.
- ➢
- C1/S2: ΔU across TB2 (TS5: node 18–33): V_C at 18: 0.9865; V_C at 33: 0.9884; |ΔU_C| = 0.0019.
- ❖
- C1/S3: ΔU across TB1 (TS4: node 25–29): V_B at 25: 0.9962; V_B at 29: 0.9954; |ΔU_B| = 0.0008.
- ❖
- C1/S3: ΔU across TB2 (TS5: node 18–33): V_B at 18: 0.9877; V_B at 33: 0.9887; |ΔU_B| = 0.0010.
- ❖
- C1/S3: ΔU across TB1 (TS4: node 25–29): V_C at 25: 0.9955; V_C at 29: 0.9951; |ΔU_C| = 0.0004.
- ❖
- C1/S3: ΔU across TB2 (TS5: node 18–33): V_C at 18: 0.9869; V_C at 33: 0.9880; |ΔU_C| = 0.0011.
5.2.2. Evaluation of Case 2: DG Placements at 0.90 ± 3% PF lagging (Type-2)
- ➢
- Case 2/Scenario 1 (C2/S1): 1 × DG (at 0.90 ± 3% lagging PF) placement in the 33-bus MDS.
- ➢
- Case 2/Scenario 2 (C2/S2): 2 × DGs (at 0.90 ± 3% lagging PF) placement in the 33-bus MDS.
- ➢
- Case 2/Scenario 3 (C2/S3): 3 × DGs (at 0.90 ± 3% lagging PF) placement in the 33-bus MDS.
- ❖
- VSAI_B and V_B values of DG in C2/S1 in (P.U):
○ VSAI_B for DG1@bus 30: −0.0565@30 ○ V_B for DG1@bus 30: 1.0000@30 ○ Minimum voltage (V_min): 0.9764@12 - ❖
- VSAI_B and V_B values of DG in C2/S2 in (P.U):
○ VSAI_B for DG1@30 and DG2@25: −0.0462@30; −0.0021@25 ○ V_B for DG1@30 and DG2@25: 0.9999@30; 0.9958@25 ○ Minimum voltage (V_min): 0.9769@13 - ❖
- VSAI_B and V_B values of DG in C2/S3 in (P.U):
○ VSAI_B for DG1@30; DG2@25; DG3@8: −0.0358@30; −0.0010@25; −0.0281@8 ○ V_B for DG1@30; DG2@25; DG3@8: 1.0000@30; 0.9966@25; 0.9956@8 ○ Minimum voltage (V_min): 0.9857@15
- ●
- C2/S1: ΔU across TB1 (TS4: node 25–29): V_B at 25: 0.9928; V_B at 29: 0.9954; |ΔU_B| = 0.0026.
- ●
- C2/S1: ΔU across TB2 (TS5: node 18–33): V_B at 18: 0.9859; V_B at 33: 0.9880; |ΔU_B| = 0.0021.
- ●
- C2/S1: ΔU across TB1 (TS4: node 25–29): V_C at 25: 0.9925; V_C at 29: 0.9965; |ΔU_C| = 0.0040.
- ●
- C2/S1: ΔU across TB2 (TS5: node 18–33): V_C at 18: 0.9877; V_C at 33: 0.9894; |ΔU_C| = 0.0017.
- ➢
- C2/S2: ΔU across TB1 (TS4: node 25–29): V_B at 25: 0.9958; V_B at 29: 0.9966; |ΔU_B| = 0.0008.
- ➢
- C2/S2: ΔU across TB2 (TS5: node 18–33): V_B at 18: 0.9860; V_B at 33: 0.9880; |ΔU_B| = 0.0020.
- ➢
- C2/S2: ΔU across TB1 (TS4: node 25–29): V_C at 25: 0.9966; V_C at 29: 0.9983; |ΔU_C| = 0.0017.
- ➢
- C2/S2: ΔU across TB2 (TS5: node 18–33): V_C at 18: 0.9876; V_C at 33: 0.9894; |ΔU_C| = 0.0018.
- ❖
- C2/S3: ΔU across TB1 (TS4: node 25–29): V_B at 25: 0.9966; V_B at 29: 0.9975; |ΔU_B| = 0.0009.
- ❖
- C2/S3: ΔU across TB2 (TS5: node 18–33): V_B at 18: 0.9894; V_B at 33: 0.9907; |ΔU_B| = 0.0013.
- ❖
- C2/S3: ΔU across TB1 (TS4: node 25–29): V_C at 25: 0.9960; V_C at 29: 0.9983; |ΔU_C| = 0.0023.
- ❖
- C2/S3: ΔU across TB2 (TS5: node 18–33): V_C at 18: 0.9903; V_C at 33: 0.9904; |ΔU_C| = 0.0001.
- ❖
- Percentage improvement in TP between case 2 (DGs with PF ± 3%) and case 1 (DGs with 1 PF).
- ○
- Reduction (↓) in PLoss by% in case 2 (S1, S2 & S3): 60.10% (↓); 62.66% (↓); 73.34% (↓).
- ○
- Reduction (↓) in QLoss by% in case 2 (S1, S2 & S3): 59.85% (↓); 61.63% (↓); 73.40% (↓).
- ○
- Increase (↑) in DGPP by% in case 2 (S1, S2 & S3): −17.54% (↑); −21.85% (↑); −14.37% (↑).
- ❖
- Percentage improvement in CP of case 2 (DGs with PF ± 3%) in contrast to case 1 (DGs with 1 PF).
- ○
- Reduction (↓) in PLC by% in case 2 (S1, S2 & S3): 60.05% (↓); 72.84% (↓); 73.33% (↓).
- ○
- Increase (↑) in PLS by% in case 2 (S1, S2 & S3): 50.01% (↑); 52.46% (↑); 37.04% (↑).
- ○
- Reduction (↓) in CPDG by% in case 2 (S1, S2 & S3): 25.69% (↓); 29.57% (↓); 22.82% (↓).
- ○
- Reduction (↓) in AIC (1) by% in case 2 (S1, S2 & S3): 43.66% (↓); 46.60% (↓); 41.50% (↓).
- ○
- Reduction (↓) in AIC (2) by% in case 2 (S1, S2 & S3): 21.11% (↓); 25.25% (↓); 18.10% (↓).
5.2.3. Evaluation under Case 3: DG Placements at 0.85 ± 3% PF (Type-2)
- ➢
- Case 3/Scenario 1 (C3/S1): 1 × DG (at 0.85 ± 3% lagging PF) placement in the 33-bus MDS.
- ➢
- Case 3/Scenario 2 (C3/S2): 2 × DGs (at 0.85 ± 3% lagging PF) placement in the 33-bus MDS.
- ➢
- Case 3/Scenario 3 (C3/S3): 3 × DGs (at 0.85 ± 3% lagging PF) placement in the 33-bus MDS.
- ❖
- VSAI_B and V_B values of DG in C3/S1 in (P.U):
○ VSAI_B for DG1@bus 30: −0.0570@30 ○ V_B for DG1@bus 30: 0.9998@30 ○ Minimum voltage (V_min): 0.9761@12 - ❖
- VSAI_B and V_B values of DG in C3/S2 in (P.U):
○ VSAI_B for DG1@ 30 and DG2@25: −0.0351@30; −0.0203@25 ○ V_B for DG1@ 30 and DG2@25: 1.0000@30; 0.9995@25 ○ Minimum voltage (V_min): 0.9773@13 - ❖
- VSAI_B and V_B values of DG in C3/S3 in (P.U):
○ VSAI_B for DG1@30; DG2@25; DG3@8: −0.0228@30; −0.0168@25; −0.0377@8 ○ V_B for DG1@30; DG2@25; DG3@8: 1.0000@30; 1.0000@25; 0.9998@8 ○ Minimum voltage (V_min): 0.9880@15
- ●
- C3/S1: ΔU across TB1 (TS4: node 25–29): V_B at 25: 0.9927; V_B at 29: 0.9953; |ΔU_B| = 0.0026.
- ●
- C3/S1: ΔU across TB2 (TS5: node 18–33): V_B at 18: 0.9856; V_B at 33: 0.9877; |ΔU_B| = 0.0021.
- ●
- C3/S1: ΔU across TB1 (TS4: node 25–29): V_C at 25: 0.9954; V_C at 29: 0.9982; |ΔU_C| = 0.0028.
- ●
- C3/S1: ΔU across TB2 (TS5: node 18–33): V_C at 18: 0.9878; V_C at 33: 0.9892; |ΔU_C| = 0.0014.
- ➢
- C3/S2: ΔU across TB1 (TS4: node 25–29): V_B at 25: 0.9995; V_B at 29: 0.9984; |ΔU_B| = 0.0011.
- ➢
- C3/S2: ΔU across TB2 (TS5: node 18–33): V_B at 18: 0.9862; V_B at 33: 0.9882; |ΔU_B| = 0.0020.
- ➢
- C3/S2: ΔU across TB1 (TS4: node 25–29): V_C at 25: 0.9982; V_C at 29: 0.9983; |ΔU_C| = 0.0001.
- ➢
- C3/S2: ΔU across TB2 (TS5: node 18–33): V_C at 18: 0.9878; V_C at 33: 0.9896; |ΔU_C| = 0.0018.
- ❖
- C3/S3: ΔU across TB1 (TS4: node 25–29): V_B at 25: 1.0000; V_B at 29: 0.9992; |ΔU_B| = 0.0008.
- ❖
- C3/S3: ΔU across TB2 (TS5: node 18–33): V_B at 18: 0.9904; V_B at 33: 0.9914; |ΔU_B| = 0.0010.
- ❖
- C3/S3: ΔU across TB1 (TS4: node 25–29): V_C at 25: 0.9990; V_C at 29: 0.9976; |ΔU_C| = 0.0014.
- ❖
- C3/S3: ΔU across TB2 (TS5: node 18–33): V_C at 18: 0.9910; V_C at 33: 0.9908; |ΔU_C| = 0.0002.
- ○
- Reduction (↓) in PLoss by% in case 2 (S1, S2 & S3): 60.10% (↓); 62.66% (↓); 73.34% (↓).
- ➢
- Reduction (↓) in PLoss by% in case 3 (S1, S2 & S3): 63.29% (↓); 68.38% (↓); 80.43% (↓).
- ○
- Reduction (↓) in QLoss by% in case 2 (S1, S2 & S3): 59.85% (↓); 61.63% (↓); 73.40% (↓).
- ➢
- Reduction (↓) in QLoss by% in case 3 (S1, S2 & S3): 59.86% (↓); 63.29% (↓); 70.03% (↓).
- ○
- Increase (↑) in DGPP by% in case 2 (S1, S2 & S3): −17.54% (↑); −21.85% (↑); −14.37% (↑).
- ➢
- Increase (↑) in DGPP by% in case 3 (S1, S2 & S3): −18.77% (↑); −17.64% (↑); −9.48% (↑).
- ❖
- Percentage improvement in CP between case 2, 3 and case 1:
- ○
- Reduction (↓) in PLC by% in case 2 (S1, S2 & S3): 60.05% (↓); 72.84% (↓); 73.33% (↓).
- ➢
- Reduction (↓) in PLC by% in case 3 (S1, S2 & S3): 63.29% (↓); 68.38% (↓); 80.43% (↓).
- ○
- Increase (↑) in PLS by% in case 2 (S1, S2 & S3): 50.01% (↑); 52.46% (↑); 37.04% (↑).
- ➢
- Increase (↑) in PLS by% in case 3 (S1, S2 & S3): 52.70% (↑); 49.25% (↑); 40.60% (↑).
- ○
- Reduction (↓) in CPDG by% in case 2 (S1, S2 & S3): 25.69% (↓); 29.57% (↓); 22.82% (↓).
- ➢
- Reduction (↓) in CPDG by% in case 3 (S1, S2 & S3): 30.85% (↓); 29.89% (↓); 22.94% (↓).
- ○
- Reduction (↓) in AIC (1) by% in case 2 (S1, S2 & S3): 43.66% (↓); 46.60% (↓); 41.50% (↓).
- ➢
- Reduction (↓) in AIC (1) by% in case3 (S1, S2 & S3): 44.50% (↓); 43.72% (↓); 38.15% (↓).
- ○
- Reduction (↓) in AIC (2) by% in case 2 (S1, S2 & S3): 21.11% (↓); 25.25% (↓); 18.10% (↓).
- ➢
- Reduction (↓) in AIC (2) by% in case3 (S1, S2 & S3): 22.29% (↓); 21.21% (↓); 13.41% (↓).
5.3. Detailed Analysis of Assets (DG+DSTATCOM) Placements Scenarios in 33-bus System (Cases 4–5)
5.3.1. Evaluation under Case 4: DG (Type-1) and DSTATCOM (Type-3) Placements
- ➢
- Case 4/Scenario 1 (C4/S1): 1 × DG + 1 × DSTATCOM placement in the 33-bus MDS.
- ➢
- Case 4/Scenario 2 (C4/S2): 2 × DG + 2 × DSt placement in the 33-bus MDS.
- ➢
- Case 4/Scenario 3 (C4/S3): 3 × DG + 3 × DSt placement in the 33-bus MDS.
- ❖
- VSAI_B and V_B values of DG + DSTATCOM (DG + DSt) in C4/S1:
○ VSAI_B for DG1 + DSt1@bus 30: −0.0560@30 ○ V_B for DG1 + DSt1@bus 30: 0.9999@30 ○ Minimum voltage (V_min): 0.9764@12 - ❖
- VSAI_B and V_B values of DG + DSt in C4/S2:
○ VSAI_B for DG1 + DSt1@30 and DG2 + DS2@25: −0.0459@30; −0.0210@25 ○ V_B for DG1 + DSt1@30 and DG2 + DS2@25: 0.9998@30; 0.9957@25 ○ Minimum voltage (V_min): 0.9768@13 - ❖
- VSAI_B and V_B values of DG + DSt in C3/S3:
○ VSAI_B for DG1 + DSt1@30; DG2 + DSt2@25; DG3 + DSt3@8: −0.0356@30; −0.001@25; −0.0280@8 ○ V_B for DG1 + DSt1@30; DG2 + DSt2@ 25; DG3 + DSt3@8: 1.0000@30; 0.9966@25; 0.9955@8 ○ Minimum voltage (V_min): 0.9856@15
- ●
- C4/S1: ΔU across TB1 (TS4: node 25–29): V_B at 25: 0.9928; V_B at 29: 0.9953; |ΔU_B| = 0.0025.
- ●
- C4/S1: ΔU across TB2 (TS5: node 18–33): V_B at 18: 0.9858; V_B at 33: 0.9879; |ΔU_B| = 0.0021.
- ●
- C4/S1: ΔU across TB1 (TS4: node 25–29): V_C at 25: 0.9906; V_C at 29: 0.9983; |ΔU_C| = 0.0077.
- ●
- C4/S1: ΔU across TB2 (TS5: node 18–33): V_C at 18: 0.9875; V_C at 33: 0.9894; |ΔU_C| = 0.0019.
- ➢
- C4/S2: ΔU across TB1 (TS4: node 25–29): V_B at 25: 0.9957; V_B at 29: 0.9965; |ΔU_B| = 0.0001.
- ➢
- C4/S2: ΔU across TB2 (TS5: node 18–33): V_B at 18: 0.9858; V_B at 33: 0.9879; |ΔU_B| = 0.0021.
- ➢
- C4/S2: ΔU across TB1 (TS4: node 25–29): V_C at 25: 0.9960; V_C at 29: 0.9982; |ΔU_C| = 0.0022.
- ➢
- C4/S2: ΔU across TB2 (TS5: node 18–33): V_C at 18: 0.9875; V_C at 33: 0.9893; |ΔU_C| = 0.0018.
- ❖
- C4/S3: ΔU across TB1 (TS4: node 25–29): V_B at 25: 0.9966; V_B at 29: 0.9975; |ΔU_B| = 0.0011.
- ❖
- C4/S3: ΔU across TB2 (TS5: node 18–33): V_B at 18: 0.9893; V_B at 33: 0.9907; |ΔU_B| = 0.0014.
- ❖
- C4/S3: ΔU across TB1 (TS4: node 25–29): V_C at 25: 0.9970; V_C at 29: 0.9982; |ΔU_C| = 0.0012.
- ❖
- C4/S3: ΔU across TB2 (TS5: node 18–33): V_C at 18: 0.9896; V_C at 33: 0.9914; |ΔU_C| = 0.0008.
- ❖
- Percentage improvement in TP between case 2 and case 4 in comparison with case 1:
- ○
- Reduction (↓) in PLoss by% in case 2 (S1, S2 & S3): 60.10% (↓); 62.66% (↓); 73.34% (↓).
- ➢
- Reduction (↓) inPLoss by% in case 4 (S1, S2 & S3): 59.32% (↓); 61.51% (↓); 70.61% (↓).
- ○
- Reduction (↓) in QLoss by% in case 2 (S1, S2 & S3): 59.85% (↓); 61.63% (↓); 73.40% (↓).
- ➢
- Reduction (↓) inQLoss by% in case 4 (S1, S2 & S3): 59.31% (↓); 59.65% (↓); 72.51% (↓).
- ○
- Increase (↑) in DGPP by% in case 2 (S1, S2 & S3): −17.54% (↑); −21.85% (↑); −14.37% (↑).
- ➢
- Increase (↑) inDGPP by% in case 4 (S1, S2 & S3):−17.53% (↑); −25.81% (↑); −14.38% (↑).
- ❖
- Percentage improvement in CP between case 2 (for reference) and case 4 with respect to case 1:
- ○
- Reduction (↓) in PLC by% in case 2 (S1, S2 & S3): 60.05% (↓); 72.84% (↓); 73.33% (↓).
- ➢
- Reduction (↓) in PLC by% in case 4 (S1, S2 & S3): 59.32% (↓); 61.45% (↓); 70.62% (↓).
- ○
- Increase (↑) in PLS by% in case 2 (S1, S2 & S3): 50.01% (↑); 52.46% (↑); 37.04% (↑).
- ➢
- Increase (↑) in PLS by% in case 4 (S1, S2 & S3): 49.40% (↑); 44.30% (↑); 35.65% (↑).
- ○
- Reduction (↓) in CPDG by% in case 2 (S1, S2 & S3): 25.69% (↓); 29.57% (↓); 22.82% (↓).
- ➢
- Reduction (↓) in CPDG by% in case 4 (S1, S2 & S3): 25.69% (↓); 29.57% (↓); 22.82% (↓).
- ○
- Reduction (↓) in AIC (1) by% in case 2 (S1, S2 & S3): 43.66% (↓); 46.60% (↓); 41.50% (↓).
- ➢
- Reduction (↓) in AIC (1) by% in case4 (S1, S2 & S3):25.785% (↓); 29.68% (↓); 22.76% (↓).
- ○
- Reduction (↓) in AIC (2) by% in case 2 (S1, S2 & S3): 21.11% (↓); 25.25% (↓); 18.10% (↓).
- ➢
- Reduction (↓) in AIC (2) by% in case4 (S1, S2 & S3): 22.78% (↓); 29.67% (↓); 22.97% (↓).
5.3.2. Evaluation under Case 5: DG (Type-1) and DSTATCOM (Type-3) Placements
- ➢
- Case 5/Scenario 1 (C5/S1): 1 × DG + 1 × DSTATCOM placement in 33-bus MDS.
- ➢
- Case 5/Scenario 2 (C5/S2): 2 × DG + 2 × DSTATCOM placement in 33-bus MDS.
- ➢
- Case 5/Scenario 3 (C5/S3): 3 × DG + 3 × DSTATCOM placement in 33-bus MDS.
- ❖
- VSAI_B and V_B values of DG + DSTATCOM (DG + DS) in C5/S1:
○ VSAI_B for DG1 + DSt1 @ bus 30: −0.0565@30 ○ V_B for DG1 + DSt1 @ bus 30: 0.9997@30 ○ Minimum voltage (V_min): 0.9760@12 - ❖
- VSAI_B and V_B values of DG + DSt in C5/S2:
○ VSAI_B for DG1 + DSt1@30 and DG2 + DSt2 @25: −0.0563@30; −0.0202@25 ○ V_B for DG1 + DSt1 @30 and DG2 + DSt2 @25: 0.9999@30; 0.9994@25 ○ Minimum voltage (V_min): 0.9768@13 - ❖
- VSAI_B and V_B values of DG + DS in C5/S3:
○ VSAI_B for DG1 + DSt1@30; DG2 + DSt2@25; DG3 + DSt3@8: −0.0228@30; −0.0167@25; −0.0375@8 ○ V_B for DG1 + DSt1@30; DG2 + DSt2@25; DG3 + DSt3@ 8: 0.9998@30; 0.9998@25; 0.9997@8 ○ Minimum voltage (V_min): 0.9878@15
- ●
- C5/S1: ΔU across TB1 (TS4: node 25–29): V_B at 25: 0.9926; V_B at 29: 0.9950; |ΔU_B| = 0.0024.
- ●
- C5/S1: ΔU across TB2 (TS5: node 18–33): V_B at 18: 0.9855; V_B at 33: 0.9876; |ΔU_B| = 0.0021.
- ●
- C5/S1: ΔU across TB1 (TS4: node 25–29): V_C at 25: 0.9942; V_C at 29: 0.9936; |ΔU_C| = 0.0006.
- ●
- C5/S1: ΔU across TB2 (TS5: node 18–33): V_C at 18: 0.9872; V_C at 33: 0.9900; |ΔU_C| = 0.0028.
- ➢
- C5/S2: ΔU across TB1 (TS4: node 25–29): V_B at 25: 0.9994; V_B at 29: 0.9983; |ΔU_B| = 0.0011.
- ➢
- C5/S2: ΔU across TB2 (TS5: node 18–33): V_B at 18: 0.9861; V_B at 33: 0.9881; |ΔU_B| = 0.0020.
- ➢
- C5/S2: ΔU across TB1 (TS4: node 25–29): V_C at 25: 1.0000; V_C at 29: 0.9967; |ΔU_C| = 0.0033.
- ➢
- C5/S2: ΔU across TB2 (TS5: node 18–33): V_C at 18: 0.9877; V_C at 33: 0.9895; |ΔU_C| = 0.0018.
- ❖
- C5/S3: ΔU across TB1 (TS4: node 25–29): V_B at 25: 0.9998; V_B at 29: 0.9990; |ΔU_B| = 0.0008.
- ❖
- C5/S3: ΔU across TB2 (TS5: node 18–33): V_B at 18: 0.9901; V_B at 33: 0.9912; |ΔU_B| = 0.0011.
- ❖
- C5/S3: ΔU across TB1 (TS4: node 25–29): V_C at 25: 1.0000; V_C at 29: 0.9982; |ΔU_C| = 0.0018.
- ❖
- C5/S3: ΔU across TB2 (TS5: node 18–33): V_C at 18: 0.9908; V_C at 33: 0.9918; |ΔU_C| = 0.0010.
- ○
- Reduction (↓) in PLoss by% in case 3 (S1, S2 & S3): 63.29% (↓); 68.38% (↓); 80.43% (↓).
- ➢
- Reduction (↓) inPLoss by% in case 5 (S1, S2 & S3): 62.45% (↓); 66.83% (↓); 76.97% (↓).
- ○
- Reduction (↓) in QLoss by% in case 3 (S1, S2 & S3): 59.86% (↓); 63.29% (↓); 70.03% (↓).
- ➢
- Reduction (↓) inQLoss by% in case 5 (S1, S2 & S3): 58.87% (↓); 62.22% (↓); 74.83% (↓).
- ○
- Increase (↑) in DGPP by% in case 3 (S1, S2 & S3): −18.77% (↑); −17.64% (↑); −9.48% (↑).
- ➢
- Increase (↑) inDGPP by% in case 5 (S1, S2 & S3): −18.80% (↑); −17.61% (↑); −9.41% (↑).
- ❖
- Percentage improvement in CP between case 3 and 5 in comparison with case 1:
- ○
- Reduction (↓) in PLC by% in case 3 (S1, S2 & S3): 63.29% (↓); 68.38% (↓); 80.43% (↓).
- ➢
- Reduction (↓) in PLC by% in case 5 (S1, S2 & S3): 62.46% (↓); 66.83% (↓); 76.96% (↓).
- ○
- Increase (↑) in PLS by% in case 3 (S1, S2 & S3): 52.70% (↑); 49.25% (↑); 40.60% (↑).
- ➢
- Increase (↑) in PLS by% in case 5 (S1, S2 & S3): 52.00% (↑); 48.13% (↑); 38.85% (↑).
- ○
- Reduction (↓) in CPDG by% in case 3 (S1, S2 & S3): 30.85% (↓); 29.89% (↓); 22.94% (↓).
- ➢
- Reduction (↓) in CPDG by% in case 5 (S1, S2 & S3): 30.86% (↓); 29.89% (↓); 22.93% (↓).
- ○
- Reduction (↓) in AIC (1) by% in case 3 (S1, S2 & S3): 44.50% (↓); 43.72% (↓); 38.15% (↓).
- ➢
- Reduction (↓) in AIC (1) by% in case 5 (S1, S2 & S3): 30.97% (↓); 29.95% (↓); 22.99% (↓).
- ○
- Reduction (↓) in AIC (2) by% in case3 (S1, S2 & S3): 22.29% (↓); 21.21% (↓); 13.41% (↓).
- ○
- Reduction (↓) in AIC (2) by% in case 5 (S1, S2 & S3): 30.97% (↓); 29.96% (↓); 23.00% (↓).
5.4. Benchmark Analysis of Multiple DG Placements (only) Scenarios in 69-Bus System (Case 6)
- ➢
- Case 6/Scenario 1 (C6/S1): 3 × DGs placement operating at 0.90 ± 3% lagging PF in the 69-bus MDS.
- ➢
- Case 6/Scenario 2 (C6/S2): 3 × DGs placement operating at 0.82 ± 3% lagging PF in the 69-bus MDS.
- ❖
- VSAI_B and V_B values of DG in C6/S1 in (P.U):
○ VSAI_B for DG1@61; DG2@21; DG2@11: −0.0537@61; −0.0020@21; −0.0129@11 ○ V_B for DG1@61; DG2@21; DG2@11: 1.0001@61; 0.9990@21; 1.0000@11 ○ Minimum voltage (V_min): 0.9965@46 - ❖
- VSAI_B and V_B values of DG in C6/S2 in (P.U):
○ VSAI_B for DG1@61; DG2@21; DG2@11: −0.0616@61; −0.0047@21; −0.0093@11 ○ V_B for DG1@61; DG2@21; DG2@11: 1.0001@61; 1.0000@21; 1.0000@11 ○ Minimum voltage (V_min): 0.99763@46
- ●
- C6/S1: ΔU across TB1 (TS3: node 15–46): V_B at 25: 0.9969; V_B at 29: 0.9964; |ΔU_B| = 0.0005.
- ●
- C6/S1: ΔU across TB2 (TS5: node 27–65): V_B at 18: 0.9972; V_B at 33: 0.9972; |ΔU_B| = 0.0000.
- ●
- C6/S1: ΔU across TB1 (TS3: node 15–46): V_C at 25: 0.9967; V_C at 29: 0.9966; |ΔU_C| = 0.0001.
- ●
- C6/S1: ΔU across TB2 (TS5: node 27–65): V_C at 18: 0.9974; V_C at 33: 0.9972; |ΔU_C| = 0.0001.
- ➢
- C6/S2: ΔU across TB1 (TS3: node 15–46): V_B at 25: 0.9976; V_B at 29: 0.9975; |ΔU_B| = 0.0001.
- ➢
- C6/S2: ΔU across TB2 (TS5: node 27–65): V_B at 18: 0.9985; V_B at 33: 0.9884; |ΔU_B| = 0.0001.
- ➢
- C6/S2: ΔU across TB1 (TS3: node 15–46): V_C at 25: 0.99763; V_C at 29: 0.99763; |ΔU_C| = 0.00.
- ➢
- C6/S2: ΔU across TB2 (TS5: node 27–65): V_C at 18: 0.9986; V_C at 33: 0.9984; |ΔU_C| = 0.0020.
6. Comparison/Validation Analysis
6.1. Results Comparasion with Existing Works: 33-Bus Mesh Distribution System
6.1.1. Comparison of Numerical Results Considering a 33-Bus Meshed Test Distribution System
6.1.2. Comparison of Numerical Results Considering a 69-Bus Meshed Test Distribution System
7. Conclusions
Author Contributions
Funding
Conflicts of Interest
Abbreviations
| ACD | Annual cost of D-STATCOM | PLS | Savings in PLC (in million USD) |
| ADS | Active distribution system | PSSR | P Capacity Release from Substation |
| AIC | Annual investment cost | P.U | Per unit system values (or p.u) |
| AFc | Annualized factor (of cost) | Q | Reactive Power |
| C (#) | Case (No. = 1, 2, 3, 4) | QDG | Q contribution from substation |
| Ct | Annual cost based on interest-rate | QLoss | Reactive Power loss in KVAR |
| CP | Cost (economics related) parameters | QLM | QLoss minimization (by percentage) |
| CPDG | Cost of DG for PDG | QLMC’ | LMC expression after reactive power contribution from DG |
| CPI | Cost (economic) based performance indicators interchangeable for CP | QSSR | Q Capacity Release from Substation |
| CQDG | Cost of DG for QDG | RB | Receiving end (load) bus |
| CUc | Cost related to Distributed generation unit (USD/KVA) | RDS | Radial distribution system |
| DG | Distributed generation units | RSS | Relief-in-substation (active and reactive power) capacity |
| DGPP | DG contribution by%, in a TDS | S (#) | Scenario (No. = 1, 2, 3, 4) |
| DS | Distribution systems | SB | Sending end (feeding) bus |
| D-STATCOM | Distributed static compensator | SG | Smart grid |
| DSt | D-STATCOM | SLM | LMC expression for apparent power |
| DGCmax | Maximum capacities of DG units in (KVA or MVA) | SS | Substation |
| DG-P | DG based planning | TB | Tie-line branch |
| DS-P | Distribution system planning | TDS | Test distribution system |
| Eqn. (No). | Equation. (Number) | TS | Tie-Switch (normally open switch) |
| EU | Rate of electricity unit | TP | Technical Parameters |
| LDS | Loop distribution system | TPI | Technical performance indicators |
| LM | Loss minimization | TY | Time in a year = 8760 Hours |
| LMC | Loss minimization condition | U or V | Voltage magnitude |
| MDS | Mesh distribution system | ΔU | Difference in Voltage magnitude |
| ODGP | Optimal DG Unit Placement | V_B | Feasible voltage solution via VSAI_B |
| P | Active Power | V_C | Calculated value for comparison |
| Pss/PDG | P contribution from substation & DG | VM | Voltage maximization |
| PF/pf | Power factor | VSI | Voltage stability index |
| PLoss | Active Power loss in KW | VSAI | Voltage stability assessment index |
| PLC | Cost of PLoss (in million USD) | VSAI_B | New VSAI (proposed for MDS) |
| PLM | PLoss minimization (by percentage) | VSAI_B-LMC | VSAI (new) and LMC (new) based integrated planning approach for MDS |
| PLMC’ | LMC expression after active power contribution from DG |
Appendix A


| Load at Bus 2 | S2b = 1 MVA |
| Load at Bus 4 | S4b = 0.5 MVA |
| Load at Bus 6 | S6b = 0.75 MVA |
| Impedance between 1 and 2 | Z1B = 2 + j1.5 |
| Impedance between 3 and 4 | Z2B = 1.5 + j1 |
| Impedance between 5 and 6 | Z3B = 1.75 + j1.25 |
| Tie line impedance (between 2 and 4) | 1 + j0.5 |
| Tie line impedance (between 2 and 6) | 1 + j0.5 |
- Step 1:
- Read system data and configure TDS configured to MDS.
- Step 2:
- Run the load flow for base case without DG.
- Step 3:
- VSAI_B at each RB is calculated according to Equation (16) with respective voltage profile as a feasible solution V_B is achieved according to Equation (17). V_C values are for reference only.
- Step 4:
- Select the three buses highest numerical values of proposed VSAI_B, as prospective candidates for the simultaneous DG placement. The achieved values in Steps 1–4 are illustrated in Table A2:
| Sending End Buses | Step 1: Base Case Radial: No DG | Step 2: Base Case Mesh: No DG |
|---|---|---|
| V_C @ bus 1 | 1 | 1 |
| V_C @ bus 3 | 1 | 1 |
| V_C @ bus 5 | 1 | 1 |
| Receiving End Buses | Step 1: Base Case Radial: No DG | Step 2: Base Case Mesh: No DG |
| V_C @ bus 2 | 0.9842 | 0.9891 |
| V_C @ bus 4 | 0.9943 | 0.9911 |
| V_C @ bus 6 | 0.9899 | 0.9894 |
| Receiving End Buses | Step 1: Base Case Radial: No DG | Steps 3–4: Base Case Mesh: No DG |
| VSAI_B @ bus 2 | - | 0.0622 (Candidate for DG 1) |
| VSAI_B @ bus 4 | - | 0.0225 (Candidate for DG 3) |
| VSAI_B @ bus 6 | - | 0.0402 (Candidate for DG 2) |
| Receiving End Buses | Step 1: Base Case Radial: No DG | Steps 3–4: Base Case Mesh: No DG |
| V_B @ bus 2 | - | 0.9848 |
| V_B @ bus 4 | - | 0.9921 |
| V_B @ bus 6 | - | 0.9882 |
| Tie-Line ΔUB/ΔUC | Step 1: Base Case Radial: No DG | Steps 3–4: Base Case Mesh: No DG |
| |ΔU| across bus 2–4 | 0.0101/- | 0.0020/0.0073 |
| |ΔU| across bus 2–6 | 0.0057/- | 0.0003/0.0034 |
| |ΔU| across bus 4–6 | 0.0044/- | 0.0017/0.0049 |
| Other Parameters | Step 1: Base Case Radial: No DG | Steps 3–4: Base Case Mesh: No DG |
| PSSR (KW) | 1934.02 | 1931.69 |
| QSSR (KVAr) | 1201.02 | 1198.86 |
| PLoad (KW) | 1912.50 | 1912.50 |
| QLoad (KVAr) | 1185.26 | 1185.26 |
| PLoss (KW) | 21.52 | 19.19 |
| QLoss (KVAr) | 15.76 | 13.60 |
- Step 5:
- Run load flow for test MDS after placement of three DGs at 0.85 PF at a relevant bus to a voltage limit, which is close to or equal to the 1.0 ± 0.5% per unit (P.U), considering voltage level at SS as reference i.e., 1.0 P.U, as shown in Step 5 for MDS with three DGs aiming at 1.0 P.U indicated in second column of Table A3.
- Step 6:
- Find out voltage difference across each TB among the three tied feeders. The sizing of DG at a feeder with the highest voltage value is reduced to minimize the tie currents among other tied feeders and vice versa.
- Step 7:
- Repeat the process until, respective VSAI_B trend, resulting in voltage profile (V_B) least voltage difference |ΔU| across TB1 (U2b and U4b) and TB2 (U4b and U6b), LMC condition along with PLMC’ or QLMC’ or any of them is achieved. The conditions are achieved with the respective multiple DG sizes and the solution is in MDS. The achieved values in Steps 5–7 are illustrated in Table A3. It can be found that the final solution in Steps 6–7 is within defined constraints, |ΔU| across respective tie-lines have negligible difference and LMC (highlighted in Table A3) is achieved at specified DG capacities.
| Sending End Buses | Steps 5–6: MDS with 3 DGs (1 P.U) | Steps 6–7: MDS with 3 DGs |
|---|---|---|
| V_C @ bus 1 | 1 | 1 |
| V_C @ bus 3 | 1 | 1 |
| V_C @ bus 5 | 1.0001 | 1 |
| Receiving End Buses | Steps 5–6: MDS with 3 DGs (1 P.U) | Steps 6–7: MDS with 3 DGs |
| V_C @ bus 2 | 1 | 0.9995 |
| V_C @ bus 4 | 1 | 0.9999 |
| V_C @ bus 6 | 1.0002 | 0.9990 |
| Receiving End Buses | Steps 5–6: MDS with 3 DGs (1 P.U) | Steps 6–7: MDS with 3 DGs |
| VSAI_B @ bus 2 | 0 | 0 |
| VSAI_B @ bus 4 | −0.0013 | −0.0022 |
| VSAI_B @ bus 6 | 0.000536 | 0.0096 |
| Receiving End Buses | Steps 5–6: MDS with 3 DGs (1 P.U) | Steps 6–7: MDS with 3 DGs |
| V_B @ bus 2 | 0.9998 | 0.9998 |
| V_B @ bus 4 | 1.0003 | 1.0003 |
| V_B @ bus 6 | 0.9997 | 0.9997 |
| Tie-Line ΔUB/ΔUC | Steps 5–6: MDS with 3 DGs (1 P.U) | Steps 6–7: MDS with 3 DGs |
| |ΔU| across bus 2–4 | 0/0.0005 | 0.0005/0.0005 |
| |ΔU| across bus 2–6 | 0.0002/0.0001 | 0.0005/0.0001 |
| |ΔU| across bus 4–6 | 0.0002/0.0006 | 0.0009/0.0006 |
| Other Parameters | Steps 5–6: MDS with 3 DGs (1 P.U) | Steps 6–7: MDS with 3 DGs |
| PSSR (KW) | −12.57 (Reverse Power) | 1931.69 |
| QSSR (KVAr) | −22.58 (Reverse Power) | 1198.86 |
| PLoad (KW) | 1912.5 | 1912.50 |
| QLoad (KVAr) | 1185.26 | 1185.26 |
| PDG (KW) | 1916.93 | 1912.67 |
| QDG (KW) | 1173.22 | 1185.371 |
| PLoss (KW) | 4.43 | 0.170 (PLMC’) |
| QLoss (KVAr) | −12.04 (Reverse Power) | 0.111 (QLMC’) |
| DG1 Capacity @ bus 2 | 850 + j526.78 | 850 + j526.78 |
| DG2 Capacity @ bus 6 | 629 + j389.819 | 484.5 + j300.27 |
| DG3 Capacity @ bus 4 | 450.5 + j279.195 | 467.5 + j289.731 |
- Step 8:
- Evaluate the TPIs and CPIs (aforementioned in Section 4.4) on the basis of Steps 1–7 and the results (in step 8) are shown in Table A4.
| TPIs | CPIs | ||||||||
| S#: | Ploss KW | Qloss KVAR | PLM % | QLM % | PDG % | PLC (M$)/ PLS (M$) | CPDG $/Mwh | CQDG $/Mvarh | ACI (M$) |
| Steps 1–4 | 19.19 | 13.6 | 10.82 | 13.705 | - | 0.010086/ 0.0012246 | - | - | - |
| Step 5 | 4.43 | −12.04 | 79.41 | 1.764 * | 100.88 * | 0.0023284/ 0.0089825 | 38.84 | 6.1056 | 0.410173 |
| Steps 6–7 | 0.17 | 0.111 | 99.21 | 99.29 | 94.22 | 0.0000894/ 0.011222 | 36.29 | 5.696 | 0.383069 |
References
- Rodriguez, A.A.; Ault, G.; Galloway, S. Multi-Objective planning of distributed energy resources: A review of the state-of-the-art. Renew. Sustain. Energy Rev. 2010, 14, 1353–1366. [Google Scholar] [CrossRef]
- Kalambe, S.; Agnihotri, G. Loss minimization techniques used in distribution network: Bibliographical survey. Renew. Sustain. Energy Rev. 2014, 29, 184–200. [Google Scholar] [CrossRef]
- Kim, J.C.; Cho, S.M.; Shin, H.S. Advanced Power Distribution System Configuration for Smart Grids. IEEE Trans. Smart Grid 2013, 4, 353–358. [Google Scholar] [CrossRef]
- Sultanaa, U.; Khairuddin, A.B.; Aman, M.M.; Mokhtara, A.S.; Zareen, N. A review of optimum DG placement based on minimization of power losses and voltage stability enhancement of distribution system. Renew. Sustain. Energy Rev. 2016, 63, 363–378. [Google Scholar] [CrossRef]
- Kazmi, S.A.A.; Shahzad, M.; Shin, D. Multi-objective planning techniques in distribution networks: A composite review. Energies 2017, 10, 208. [Google Scholar] [CrossRef]
- Kazmi, S.A.A.; Shahzad, M.K.; Khan, A.Z.; Shin, D.R. Smart distribution networks: A review of modern distribution concepts from a planning perspective. Energies 2017, 10, 501. [Google Scholar] [CrossRef]
- Georgilakis, P.S.; Hatziargyriou, N.D. A review of power distribution planning in the modern power systems era: Models, methods and future research. Electr. Power Syst. Res. 2015, 121, 89–100. [Google Scholar] [CrossRef]
- Li, R.; Wang, W.; Chen, Z.; Jiang, J.; Zhang, W. A Review of Optimal Planning Active Distribution System: Models, Methods, and Future Researches. Energies 2017, 10, 1715. [Google Scholar] [CrossRef]
- Keane, A.; Ochoa, L.F.; Borges, C.L.T.; Ault, G.W.; Alarcon-Rodriguez, A.D.; Currie, R.; Pilo, F.; Dent, C.; Harrison, G.P. State-of-the-art techniques and challenges ahead for distributed generation planning and optimization. IEEE Trans. Power Syst. 2013, 28, 1493–1502. [Google Scholar] [CrossRef]
- Evangelopoulos, V.A. Optimal operation of smart distribution networks: A review of models, methods, and future research. Elect. Power Syst. Res. 2016, 140, 95–106. [Google Scholar] [CrossRef]
- Jordehi, A.R. Allocation of distributed generation units in electric power systems: A review. Renew. Sustain. Energy Rev. 2015, 56, 893–905. [Google Scholar] [CrossRef]
- Sedghi, M.; Ahmadian, A.; Golkar, M.A. Assessment of optimization algorithms capability in distribution network planning: Review, comparison and modification techniques. Renew. Sustain. Energy Rev. 2016, 66, 415–434. [Google Scholar] [CrossRef]
- Prakash, P.; Khatod, D.K. Optimal sizing and sitting techniques for distributed generation in distribution systems: A review. Renew. Sustain. Energy Rev. 2016, 57, 111–130. [Google Scholar] [CrossRef]
- Mahmoud, P.H.A.; Phung, D.H.; Vigna, K.R. A review of the optimal allocation of distributed generation: Objectives, Constraints, methods, and algorithms. Renew. Sustain. Energy Rev. 2017, 75, 293–312. [Google Scholar]
- Kaur, S.; Kumbhar, G.; Sharma, J. A MINLP technique for optimal placement of multiple DG units in distribution systems. Int. J. Elect. Power Energy Syst. 2014, 63, 609–617. [Google Scholar] [CrossRef]
- Hung, D.Q.; Mithulananthan, N. Multiple distributed generator placement in primary distribution networks for loss reduction. IEEE Trans. Ind. Electron. 2013, 60, 1700–1708. [Google Scholar] [CrossRef]
- Ali, E.; Qiang, Y. Optimal Integration and planning of renewable distributed generation in the power distribution networks: A review of analytical techniques. Appl. Energy 2018, 210, 44–59. [Google Scholar] [CrossRef]
- Modarresi, J.; Gholipour, E.; Khodabakhshain, A. A comprehensive review of the voltage stability indices. Renew. Sustain. Energy Rev. 2016, 63, 1–12. [Google Scholar] [CrossRef]
- Sultana, S.; Roy, P.K. Krill herd algorithm for optimal location of distributed generator in radial distribution system. Appl. Soft Comp. 2016, 40, 391–404. [Google Scholar] [CrossRef]
- Sanjay, R.; Jayabarathi, T.; Raghunathan, T.; Ramesh, V.; Mithulananthan, N. Optimal Allocation of Distributed Generation Using Hybrid Grey Wolf Optimizer. IEEE Access 2017, 5, 14807–14817. [Google Scholar] [CrossRef]
- Mahmoud, K.; Yorino, N.; Ahmed, A. Optimal distributed generation allocation in distribution systems for loss minimization. IEEE Trans. Power Syst. 2016, 31, 960–969. [Google Scholar] [CrossRef]
- Injeti, S.K.; Kumar, N.P. A novel approach to identify optimal access point and capacity of multiple DGs in a small, medium and large scale radial distribution systems. Int. J. Elect. Power Energy Syst. 2013, 45, 142–151. [Google Scholar] [CrossRef]
- Kansal, S.; Kumar, V.; Tyagi, B. Hybrid approach for optimal placement of multiple DGs of multiple types in distribution networks. Int. J. Elect. Power Energy Syst. 2016, 75, 226–235. [Google Scholar] [CrossRef]
- Muthukumar, K.; Jayalalitha, S. Optimal placement and sizing of distributed generators and shunt capacitors for power loss minimization in radial distribution networks using hybrid heuristic search optimization technique. Int. J. Elect. Power Energy Syst. 2016, 78, 299–319. [Google Scholar] [CrossRef]
- Chen, T.H.; Huang, W.T.; Gu, J.C.; Pu, G.C.; Hsu, Y.F.; Guo, T.Y. Feasibility study of upgrading primary feeders from radial and open loop to normally closed-loop arrangement. IEEE Trans. Power Syst. 2004, 19, 1308–1316. [Google Scholar] [CrossRef]
- Buayai, K.; Ongsaku, W.; Mithulananthan, N. Multi-objective micro-grid planning by NSGA-II in primary distribution system. Eur. Trans. Elect. Power 2011, 22, 170–187. [Google Scholar] [CrossRef]
- Che, L.; Zhang, X.; Shahidehpour, M.; Alabdulwahab, A.; Al-Turki, Y. Optimal planning of Loop-Based Microgrid Topology. IEEE Trans. Smart Grid 2017, 8, 1771–1781. [Google Scholar] [CrossRef]
- Cortes, A.S.; Contreras, S.F.; Shahidehpour, M. Microgrid Topology Planning for Enhancing the Reliability of Active Distribution Networks. IEEE Trans. Smart Grid. 2018, 9, 6369–6377. [Google Scholar] [CrossRef]
- Kazmi, S.A.A.; Shin, D.R. DG Placement in Loop Distribution Network with New Voltage Stability Index and Loss Minimization Condition Based Planning Approach under Load Growth. Energies 2017, 10, 1203. [Google Scholar] [CrossRef]
- Wang, W.; Jazebi, S.; Leon, F.; Li, Z. Looping Radial Distribution Systems Using Superconducting Fault Current Limiters: Feasibility and Economic Analysis. IEEE Trans. Power Syst. 2018, 33, 2486–2495. [Google Scholar] [CrossRef]
- Kumar, P.; Gupta, N.; Niazi, K.R.; Swarnkar, A. A Circuit Theory-based Loss Allocation Method for Active Distribution Systems. IEEE Trans. Smart Grid 2019, 10, 1005–1012. [Google Scholar] [CrossRef]
- Chen, T.H.; Lin, E.H.; Yang, N.C.; Hsieh, T.Y. Multi-objective optimization for upgrading primary feeders with distributed generators from normally closed loop to mesh arrangement. Int. J. Electr. Power Energy Syst. 2012, 45, 413–419. [Google Scholar] [CrossRef]
- Sharma, A.K.; Murthy, V.V.S.N. Analysis of Mesh Distribution Systems Considering Load models and Load growth Impact with Loops on System Performance. J. Inst. Eng. Ser. B 2014, 95, 295–318. [Google Scholar] [CrossRef]
- Alvarez-Herault, M.C.; Doye, N.N.; Gandioli, C.; Hadjsaid, N.; Tixador, P. Meshed distribution network vs reinforcement to increase the distributed generation connection. Sustain. Energy Grid Netw. 2015, 1, 20–27. [Google Scholar] [CrossRef]
- Kazmi, S.A.A.; Janjua, A.K.; Shin, D.R. Enhanced Voltage Stability Assessment Index Based Planning Approach for Mesh Distribution Systems. Energies 2018, 11, 1213. [Google Scholar] [CrossRef]
- Sirjani, R.; Jordehi, A.R. Optimal placement and sizing of distribution static compensator (D-STATCOM) in electrical distribution networks: A review. Renew. Sustain. Energy Rev. 2017, 77, 688–694. [Google Scholar] [CrossRef]
- Gupta, A.R.; Kumar, A. Optimal placement of D-STATCOM using sensitivity approaches in mesh distribution system with time variant load models under load growth. Ain Shams Eng. J. 2018, 9, 783–799. [Google Scholar] [CrossRef] [Green Version]
- Murty, V.V.S.N.; Kumar, A. Impact of D-STATCOM in distribution systems with load growth on stability margin enhancement and energy savings using PSO and GAMS. Int. Trans. Electr. Ener. Syst. 2018, 28, e2624. [Google Scholar] [CrossRef]
- Tolabi, H.B.; Ali, M.H.; Rizwan, M. Simultaneous Reconfiguration, Optimal Placement of DSTATCOM, and photovoltaic Array in Distribution System Based on Fuzzy-ACO Approach. IEEE Trans. Sustain. Energy 2015, 6, 210–218. [Google Scholar] [CrossRef]
- Devabalaji, K.R.; Ravi, K. Optimal size and sitting of multiple DG and DSTATCOM in radial distribution system using Bacterial Foraging Optimization Algorithm. Ain Shams Eng. J. 2016, 7, 959–971. [Google Scholar] [CrossRef]
- Yuvaraj, T.; Ravi, K. Multi-objective simulations DG and DSTATCOM allocation in radial distribution networks using cuckoo searching algorithm. Alex. Eng. J. 2018, 57, 2729–2742. [Google Scholar] [CrossRef]
- Devi, S.; Geethanjali, M. Optimal location and sizing determination of Distributed Generation and DSTATCOM using Particle Swarm Optimization algorithm. Int. J. Electr. Power Energy Syst. 2014, 62, 562–570. [Google Scholar] [CrossRef]
- Taher, S.A.; Afsari, S.A. Optimal location and sizing of DSTATCOM in distribution systems by immune algorithm. Int. J. Electr. Power Energy Syst. 2014, 60, 34–44. [Google Scholar] [CrossRef]
- Al-Abri, R.S.; El-Saadany, E.F.; Atwa, Y.M. Optimal placement and sizing method to improve voltage stability margin in a distribution system using distributed generation. IEEE Trans. Power Syst. 2013, 28, 326–334. [Google Scholar] [CrossRef]
- Kazmi, S.A.A.; Shahzaad, M.K.; Shin, D.R. Voltage Stability Index for Distribution Network connected in Loop Configuration. IETE J. Res. Taylor Fr. 2017, 63, 281–293. [Google Scholar] [CrossRef]
- Murthy, V.V.S.N.; Kumar, A. Comparison of optimal DG allocation methods in radial distribution systems based on sensitivity approaches. Int. J. Electr. Power Energy Syst. 2013, 53, 450–467. [Google Scholar] [CrossRef]
- Murthy, V.V.S.N.; Ashwani, K. Mesh distribution system analysis in presence of distributed generation with time varying load model. Int. J. Electr. Power Energy Syst. 2014, 62, 836–854. [Google Scholar] [CrossRef]
- Quadri, I.A.; Bhowmick, S.; Joshi, D. Multi-objective approach to maximize loadability of distribution networks by simultaneous reconfiguration and allocation of distributed energy resources. IET Gener. Transm. Distrib. 2018, 12, 5700–5712. [Google Scholar] [CrossRef]
- Working paper on Solar Photovoltaics, Renewable Energy Technolgies: Cost Analysis Series, International Renewable Energy Agency. Available online: https://www.irena.org/documentdownloads/publications/re_technologies_cost_analysis-solar_pv.pdf (accessed on 7 July 2019).
- Aman, M.M.; Jasmon, G.B.; Bakar, A.H.A.; Mokhlis, H. A new approach for optimum simultaneous multi-DG distributed generation Units placement and sizing based on maximization of system loadability using HPSO (hybrid particle swarm optimization) algorithm. Energy 2014, 66, 202–215. [Google Scholar] [CrossRef]
- Murty, V.V.S.N.; Kumar, A. Optimal placement of DG in radial distribution systems based on new voltage stability index under load growth. Int. J. Electr. Power Energy Syst. 2015, 69, 246–256. [Google Scholar] [CrossRef]
- Quadri, I.; Bhowmick, S.; Joshi, D. A comprehensive technique for optimal allocation of distributed energy resources in radial distribution systems. Appl. Energy 2018, 211, 1245–1260. [Google Scholar] [CrossRef]
- Bayat, A.; Bagheri, A. Optimal active and reactive power allocation in distribution networks using a novel heuristic approach. Appl. Energy 2019, 233–234, 71–85. [Google Scholar] [CrossRef]


| S#: | Performance Indices [29,35] | Performance Indices Relationships | Units: | Objective: |
|---|---|---|---|---|
| 1 | Active Power Loss (PLoss) | PLoss=+ | KW | ↓ |
| 2 | Reactive Power Loss (QLoss) | QLoss= min+ | KVAR | ↓ |
| 3 | Active Power Loss Minimization (PLM) | % | ↑ | |
| 4 | Reactive Power Loss Minimization (QLM) | % | ↑ | |
| 5 | DG Penetration by percentage (DGPP) | % | ↑ | |
| 6 | Active Power Capacity Release from Substation (PSSR) | PSSR = PSS − PDG ≥ 0 | KW | ↓ |
| 7 | Reactive Power Capacity Release from Substation (QSSR) | QSSR = QSS − QDG ≥ 0 | KVAR | ↓ |
| S#: | Performance Indices/Ref | Performance Indices Relationships | Units: | Objective: |
|---|---|---|---|---|
| 1 | Cost of active power loss (PLC) [29,35] | M$ | ↓ | |
| 2 | Active power loss saving (PLS) [35] | M$ | ↑ | |
| 3 | Cost of DG for PDG (CPDG) [46] | = a × Where: a = 0, b = 20, c = 0.25 | $/MWh | ↓ |
| 4 | Cost of DG for QDG (CQDG) [46] | = × k Where: | $/MVArh | ↓ |
| 5 | Annual Investment Cost (AIC) [29,35] | M$ | ↓ | |
| 6 | Annual Cost of D-STATCOM (ACD) [37,43] | Where: = 50$/KVAR; B = Rate of return of Assets = 0.1; nDS = 5 Years | M$ | ↓ |
| S# | DG Technology | Type-1 | Type-2 | Type-3 |
|---|---|---|---|---|
| 1 | Type by Power Contribution | Contributes P only | Contributes both P & Q | Contributes Q only |
| 2 | Power Factor (PF) | Unity (1) | Lagging | Zero |
| 3 | Application | Photovoltaic (PV) systems | Gas-Turbine (GT) | Capacitor, D-STATCOM Sync. Condenser, etc. |
| 4 | Capacity/Rating (MVA or MW or MVAR) | 0.001 to 4 | 0.001 to 4 | 0.001 to 4 |
| 5 | Cost of DG Unit (CUc) USD/KVA or KW or KVAR | 5250 [29] 3750 [49] | 1800 [26,29,35] | 50 |
| 6 | Equipment Life Cycle (Years) | 20 | 10 | 5 |
| 7 | Interest Rate | 7% | 7% | 7% |
| S#: | Technical Parameters (TP) | Cost-Economics Parameters (CP) | ||||||
|---|---|---|---|---|---|---|---|---|
| C(#)/S(#) | TDS | P & Q Losses (KW + jKVAR) | PL & QL (Load) (KW + jKVAR) | VSAI_B (P.U) @ Bus Location * | Capacity from SS (KW + jKVAR) | PLC (Million USD$) | PLS/AIC (Million USD$) | CPDG ($/MWh)/CQDG ($/MVAR) |
| C0/S1 | 33-bus | 211 + j 143 | 3715 + j 2300 | 0.0167@30 0.0143@25 0.0130@8 | 3926 + j 2443 | 0.110902 | - | - |
| C0/S2 | 69-bus | 225.01 + j 102.12 | 3802.6 + j 2694 | 0.0877@61 0.0080@21 0.0038@11 | 4027.61 + j 2796.12 | 0.118265 | - | - |
| S#: | (a) Technical Performance Indicators/Parameters (TPI or TP) | ||||||||
| Case(No.)/Scenario (Number) | DG Size (KW) at Bus Location | PLoss (KW) | QLoss (KVAR) | PLM (%) | QLM (%) | DGPP (%) | PSSR (KW) | QSSR (KVAR) | |
| C1/S1 (PF = 1) | DG1: 3335@30 | 95.88 | 72.21 | 54.56 | 49.503 | 76.32 | 475.88 | 2372.21 | |
| C1/S2 (PF = 1) | DG1: 2356@30 | 88.34 | 66.44 | 58.132 | 53.538 | 84.84 | 96.34 | 2366.44 | |
| DG2: 1351@25 | |||||||||
| C1/S3 (PF = 1) | DG1: 1954@30 | 70.78 | 50.06 | 66.455 | 64.993 | 85.985 | 28.78 | 2350.06 | |
| DG2: 802@25 | |||||||||
| DG3: 1001@8 | |||||||||
| S#: | (b) Cost (Economics related) Indicators/Parameters (CPI or CP) | ||||||||
| Case(No.)/Scenario (Number) | DG Size (KW) at Bus Location | PLC (Million USD$) | PLS (Million USD$) | CPDG ($/MWh) | CQDG ($/MVAr-h) | AIC (1) (Million USD$) | AIC (2) (Million USD$) | (ACD) (Million USD$) | |
| C1/S1 (PF = 1) | 3335@30 | 0.050395 | 0.06051 | 66.95 | 0 | 0.8819 | 0.6299 | 0 | |
| C1/S2 (PF = 1) | 2356@30 | 0.046432 | 0.06447 | 74.39 | 0 | 0.9803 | 0.7003 | 0 | |
| 1351@25 | |||||||||
| C1/S3 (PF = 1) | 1954@30 | 0.03720 | 0.0737 | 75.35 | 0 | 0.9936 | 0.7097 | 0 | |
| 802@25 | |||||||||
| 1001@8 | |||||||||
| S#: | (a) Technical Parameters (TP) | |||||||
| Case(No.)/Scenario (Number) | DG Size (KVA)@ Bus Location | PLoss (KW) | QLoss (KVAR) | PLM (%) | QLM (%) | DGPP (%) | PSSR (KW) | QSSR (KVAR) |
| C2/S1 (PF = 0.90 ± 3%) | DG1: 2750@30 | 38.3 | 28.933 | 81.85 | 79.76 | 62.937 | 1278.3 | 1130.233 |
| C2/S2 (PF = 0.90 ± 3%) | DG1: 2357@30 | 32.99 | 25.491 | 84.37 | 82.17 | 66.303 | 1140.69 | 1062.718 |
| DG2: 540@25 | ||||||||
| C2/S3 (PF = 0.90 ± 3%) | DG1: 1957@30 | 18.87 | 13.327 | 91.06 | 90.68 | 73.625 | 838.57 | 911.069 |
| DG2: 500@25 | ||||||||
| DG3: 760@8 | ||||||||
| S#: | (b) Cost (Economics related) Parameters (CP) | |||||||
| Case(No.)/Scenario (Number) | DG Size (KVA) @ Bus Location | PLC (Million USD$) | PLS (Million USD$) | CPDG ($/MWh) | CQDG ($/MVArh) | AIC (1) (Million USD$) | AIC (2) (Million USD$) | (ACD) (Million USD$) |
| C2/S1 (PF = 0.90 ± 3%) | 2750@30 | 0.02013 | 0.09077 | 49.75 | 4.9527 | 0.4969 | 0.4969 | 0 |
| C2/S2 (PF = 0.90 ± 3%) | 2357@30 | 0.01261 | 0.09829 | 52.396 | 5.2141 | 0.5235 | 0.5235 | 0 |
| 540@25 | ||||||||
| C2/S3 (PF = 0.90 ± 3%) | 1957@30 | 0.00992 | 0.1010 | 58.156 | 5.7938 | 0.5813 | 0.5813 | 0 |
| 500@25 | ||||||||
| 760@8 | ||||||||
| S#: | (a) Technical Parameters (TP) | |||||||
| Case(No.)/Scenario (Number) | DG Size (KW)/Bus Location | PLoss (KW) | QLoss (KVAR) | PLM (%) | QLM (%) | DGPP (%) | PSSR (KW) | QSSR (KVAR) |
| C3/S1 (PF = 0.85 ± 3%) | DG1:2708.8@30 | 35.20 | 28.98 | 83.32 | 79.73 | 61.993 | 1447.720 | 902.030 |
| C3/S2 (PF = 0.85 ± 3%) | DG1:1885.8@30 | 27.93 | 24.39 | 86.76 | 82.94 | 69.874 | 1147.712 | 716.587 |
| DG2:1167.4@25 | ||||||||
| C3/S3 (PF = 0.85 ± 3%) | DG1:1422.1@30 | 13.85 | 11.50 | 93.44 | 91.96 | 77.834 | 838.085 | 519.965 |
| DG2:1045.4@25 | ||||||||
| DG3:933.4@8 | ||||||||
| S#: | (b) Cost (Economics related) Parameters (CP) | |||||||
| Case(No.)/Scenario (Number) | DG Size (KW)/Bus Location | PLC (Million USD$) | PLS (Million USD$) | CPDG ($/MWh) | CQDG ($/MVArh) | AIC (1) (Million USD$) | AIC (2) (Million USD$) | (ACD) (Million USD$) |
| C3/S1 (PF = 0.85 ± 3%) | 2708.8@30 | 0.01850 | 0.09240 | 46.298 | 7.2777 | 0.4895 | 0.4895 | 0 |
| C3/S2 (PF = 0.85 ± 3%) | 1885.8@30 | 0.01468 | 0.09622 | 52.1529 | 8.2030 | 0.5517 | 0.5517 | 0 |
| 1167.4@25 | ||||||||
| C3/S3 (PF = 0.85 ± 3%) | 1422.1@30 | 0.00728 | 0.10362 | 58.0651 | 9.1375 | 0.6145 | 0.6145 | 0 |
| 1045.4@25 | ||||||||
| 933.4@8 | ||||||||
| S#: | (a) Technical Parameters (TP) | |||||||
| Case(No.)/Scenario (Number) | DG Size | PLoss | QLoss | PLM | QLM | DGPP | PSSR | QSSR |
| KW/KVAr @ Bus Location | (KW) | (KVAR) | (%) | (%) | (%) | (KW) | (KVAR) | |
| C4/S1 (CPF = 0.90 ± 3%) | DG1:2475@30 | 39 | 29.382 | 81.52 | 79.45 | 62.94 | 1279 | 1130.382 |
| DSt1:1199@30 | ||||||||
| C4/S2 (CPF = 0.90 ± 3%) | DG1:2121@30 | 34 | 26.807 | 83.89 | 81.25 | 66.305 | 1142 | 1062.81 |
| DSt1:1028@30 | ||||||||
| DG2:486@25 | ||||||||
| DSt2:236@25 | ||||||||
| C4/S3 (CPF = 0.90 ± 3%) | DG1:1761@30 | 20.8 | 13.761 | 90.14 | 90.38 | 73.63 | 840.8 | 911.461 |
| DSt1:853@30 | ||||||||
| DG2:450@25 | ||||||||
| DSt2:218@25 | ||||||||
| DG3:684@8 | ||||||||
| DSt3:331.3@8 | ||||||||
| S#: | (b) Cost (Economics related) Parameters (CP) | |||||||
| Case(No.)/Scenario (Number) | DG/DSt Size KW/KVAr | PLC | PLS | CPDG ($/MWh) | CQDG ($/MVArh) | AIC (1) | AIC (2) | (ACD) |
| @ Bus Location | (Million USD$) | (Million USD$) | (Million USD$) | (Million USD$) | (Million USD$) | |||
| C4/S1 (CPF = 0.85 ± 3%) | 2475 + j1199 @ 30 | 0.0205 | 0.0904 | 49.749 | 4.9553 | 0.6545 | 0.4675 | 0.01581 |
| C4/S2 (CPF = 0.85 ± 3%) | 2121 + j1028 @ 30 | 0.0179 | 0.09303 | 52.39 | 5.227 | 0.6894 | 0.4925 | 0.01666 |
| 486 + j236 @ 25 | ||||||||
| C4/S3 (CPF = 0.85 ± 3%) | 1761 + j853 @ 30 | 0.01093 | 0.09997 | 58.1557 | 5.7941 | 0.7656 | 0.5467 | 0.01849 |
| 450 + j218 @25 | ||||||||
| 684 + j331.3 @8 | ||||||||
| S#: | (a) Technical Parameters (TP) | |||||||||||||
| Case(No.)/Scenario (Number) | DG Size KW/KVAr @ Bus Location | PLoss (KW) | QLoss (KVAR) | PLM (%) | QLM (%) | DGPP (%) | PSSR (KW) | QSSR (KVAR) | ||||||
| C5/S1 | DG1:2302@30 DSt1:1426.5@30 | 36 | 29.7 | 82.94 | 79.23 | 61.97 | 1449.03 | 903.2 | ||||||
| C5/S2 | DG1:1604@30 DSt1:993.8@30 | 29.3 | 25.1 | 86.11 | 82.45 | 69.90 | 1147.8 | 716.2 | ||||||
| DG2:992.5@25 DSt2:615.1@25 | ||||||||||||||
| C5/S3 | DG1:1210@30 DSt1:750@30 | 16.3 | 12.6 | 92.27 | 91.19 | 77.89 | 838.06 | 519.48 | ||||||
| DG2:889.5@25 DSt2:551.2@25 | ||||||||||||||
| DG3:793.74@8 DSt3:491.92@8 | ||||||||||||||
| S#: | (b) Cost (Economics related) Parameters (CP) | |||||||||||||
| Case(No.)/Scenario (Number) | DG/DSt Size KW/KVAr @ Bus Location | PLC (Million USD$) | PLS (Million USD$) | CPDG ($/MWh) | CQDG ($/MVArh) | AIC (1) (Million USD$) | AIC (2) (Million USD$) | (ACD) (Million USD$) | ||||||
| C5/S1 | 2302 + j1426.5@30 | 0.01892 | 0.09198 | 46.29 | 7.2694 | 0.6088 | 0.4348 | 0.01881 | ||||||
| C5/S2 | 1604 + j993.8@30 | 0.01540 | 0.09550 | 52.156 | 8.2219 | 0.6867 | 0.4905 | 0.02124 | ||||||
| 992.5 + j615.1@25 | ||||||||||||||
| C5/S3 | 1210 + j750@30 | 0.00857 | 0.10233 | 58.074 | 9.176 | 0.76514 | 0.54653 | 0.02368 | ||||||
| 889.5 + j551.2@25 | ||||||||||||||
| 793.74 + j492@8 | ||||||||||||||
| S#: | (a) Technical Parameters (TP) | |||||||
| Case(No.)/Scenario (Number) | DG Size (KVA)/Bus Location | PLoss (KW) | QLoss (KVAR) | PLM (%) | QLM (%) | DGPP (%) | PSSR (KW) | QSSR (KVAR) |
| C6/S1 (PF = 0.90 ± 3%) | DG1:2304.4@30 | 22.2594 | 13.189 | 90.107 | 87.08 | 73.17 | 628.283 | 888.2163 |
| DG2:333.09@25 | ||||||||
| DG3:772.04@8 | ||||||||
| C6/S2 (PF=0.82 ± 3%) | DG1:2444.9@30 | 12.165 | 6.5053 | 95.107 | 94.63 | 75.88 | 814.3074 | 325.016 |
| DG2:468.67@25 | ||||||||
| DG3:622.28@8 | ||||||||
| S#: | (b) Cost (Economics related) Parameters (CP) | |||||||
| Case(No.)/Scenario (Number) | DG Size (KVA)/ Bus Location | PLC (Million USD$) | PLS (Million USD$) | CPDG ($/MWh) | CQDG ($/MVArh) | AIC (Million USD$) | Others: PF (Lag) Variation: ± 3% | |
| C6/S1 (PF = 0.90 ± 3%) | 2304.4@30 | 0.0117 | 0.10657 | 62.1876 | 5.5527 | 0.616 | 0.9 0.9195 0.927 | @ Bus61 @ Bus21 @ Bus11 |
| 333.09@25 | ||||||||
| 772.04@8 | ||||||||
| C6/S2 (PF = 0.82 ± 3%) | 2444.9@30 | 0.006394 | 0.111871 | 58.709 | 10.829 | 0.6389 | 0.8186 0.8445 0.8446 | @ Bus61 @ Bus21 @ Bus11 |
| 468.67@25 | ||||||||
| 622.28@8 | ||||||||
| Performance Evaluation Indicators (PEI) | [20] | [21] | [23] | [24] | [52] | [53] | [P] |
|---|---|---|---|---|---|---|---|
| DG Size (KW) @ DG Site (Bus) | 802@13 1090@24 1054@30 | 798@14 1099@24 1050@30 | 770@14 1090@24 1070@30 | 755@14 1073@24 1068@30 | 802@13 1091@24 1053@30 | 792@13 1068@24 1027@30 | 1001@8 802@25 1954@30 |
| VSI@ Bus -Min | - | - | - | - | - | - | 0.0110@15 |
| U_B@ Bus (P.U) | - | - | - | - | - | - | 0.9771@12 |
| PLoss (KW) | 72.784 | 72.787 | 72.790 | 72.810 | 72.790 | 72.84 | 70.78 |
| PLM (%) | 65.51 | 65.504 | 65.502 | 65.49 | 65.502 | 65.48 | 66.455 |
| QLoss (KVAR) | - | - | - | - | - | - | 50.06 |
| QLM (%) | - | - | - | - | - | - | 64.993 |
| DG Capacity (KVA) | 2946 | 2947 | 2930 | 2896 | 2946 | 2887 | 3757 |
| DGPP (%) | 67.43 | 67.48 | 67.06 | 66.28 | 67.43 | 67.074 | 85.985 |
| RSS (KW + j KVAR) | - | - | - | - | - | - | 28.78 + j 2350.06 |
| PLC (Million-$) | 0.03826 | 0.038257 | 0.03826 | 0.3827 | 0.03826 | 0.038284 | 0.03720 |
| PLS (Million-$) | 0.07265 | 0.072645 | 0.07264 | 0.072632 | 0.07264 | 0.07261 | 0.07370 |
| CPDG ($/MWh) | - | - | - | - | - | - | 75.35 |
| CQDG($/MVarh) | - | - | - | - | - | - | 0 |
| AIC(1)(Million-$) | - | - | - | - | - | - | 0.9936 |
| AIC(2)(Million-$) | - | - | - | - | - | - | 0.7097 |
| Performance Evaluation Indicators (PEIs) | [48] | [35] | [P] | [35] | [35] | [P] |
|---|---|---|---|---|---|---|
| DG Size (KVA) @DG Site (Bus) | 2074.56@6 615.25@15 | 971@15 1783@30 | 540@25 2357@30 | 894.6@15 1386@30 822.6@25 | 832.6@15 1602@30 745.1@7 | 1957@30 500 @25 760@8 |
| VSI@ Bus -Min | - | 0.9110@33 | 0.0110@15 | 0.9220@33 | 0.9170@33 | 0.0110@15 |
| U_B@ Bus (P.U) | 0.97567 | 0.9770@33 | 0.9773@13 | 0.9800@33 | 0.9782@33 | 0.9857@14 |
| P_L (KW) | 65.8435 | 54.7 | 32.99 | 33.20 | 30.85 | 18.870 |
| PLM (%) | 68.8 | 77 | 84.37 | 86 | 87 | 91.06 |
| Q_L (KVAR) | 51.94 | 37.5 | 25.491 | 23.94 | 23.29 | 13.327 |
| QLM (%) | 63.7 | 77.25 | 81.82 | 85.5 | 85.9 | 90.68 |
| DG Capacity (KVA) | 2689.81 | 2754 | 2897 | 3103.2 | 3179.7 | 3217 |
| PDG (%) | 61.56 | 63 | 66.303 | 71 | 72.8 | 73.63 |
| RSS (KW + j KVAR) | 1347.9 + j 836.34 | 1680 + j 1498 | 1140.69 + j 1062.718 | 955.32 + j 971.286 | 884.12 + j 894.48 | 838.570 + j 911.069 |
| PLC (Million-$) | 0.03461 | 0.02875 | 0.01261 | 0.01746 | 0.0162 | 0.00992 |
| PLS (Million-$) | 0.07629 | 0.0822 | 0.09829 | 0.09345 | 0.0947 | 0.1010 |
| CPDG ($/MWh) | - | - | 52.396 | - | - | 58.156 |
| CQDG ($/MVArh) | - | - | 5.2141 | - | - | 5.7938 |
| AIC (Million-$) | - | 0.4976 | 0.5235 | 0.5607 | 0.5750 | 0.5813 |
| Performance Evaluation Indicators (PEIs) | [35] | [35] | [22] | [19] | [24] | [P] |
|---|---|---|---|---|---|---|
| DG Size (KVA) @DG Site (Bus) | 877@15 1310@30 725@25 | 828.3@15 1644@30 727.8@7 | 1382@6 550@18 1062@30 | 853@13 900@24 899@30 | 1014@12 960@25 1363@30 | 1422.1@30 1045.4 @25 933.4@8 |
| VSI@ Bus-Min | 0.9121@33 | 0.9221@33 | - | - | 0.0110@15 | |
| U_B@ Bus (P.U) | 0.9777@33 | 0.9805@33 | - | - | 0.9880@15 | |
| P_L (KW) | 28.8 | 26.7 | 26.72 | 19.57 | 15.91 | 13.85 |
| PLM (%) | 87.9 | 88.7 | 87.34 | 90.725 | 92.46 | 94.44 |
| Q_L (KVAR) | 17.81 | 16.75 | - | - | 11.50 | |
| QLM (%) | 89.2 | 89.8 | - | - | 91.96 | |
| DG Capacity (KVA) | 2912 | 3200 | 2994 | 2652 | 2880 | 3400.9 |
| PDG (%) | 67 | 73.24 | 68.523 | 60.70 | 65.91 | 77.834 |
| RSS Margin (KW + j KVAR) | 1268.6 + j 783.82 | 1021.7 + j 631.05 | - | - | - | 838.085 + j 519.965 |
| PLC (Million-$) | 0.01512 | 0.0140 | - | - | - | 0.00728 |
| PLS (Million-$) | 0.09600 | 0.0969 | - | - | - | 0.10362 |
| CPDG ($/MWh) | - | - | - | - | - | 58.0651 |
| CQDG ($/MVArh) | - | - | - | - | - | 9.1375 |
| AIC (Million-$) | 0.526 | 0.5782 | - | - | - | 0.6145 |
| Performance Evaluation Indicators (PEIs) | [39] | [39] | [40] | [41] | [P] (C4/S3) | [P] (C5/S3) |
|---|---|---|---|---|---|---|
| DG (KW) @ Bus # DS (KVAR) @ Bus # | DG 1309@7 DSt 720@23 | DG 1316@9 DSt 740@10 | 750@14 420@14 1100@24 460@24 1000@8 970@8 | 850@12 400@12 750@25 350@25 860@8 850@8 | 1761@30 853@30 450@25 218@25 684@8 331.3@8 | 1210@30 750@30 889.5@25 551.2@25 793.74@8 491.92@8 |
| VSI@ Bus -Min | - | - | 0.9910 | 0.9376 | 0.0110@15 | 0.0110@15 |
| U_B@ Bus (P.U) | - | - | 0.9584 | 0.9862 | 0.9856@14 | 0.9878@15 |
| P_L (KW) | 69.15 | 48.73 | 12 | 15.07 | 20.8 | 16.3 |
| PLM (%) | 67.23 | 76.9 | 94.31 | 92.56 | 90.14 | 92.275 |
| Q_L (KVAR) | - | - | - | - | 13.761 | 12.6 |
| QLM (%) | - | - | - | - | 90.43 | 91.19 |
| DG Capacity (KW) | 1309 | 1316 | 2850 | 2460 | 2895 | 2893.24 |
| DS Capacity (KW) | 720 | 740 | 1850 | 1600 | 1402.3 | 1793.12 |
| PDG (%) | 34.19 | 34.56 | 77.76 | 67.2 | 73.63 | 77.91 |
| RSS (KW + j KVAR) | - | - | - | - | 840.8+j 911.461 | 838.06 + j 519.48 |
| PLC (Million-$) | - | - | - | - | 0.01093 | 0.00857 |
| PLS (Million-$) | - | - | - | - | 0.09997 | 0.10233 |
| CPDG ($/MWh) | - | - | - | - | 58.1557 | 58.074 |
| CQDG ($/MVArh) | - | - | - | - | 5.7941 | 9.176 |
| AIC (1) (Million-$) | - | - | - | - | 0.7656 | 0.76514 |
| AIC (2) (Million-$) | - | - | - | - | 0.5467 | 0.54653 |
| ACD (Million-$) | - | - | - | - | 0.01849 | 0.02368 |
| Performance Evaluation Indicators (PEIs) | [51] | [35] | [35] | [35] | [P] |
|---|---|---|---|---|---|
| DG Size (KVA) @DG Site (Bus) | 2220@61 | 2578@61 | 2326@61 557@21 | 2284@61 442.9@21 467.5@12 | 2304.4@61 333.09@21 772.04@11 |
| VSAI @ Bus -Min | 0.86585@26 | 0.9604@21 | 0.9770@12 | 0.9900@46 | 0.0010@59 |
| U_MA @ Bus (P.U) | 0.97273@26 | 0.9899@21 | 0.9940@12 | 0.9973@46 | 0.9965@46 |
| P_L (KW) | 27.9 | 59.1 | 40.4 | 22.35 | 22.2594 |
| PLM (%) | 87.6 | 75.84 | 83.5 | 90.06 | 90.107 |
| Q_L (KVAR) | 16.4245 | 33.4 | 27.51 | 13.30 | 13.1890 |
| QLM (%) | 83.93 | 73.7 | 78.2 | 86.97 | 87.08 |
| DG Capacity (KVA) | 2220 | 2578 | 2883 | 3194.4 | 3409.53 |
| PDG (%) | 47.64 | 55.35 | 61.90 | 68.6 | 73.17 |
| RSS (KW + j KVAR) | 1831.29 + j 1742.349 | 1884 + j 2012 | 1616 + j 1873 | 1413 + j 1204 | 625.283 + j 888.2163 |
| PLC (Million-$) | 0.014664 | 0.0311 | 0.02122 | 0.01175 | 0.01170 |
| PLS (Million-$) | 0.103596 | 0.0872 | 0.09804 | 0.10651 | 0.10656 |
| CPDG ($/MWh) | 40.21 | - | - | - | 62.1876 |
| CQDG ($/MVArh) | 0.39982 | - | - | - | 5.5527 |
| AIC (Million-$) | - | 0.4659 | 0.521 | 0.5853 | 0.6160 |
| Performance Evaluation Indicators (PEIs) | [29] | [20] | [21] | [23] | [35] | [P] |
|---|---|---|---|---|---|---|
| DG Size (KVA) @DG Site (Bus) | 2328@61 400@22 | 2056@61 452@18 614@11 | 2067@61 456@18 611@11 | 2060@61 460@21 600@11 | 2444@61 440@21 512@12 | 2444.92@61 468.67@21 622.28@11 |
| VSAI@ Bus-Min | 0.9620@27 | - | - | 0.9922@46 | 0.0010@59 | |
| U_MA@ Bus (P.U) | 0.9903@65 | - | - | 0.9980@46 | 0.99763@46 | |
| P_L (KW) | 25.367 | 4.26 | 4.27 | 4.28 | 12.26 | 12.1650 |
| PLM (%) | 90.27 | 98.11 | 98.10 | 98.09 | 95 | 95.107 |
| Q_L (KVAR) | 17.2607 | - | - | 6.942 | 6.5053 | |
| QLM (%) | - | - | - | 94.5 | 94.63 | |
| DG Capacity (KVA) | 2728 | 3122 | 3134 | 3120 | 3396 | 3536 |
| PDG (%) | 58.55 | 67 | 67.26 | 66.96 | 72.88 | 75.88 |
| RSS (KW + j KVAR) | 1591.007 + j 1149.851 | - | - | - | 1030.14 + j 757.192 | 814.3074 + j 325.016 |
| PLC (Million-$) | 0.013333 | - | - | - | 0.006442 | 0.006394 |
| PLS (Million-$) | 0.104875 | - | - | - | 0.111839 | 0.111871 |
| CPDG ($/MWh) | - | - | - | - | - | 58.709 |
| CQDG ($/MVArh) | - | - | - | - | - | 10.829 |
| AIC (Million-$) | 0.493 | - | - | - | 0.5853 | 0.6389 |
© 2019 by the authors. Licensee MDPI, Basel, Switzerland. This article is an open access article distributed under the terms and conditions of the Creative Commons Attribution (CC BY) license (http://creativecommons.org/licenses/by/4.0/).
Share and Cite
Kazmi, S.A.A.; Ahmad, H.W.; Shin, D.R. A New Improved Voltage Stability Assessment Index-centered Integrated Planning Approach for Multiple Asset Placement in Mesh Distribution Systems. Energies 2019, 12, 3163. https://doi.org/10.3390/en12163163
Kazmi SAA, Ahmad HW, Shin DR. A New Improved Voltage Stability Assessment Index-centered Integrated Planning Approach for Multiple Asset Placement in Mesh Distribution Systems. Energies. 2019; 12(16):3163. https://doi.org/10.3390/en12163163
Chicago/Turabian StyleKazmi, Syed Ali Abbas, Hafiz Waleed Ahmad, and Dong Ryeol Shin. 2019. "A New Improved Voltage Stability Assessment Index-centered Integrated Planning Approach for Multiple Asset Placement in Mesh Distribution Systems" Energies 12, no. 16: 3163. https://doi.org/10.3390/en12163163
APA StyleKazmi, S. A. A., Ahmad, H. W., & Shin, D. R. (2019). A New Improved Voltage Stability Assessment Index-centered Integrated Planning Approach for Multiple Asset Placement in Mesh Distribution Systems. Energies, 12(16), 3163. https://doi.org/10.3390/en12163163