1. Introduction
The production of electric energy with renewable energy sources (RES) and the electrification of energy use are crucial for energy transition, which is the ongoing process to reduce the use of fossil fuels with the decarbonization, decentralization, and digitalization of the energy sectors. In this context, the European Union (EU) launched an ambitious plan to cut emissions in the atmosphere by harvesting the energy from wind and solar and fostering a profound transformation of heating and transportation sectors [
1].
From the power system perspective, the non-programmability of energy production (i.e., mostly based on intermittent sources) is making it tough to comply with the required adequacy and security levels. Furthermore, since a significant amount of renewable energy currently comes from small to medium-size power plants connected to the distribution system (e.g., photovoltaic power plants), the energy transition is profoundly impacting the distribution system. The high share of distributed generation (DG) is already causing temporary voltage regulation and power congestion problems in distribution networks that are destined to become more frequent with the progress of the energy transition. The active management (AM) of distribution networks allows fixing such operational issues with the use of flexibility offered by generation and consumption, that is referred to as no-network solutions in opposition to the traditional paradigm of network solutions. As a consequence, no-network options have to be included in distribution planning as a new development option [
2,
3,
4]. The usage of flexibility can increase the hosting capacity of the network and, as a consequence, the deferment of infrastructural investments. To foster the use of flexibility, the EU Member States now have to allow the distribution system operators (DSOs) to procure flexibility products with transparent, non-discriminatory, and market-based procedures for the operation and development of the distribution system [
5]. Because of the expected more extensive exploitation of flexibility for the operation of the distribution network, DSO and transmission system operators (TSO) will have to cooperate, by exchanging all necessary information to ensure the use of flexibility, guarantee an efficient operation of the whole system, and facilitate market development [
6]. Indeed, the “local” flexibility, offered by the distributed energy resources (DERs) for the operation of the distribution system, might be useful also for “system” services, needed by the TSO for guaranteeing safe and secure operation of the whole power system. It is clear that DSOs cannot completely rely on the flexibility in their networks, and the level of uncertainty might be considerably high.
Battery energy storage systems (BESS) are a technical choice to increase flexibility and reduce the level of uncertainty. They can be locally employed for RES integration, load peak flattening, voltage regulation, efficiency improvement, solving power congestions, etc., BESS can offer frequency regulation services that are crucial with the progressive drop of the system inertia consequent to the diffusion of non-rotating generators or power electronics interfaced generators. The reduction of the system inertia may cause critical frequency deviations even during small active power imbalances [
7].
BESS can foster the market of flexibility products in the early stage of implementation. In fact, pioneering projects implementing flexibility markets involving both TSOs and DSOs showed that the sourcing of flexibility is a critical element, mostly at the early phases of the market development, when aspects like flexibility product cost, provider participation, and availability of flexibility products represent a potential risk for the distribution network management. This uncertainty could be reduced by BESS that represent an additional resource when the number of available RES is too low to ensure effective competition in the area where suitable facilities for the provision of the services are located, avoiding the increase of the costs.
Moreover, since also TSOs are procuring the flexibility in the market, in the paper, it is proposed a decision-making process that allows the evaluation of the share of flexibility to be reserved to each player, enabling a stronger coordination between local and system objectives and needs. The BESS cost is obviously a crucial element of the decision-making process that has been considered in the paper. In fact, despite BESS having a huge cost-reduction potential, BESS cost is still a feature that impacts on the success of business models depending on the regulatory framework. In [
8], the authors proposed a multi-objective (MO) approach for simultaneously optimizing the size, the position, and the operation profile of BESS called to offer services to the DSOs, without monetizing the benefits that are not naturally expressed with currency (e.g., improvement of voltage profile or benefits related to the environmental protection). That paper considered the point of view of the DSOs that, under specific conditions, can be allowed to own and manage BESS. This paper makes another step forward, combining the needs of BESS owners and DSOs. Taking into account the advocated cooperation between TSO and DSO, an instrument is proposed that allows the evaluation of the availability of the flexibility product for both the systems’ operators, without disregarding the BESS owner point of view. The BESS owners aim at increasing their incomes from arbitrage practice and from the provision of ancillary services to both the system operators (i.e., DSO and TSO), while the DSO aims at reducing the residual risk of technical constraints violation by promoting the use of flexibility products offered by the BESS owners. In particular, for considering both the interests, the capacity and the power of the BESS are shared between the percentage dedicated exclusively to support the DSO operation and the remaining quote available for arbitrage or other services. The specific service of frequency regulation support offered by BESS to the TSO and the relevant economic benefits for the BESS owners are explicitly considered in the proposed optimization.
The paper is organized as follows. In
Section 2, the proposed methodology is described underlying the novelties and the improvements in respect to the one proposed in [
8]. In
Section 3, the approach is validated and discussed through a case study that applies the methodology to a real Italian distribution network. Finally, in
Section 4, some concluding remarks are presented.
2. Multi-Objective Optimization for Optimal Exploitation of BESS
A large number of papers have been published on the use of BESS in power distribution systems, analyzing different models and methods to enhance the optimal network planning [
9,
10,
11]. Studies that include BESS (as well as demand response actions, characterized by possible recover of the curtailed energy) are more complicated due to time intercorrelations, since the BESS energy scheduling in one hour is subject to the charging/discharging cycle implemented in the previous hours [
12]. Consequently, the decision-making problem may become complicated to be solved because planning alternatives can excessively grow in number. Traditional numerical methods like non-linear programming, dynamic programming, and mixed-integer linear programming have shortcomings if applied on large and complex distribution systems. On the contrary, meta-heuristic algorithms, like particle swarm (PS), Tabu search (TS), evolutionary algorithm (EA), and genetic algorithm (GA), can provide near-optimal solutions for complex, large-scale planning problems, like the one faced in this paper [
9]. In [
13,
14,
15], the PS optimization is used for the optimal allocation of BESS in the distribution system. In [
16], the use of an EA for determining the capacity of BESS in an islanded microgrid, considering both steady-state and dynamic constraints, is proposed. The problem is formulated as an MO optimization that involves the dynamic equations of the power system, to improve reliability, stabilizing transients and reducing load shedding. A significant number of papers used the GA [
17] or a combination of GA with other optimization techniques like PS, linear programming in [
18] or quadratic programming in [
19].
It is worth noting that, despite the high interest related to the cooperation between DSO and TSO in the provision of the ancillary services, in literature, few publications have addressed the optimal size and location of BESS for the assessment of flexibility products to be shared between DSO and TSO. Moreover, most of them analyze the voltage support and peak shaving, while very few analyze the possible frequency service [
20]. Regarding frequency support, such papers are related to high voltage (HV) networks, islanded networks (microgrid or island) or examine the aggregation of DERs (usually represented as virtual power plant, VPP) [
21,
22,
23]. For instance, in [
23] clusters of electric vehicles (EVs) are grouped together as a VPP to provide fast frequency reserve service to the transmission system through the DSO whilst considering network unbalance. Most of the papers on optimal location and size analyze a specific voltage level or the two systems independently without considering the possible services for the other level and a wide range of contingencies (or the worst-case scenario) are considered [
24].
Compared to the literature, the proposed paper presents an advancement for several reasons. First of all, moving in the direction of the cooperation between DSO and TSO, different grid services (i.e., arbitrage, frequency containment reserve (FCR), and automatic frequency restoration reserve (aFRR)), that medium voltage (MV) BESS can sell through the services market are considered. Moreover, the planning strategies are not developed taking into account only critical days but typical daily profiles, indicative of the seasonal behavior of loads and generators during a year, are used. Such choice is in agreement with the recommendations of the main international scientific organizations (CIGRE, CIRED, IEEE, etc.), that recognize the unsuitability of the traditional deterministic distribution planning approaches, based on the aim of fulfilling the extremely rare operating conditions, which could lead to an unsustainable amount of network investments. In addition, the methodology proposed is able to deal with all the uncertainties related to RES and to consider distinctly the risk associated to any planning decision.
Generally, the optimal BESS exploitation requires to simultaneously take account of multiple goals. Thus, another critical aspect for the optimal siting and sizing of BESS in a distribution network is related to the definition of a unique financial objective function, because some benefits are not directly monetizable without adopting subjective assumptions that can produce biased results. In this context, MO programming permits a more transparent and impartial decision process and can be used for financial purposes by decision-making teams of companies or for socio-economic studies by regulators for defining fair rules [
16,
17,
19]. Evolutionary algorithms are well suited to solve optimization problems that are characterized by many contrasting objectives. Differently by other more conventional optimization methods, like the weighted linear combination or the ε-constraint, that need to perform several separate runs, the evolutionary algorithms can simultaneously deal with many candidates that form sets of solutions (named population) and find the optimal ones belonging to the Pareto set by performing the algorithm one time only. Furthermore, the Pareto front shape and its continuity have a small impact on the evolutionary algorithms results [
25].
For these reasons, this paper implements a full MO optimization procedure based on a real coded non-dominated sorting genetic algorithm-II (NSGA-II) algorithm. This methodology has been chosen among meta-heuristic algorithms because it is recognized to be an efficient and robust technique, capable of generating good trade-off solutions for a wide range of optimization problems [
26]. The real codification has been implemented by the authors in [
8] to better deal with the continuous nature of some variables in optimization problems that include BESS exploitation. The main novelties of this paper, compared to [
8], are the definition of new objective functions (especially the risk of technical constraint violations in a given electric distribution network) and the relative adaptations of the solution coding. Indeed, in [
8], only the DSO point of view was considered, and the MO approach was used to avoid the a priori monetization of the benefits and perform the cost-benefit analyses of BESS allocation plans proposed by the DSO. Instead, in this paper, two stakeholders have been considered, the DSO and the BESS private owners, in order to find trade-off solutions between their contrasting goals.
2.1. Fitness Function Assessment in the NSGA-II
A typical genetic algorithm simulates the mechanism of the natural evolution, by applying systematically the three genetic operators of selection (that gives more chance of reproduction to the better individuals), crossover (that generates offspring solutions by mixing the genetic characteristics of parents), and mutation (that implements random alterations of the genetic characteristics) to evolve the population towards the global optimum. Often, elitism (i.e., only the better solutions are considered in the evolution process) is implemented in the formation of the new population in order to increase the effectiveness of the optimization procedure and speed up the convergence of the algorithm.
Taking account of these aspects, the mechanism implemented for comparing two solutions and identifying the better one is crucial for any evolutionary algorithm. The classification procedure used by the NSGA-II algorithm is based on the definition of two attributes associated with each individual: the
non-domination rank and the
crowding distance. The
non-domination rank organizes the candidates into subsets of individuals non-dominated by any other in the same subset (fronts of non-dominance). Therefore, the first non-dominated front is formed by all the individuals of the Pareto set for which no other solutions are either equal to or better than them on all of the search objectives, and it is marked with the lowest (best) rank. The other fronts are sorted depending on the number of subsets from which they are dominated: e.g., the second front is dominated only by the first and dominates all the remaining fronts, the third front is dominated only by the first two and so on. In order to guarantee the diversity in each front, a second attribute is introduced, the
crowding distance (CD), based on the cardinality of the solution sets and their distance to the solution boundaries. It is calculated by summing the absolute normalized differences in the function values of two adjacent solutions; the sum is extended to each objective function (
OF), as indicated in (1):
where
NOF is the number of
OFs and
is the
kth OF value of the
ith generic individual. The higher the
CD of a solution, the less crowded the corresponding area of the front and, hence, the finer its fitness value.
The application of these two attributes allows finding a better solution in a pairwise comparison, assuring the correct implementation of selection operator and elitism in the evolution of the population.
2.2. Solution Coding for the BESS Location Problem
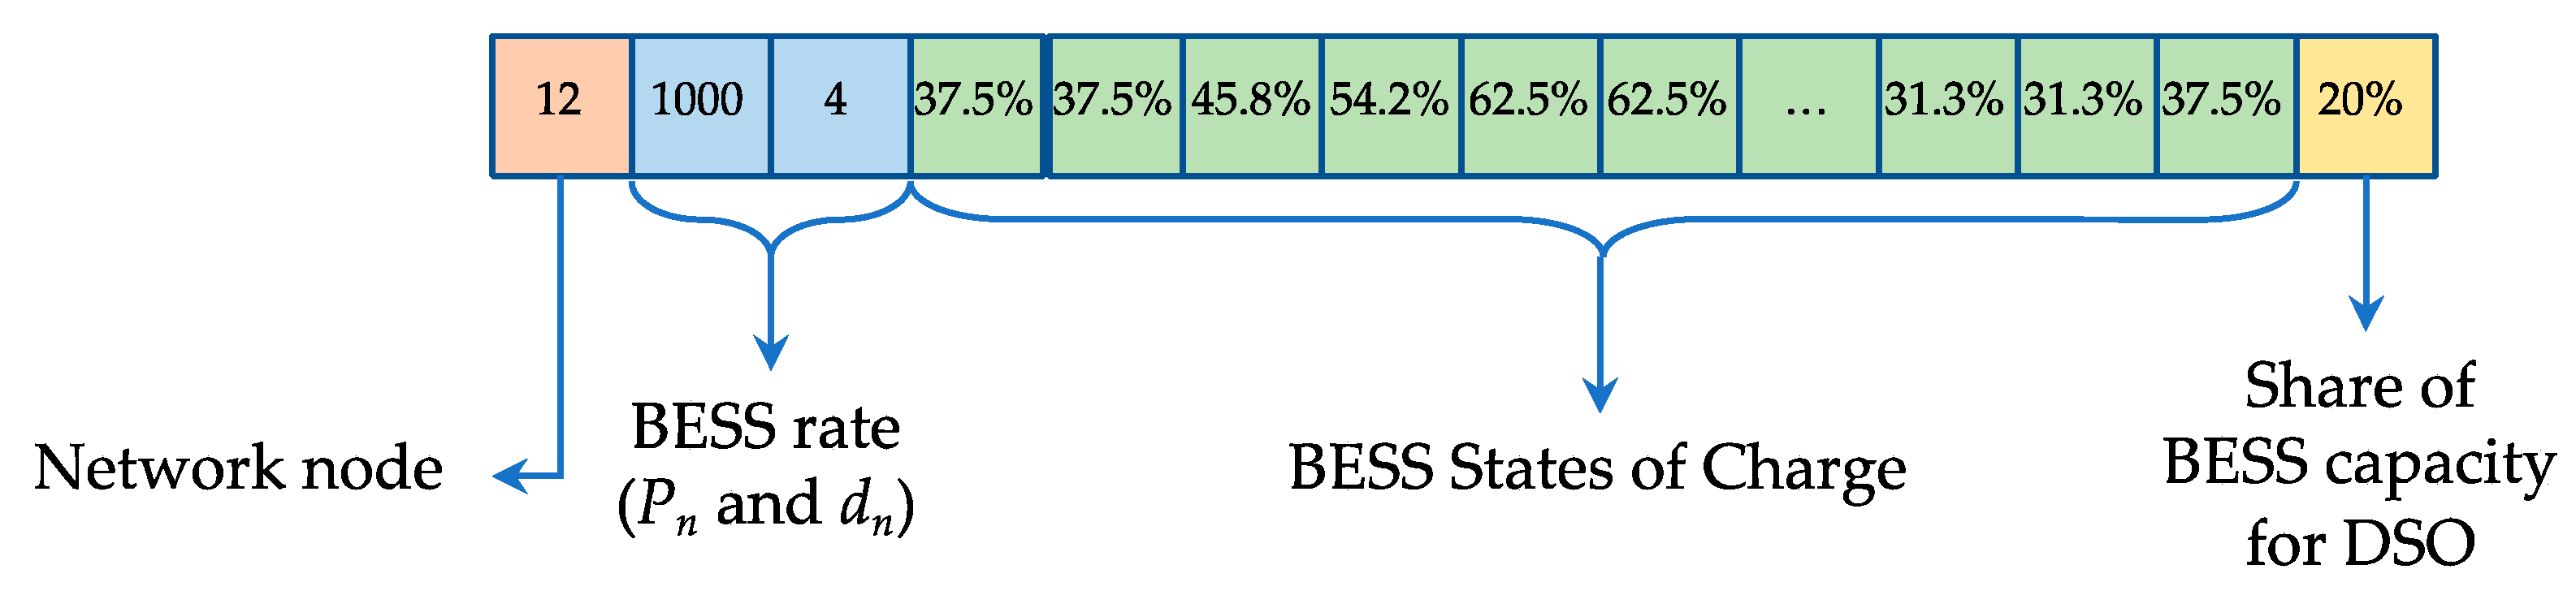
The traditional binary coding makes the GAs particularly suitable for solving sizing and siting problems of different resources, like (for power distribution systems) capacitors, distributed generators, or BESS. However, in the case of storage devices, the effectiveness of their support to network operation depends also on their hourly state of charge (SoC). Therefore, the solution coding has to represent the BESS daily scheduling as well, so that the NSGA-II can optimize the design and normal operation of storage devices simultaneously, finding full compromise solutions among different point of views. Furthermore, as it is explained in the next paragraph, part of the BESS capacity is reserved to DSO for local distribution network support. Consequently, also this capacity share has to be included among the chromosome information of the generic solution. An example of the solution coding referred to a single BESS is reported in
Figure 1. The whole chromosome of a generic individual is obtained by repeating this schema for a prefixed maximum number of BESS (
NBESS).
In summary, the genetic parameters optimized simultaneously by the NSGA-II are:
It corresponds to any MV network node, excluding the primary substation busbars because in those locations the BESS may affect only the loading of the HV/MV transformers, but it cannot provide support to local network contingencies. For real network studies, it is easy to exclude also additional MV nodes due to any kind of constraint the DSO planner wants to consider. The value of the specific gene is an integer number in the interval [1, Nnode], where Nnode is the total number of available MV nodes.
- 2.
BESS rate
It is defined by two genes: one for the nominal power (Pn) and one for the nominal duration (dn), so identifying by their product the nominal BESS capacity (Cn = Pn · dn). Nominal power and duration are the integer number within a minimum and maximum values ([Pn_min, Pn_max] and [dn_min, dn_max]), given among the input data of the problem. Generally, dn_min is the elementary time step used to represent the load/generation daily patterns (1 h), Pn_min is the minimum power required by the national regulation to participate in the ancillary services market, and Pn_max is the maximum power permitted for the direct installation of BESS (or any other generation unit) on the MV electric distribution system.
- 3.
BESS daily energy schedule
It is represented by the sequence of the State of Charge (SoC) in each interval of the day. By using a time step (Δ
t) of 1 h, there are 24 genes for each typical profile used to represent the yearly customer behavior. Therefore, if more than one typical day is used (e.g., two semester profiles, four seasonal profiles, or multiple profiles for seasons, working days and weekends), the sequence of 24 genes is repeated accordingly. The SoC values are real numbers within the interval [0%, 100%]. However, these percentages are not related to
Cn, but to the remaining capacity curtailed of the share for DSO (
Cown_TSO in
Figure 2). This choice allows preserving the soundness of the chromosome representation for the offspring solutions, built with the application of the genetic crossover and mutation operators. Indeed, by so doing, the new sequences of SoC remain always within the operational limits, avoiding overlapping with the semi-bands of capacity reserved to DSO.
- 4.
Share of BESS capacity for DSO
It establishes the rate of the “virtual storage” for DSO. From this value (C
DSO), expressed as a percentage of C
n, the upper and lower semi-bands of capacity are calculated (C
min_DSO = C
DSO/2; C
max_DSO = C
n − C
DSO/2) and always reserved to DSO in order to guarantee in any moment the availability of the virtual storage capacity in case of contingencies that could bring the distribution system to a critical emergency configuration (
Figure 2). The residual capacity, C
own_TSO = C
n − C
DSO, is managed by the private owner for energy trading and for offering ancillary services to TSO. The maximum available power of the virtual storage (P
max_DSO) may change hour by hour because it depends on the current SoC. If it is around half of C
n, it is reasonable the potential exploitation of the highest value (P
max_DSO = C
DSO/Δt, with P
max_DSO ≤ P
n), while when the SoC is coincident to the lower or upper bound (C
min_DSO or C
max_DSO), the maximum available power takes its lowest value (P
max_DSO = C
DSO/2Δt, with P
max_DSO ≤ P
n). Again, for this gene, the value is a real number within the interval [0%, 100%].
It is worth noticing that the decision variables (e.g., BESS SoC, share of C
n, rated power, and energy or duration) are continuous and, therefore, also the MO optimization solution space cannot be binary, as in the simplest version of the algorithm in the literature. For this reason, it has been decided to adopt a more efficient real codification. Indeed, this choice eliminates the accuracy problems related to the discretization of the solution space proper of the binary formulation that may not result adequately precise [
27]. Furthermore, the formulation of genetic algorithms with the real instead of the binary coding is well suited for dealing with the gradual trend exhibited by continuous variable functions (i.e., small variations in the variables slightly alter the function values). Its implementation has required some adaptations to the typical operators of genetic algorithms (i.e., crossover and mutation), as detailed in [
8].
3. Objective Functions
The advent of flexible resources in the distribution system during the deregulated power system era introduces new challenges to be faced, among which the correct cooperation between TSO and DSO is a cornerstone. Indeed, flexibility is essential for preserving the secure operation of the power system, but it is becoming central also for development and management of upcoming smart distribution networks. Moreover, the uncoordinated exploitation of flexibility from DER for TSO requirements may cause severe technical challenges to the distribution system, not originally planned for this scope.
Diverse TSO/DSO cooperation models are possible and have been analyzed by several scientific working groups [
28,
29], like various services market models as well [
6]. In the paper, it has been assumed the opening of the ancillary services market (ASM) to the BESS located in the distribution system for the provision of primary and secondary frequency reserve. No local ASM has been supposed on the distribution level, but the DSO may request to reserve part of the BESS capacity for facing local contingencies. Two stakeholders have been considered with their goals:
the BESS owners, whose goal is to maximize the energy trading revenues providing services to the TSO, and
the DSO, that must operate its network energy-efficiently and cost-effectively within the technical constraints.
In the MO formulation, the DSO’s objective function (OF) has been defined as the annual risk to violate any technical constraints (to be minimized), whereas for the BESS owners the OF is the cost/benefit ratio (to be minimized as well).
By optimizing the two OFs, it is possible also to analyze the limitation on the availability of the flexibility services for the TSO caused by the bottlenecks in distribution network. Indeed, if the location of a particular BESS is convenient for the distribution system, the DSO will reserve part of the available flexibility to resolve local contingencies, so reducing the amount of flexibility accessible to TSO.
3.1. DSO Objective Function—Risk of Technical Constraints Violation
Modern planning tools for designing the upcoming smart distribution networks need to overcome the traditional and extra conservative “fit and forget” approach, built around the fulfilment of the worst-case scenario, to move towards a risk-based procedure, that can correctly correlate the effectiveness of planning choices to the probability and the seriousness of possible contingencies [
2].
An explicit and detailed assessment of the annual risk to violate technical constraints in a given distribution network requires probabilistic load flow (PLF) calculations, solved for each time step of the typical days used to represent the yearly behavior of distribution network customers [
30]. The load/generation behavior in each hour has been assumed normally distributed. The risk assessment procedure starts with the definition of the impedance matrix [Z]
b, relative to the
bth network configuration in the N-1 security analysis (where
b = 0 means the network in normal configuration and
b > 0 means the network reconfigured without the
bth element), and the acquisition of the nodal current matrix [I
node]
f in the
fth hour of the typical daily profile. The results of the PLF are the nodal voltage [V
node]
f and the branch current [I
branch]
f matrixes (expressed in terms of mean value, μ, and standard deviation, σ, of a normal distribution), by which the probability (
ptcv) to overcome the voltage regulation band or the conductor thermal limit is estimated. Only the
Nc operating conditions with non-negligible probability to violate the technical constraints (
ptcv > 0) are stored (
Figure 3—case A), while the cases on which the extremes values of [V
node]
f and [I
branch]
f (assumed equal to μ ± 3σ) do not exceed the technical limits (minimum and maximum nodal voltages,
Vlim_min and
Vlim_max, and maximum branch current,
Ilim_max) are disregarded (
Figure 3—case B).
In order to calculate the risk of technical constraints violation (
Rbf) when the
bth network configuration is in force during the
fth hour of the
dth typical day, the
ptcv is multiplied by the occurrence probability (
pbf) of the relative operating conditions. Such probability can be determined by simply multiplying the forced outage rate of the
bth network element (
FORb) and the occurrence probability of the specific customers’ operating conditions (
pfd), because these two probabilities can be considered independent:
where:
MTTRb is the “Mean Time To Repair” of the bth network element, indicated in the paper with the symbol τb and assumed equal to 5 h for an overhead line and 8 h for a buried cable;
MTTFb is the “Mean Time To Failure” of the bth network element, expressed by definition as , where λb is the fault rate assumed in the paper equal to 0.12 [faults/(year·km)] for overhead lines and 0.03 [faults/(year·km)] for buried cables;
nhfd is the yearly number of occurrences of the fth hour of the dth typical day (i.e., the specific conditions of power injected or absorbed in each node by every customer). If a single daily profile is used to describe the customers’ behavior in the whole year, then nhfd = 365 h and the occurrence probability pfd = 1/24; if two semesters are simulated, pfd = 1/48, and so on.
For a distribution network, it is evident that
MTTF >> MTTR (years compared to few hours). Consequently,
MTTR can be disregarded in the denominator of the first of Equation (2), and it is acceptable to assess the occurrence probability
with the following approximated formula:
When the normal configuration is examined (b = 0), FORb is assumed equal to 1 and pbf = pfd.
Finally, the risk component
Rbf is expressed in hours of violation per year:
The sum of all these risk components, determined for each configuration in each interval of the typical days, represents the total risk (RTOT) that characterizes the distribution network examined, i.e., the number of hours per year when it is possible to overcome a technical constraint.
When the total risk is greater than the acceptable limit fixed by the DSO planner,
RA, planning solutions have to be put in place to reduce
RTOT below
RA and make the distribution network robust enough for the whole planning period considered. Obviously, this system development has to be optimized by comparing the conventional network reinforcement with the exploitation of flexibility services from DERs, not only in terms of costs but also of residual risk. In the paper, only the resort to services from BESS has been considered, by exploiting when necessary the share of storage capacity (C
DSO%) reserved to DSO. A simple linear programming optimal power flow (OPF), capable of finding the optimal scheduling of BESS, is used for tackling the particular contingency and nullifying the residual risk [
3]. If the BESS location and/or the share of capacity for DSO are ineffectual for solving the contingency, the existing risk component will be reduced according to the flexibility resource availability.
3.2. BESS Owners’ Objective Function—Services for TSO
The recent trend in opening the ancillary services market to resources located in the distribution system is creating new business opportunities for private investors. Indeed, the large diffusion of small non-dispatchable renewable generation units and the concurrent decommissioning of traditional fossil-fuelled plants are increasing the need for additional flexible and fully controllable resources, like BESS. Therefore, the introduction of new actors in the power system is expected, whose goal is to make a profit with storage devices mainly by providing ancillary services to power system operators. Obviously, the participation to the energy market is available as well, and it has been included in the following cost-benefit analysis (CBA), even if its weight is lower than the income from ancillary services provision.
In the paper, with the local ASM for the distribution system not yet available, the ancillary services provision has been assumed devoted only to TSO, even if DSO may limit this operating mode by acquiring part of the BESS capacity. Thus, the BESS owners’ sources of income considered in the calculations are related to the following three applications:
Arbitrage—it refers to energy trading strategies within an electricity market, aiming at purchasing energy from the grid when the price is low and selling it back to the grid at a meaningfully higher price (Barb). It should be noted that this application, together with the influence on the distribution network operating conditions (nodal voltages and line currents), guides the optimization.
Frequency containment reserve (FCR)—it is used for the purpose of primary frequency control. It must be fully provided within 30 s from the activation, remaining active up to 15 min. In the ASM, it is monetized with capacity payment based on availability and activation payment based on activated net energy (BFCR).
Automatic frequency restoration reserve (aFRR)—it is devoted to the secondary frequency control for restoring the frequency to its setpoint value and freeing the capacity needed by the primary control. It is characterized by an activation time between 30 s and 15 min, and its full capacity has to be guaranteed for more than one hour (variable from country to country). It is monetized with both capacity and activation payments (BaFRR).
These BESS applications are mutually dependent, besides limited by the DSO reserve capacity, because they may be provided simultaneously, and their value relies on the active power exchanged with the grid. By optimizing the BESS daily scheduling of the stored energy, the multi-objective procedure adopted in the paper finds the optimal share of the BESS active power between arbitrage (and the influence on the distribution network operating conditions) and TSO services. For the further partition between the two frequency ancillary services, the heuristic choice of equally dividing the residual active power was taken.
By assessing the incomes from these three applications, in terms of net present values (NVP) within the whole planning period, and the storage investment (
CBESS), the BESS owners’ point of view has been expressed as a cost-benefit ratio:
In the following, more details on the determination of cost and benefits are provided.
3.2.1. BESS Cost
A BESS is basically constituted by two components, the electrochemical battery and the system devoted to the power conversion. Thus, its installation cost can be split on a term proportional to the nominal power and another term relevant to the rated capacity. Regarding the share of BESS capacity reserved to DSO, several market mechanisms for remunerating this service are possible. In the paper, the simplest method has been supposed: the DSO refunds only the quote of the reserved share capacity. Regarding the cost term on power, proportional to the specific cost
cp (in €/kW), it is entirely charged to the private investor because the nominal power is entirely free until the SoC does not overlap the reserved upper and lower semi-bands (
Figure 2). Consequently, the initial investment (
IBESS) for the private investor is defined as in (5):
where
ce is the unitary cost of capacity (expressed in €/kWh).
cp and
ce values depend on the BESS technology considered. The cost for the maintenance was assumed negligible in this paper even though it can be included in the model. If the BESS lifespan (
NBESS_life) is longer than the years’ number of the planning period (
Nyears), the residual value (
RBESS) has to be considered and subtracted to the initial investment for a correct CBA:
where
a = 1/(1 +
d) is the actualization factor used to assess the net present value (NPV) of
RBESS, derived by assuming a constant discount rate (
d) during the whole planning period. On the contrary, if
NBESS_life <
Nyears, the investment on a new storage device has to be included.
3.2.2. Arbitrage
As aforementioned, arbitrage takes advantage of energy market price spreads (between off-peak and peak demand hours) that can produce value, even considering the efficiency of the BESS.
For each configuration of BESS proposed by the NSGA-II, the arbitrage term is calculated by subtracting the cost of storing energy in the device (charging phase) from the incomes of providing energy to the system (discharging phases), properly considering the round-trip efficiency of the BEES (i.e., the energy lost during the storage operation).
3.2.3. FCR Service
The FCR term is assessed by calculating the upward and downward power that the BESS can provide in each interval, depending on the scheduled daily profile of the energy stored. As assumed in the paper, in planning studies, the minimum time-step used to represent the customer variability within the typical day is one hour. Consequently, the offered FCR service is assumed constant within the same hour.
The power exchanged with the grid in the generic
fth hour is assessed as the difference between the starting and the ending state of charge (SoC):
If the BESS is charging (
>
being
the SoC at the beginning of the
fth hour), it absorbs power from the distribution system, operating as a load (
). If, on the contrary, the BESS is discharging (
<
), it delivers power to the distribution system, operating as a generator (
). Thus, since ancillary frequency services have to be provided with a symmetric band, the width of the available semi-band in the
fth hour (
) is given by the minimum power that the storage device can provide, taking into account the BESS nominal power (
Pn), the power injected to or absorbed from the grid in the
fth hour (
), and the limits imposed by the DSO reserved capacity (C
min_DSO, C
max_DSO):
In addition to the operating limits of the storage device, the availability of FCR can be limited hour by hour by the minimum amount of reserve () that has to be provided in order to be eligible as the FCR service provider (it depends on the national regulation). It is predictable that this limit, lowered in the recent years due to the broad diffusion of renewables, will be further reduced (or even deleted) to allow the participation of many small DERs directly connected to the distribution system. If the semi-band calculated is lower than this limit, it is assumed that BESS cannot provide the FCR service for that specific hour.
It is worth noticing that the calculated semi-band is the whole amount of available power that the storage can offer in the fth hour for the considered TSO services. Thus, it can be split in accordance with the ratio rFCR between the two frequency regulation services provided, or it can be dedicated exclusively to FCR (rFCR = 1) or aFRR (rFCR = 0).
The income from the FCR service is usually remunerated in capacity and energy. The first term is simply obtained by multiplying the cumulative amount of FCR available in the whole year by the average annual price of remuneration (
pCFCR). The second term is estimated by assuming reasonable hypotheses on the average request of primary frequency regulation, based on historical measurements. Thus, the actual amount of energy used for this ancillary service in the
fth hour is calculated by multiplying the available energy (
rFCR·Δ
Pf·Δ
t) by a heuristic factor
fdFCR (assumed constant). Then, the remuneration of this energy is obtained by multiplying it for the corresponding hourly energy market price (
pEf). By so doing, the total income from the FCR service in a generic year within the planning horizon is:
The NPV of this frequency service in the whole planning period is finally derived as:
3.2.4. aFRR Service
Operating reserves of this category are typically activated centrally with an activation time between 30 s up to 15 min. Differently from FCR, the aFRR may last more than one hour, but its maximum requested duration (ΔtaFRR) differs country by country (e.g., 2 h are requested in Italy).
The available semi-band offered for the aFRR service is calculated as (1—
rFCR) Δ
Pf. However, an additional constraint has to be considered, because the power offered must be provided constantly and continuously at least for Δ
taFRR. Consequently, the available semi-band for the aFRR service is obtained as the minimum of the following values:
The equations used to monetize this service are formally the same used for the FCR service, but with a different amount of maximum semi-band available, different capacity price, pCaFRR, and different heuristic factor, fdaFRR, used to estimate the average amount of energy provided.
3.2.5. Reduction Estimation of Ancillary Services for TSO
The exact amount of ancillary services provided to TSO and, consequently, the relative amount of incomes for the BESS owners may appear not directly dependent on the location of the BESS in the distribution network. However, being the storage devices connected to a given distribution network, their operation can be limited by the risk of violation of distribution system technical constraints. Indeed, if all these resources contribute simultaneously to an FCR request, they cause high momentary power flows that may exceed the maximum allowed overcurrent or cause excessive voltage deviations. The provision of secondary frequency control can also originate the same technical issues, even exacerbated because both services can be provided simultaneously. From this point of view, these services can depend indirectly on the position of BESS in the distribution network.
In order to assess these network limitations, the following procedure has been implemented. In normal operating conditions (
Figure 4), for each hour of the typical day, a first probabilistic load flow (PLF) is executed without considering the provision of TSO ancillary services (but with the BESS typical scheduling). If the risk of technical constraints violation is greater than the acceptable one (
RTOT >
RA), the TSO ancillary services are suspended, and the virtual battery reserved to DSO is systematically used to solve or limit the network contingencies. In the other case, two additional PLFs are solved, by assuming that all the BESS installed are generating/absorbing their nominal powers simultaneously. If
RTOT ≤
RA, the TSO ancillary services can be freely provided, limited only by the respect of the DSO semi-bands and by the power exchanged for arbitrage (BESS scheduling). Otherwise, the TSO ancillary services are suspended again. To simplify the analysis, it has not been calculated the maximum amount of TSO services that can be provided without causing any network contingency. Still, the verification of technical constraints is always performed assuming the full provision of the available flexibility.
In emergency configurations, the virtual battery is used to solve (or limit) possible contingencies during the repair of the faulted component, while the TSO ancillary services are not considered, because it is assumed that during emergency configurations of the distribution network, they are always suspended.
Once all these limitations have been identified, the total amount of flexibility for TSO services is estimated by summing in the typical day all the available regulation semi-bands Δ
Pf. The result is finally compared with the same amount of flexibility calculated without considering the limitation introduced by the distribution network and the virtual battery of the DSO. In this way, it has been possible to estimate the reduction of the potential flexibility available for the TSO ancillary services, due to the DSO needs. Some examples of this procedure are depicted in
Figure 5, that considers the storage device of
Figure 2, with the assumption of
rFCR = 1/3 (i.e., one-third of the available band of flexibility in each hour is dedicated to FCR and two-third to aFRR) and Δ
taFRR = 2 h.
The first case of calculation refers to the preliminary estimation of the available flexibility for TSO without considering DSO limitation. Because the SoC in the fifth hour of the day remains constant (PfBESS = 0), the semi-band coincides with the nominal power of the battery (Pn = 1000 kW). Thus, the flexibility for FCR is ±333 kW, and for aFRR is ±667 kW.
The second case (10th hour of the day) considers the presence of the virtual battery dedicated to the DSO. The SoC is still constant (PfBESS = 0). However, the proximity of the upper bound limits the available regulation semi-band to ΔPf = (Cmax_DSO − SoC10)/Δt = (3600 − 2800)/1 = 800 kW (<Pn). Thus, the flexibility for FCR is ±267 kW, while the flexibility for aFRR should be ±533 kW. However, because secondary control has to be guaranteed for 2 h, this flexibility is further reduced to ΔPfaFRR = (Cmax_DSO − SoC10)/ΔtaFRR = (3600 − 2800)/2 = 400 kW.
The third case (18th hour of the day) is partially influenced by the presence of the two hours (19th and 20th) during which, in ordinary conditions, the TSO services are suspended due to technical constraints violations. Because the aFRR has to last for two hours, it cannot be provided from the 18th to the 20th hour. Instead, the FCR can be provided in the 18th hour, while it is suspended in the 19th and 20th hour. The available flexibility for FCR, in this case, is limited by the discharge of the battery (PfBESS = 200 kW), resulting in ±800 kW.
4. Case Study and Discussion
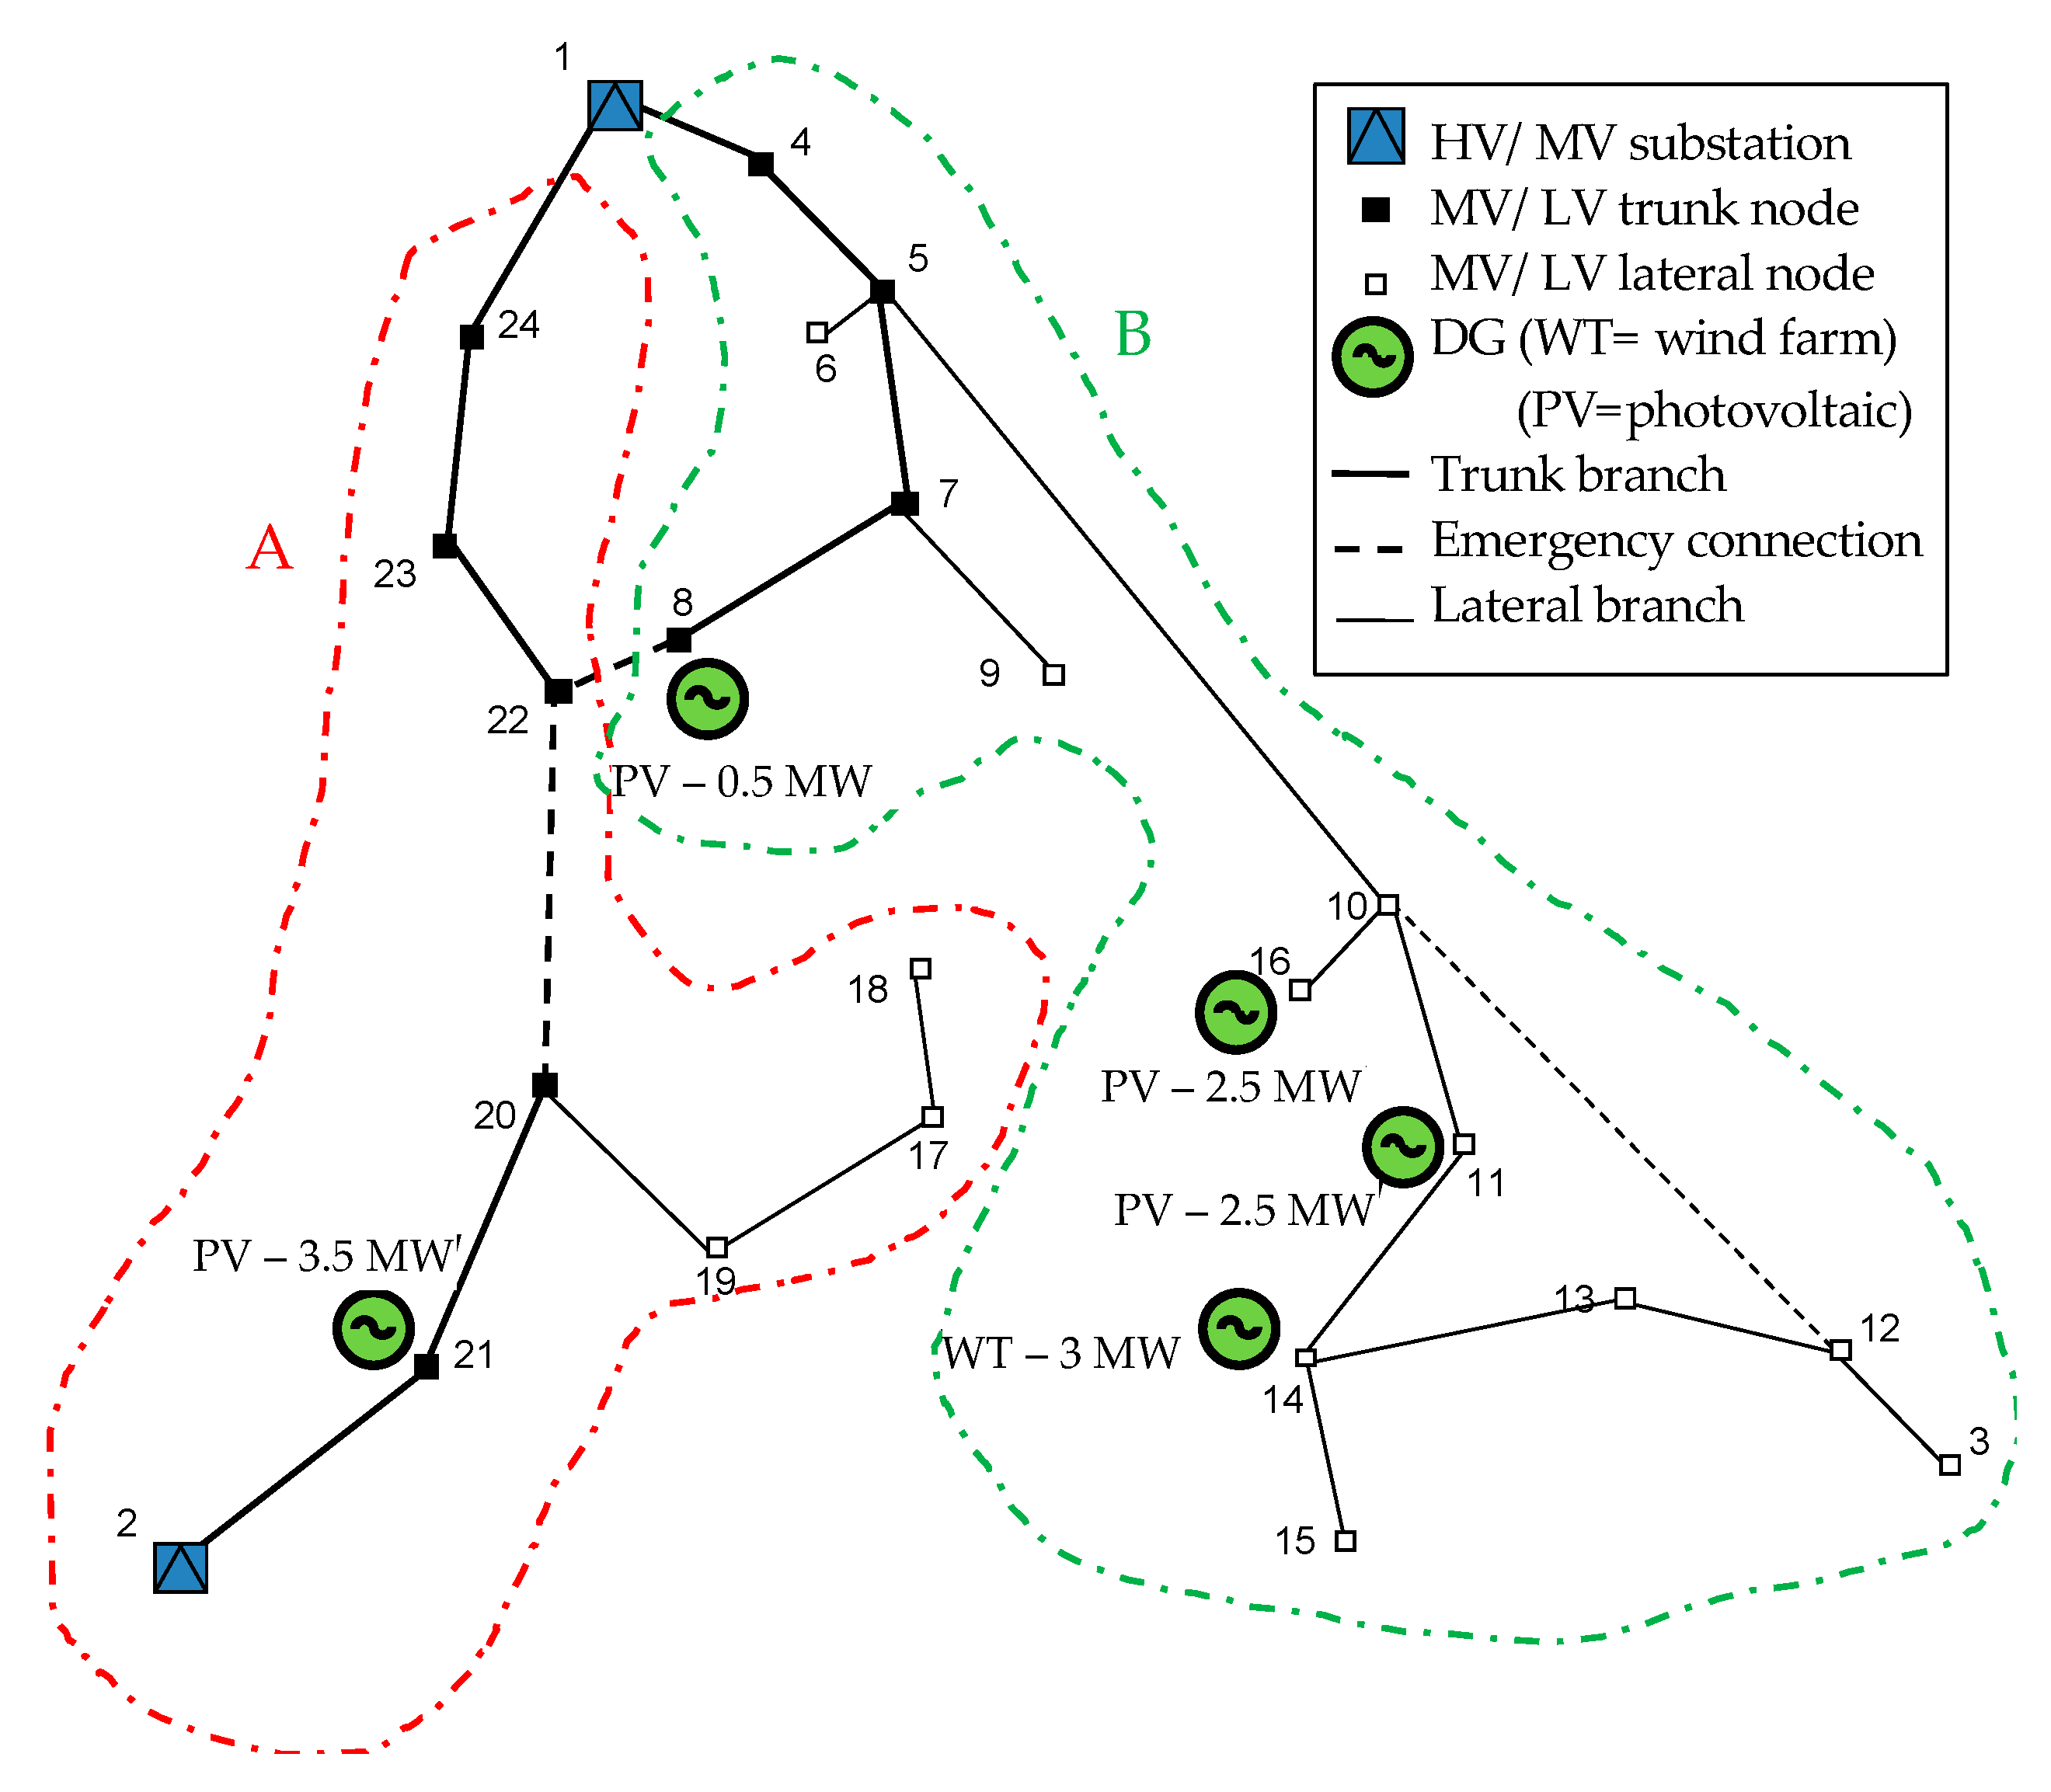
The proposed case study describes a real application of the approach for finding optimal BESS installation projects in a small network of the Italian distribution system (
Figure 6).
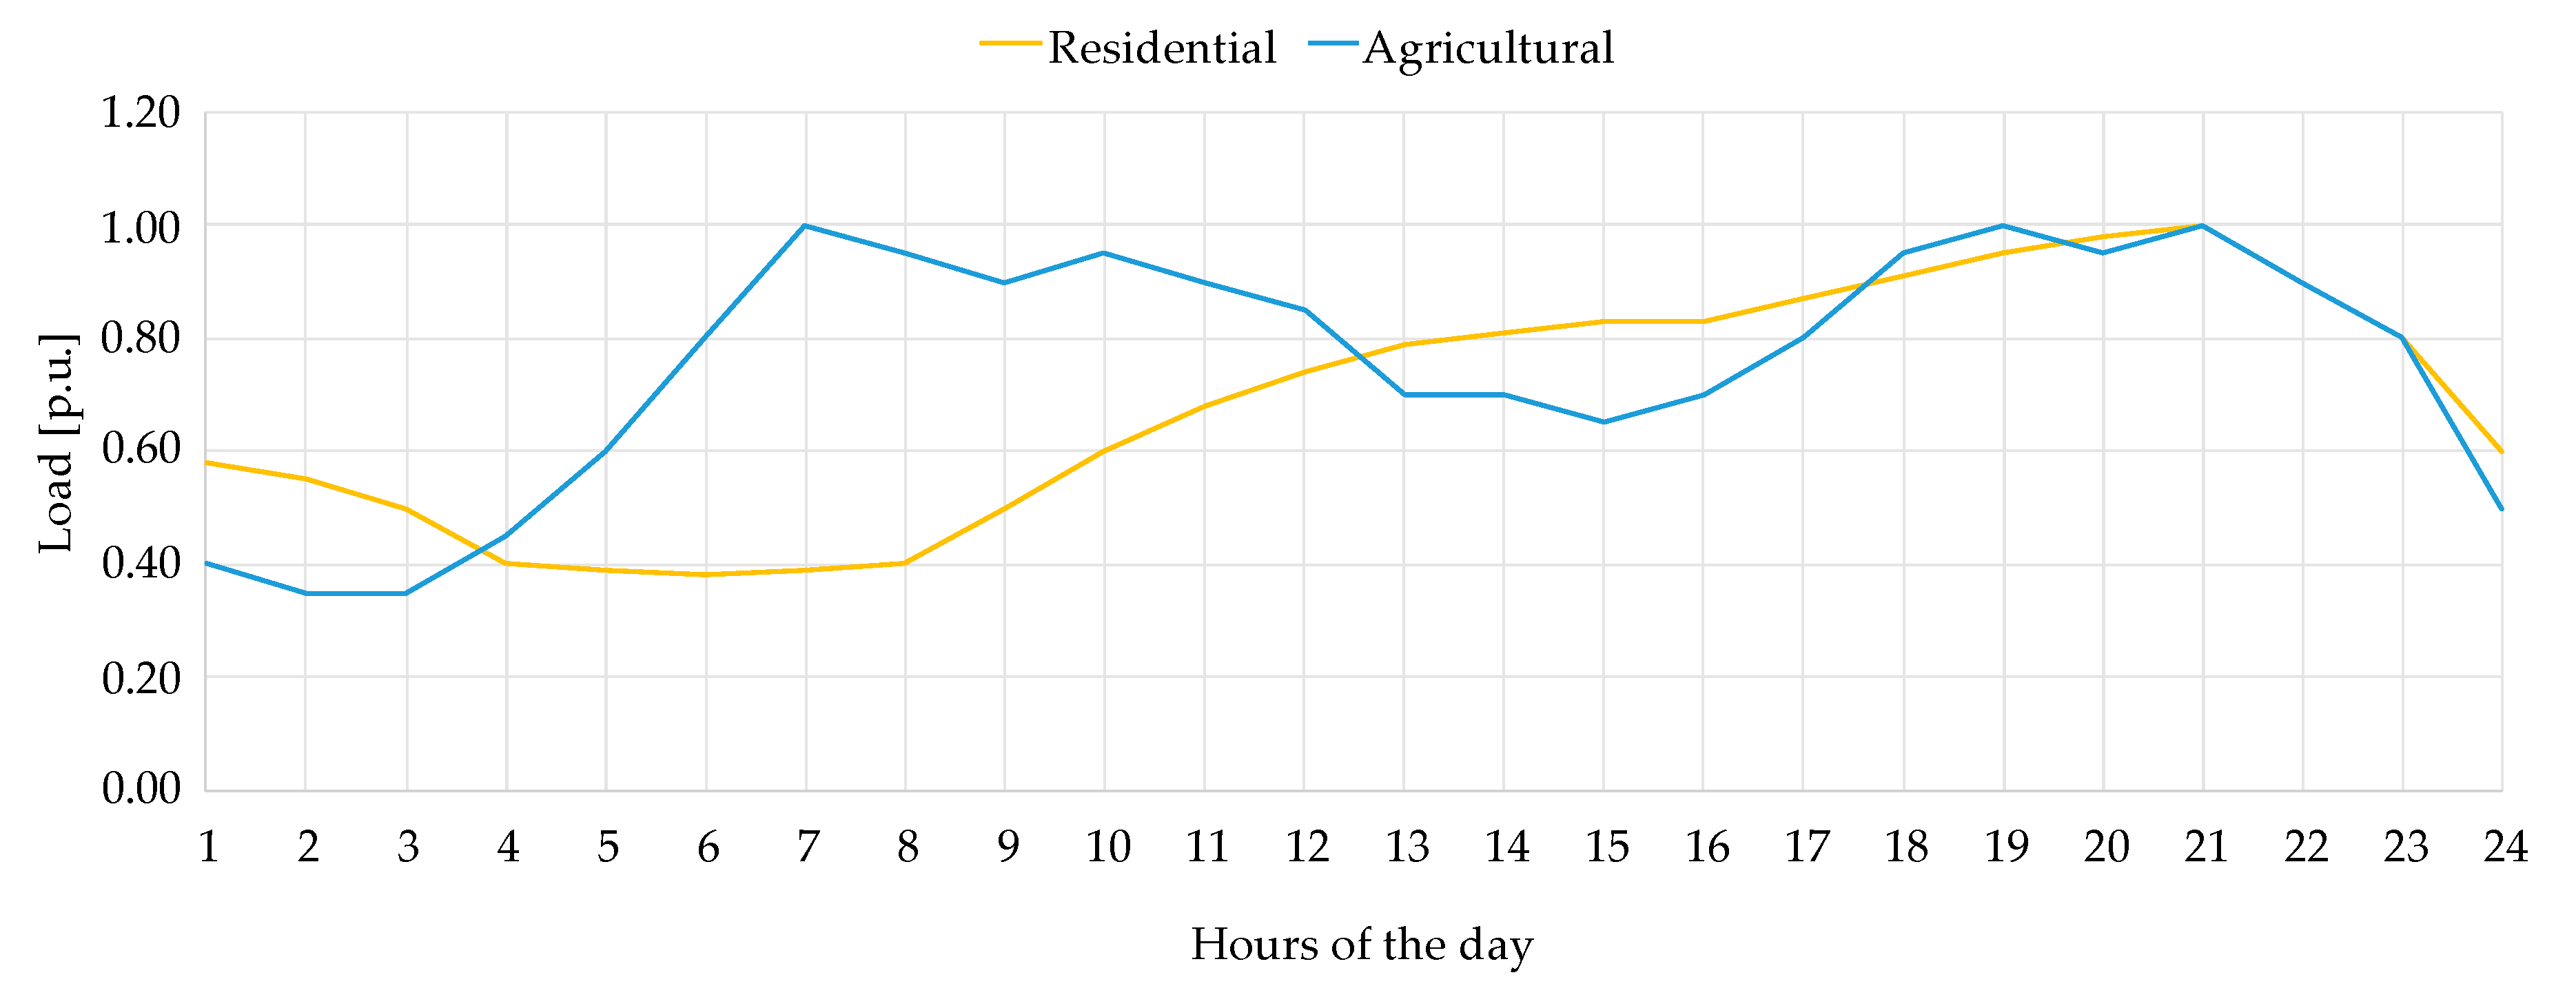
Twenty-two MV nodes (9 trunk nodes and 13 lateral nodes), that supply energy to both MV and LV end-users (total rated power 13.8 MW), are fed by the bulk grid, via two primary substations, and by five RES generators: one 5 MW wind turbine (WT, in node 14) and four photovoltaic generators (PV, 0.5 ÷ 3.5 MW, in the nodes 8, 11, 16, 21). Loads and generators are modeled with typical daily curves. Two kinds of daily load profiles have been assumed for representing the residential customers (74%) and the agricultural ones (26%); the standard deviation adopted for the loads is equal to 0.05 pu.
Figure 7 shows the used load patterns. Furthermore, the load and generation uncertainties are modeled with a normal probability distribution. The WT output power has been modeled with a constant mean value (0.50 pu), greater than zero, and a high and constant standard deviation (0.15 pu) during the day. While the PV generation, characterized by high production during the day and no output during the night, has been assumed with a standard deviation variable hourly (i.e., small at the sunrise and sunset, and significant, 0.03 pu, in the central hours of the day). The network is radially operated, but it is provided by some tie connections, usually open, that can be closed during emergency conditions. The test network may be considered located in a prevalently rural ambit since it is constituted by long overhead lines (fault rate equal to 12 fault/(year·100 km)) and the extended lateral branches. More details on the network characteristics are provided in the
Appendix A. As a consequence of these characteristics, this network is electrically weak, and voltage regulation problems or overloads may occur due to the non-homotheticity between production and load demand.
Table 1 reports the main parameters adopted in the case study, inherent to:
the planning study (i.e., the period, the growth of the load demand, and the discount rate);
the optimization algorithm (i.e., the population size, the maximum number of generations, and the maximum number of BESS considered for each possible configuration). Since the dimension of the optimization problem grows with the population size and the maximum number of generations, 500 individuals per population and a maximum number of 50 generations have been considered for limiting the computation burden;
the BESS, regarding the technical characteristics (i.e., technology, range of rated power and duration), the economic aspects (i.e., power cost, energy cost, FCR capacity price, and aFRR capacity price) and some assumptions about the services provided (i.e., the share between FCR and aFRR, the minimum amount of reserve, the expected duration of the FCR, and the expected and the maximum duration of aFRR). The most commonly used Li-ion battery is the chosen BESS technology, and the relevant costs were assumed.
Regarding the main parameters of the optimization algorithm, a general rule often adopted for the genetic algorithm is that population size and number of generations have to increase with the dimension of the optimization problem (D
OP—number of variables to be optimized simultaneously). Considering that the solution coding adopted uses 28 genes for each BESS (
Figure 1), and that the optimization has been limited to three storage devices, then D
OP = 84. From sensitivity analyses performed on the specific case study, population size and number of generations have been chosen equal respectively to 500 individuals and 50 iterations, representing a good compromise between quality of the results and calculation time. Indeed, it has been observed that the population size should be 5 ÷ 6 times D
OP in order to achieve a high accuracy of the Pareto-optimal solutions set. Instead, the Pareto front does not improve significantly with the growth of generations after a minimum number of iterations (0.5 · D
OP).
All nodes are eligible for BESS, but not more than 3 BESS are considered for each possible configuration. The threshold adopted for BESS owners CBA allows feasible solutions with a payback time comparable with the BESS lifespan (i.e., 12 years as in
Table 1).
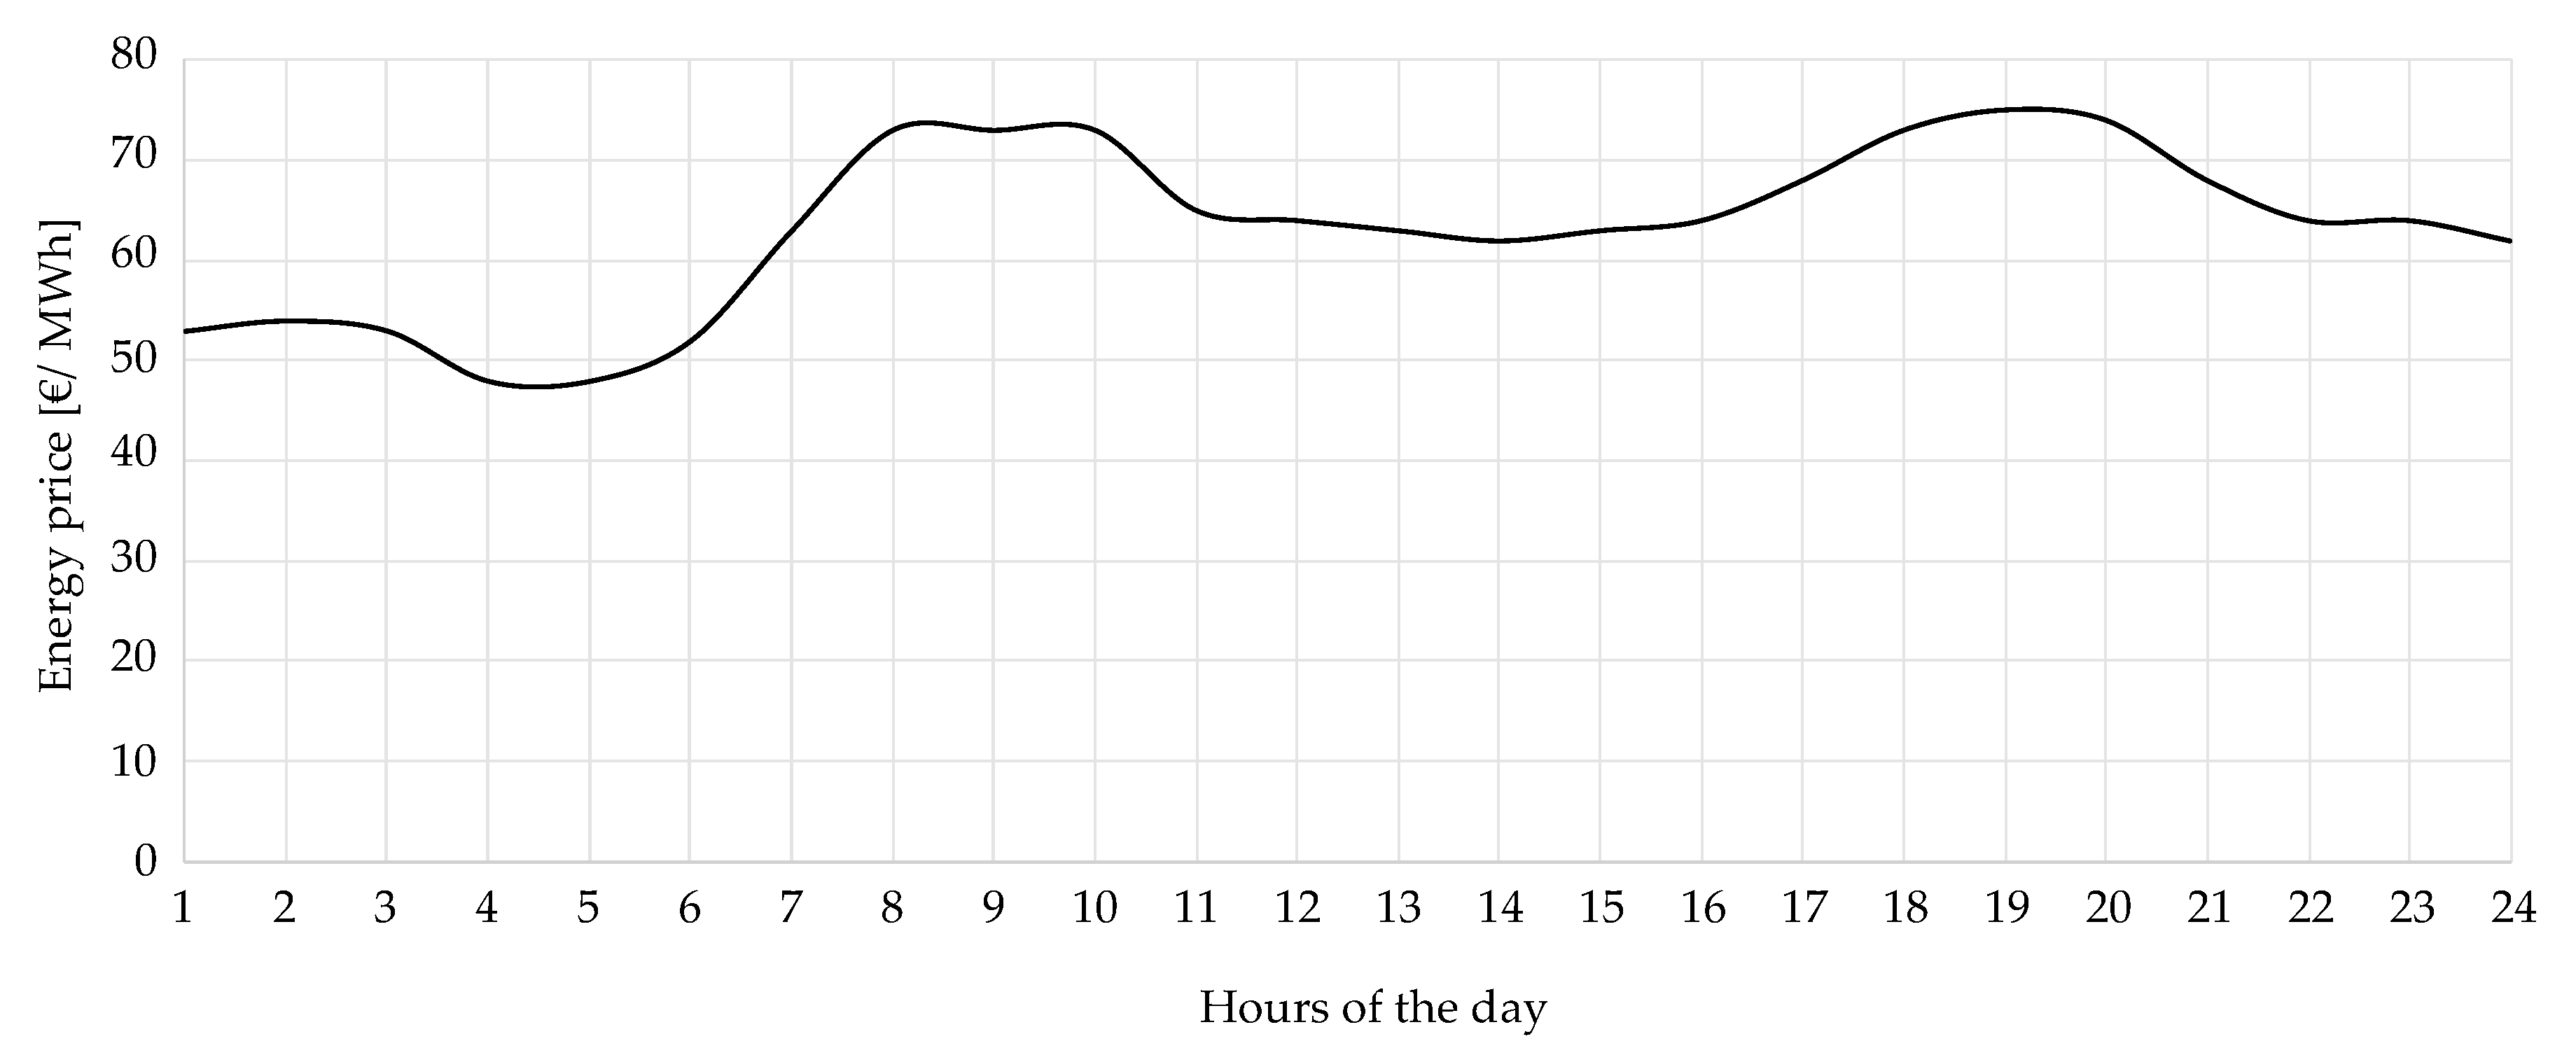
Figure 8 shows the energy price daily pattern adopted for the monetization benefits.
For validating the effectiveness of the procedure, the comparison between the optimal solutions and a base case, that does not use the support of the BESS, has been considered. In the base case (without any BESS installed), network congestions occur during the evening (peak load,
Figure 7) in the first branch of the B area (link 1–4,
Figure 6), both in normal operations (network configuration showed in
Figure 6) and in some emergency conditions. The total yearly overcurrent duration is equal to 735 h/year. For solving these contingencies, network upgrading would be necessary.
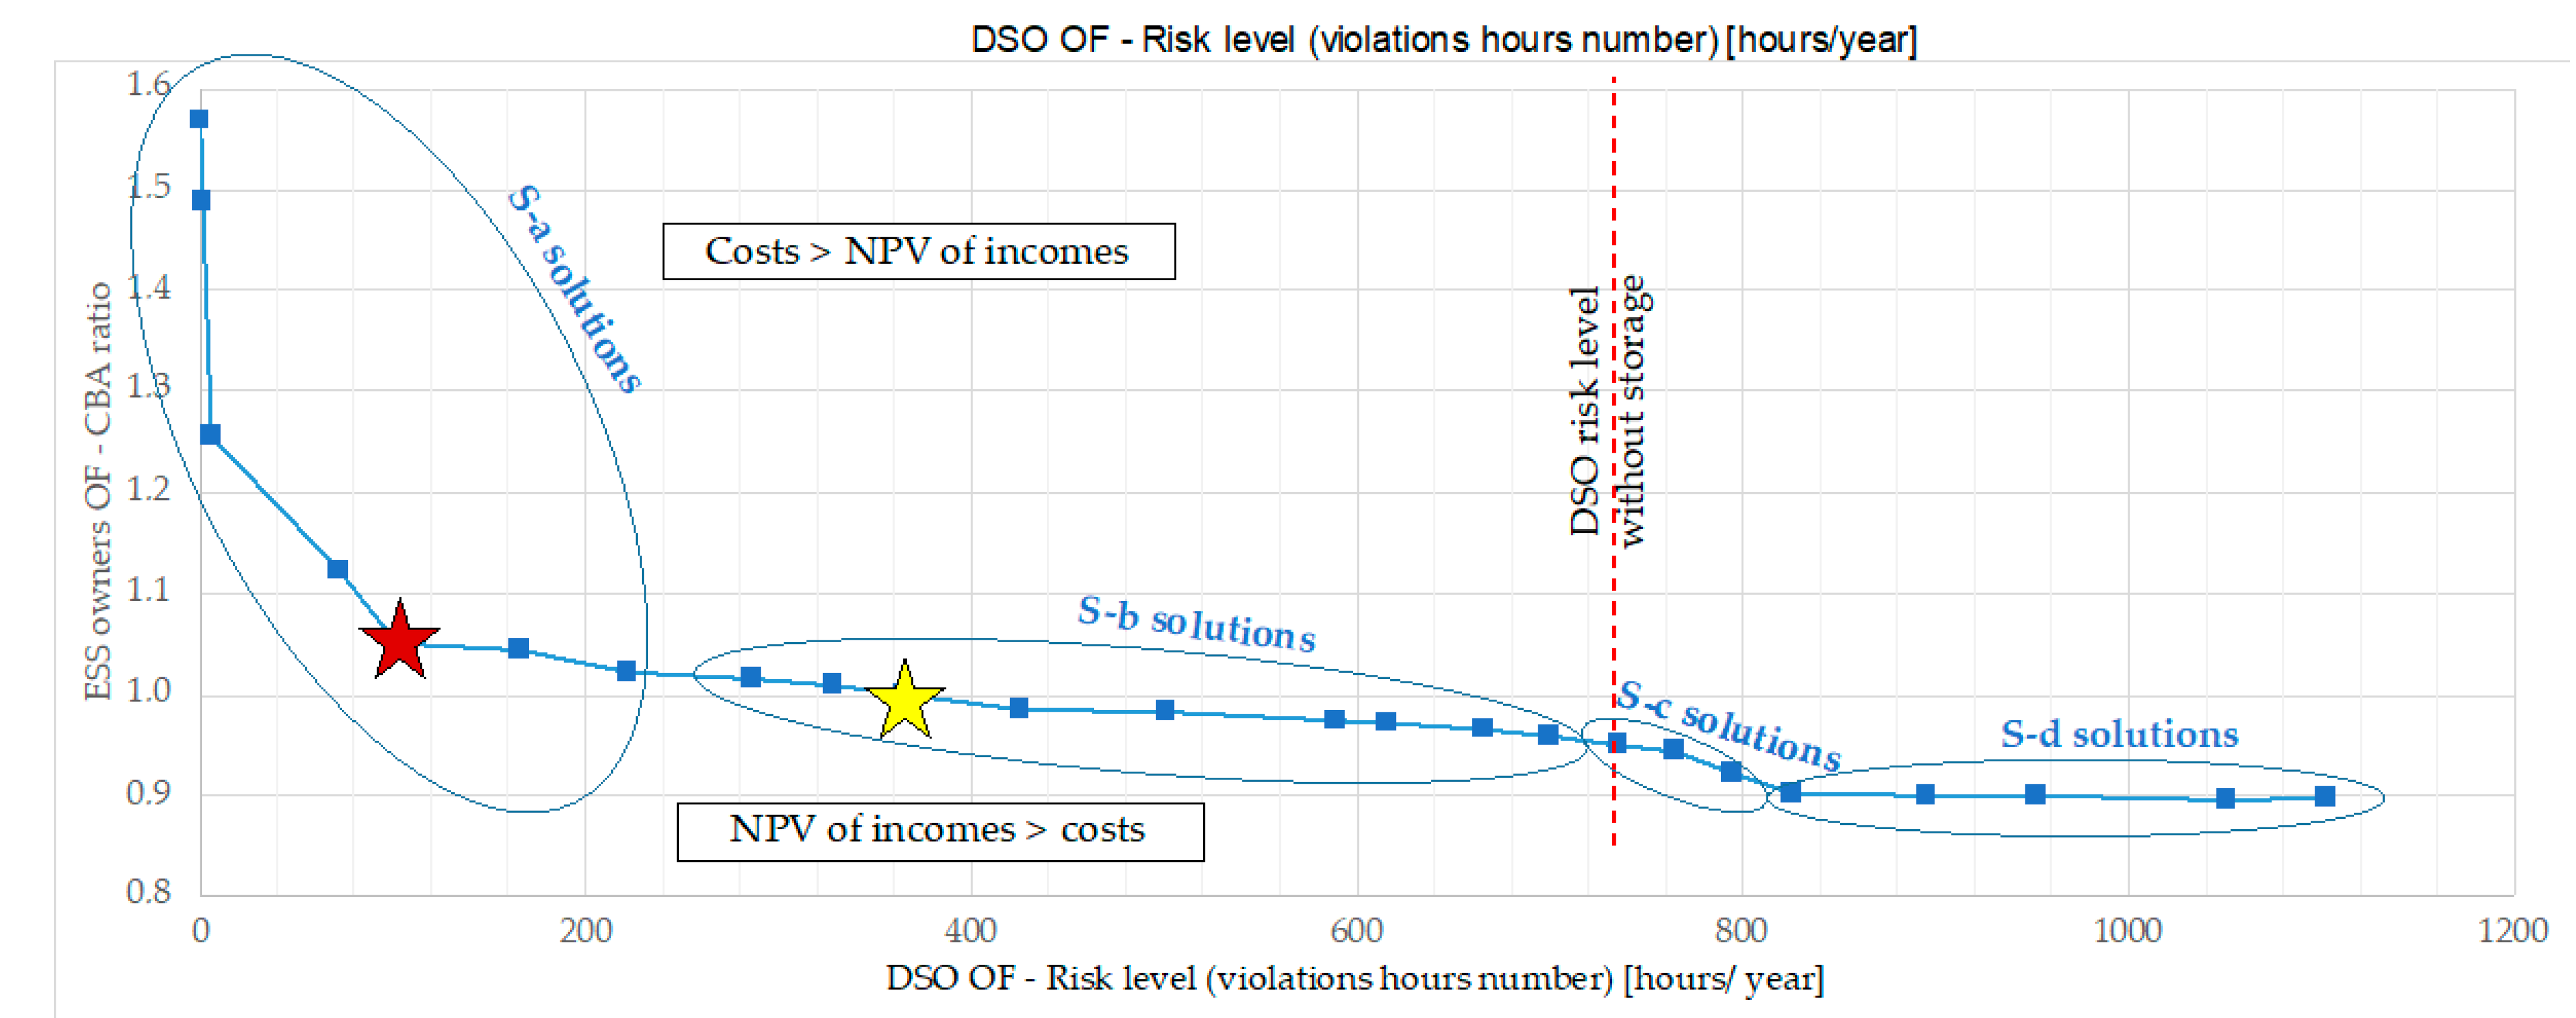
By applying the proposed optimization, the two OFs are calculated for each examined configuration. As a result of the optimization, the Pareto set is constituted by individuals that differ for the three BESS positions along the network, the nominal rates, and the daily schedules of charging/discharging cycle. The Pareto optimal front obtained for the proposed case study is shown in
Figure 9.
By analyzing the resulting optimal siting, a tendency of locating the BESS close to the 3.5 MW PV generator (
Figure 6, A area) can be recognized. In that location, the BESS presence does not increase the risk of technical limit violations, due to the strength of the network (relatively short electric distance from the primary substations), in opposition to the majority of the nodes in the other part of the network (i.e., B area). Therefore, in the A area of the system, the BESS can be successfully exploited for providing TSO ancillary services (the frequency services), with negligible impact on the distribution network operation. For the BESS located in the B area, the suitable BESS reservation rate for the DSO use permits to provide ancillary services to the distribution network, with a valuable contribution to relieve the contingencies. Recurrent BESS size in the optimal solutions is in the range 0.1 ÷ 1.3 MW with duration 1 ÷ 7 h; the most recurrent size is 1 MW/2 MWh.
In the Pareto front, diverse types of solutions can be seen:
solutions characterized by risk significantly smaller than the base case (S-a and S-b solutions,
Figure 9), but several with a high CBA ratio (S-a solutions),
profitable solutions for BESS owners without a reduction of the DSO risk for the base case (S-c solutions,
Figure 9),
most profitable solutions for BESS owners but with an increment of the existing DSO risk value (S-d solutions,
Figure 9).
Starting from this classification, by analyzing each configuration, some comments arise:
In the S-a solutions, some BESS mainly dedicated to distribution networks are located in the B area of the system; the other BESS are small in size and, in some cases, too small to offer the FCR/aFRR services in a profitable manner. The arbitrage service is not profitable due to the very narrow band in the daily energy prices during the day (
Figure 8). For these reasons, the CBA ratio has the maximum value (1.569 vs. a risk equal to zero), in the S-a solutions. For this type of solution, the BESS in the A area can offer 100% of services to TSO, while for the BESS in the B area, the services are limited to the 72 ÷ 81% of the total capacity. Globally, the overall solution can offer to the TSO a quantity in the range 83 ÷ 92%;
The S-c solutions can be considered “neutral” from the DSO point of view because the BESS are located only in the A area that does not suffer for technical constraint violations (
Figure 6), and they are dedicated to the FCR/aFRR services to maximize the BESS owners’ profits (100% of their capacity for services to the TSO, with a residual risk at the same level, 735 h/year, of the no-BESS solution);
The S-d solutions are close to the S-c in terms of the BESS owner profits but dramatically increase the DSO risk (765 ÷ 1103 h/year), due to a daily schedule that adds new violations in the network. Indeed, with respect of S-c solutions, in this case, some storage devices are located in the B area but without capacity reserved to the DSO (i.e., providing 100% of their capacity for services to the TSO);
The S-b solutions are a compromise between the S-a and S-c solutions. The solution identified with a yellow star in
Figure 9 can be considered as the “best compromise” between the different alternatives. In the selected solutions, the BESS owners can still obtain a profitable investment (even if quite small), while the DSO has a reduced risk in comparison with the base case (365 vs. 765 h/year). The new risk level is not the best for the DSO but, thanks to the BESS support, its network investments will be reduced. The goodness of the trade-off solution in the analyzed case study is limited by the BESS cost.
To investigate the impact of the BESS cost in the analysis, the CBA ratio in the Pareto front showed in
Figure 9 has been calculated considering an expected 20% reduction of the BESS cost in the next years. It is important to remark that this sensitivity analysis does not modify the size and the type of solutions in the Pareto front but only the numerical values for the CBA ratio, because the BESS cost affects only the above mentioned OF. In the new conditions, the profitability threshold for the BESS owners (CBA = 1) is raised, and the new “compromise solution” can be identified with the red star in
Figure 9, for which the total yearly overcurrent duration is equal to 102 h/year. In other words, following the expected reduction for the BESS cost in the next years, the proposed approach can identify a good compromise solution between BESS owners and DSO. For the DSO’s point of view, it is essential to highlight that the BESS installation allows a partial risk reduction that can be completed by exploiting the flexibility from other local resources (active generators and loads). Moreover, even if not considered in the paper, BESS has also the potential to provide reactive support to the distribution network. Therefore, if local markets of ancillary services will be implemented, the profitability of BESS investment and the benefits for DSO operation can both get larger.
In
Figure 10, the average daily schedules for the different BESS in the two areas of the network have been reported. In the A area, the BESS can be dedicated only to the owner profits because the DSO does not need support in this part of the network; the BESS change their SoC by maintaining an average energy level around 50%, to guarantee adequate support to the frequency service in upward e downward (TSO services). This assumption is confirmed by some sensitivity analyses for the frequency service remunerative prices; in particular, the simulation highlights that an increase in the remuneration (+15%) has similar effects of the BESS cost reduction, discussed above. On the contrary, the same reduction (−15%) in the remuneration for the frequency services jeopardizes the profitability of BESS investment because only the S-d solutions remain in a region where the NPV of the incomes are greater than the BESS cost (CBA ratio < 1).
The BESS size, in the A area, is limited to avoid technical violations during the feasibility check for the frequency control participation. On the contrary, in the B area, the energy pattern mainly follows the DSO needs: indeed, the BESS discharge from the 19th hour to the 21st hour covers the peak load during the evening, when the power congestion occurs.


