
Spatial Effects Analysis on Individual-Tree Aboveground Biomass in a Tropical Pinus kesiya var. langbianensis Natural Forest in Yunnan, Southwestern China

 , ,
, ,
Abstract
:1. Introduction
2. Materials and Methods
2.1. Study Site
2.2. Data Investigation
2.3. Biomass Measure and Calculate
2.4. Spatial Effects Analysis
2.4.1. Spatial Heterogeneity of the Aboveground Biomass
2.4.2. Spatial Autocorrelation of the Aboveground Biomass
3. Results
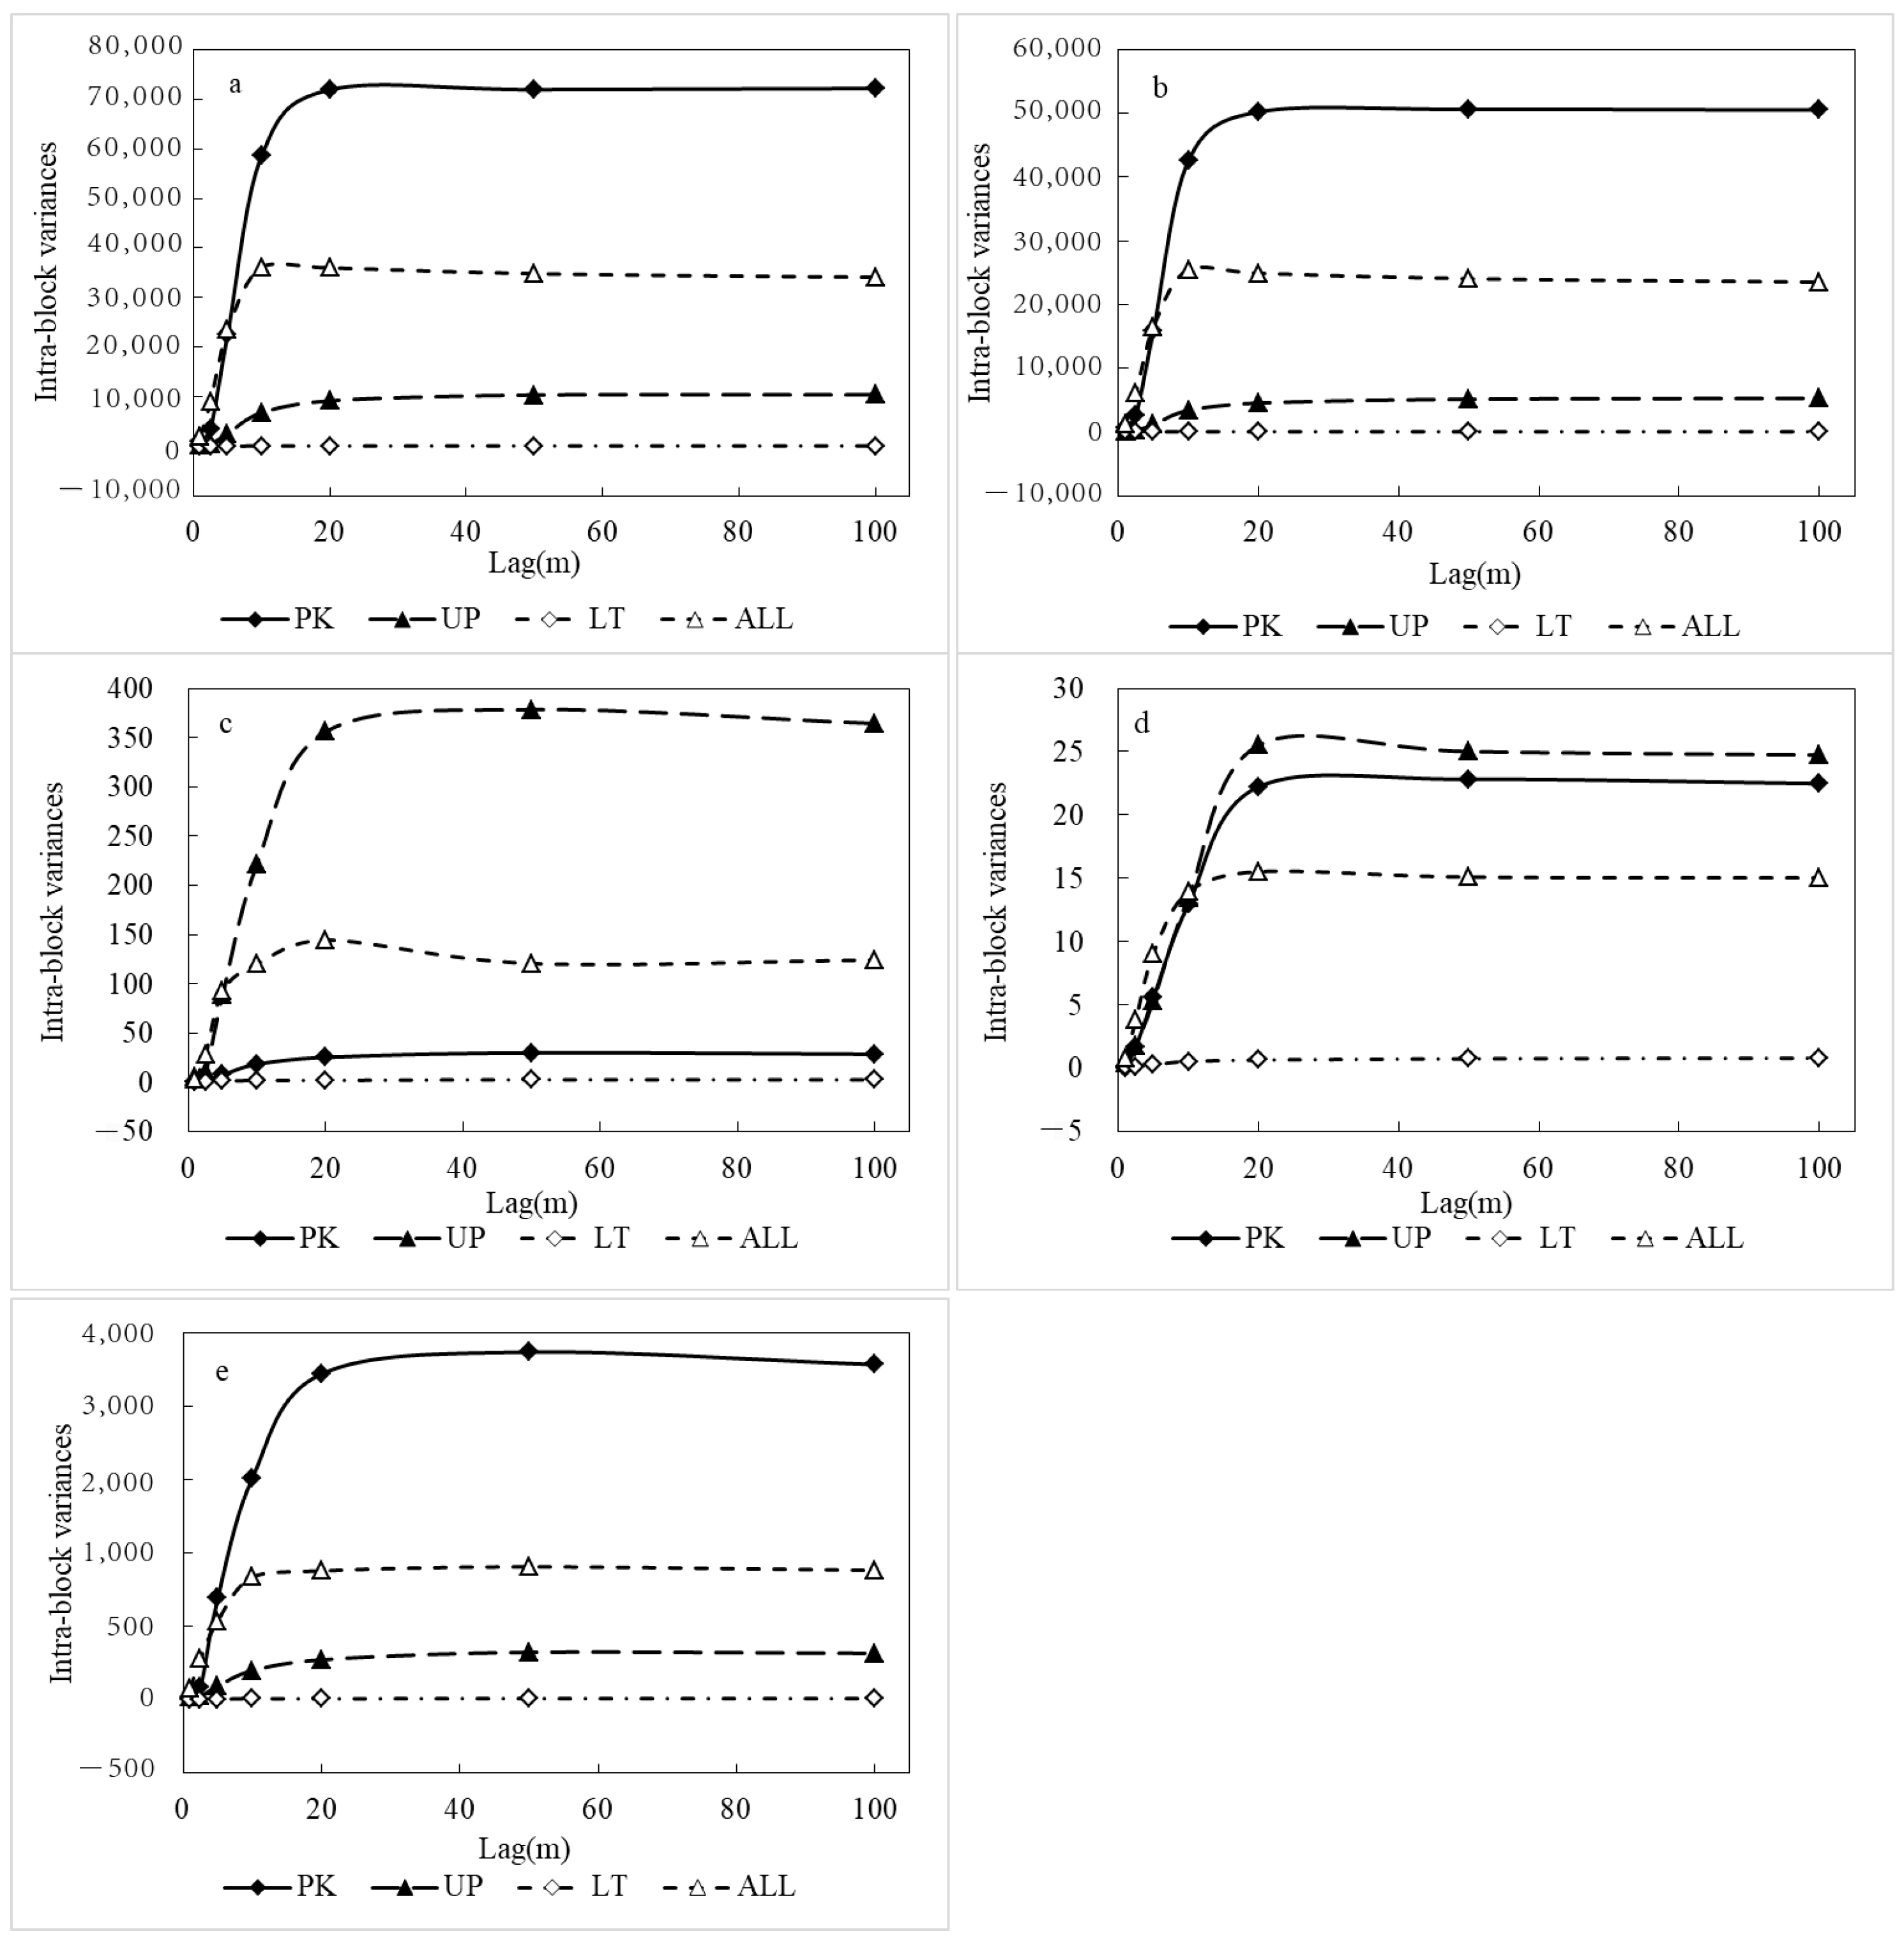
3.1. Spatial Heterogeneity of the Aboveground Biomass
3.2. Spatial Autocorrelation of the Aboveground Biomass
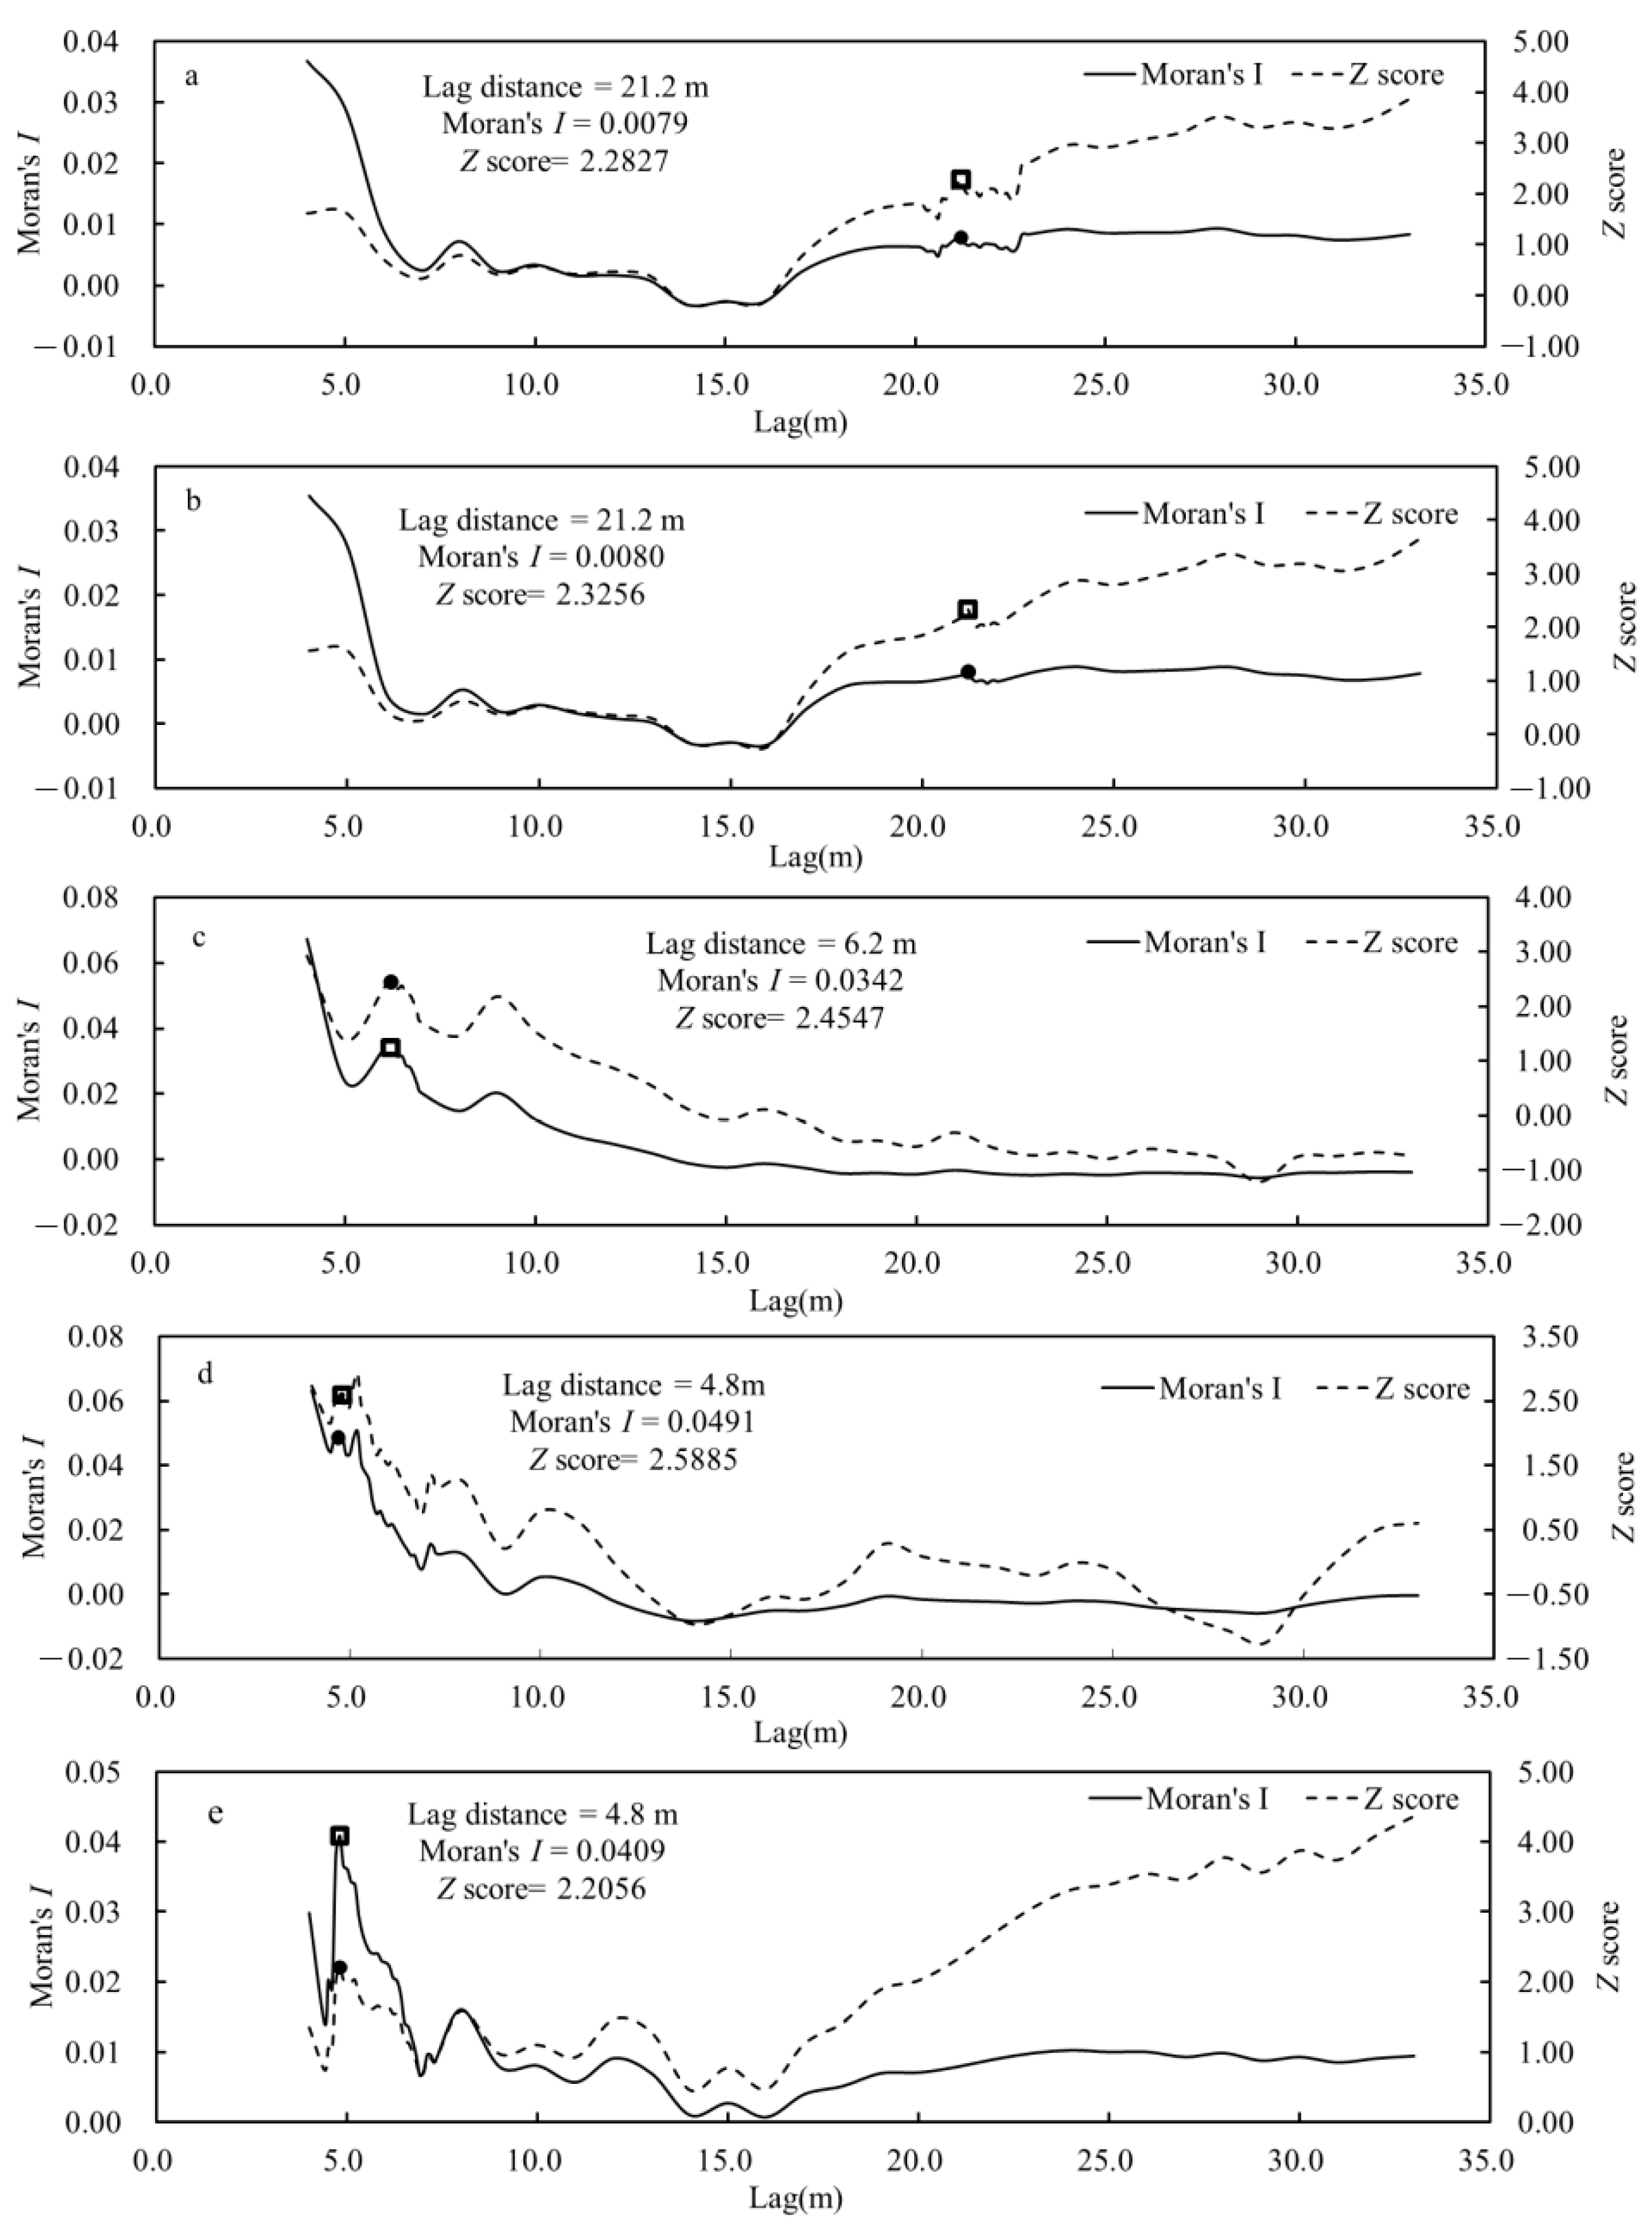
3.2.1. Global Moran’s I
3.2.2. Local Moran’s Ii
4. Discussion
4.1. Spatial Heterogeneity and Autocorrelation in the Tropical Natural Forest
4.2. Spatial Effect of the Different Components
4.3. Spatial Effect of the Different Tree Species
4.4. The Limits of the Study
5. Conclusions
Author Contributions
Funding
Institutional Review Board Statement
Informed Consent Statement
Data Availability Statement
Acknowledgments
Conflicts of Interest
References
- Pretzsch, H. Trees grow modulated by the ecological memory of their past growth. Consequences for monitoring, modelling, and silvicultural treatment. For. Ecol. Manag. 2021, 487, 118982. [Google Scholar] [CrossRef]
- Bhandari, S.K.; Veneklaas, E.J.; McCaw, L.; Mazanec, R.; Whitford, K.; Renton, M. Individual tree growth in jarrah (Eucalyptus marginata) forest is explained by size and distance of neighbouring trees in thinned and non-thinned plots. For. Ecol. Manag. 2021, 494, 119364. [Google Scholar] [CrossRef]
- Aussenac, R.; Bergeron, Y.; Gravel, D.; Drobyshev, I. Interactions among trees: A key element in the stabilising effect of species diversity on forest growth. Funct. Ecol. 2019, 33, 360–367. [Google Scholar] [CrossRef]
- Anselin, L.; Griffith, D.A. Do spatial effecfs really matter in regression analysis? Pap. Reg. Sci. 1988, 65, 11–34. [Google Scholar] [CrossRef]
- Zhang, L.; Shi, H. Local modeling of tree growth by geographically weighted regression. For. Sci. 2004, 50, 225–244. [Google Scholar]
- Stojanova, D.; Ceci, M.; Appice, A.; Malerba, D.; Džeroski, S. Dealing with spatial autocorrelation when learning predictive clustering trees. Ecol. Inform. 2013, 13, 22–39. [Google Scholar] [CrossRef] [Green Version]
- Anselin, L. Lagrange multiplier test diagnostics for spatial dependence and spatial heterogeneity. Geogr. Anal. 1988, 20, 1–17. [Google Scholar] [CrossRef]
- Chen, Y. New approaches for calculating Moran’s index of spatial autocorrelation. PLoS ONE 2013, 8, e68336. [Google Scholar] [CrossRef] [Green Version]
- Legendre, P. Spatial autocorrelation: Trouble or new paradigm? Ecology 1993, 74, 1659–1673. [Google Scholar] [CrossRef]
- Kashlak, A.B.; Yuan, W. Computation-free nonparametric testing for local spatial association with application to the US and Canadian electorate. Spat. Stat. 2022, 48, 100617. [Google Scholar] [CrossRef]
- Moran, P.A. Notes on continuous stochastic phenomena. Biometrika 1950, 37, 17–23. [Google Scholar] [CrossRef] [PubMed]
- Geary, R.C. The contiguity ratio and statistical mapping. Inc. Stat. 1954, 5, 115–146. [Google Scholar] [CrossRef]
- Getis, A.; Ord, J.K. The analysis of spatial association by use of distance statistics. Geogr. Anal. 1992, 24, 189–206. [Google Scholar] [CrossRef]
- Darand, M.; Dostkamyan, M.; Rehmani, M. Spatial autocorrelation analysis of extreme precipitation in Iran. Russ. Meteorol. Hydrol. 2017, 42, 415–424. [Google Scholar] [CrossRef]
- Sari, F.; Frananda, H.; Fransiska, S. Identification of Spatial Autocorrelation in the Poverty Level in West Pasaman Regency with Moran Index. J. Phys. Conf. Ser. 2020, 1554, 012052. [Google Scholar] [CrossRef]
- Anselin, L. Local indicators of spatial association—LISA. Geogr. Anal. 1995, 27, 93–115. [Google Scholar] [CrossRef]
- Dalposso, G.H.; Uribe-Opazo, M.A.; Mercante, E.; Lamparelli, R.A. Spatial autocorrelation of NDVI and GVI indices derived from Landsat/TM images for soybean crops in the western of the state of Paraná in 2004/2005 crop season. Eng. Agrícola 2013, 33, 525–537. [Google Scholar] [CrossRef] [Green Version]
- Shi, H.; Zhang, L. Local analysis of tree competition and growth. Forest Sci. 2003, 49, 938–955. [Google Scholar]
- Chas-AMil, M.L.; PresTeMon, J.P.; MccleAn, C.J.; TouzA, J. Human-ignited wildfire patterns and responses to policy shifts. Appl. Geogr. 2015, 56, 164–176. [Google Scholar] [CrossRef]
- Anselin, L.; Kelejian, H.H. Testing for spatial error autocorrelation in the presence of endogenous regressors. Int. Reg. Sci. Rev. 1997, 20, 153–182. [Google Scholar] [CrossRef] [Green Version]
- Yin, C.; Yuan, M.; Lu, Y.; Huang, Y.; Liu, Y. Effects of urban form on the urban heat island effect based on spatial regression model. Sci. Total Environ. 2018, 634, 696–704. [Google Scholar] [CrossRef] [PubMed]
- Liu, Z.; Jiang, F.; Zhu, Y.; Li, F.; Jin, G. Spatial heterogeneity of leaf area index in a temperate old-growth forest: Spatial autocorrelation dominates over biotic and abiotic factors. Sci. Total Environ. 2018, 634, 287–295. [Google Scholar] [CrossRef] [PubMed]
- Junttila, V.; Laine, M. Bayesian Principal Component Regression model with spatial effects for forest inventory under small field sample size. arXiv 2016, arXiv:1605.07439. [Google Scholar] [CrossRef]
- Ferré, C.; Castrignanò, A.; Comolli, R. Comparison between spatial and non-spatial regression models for investigating tree–soil relationships in a polycyclic tree plantation of Northern Italy and implications for management. Agrofor. Syst. 2019, 93, 2181–2196. [Google Scholar] [CrossRef]
- Klooster, D.J. Toward adaptive community forest management: Integrating local forest knowledge with scientific forestry. Econ. Geogr. 2002, 78, 43–70. [Google Scholar] [CrossRef]
- Pickett, S.T.; Cadenasso, M.L. Landscape ecology: Spatial heterogeneity in ecological systems. Science 1995, 269, 331–334. [Google Scholar] [CrossRef]
- Carey, A. Biocomplexity and restoration of biodiversity in temperate coniferous forest: Inducing spatial heterogeneity with variable-density thinning. Forestry 2003, 76, 127–136. [Google Scholar] [CrossRef] [Green Version]
- Assal, T.J.; Anderson, P.J.; Sibold, J. Spatial and temporal trends of drought effects in a heterogeneous semi-arid forest ecosystem. For. Ecol. Manag. 2016, 365, 137–151. [Google Scholar] [CrossRef] [Green Version]
- Beckage, B.; Clark, J.S. Seedling survival and growth of three forest tree species: The role of spatial heterogeneity. Ecology 2003, 84, 1849–1861. [Google Scholar] [CrossRef]
- Ngao, J.; Epron, D.; Delpierre, N.; Bréda, N.; Granier, A.; Longdoz, B. Spatial variability of soil CO2 efflux linked to soil parameters and ecosystem characteristics in a temperate beech forest. Agric. For. Meteorol. 2012, 154, 136–146. [Google Scholar] [CrossRef]
- Ward, J.S.; Parker, G.R.; Ferrandino, F.J. Long-term spatial dynamics in an old-growth deciduous forest. For. Ecol. Manag. 1996, 83, 189–202. [Google Scholar] [CrossRef]
- Brazhnik, K.; Shugart, H. Model sensitivity to spatial resolution and explicit light representation for simulation of boreal forests in complex terrain. Ecol. Model. 2017, 352, 90–107. [Google Scholar] [CrossRef]
- Gundale, M.J.; Metlen, K.L.; Fiedler, C.E.; DeLuca, T.H. Nitrogen spatial heterogeneity influences diversity following restoration in a ponderosa pine forest, Montana. Ecol. Appl. 2006, 16, 479–489. [Google Scholar] [CrossRef] [PubMed] [Green Version]
- Gossner, M.M.; Getzin, S.; Lange, M.; Pašalić, E.; Türke, M.; Wiegand, K.; Weisser, W.W. The importance of heterogeneity revisited from a multiscale and multitaxa approach. Biol. Conserv. 2013, 166, 212–220. [Google Scholar] [CrossRef]
- Hewitt, J.E.; Thrush, S.F.; Dayton, P.K.; Bonsdorff, E. The effect of spatial and temporal heterogeneity on the design and analysis of empirical studies of scale-dependent systems. Am. Nat. 2007, 169, 398–408. [Google Scholar] [CrossRef]
- Detto, M.; Asner, G.P.; Muller-Landau, H.C.; Sonnentag, O. Spatial variability in tropical forest leaf area density from multireturn lidar and modeling. J. Geophys. Res. Biogeosci. 2015, 120, 294–309. [Google Scholar] [CrossRef]
- Getzin, S.; Fischer, R.; Knapp, N.; Huth, A. Using airborne LiDAR to assess spatial heterogeneity in forest structure on Mount Kilimanjaro. Landsc. Ecol. 2017, 32, 1881–1894. [Google Scholar] [CrossRef]
- Clark, P.J.; Evans, F.C. Distance to nearest neighbor as a measure of spatial relationships in populations. Ecology 1954, 35, 445–453. [Google Scholar] [CrossRef]
- Madden, L.; Hughes, G.; Ellis, M. Spatial heterogeneity of the incidence of grape downy mildew. Phytopathology 1995, 85, 269–275. [Google Scholar] [CrossRef]
- Perry, G.L.; Miller, B.P.; Enright, N.J. A comparison of methods for the statistical analysis of spatial point patterns in plant ecology. Plant Ecol. 2006, 187, 59–82. [Google Scholar] [CrossRef]
- Fotheringham, A.S. Trends in quantitative methods I: Stressing the local. Prog. Hum. Geogr. 1997, 21, 88–96. [Google Scholar] [CrossRef]
- Fotheringham, A.S. “The problem of spatial autocorrelation” and local spatial statistics. Geogr. Anal. 2009, 41, 398–403. [Google Scholar] [CrossRef]
- Yang, X.; Han, Y. Spatial heterogeneity of soil nitrogen in six natural secondary forests in mountainous region of northern China. Sci. Soil Water Conserv. 2010, 8, 95–102. [Google Scholar]
- Lamsal, S.; Rizzo, D.; Meentemeyer, R. Spatial variation and prediction of forest biomass in a heterogeneous landscape. J. For. Res. 2012, 23, 13–22. [Google Scholar] [CrossRef]
- Fotheringham, A.S.; Charlton, M.E.; Brunsdon, C. Geographically weighted regression: A natural evolution of the expansion method for spatial data analysis. Environ. Plan. A 1998, 30, 1905–1927. [Google Scholar] [CrossRef]
- Wang, Q.; Ni, J.; Tenhunen, J. Application of a geographically-weighted regression analysis to estimate net primary production of Chinese forest ecosystems. Glob. Ecol. Biogeogr. 2005, 14, 379–393. [Google Scholar] [CrossRef]
- Zhang, J.; Cheng, G.; Yu, F.; Kräuchi, N.; Li, M.-H. Interspecific variations in responses of Festuca rubra and Trifolium pratense to a severe clipping under environmental changes. Biologia 2009, 64, 292–298. [Google Scholar] [CrossRef]
- Nazeer, M.; Bilal, M. Evaluation of ordinary least square (OLS) and geographically weighted regression (GWR) for water quality monitoring: A case study for the estimation of salinity. J. Ocean. Univ. China 2018, 17, 305–310. [Google Scholar] [CrossRef]
- Pradhan, B.; Youssef, A.M. Manifestation of remote sensing data and GIS on landslide hazard analysis using spatial-based statistical models. Arab. J. Geosci. 2010, 3, 319–326. [Google Scholar] [CrossRef]
- Dale, M.R.; Fortin, M.-J. Spatial Analysis: A Guide for Ecologists; Cambridge University Press: Cambridge, UK, 2014. [Google Scholar]
- Zhang, B.; Ou, G.; Sun, X.; Xu, T.; Xu, H. Application of Spatial Effect and Regression Model on Forestry Research. J. Southwest For. Univ. 2016, 36, 144–152. [Google Scholar]
- Liu, C. Spatial Distribution of Forest Carbon Storage in Heilongjiang Province; Northeast Forestry University: Harbin, China, 2014. [Google Scholar]
- Zhou, L.; Ou, G.; Wang, J.; Xu, H. Light Saturation Point Determination and Biomass Remote Sensing Estimation of Pinus kesiya var. langbianensis Forest Based on Spatial Regression Models. Sci. Silvae Sin. 2020, 56, 38–47. [Google Scholar]
- Ou, G.L.; Wang, J.F.; Xiao, Y.F.; Xu, H. Modeling Individual Biomass of Pinus kesiya var.langbianensis Natural Forests by Geographically Weighted Regression. For. Res. 2014, 27, 213–218. [Google Scholar] [CrossRef]
- Ou, G.; Wang, J.; Xu, H.; Chen, K.; Zheng, H.; Zhang, B.; Sun, X.; Xu, T.; Xiao, Y. Incorporating topographic factors in nonlinear mixed-effects models for aboveground biomass of natural Simao pine in Yunnan, China. J. For. Res. 2016, 27, 119–131. [Google Scholar] [CrossRef]
- Lu, J.; Zhang, L. Evaluation of parameter estimation methods for fitting spatial regression models. For. Sci. 2010, 56, 505–514. [Google Scholar]
- Lu, J.; Zhang, L. Modeling and prediction of tree height–diameter relationships using spatial autoregressive models. For. Sci. 2011, 57, 252–264. [Google Scholar] [CrossRef]
- Lu, J.; Zhang, L. Geographically local linear mixed models for tree height-diameter relationship. For. Sci. 2012, 58, 75–84. [Google Scholar] [CrossRef]
- Gu, F.; Zhao, Q. Geographically weighted regression model for expressing tree growth relationships. J. Northeast For. Univ. 2012, 40, 129–140. [Google Scholar]
- Zhang, L.; Gove, J.H.; Heath, L.S. Spatial residual analysis of six modeling techniques. Ecol. Model. 2005, 186, 154–177. [Google Scholar] [CrossRef]
- Zhang, L.; Ma, Z.; Guo, L. An evaluation of spatial autocorrelation and heterogeneity in the residuals of six regression models. For. Sci. 2009, 55, 533–548. [Google Scholar]
- Meng, Q.; Cieszewski, C.J.; Strub, M.R.; Borders, B.E. Spatial regression modeling of tree height–diameter relationships. Can. J. For. Res. 2009, 39, 2283–2293. [Google Scholar] [CrossRef]
- Soto, D.P.; Salas, C.; Donoso, P.J.; Uteau, D. Structural and spatial heterogeneity of a mixed Nothofagus donibeyi-dominate forest stand after a partial disturbance. Rev. Chil. Hist. Nat. 2010, 83, 335–347. [Google Scholar]
- Rozas, V. Structural heterogeneity and tree spatial patterns in an old-growth deciduous lowland forest in Cantabria, northern Spain. Plant Ecol. 2006, 185, 57–72. [Google Scholar] [CrossRef]
- Pearce, H.; Anderson, W.; Fogarty, L.; Todoroki, C.; Anderson, S. Linear mixed-effects models for estimating biomass and fuel loads in shrublands. Can. J. For. Res. 2010, 40, 2015–2026. [Google Scholar] [CrossRef]
- Chai, Z. Quantitative Evaluation and R Programming of Forest Spatial Structure Based on the Relationship of Neighborhood Trees: A Case Study of Typical Secondary Forest in the Mid-Altitude Zone of the Qinling Mountains; Northwest A&F University: Yangling, China, 2016. [Google Scholar]
- Nong, M.; Leng, Y.; Xu, H.; Li, C.; Ou, G. Incorporating competition factors in a mixed-effect model with random effects of site quality for individual tree above-ground biomass growth of Pinus kesiya var. langbianensis. N. Z. J. For. Sci. 2019, 49. [Google Scholar] [CrossRef] [Green Version]
- Chen, Q.; Zheng, Z.; Feng, Z.; Ma, Y.; Sha, L.; Xu, H.; Nong, P.; Li, Z. Biomass and carbon storage of Pinus kesiya var. langbianensis in Puer, Yunnan. J. Yunnan Univ.-Nat. Sci. Ed. 2014, 36, 439–445. [Google Scholar]
- Fan, Y.; Zhang, S.; Lan, Z.; Lan, Q. Possible causes for the differentiation of Pinus yunnanensis and P. Kesiya var. Langbianensis in Yunnan, China: Evidence from seed germination. For. Ecol. Manag. 2021, 494, 119321. [Google Scholar]
- Flora of China Editorial Committee. Flora of China. 2018. Available online: http://www.efloras.org/flora_page.asp (accessed on 30 August 2018).
- Chen, G.; Zhang, X.; Liu, C.; Liu, C.; Xu, H.; Ou, G. Error Analysis on the Five Stand Biomass Growth Estimation Methods for a Sub-Alpine Natural Pine Forest in Yunnan, Southwestern China. Forests 2022, 13, 1637. [Google Scholar] [CrossRef]
- Nong, M. Comparative Analysis on the Spatial Effects of Individualtree Biomass in Typical Subtropical Forests; Southwest Forestry University: Kunming, China, 2020. [Google Scholar]
- Lieshout, M.v. AJ-function for marked point patterns. Ann. Inst. Stat. Math. 2006, 58, 235–259. [Google Scholar] [CrossRef]
- Turner, M.G.; Donato, D.C.; Romme, W.H. Consequences of spatial heterogeneity for ecosystem services in changing forest landscapes: Priorities for future research. Landsc. Ecol. 2013, 28, 1081–1097. [Google Scholar] [CrossRef]
- Du, H.; Zhou, G.; Fan, W.; Ge, H.; Xu, X.; Shi, Y.; Fan, W. Spatial heterogeneity and carbon contribution of aboveground biomass of moso bamboo by using geostatistical theory. Plant Ecol. 2010, 207, 131–139. [Google Scholar] [CrossRef]
- Wang, W.; Dong, X.; Dong, X.; Lv, D.; Su, T.; Zheng, A. Study on spatial autocorrelation of forest biomass. For. Eng. 2018, 34, 35–39. [Google Scholar]
- Liu, K.; Jiang, S.; Zhu, W. Estimation of carbon sequestration value and analysis of space effect of forests in Guangdong Province. Chin. J. Agric. Resour. Reg. Plan. 2015, 36, 120. [Google Scholar]
- Frelich, L.E.; Calcote, R.R.; Davis, M.B.; Pastor, J. Patch formation and maintenance in an old-growth hemlock-hardwood forest. Ecology 1993, 74, 513–527. [Google Scholar] [CrossRef]
- Park, A.; Kneeshaw, D.; Bergeron, Y.; Leduc, A. Spatial relationships and tree species associations across a 236-year boreal mixedwood chronosequence. Can. J. For. Res. 2005, 35, 750–761. [Google Scholar] [CrossRef] [Green Version]
- Rödig, E.; Cuntz, M.; Heinke, J.; Rammig, A.; Huth, A. Spatial heterogeneity of biomass and forest structure of the Amazon rain forest: Linking remote sensing, forest modelling and field inventory. Glob. Ecol. Biogeogr. 2017, 26, 1292–1302. [Google Scholar] [CrossRef]
- Han, N.; Du, H.; Zhou, G.; Xu, X.; Cui, R.; Gu, C. Spatiotemporal heterogeneity of Moso bamboo aboveground carbon storage with Landsat Thematic Mapper images: A case study from Anji County, China. Int. J. Remote Sens. 2013, 34, 4917–4932. [Google Scholar] [CrossRef]
- Xu, Q.; Li, B.; McRoberts, R.E.; Li, Z.; Hou, Z. Harnessing data assimilation and spatial autocorrelation for forest inventory. Remote Sens. Environ. 2023, 288, 113488. [Google Scholar] [CrossRef]
- Zhou, Z.; Tang, Y.; Xu, H.; Wang, J.; Hu, L.; Xu, X. Dynamic changes in leaf biomass and the modeling of individual Moso Bamboo (Phyllostachys edulis (Carrière) J. Houz) under intensive management. Forests 2022, 13, 693. [Google Scholar] [CrossRef]
- Nötzold, R.; Blossey, B.; Newton, E. The influence of below ground herbivory and plant competition on growth and biomass allocation of purple loosestrife. Oecologia 1997, 113, 82–93. [Google Scholar] [CrossRef]
- Pattison, R.; Goldstein, G.; Ares, A. Growth, biomass allocation and photosynthesis of invasive and native Hawaiian rainforest species. Oecologia 1998, 117, 449–459. [Google Scholar] [CrossRef]
- Wu, H.; Xu, H.; Tian, X.; Zhang, W.; Lu, C. Multistage Sampling and Optimization for Forest Volume Inventory Based on Spatial Autocorrelation Analysis. Forests 2023, 14, 250. [Google Scholar] [CrossRef]
- Wang, J.; Haining, R.; Cao, Z. Sample surveying to estimate the mean of a heterogeneous surface: Reducing the error variance through zoning. Int. J. Geogr. Inf. Sci. 2010, 24, 523–543. [Google Scholar] [CrossRef]
- Holmberg, H.; Lundevaller, E.H. A test for robust detection of residual spatial autocorrelation with application to mortality rates in Sweden. Spat. Stat. 2015, 14, 365–381. [Google Scholar] [CrossRef]
- Wulder, M.A.; White, J.C.; Coops, N.C.; Nelson, T.; Boots, B. Using local spatial autocorrelation to compare outputs from a forest growth model. Ecol. Model. 2007, 209, 264–276. [Google Scholar] [CrossRef]
- Bebre, I.; Annighöfer, P.; Ammer, C.; Seidel, D. Growth, morphology, and biomass allocation of recently planted seedlings of seven European tree species along a light gradient. iFor.-Biogeosci. For. 2020, 13, 261–269. [Google Scholar] [CrossRef]
- Ren, J.; Wang, H.; Wang, W.; Qu, D.; Wang, Q.; Zhong, Z. Responses of photosynthesis, chlorophyll fluorescence of poplar leaf and bark chlorenchyma to elevated temperature. Bull. Bot. Res. 2014, 34, 758–764. [Google Scholar]


| Location | Latitude | Longitude | Altitude (m) | Slope Degree (°) | Aspect of Slope (°) |
|---|---|---|---|---|---|
| Yutang | 23°9′58.2″ N | 101°29′14.4″ E | 1530 | 22 | 298 |
| Trees or Trees Group | Age (Years) | Height (m) | DBH (cm) | Biomass (kg) | |||||
|---|---|---|---|---|---|---|---|---|---|
| Wood | Bark | Branches | Foliage | Aboveground | |||||
| Pinus kesiya var. langbianensis (n = 132) | Mean | 37 | 17.05 | 24.26 | 236.44 | 6.78 | 37.24 | 4.45 | 284.91 |
| Std. Err. | 10 | 4.58 | 9.93 | 224.73 | 5.33 | 47.83 | 4.74 | 268.62 | |
| Min. | 16 | 6.80 | 7.00 | 3.29 | 0.14 | 0.51 | 0.06 | 4.07 | |
| Max. | 66 | 25.60 | 45.10 | 1075.79 | 34.49 | 307.23 | 23.39 | 1180.42 | |
| Other upper trees (n = 119) | Mean | 25 | 9.97 | 14.76 | 55.24 | 15.16 | 13.62 | 3.45 | 87.47 |
| Std. Err. | 10 | 4.21 | 7.76 | 72.61 | 19.09 | 17.78 | 4.97 | 102.08 | |
| Min. | 5 | 3.30 | 3.40 | 0.82 | 0.29 | 0.07 | 0.02 | 1.74 | |
| Max. | 48 | 21.50 | 36.00 | 368.49 | 88.85 | 103.17 | 31.70 | 482.72 | |
| Other lower trees (n = 261) | Mean | 16 | 6.36 | 6.73 | 5.97 | 1.32 | 1.77 | 0.54 | 9.60 |
| Std. Err. | 5 | 1.66 | 2.62 | 6.81 | 1.55 | 2.74 | 0.89 | 11.09 | |
| Min. | 5 | 2.20 | 4.00 | 0.83 | 0.07 | 0.03 | 0.00 | 1.22 | |
| Max. | 35 | 12.00 | 21.00 | 44.20 | 10.57 | 21.04 | 7.67 | 71.80 | |
| Total (n = 512) | Mean | 24 | 9.95 | 13.12 | 76.84 | 5.95 | 13.67 | 2.22 | 98.68 |
| Std. Err. | 12 | 5.53 | 9.81 | 153.31 | 11.14 | 29.71 | 3.88 | 184.67 | |
| Min. | 5 | 2.20 | 3.40 | 0.82 | 0.07 | 0.03 | 0.00 | 1.22 | |
| Max. | 66 | 25.60 | 45.10 | 1075.79 | 88.85 | 307.23 | 31.70 | 1180.42 | |
| Tree Types | Components | NS | HH | HL | LH | LL | |||||
|---|---|---|---|---|---|---|---|---|---|---|---|
| N | P (%) | N | P (%) | N | P (%) | N | P (%) | N | P (%) | ||
| PK | Wood | 102 | 77.27 | 11 | 8.33 | 19 | 14.39 | 0 | 0.00 | 0 | 0.00 |
| Bark | 128 | 96.97 | 4 | 3.03 | 0 | 0.00 | 0 | 0.00 | 0 | 0.00 | |
| Branches | 118 | 89.39 | 8 | 6.06 | 5 | 3.79 | 1 | 0.76 | 0 | 0.00 | |
| Foliage | 116 | 87.88 | 15 | 11.36 | 1 | 0.76 | 0 | 0.00 | 0 | 0.00 | |
| Aboveground | 103 | 78.03 | 12 | 9.09 | 17 | 12.88 | 0 | 0.00 | 0 | 0.00 | |
| UP | Wood | 117 | 98.32 | 2 | 1.68 | 0 | 0.00 | 0 | 0.00 | 0 | 0.00 |
| Bark | 99 | 83.19 | 15 | 12.61 | 5 | 4.20 | 0 | 0.00 | 0 | 0.00 | |
| Branches | 119 | 100.00 | 0 | 0.00 | 0 | 0.00 | 0 | 0.00 | 0 | 0.00 | |
| Foliage | 115 | 96.64 | 1 | 0.84 | 3 | 2.52 | 0 | 0.00 | 0 | 0.00 | |
| Aboveground | 117 | 98.32 | 2 | 1.68 | 0 | 0.00 | 0 | 0.00 | 0 | 0.00 | |
| LT | Wood | 261 | 100.00 | 0 | 0.00 | 0 | 0.00 | 0 | 0.00 | 0 | 0.00 |
| Bark | 258 | 98.85 | 0 | 0.00 | 0 | 0.00 | 3 | 1.15 | 0 | 0.00 | |
| Branches | 259 | 99.23 | 0 | 0.00 | 0 | 0.00 | 2 | 0.77 | 0 | 0.00 | |
| Foliage | 260 | 99.62 | 0 | 0.00 | 0 | 0.00 | 1 | 0.38 | 0 | 0.00 | |
| Aboveground | 261 | 100.00 | 0 | 0.00 | 0 | 0.00 | 0 | 0.00 | 0 | 0.00 | |
| ALL | Wood | 480 | 93.75 | 13 | 2.54 | 19 | 3.71 | 0 | 0.00 | 0 | 0.00 |
| Bark | 485 | 94.73 | 19 | 3.71 | 5 | 0.98 | 3 | 0.59 | 0 | 0.00 | |
| Branches | 496 | 96.88 | 8 | 1.56 | 5 | 0.98 | 3 | 0.59 | 0 | 0.00 | |
| Foliage | 491 | 95.90 | 16 | 3.13 | 4 | 0.78 | 1 | 0.20 | 0 | 0.00 | |
| Aboveground | 481 | 93.95 | 14 | 2.73 | 17 | 3.32 | 0 | 0.00 | 0 | 0.00 | |
| Tree Species | Indices | Wood | Bark | Foliage | Branches | Aboveground |
|---|---|---|---|---|---|---|
| Pinus kesiya var. langbianensis | Mean | −0.45 | 0.10 | 0.39 | 0.17 | −0.42 |
| Std. Err. | 0.23 | 0.07 | 0.20 | 0.21 | 0.23 | |
| Skewness | 0.01 | 2.52 | 2.87 | 3.25 | −0.03 | |
| Kurtosis | 2.72 | 13.59 | 11.83 | 15.04 | 2.18 | |
| Min. | −10.32 | −2.06 | −3.87 | −4.58 | −9.67 | |
| Max. | 8.43 | 4.94 | 12.73 | 14.35 | 8.12 | |
| Other upper trees | Mean | 0.15 | 0.82 | −0.07 | −0.04 | 0.07 |
| Std. Err. | 0.09 | 0.31 | 0.11 | 0.06 | 0.10 | |
| Skewness | 1.78 | 3.81 | 0.16 | −2.42 | 0.50 | |
| Kurtosis | 12.72 | 17.68 | 9.87 | 10.13 | 4.56 | |
| Min. | −3.02 | −3.71 | −6.06 | −3.76 | −3.06 | |
| Max. | 6.49 | 20.07 | 6.14 | 1.26 | 5.40 | |
| Other lower trees | Mean | 0.26 | 0.08 | 0.09 | 0.11 | 0.28 |
| Std. Err. | 0.05 | 0.05 | 0.05 | 0.04 | 0.05 | |
| Skewness | −0.72 | −2.05 | −2.59 | −4.19 | −0.86 | |
| Kurtosis | 0.18 | 7.46 | 11.12 | 28.11 | 0.79 | |
| Min. | −2.60 | −4.64 | −4.23 | −5.00 | −3.24 | |
| Max. | 1.53 | 1.25 | 1.44 | 1.00 | 1.70 | |
| Total | Mean | 0.05 | 0.26 | 0.13 | 0.09 | 0.05 |
| Std. Err. | 0.07 | 0.08 | 0.06 | 0.06 | 0.07 | |
| Skewness | −0.56 | 6.64 | 3.15 | 4.67 | −0.63 | |
| Kurtosis | 9.76 | 64.72 | 26.56 | 46.34 | 7.90 | |
| Min. | −10.32 | −4.64 | −6.06 | −5.00 | −9.67 | |
| Max. | 8.43 | 20.07 | 12.73 | 14.35 | 8.12 |
Disclaimer/Publisher’s Note: The statements, opinions and data contained in all publications are solely those of the individual author(s) and contributor(s) and not of MDPI and/or the editor(s). MDPI and/or the editor(s) disclaim responsibility for any injury to people or property resulting from any ideas, methods, instructions or products referred to in the content. |
© 2023 by the authors. Licensee MDPI, Basel, Switzerland. This article is an open access article distributed under the terms and conditions of the Creative Commons Attribution (CC BY) license (https://creativecommons.org/licenses/by/4.0/).
Share and Cite
Zhang, X.; Chen, G.; Liu, C.; Fan, Q.; Li, W.; Wu, Y.; Xu, H.; Ou, G. Spatial Effects Analysis on Individual-Tree Aboveground Biomass in a Tropical Pinus kesiya var. langbianensis Natural Forest in Yunnan, Southwestern China. Forests 2023, 14, 1177. https://doi.org/10.3390/f14061177
Zhang X, Chen G, Liu C, Fan Q, Li W, Wu Y, Xu H, Ou G. Spatial Effects Analysis on Individual-Tree Aboveground Biomass in a Tropical Pinus kesiya var. langbianensis Natural Forest in Yunnan, Southwestern China. Forests. 2023; 14(6):1177. https://doi.org/10.3390/f14061177
Chicago/Turabian StyleZhang, Xilin, Guoqi Chen, Chunxiao Liu, Qinling Fan, Wenfang Li, Yong Wu, Hui Xu, and Guanglong Ou. 2023. "Spatial Effects Analysis on Individual-Tree Aboveground Biomass in a Tropical Pinus kesiya var. langbianensis Natural Forest in Yunnan, Southwestern China" Forests 14, no. 6: 1177. https://doi.org/10.3390/f14061177
APA StyleZhang, X., Chen, G., Liu, C., Fan, Q., Li, W., Wu, Y., Xu, H., & Ou, G. (2023). Spatial Effects Analysis on Individual-Tree Aboveground Biomass in a Tropical Pinus kesiya var. langbianensis Natural Forest in Yunnan, Southwestern China. Forests, 14(6), 1177. https://doi.org/10.3390/f14061177