
Soy Consumption, but Not Dairy Consumption, Is Inversely Associated with Fatty Acid Desaturase Activity in Young Adults

 , ,
, , 
Abstract
:1. Introduction
2. Materials and Methods
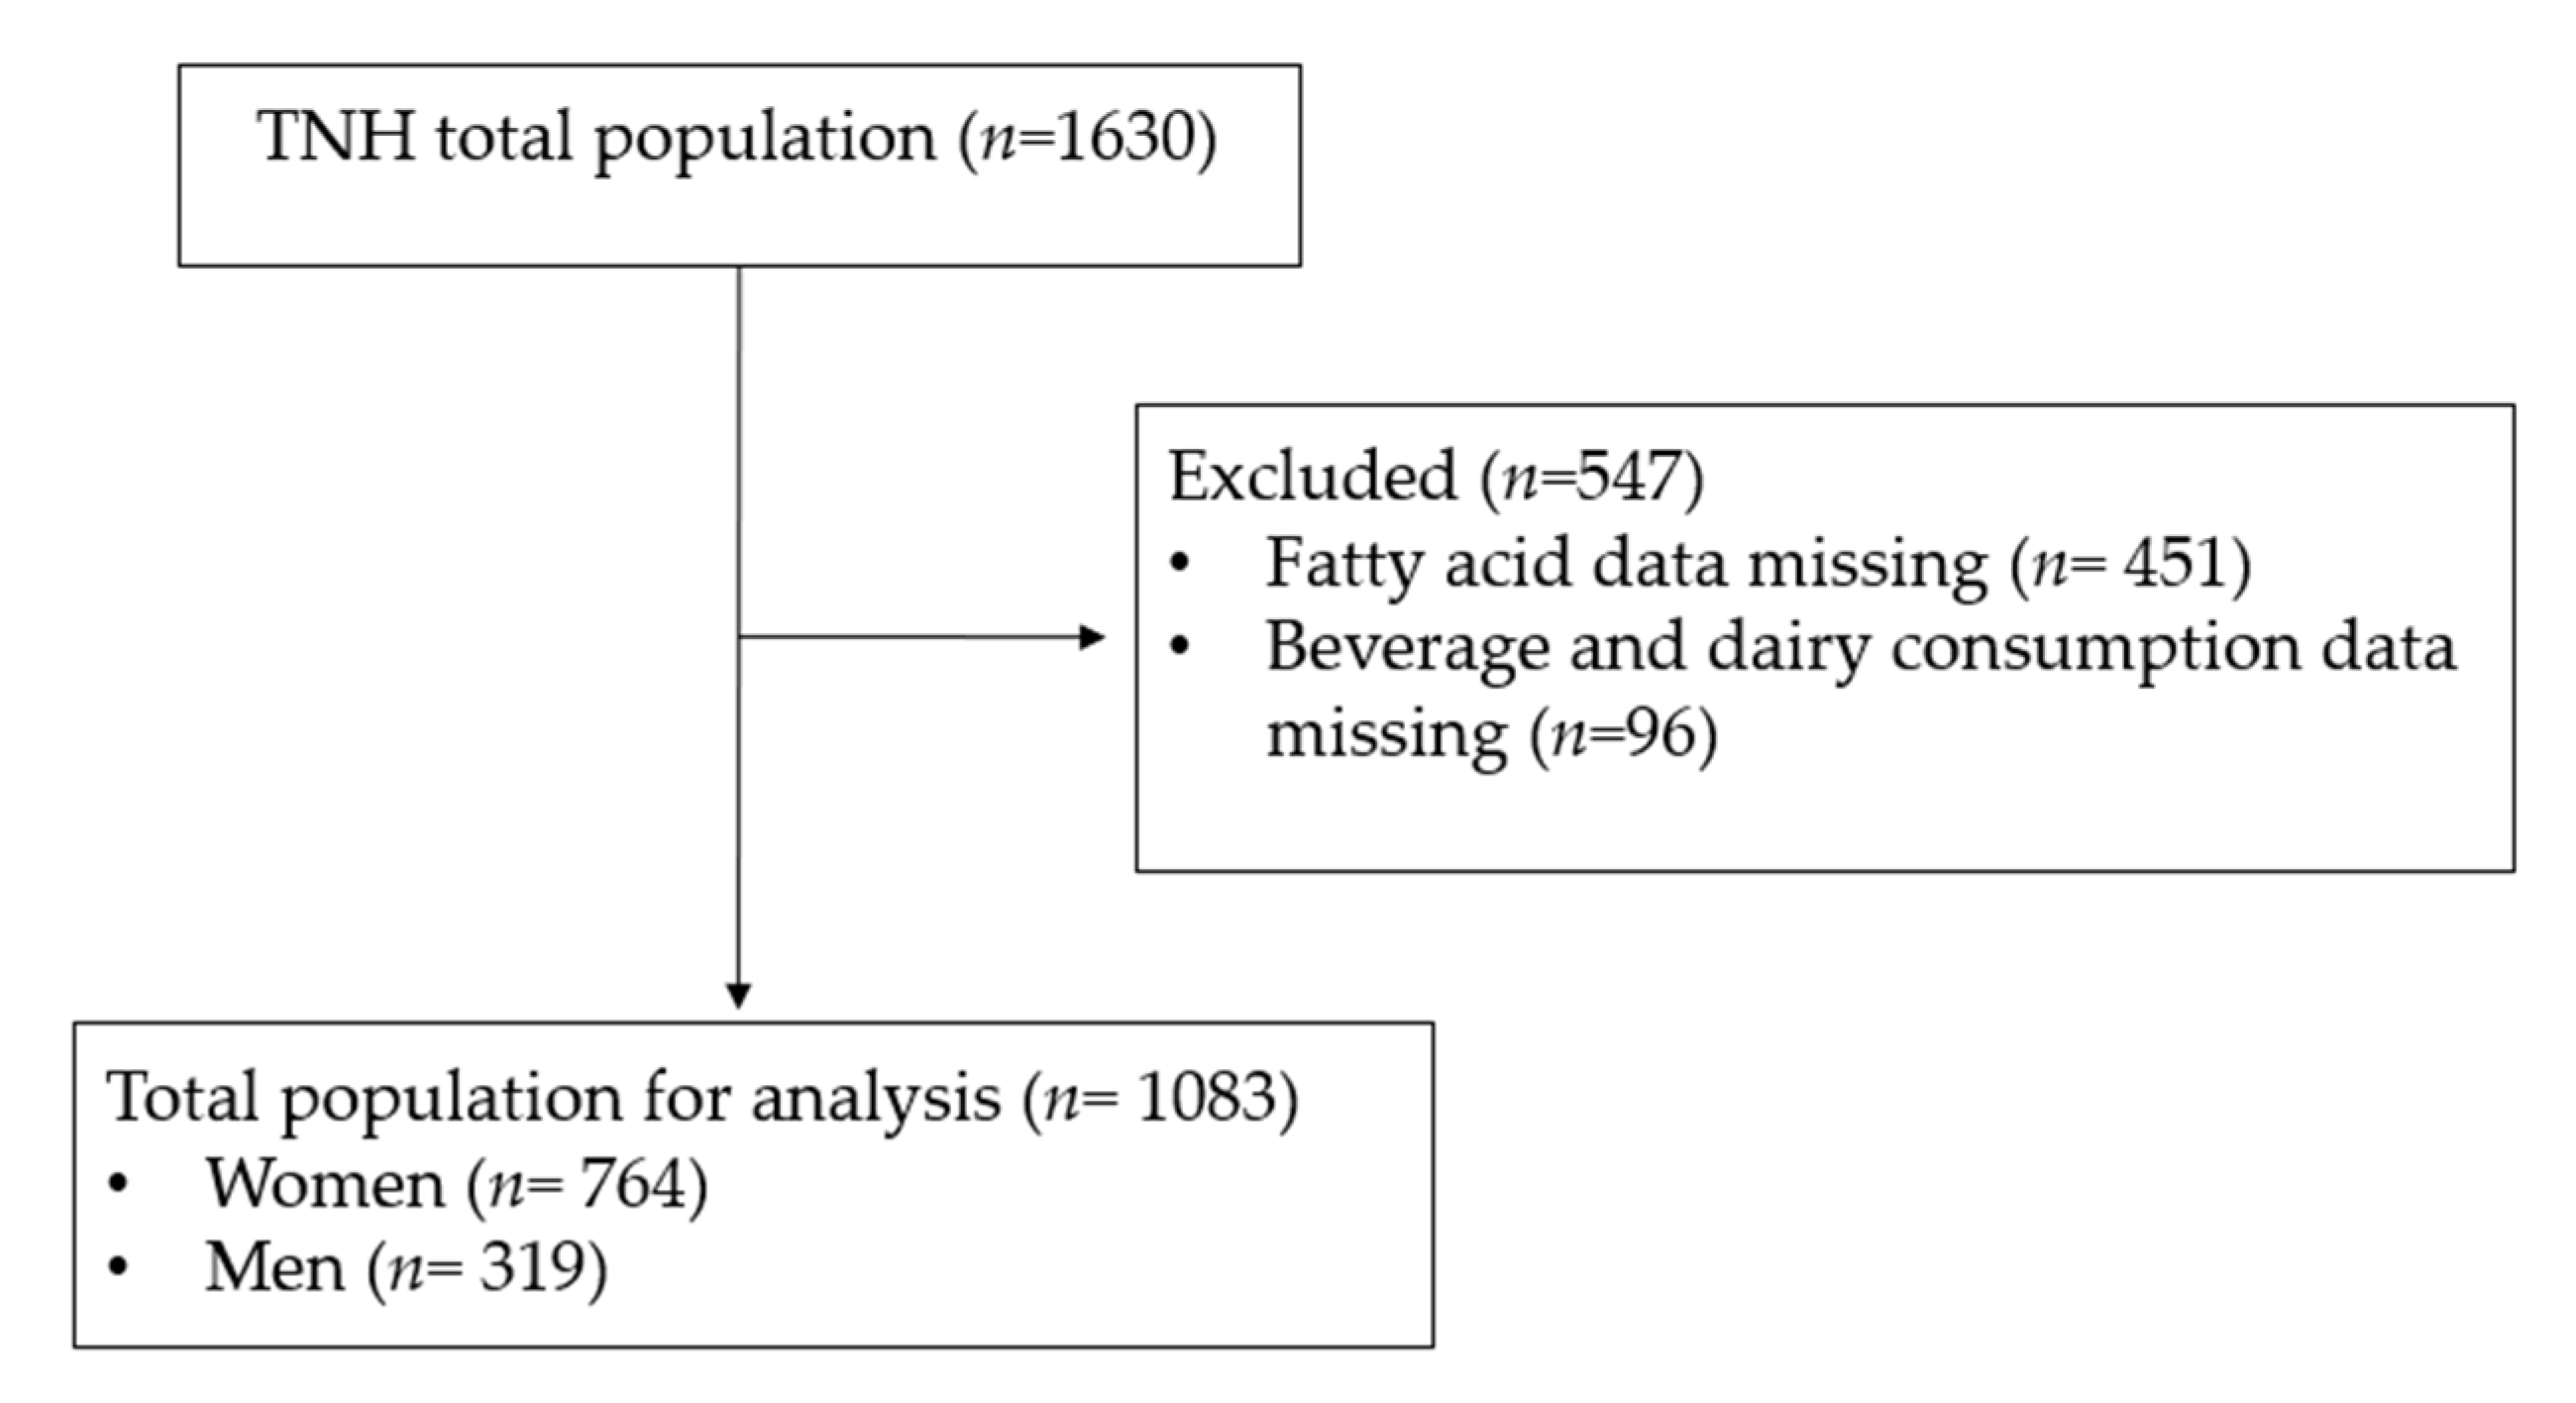
2.1. Study Population
2.2. Dietary Intake Assessment
2.3. Fluid Milk versus Soy Beverage Analysis
2.4. Total Dairy and Total Soy Analysis
2.5. Anthropometric and Clinical Measurements
2.6. Plasma Fatty Acid Analysis
2.7. Statistical Analysis
3. Results
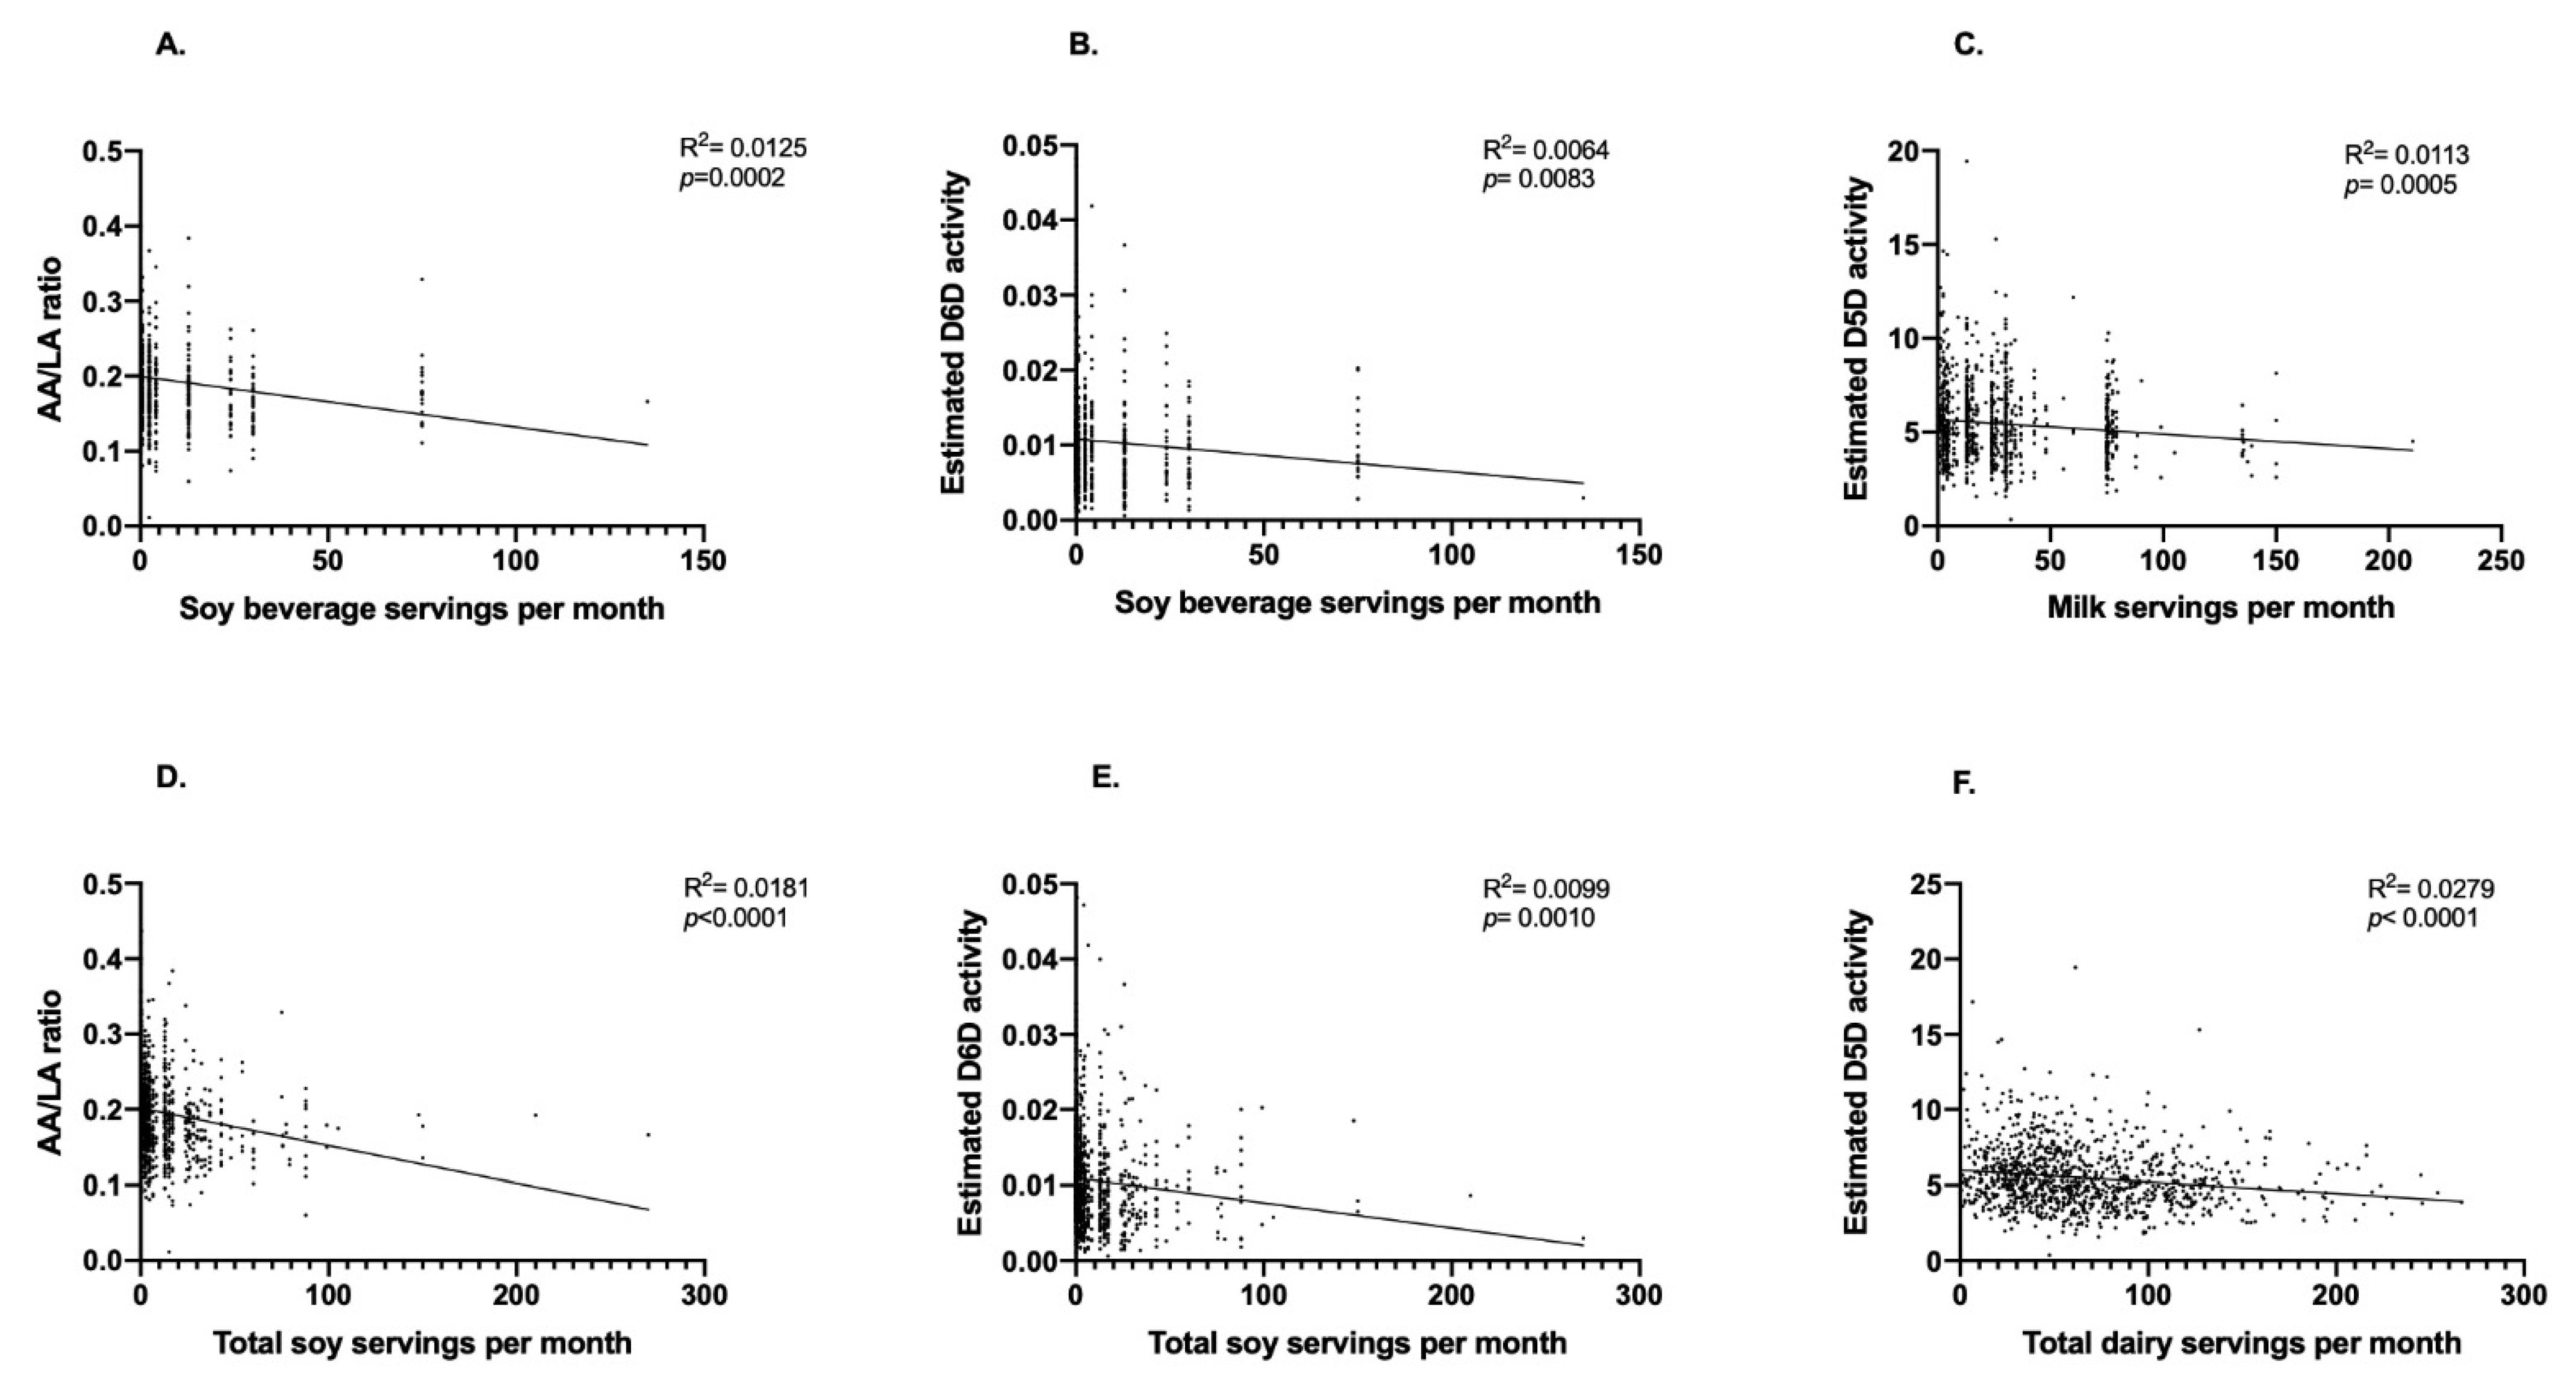
3.1. Correlations between Soy and Dairy Beverage and Food Consumption and Desaturation Indices
3.2. Influence of Fluid Milk and Soy Beverage Consumption on Plasma Fatty Acids and Related Ratios
3.3. Fatty Acid Levels and Desaturation Indices by Total Dairy and Soy Consumption Groups
4. Discussion
5. Conclusions
Author Contributions
Funding
Institutional Review Board Statement
Informed Consent Statement
Data Availability Statement
Acknowledgments
Conflicts of Interest
References
- Haug, A.; Høstmark, A.T.; Harstad, O.M. Bovine milk in human nutrition—A review. Lipids Health Dis. 2007, 6, 25. [Google Scholar] [CrossRef] [Green Version]
- Pierre, M.S. Changes in Canadians’ preferences for milk and dairy products. Stat. Can. Available online: https://www150.statcan.gc.ca/n1/pub/21-004-x/2017001/article/14786-eng.htm (accessed on 23 November 2020).
- Vatanparast, H.; Islam, N.; Patil, R.P.; Shamloo, A.; Keshavarz, P.; Smith, J.; Whiting, S. Consumption of Yogurt in Canada and Its Contribution to Nutrient Intake and Diet Quality Among Canadians. Nutrients 2019, 11, 1203. [Google Scholar] [CrossRef] [PubMed] [Green Version]
- Auclair, O.; Han, Y.; Burgos, S.A. Consumption of Milk and Alternatives and Their Contribution to Nutrient Intakes among Canadian Adults: Evidence from the 2015 Canadian Community Health Survey—Nutrition. Nutrients 2019, 11, 1948. [Google Scholar] [CrossRef] [PubMed] [Green Version]
- Lordan, R.; Tsoupras, A.; Mitra, B.; Zabetakis, I. Dairy fats and cardiovascular disease: Do we really need to be concerned? Foods 2018, 7, 29. [Google Scholar] [CrossRef] [PubMed] [Green Version]
- Alexander, D.D.; Bylsma, L.C.; Vargas, A.J.; Cohen, S.S.; Doucette, A.; Mohamed, M.; Irvin, S.R.; Miller, P.E.; Watson, H.; Fryzek, J.P. Dairy consumption and CVD: A systematic review and meta-analysis. Br. J. Nutr. 2016, 115, 737–750. [Google Scholar] [CrossRef] [Green Version]
- Qin, L.Q.; Xu, J.Y.; Han, S.F.; Zhang, Z.L.; Zhao, Y.Y.; Szeto, I.M. Dairy consumption and risk of cardiovascular disease: An updated meta-analysis of prospective cohort studies. Asia Pac. J. Clin. Nutr. 2015, 24, 90–100. [Google Scholar] [CrossRef] [PubMed]
- Lamarche, B.; Givens, D.I.; Soedamah-Muthu, S.; Krauss, R.M.; Jakobsen, M.U.; Bischoff-Ferrari, H.A.; Pan, A.; Després, J.P. Does Milk Consumption Contribute to Cardiometabolic Health and Overall Diet Quality? Can. J. Cardiol. 2016, 32, 1026–1032. [Google Scholar] [CrossRef] [Green Version]
- Torres, N.; Torre-Villalvazo, I.; Tovar, A.R. Regulation of lipid metabolism by soy protein and its implication in diseases mediated by lipid disorders. J. Nutr. Biochem. 2006, 17, 365–373. [Google Scholar] [CrossRef]
- Calder, P.C. Omega-3 fatty acids and inflammatory processes: From molecules to man. Biochem. Soc. Trans. 2017, 45, 1105–1115. [Google Scholar] [CrossRef] [Green Version]
- Brenna, J.T.; Salem, N.; Sinclair, A.J.; Cunnane, S.C. α-Linolenic acid supplementation and conversion to n-3 long-chain polyunsaturated fatty acids in humans. Prostaglandins Leukot. Essent. Fat. Acids 2009, 80, 85–91. [Google Scholar] [CrossRef]
- Metherel, A.H.; Bazinet, R.P. Updates to the n-3 polyunsaturated fatty acid biosynthesis pathway: DHA synthesis rates, tetracosahexaenoic acid and (minimal) retroconversion. Prog. Lipid Res. 2019, 76, 101008. [Google Scholar] [CrossRef] [PubMed]
- Gonzalez-Soto, M.; Mutch, D.M. Diet Regulation of Long-Chain PUFA Synthesis: Role of Macronutrients, Micronutrients, and Polyphenols on Δ-5/Δ-6 Desaturases and Elongases 2/5. Adv. Nutr. 2021, 12, 980–994. [Google Scholar] [CrossRef] [PubMed]
- De Groot, R.H.M.; Emmett, R.; Meyer, B.J. Non-dietary factors associated with n-3 long-chain PUFA levels in humans–A systematic literature review. Br. J. Nutr. 2019, 121, 793–808. [Google Scholar] [CrossRef] [Green Version]
- Koba, K.; Wakamatsu, K.; Obata, K.; Sugano, M. Effects of dietary proteins on linoleic acid desaturation and membrane fluidity in rat liver microsomes. Lipids 1993, 28, 457–464. [Google Scholar] [CrossRef] [PubMed]
- Ikeda, A.; Koba, K.; Sugano, M. Impact of Dietary Protein on Polyunsaturated Fatty Acid Desaturation in Rats Fed Diets Rich in α-Linolenic Acid. Biosci. Biotechnol. Biochem. 1993, 57, 61–64. [Google Scholar] [CrossRef] [PubMed] [Green Version]
- Brandon, E.F.; Raap, C.D.; Meijerman, I.; Beijnen, J.H.; Schellens, J.H. An update on in vitro test methods in human hepatic drug biotransformation research: Pros and cons. Toxicol. Appl. Pharmacol. 2003, 189, 233–246. [Google Scholar] [CrossRef]
- Brenner, D.R.; Boucher, B.A.; Kreiger, N.; Jenkins, D.; El-Sohemy, A. Dietary patterns in an ethnoculturally diverse population of young Canadian adults. Can. J. Diet. Pract. Res. 2011, 72, e161–e168. [Google Scholar] [CrossRef]
- Merino, D.M.; Johnston, H.; Clarke, S.; Roke, K.; Nielsen, D.; Badawi, A.; El-Sohemy, A.; Ma, D.W.; Mutch, D.M. Polymorphisms in FADS1 and FADS2 alter desaturase activity in young Caucasian and Asian adults. Mol. Genet Metab. 2011, 103, 171–178. [Google Scholar] [CrossRef]
- Brandsch, C.; Shukla, A.; Hirche, F.; Stangl, G.I.; Eder, K. Effect of proteins from beef, pork, and turkey meat on plasma and liver lipids of rats compared with casein and soy protein. Nutrition 2006, 22, 1162–1170. [Google Scholar] [CrossRef] [PubMed]
- Gooderham, M.H.; Adlercreutz, H.; Ojala, S.T.; Wähälä, K.; Holub, B.J. A soy protein isolate rich in genistein and daidzein and its effects on plasma isoflavone concentrations, platelet aggregation, blood lipids and fatty acid composition of plasma phospholipid in normal men. J. Nutr. 1996, 126, 2000–2006. [Google Scholar] [CrossRef] [PubMed]
- Xiao, C.W.; Mei, J.; Wood, C.M. Effect of soy proteins and isoflavones on lipid metabolism and involved gene expression. Front. Biosci. 2008, 13, 2660–2673. [Google Scholar] [CrossRef] [PubMed] [Green Version]
- Jump, D.B. Fatty acid regulation of hepatic lipid metabolism. Curr. Opin. Clin. Nutr. Metab. Care 2011, 14, 115–120. [Google Scholar] [CrossRef] [PubMed] [Green Version]
- Patterson, E.; Wall, R.; Fitzgerald, G.F.; Ross, R.P.; Stanton, C. Health Implications of High Dietary Omega-6 Polyunsaturated Fatty Acids. J. Nutr. Metab. 2012, 2012, 539426. [Google Scholar] [CrossRef] [PubMed]
- Tovar, A.R.; Torre-Villalvazo, I.; Ochoa, M.; Elías, A.L.; Ortíz, V.; Aguilar-Salinas, C.A.; Torres, N. Soy protein reduces hepatic lipotoxicity in hyperinsulinemic obese Zucker fa/fa rats. J. Lipid. Res. 2005, 46, 1823–1832. [Google Scholar] [CrossRef] [PubMed] [Green Version]
- Gorissen, S.H.M.; Crombag, J.J.R.; Senden, J.M.G.; Waterval, W.A.H.; Bierau, J.; Verdijk, L.B.; van Loon, L.J.C. Protein content and amino acid composition of commercially available plant-based protein isolates. Amino Acids 2018, 50, 1685–1695. [Google Scholar] [CrossRef] [Green Version]
- Sugiyama, K.; Yamakawa, A.; Kumazawa, A.; Saeki, S. Methionine content of dietary proteins affects the molecular species composition of plasma phosphatidylcholine in rats fed a cholesterol-free diet. J. Nutr. 1997, 127, 600–607. [Google Scholar] [CrossRef] [Green Version]
- Shimada, Y.; Morita, T.; Sugiyama, K. Increased Response of Liver Microsomal Δ6-Desaturase Activity to Dietary Methionine in Rats. Biosci. Biotechnol. Biochem. 2003, 67, 743–751. [Google Scholar] [CrossRef]
- Wirfält, A.K.; Jeffery, R.W.; Elmer, P.J. Comparison of food frequency questionnaires: The reduced Block and Willett questionnaires differ in ranking on nutrient intakes. Am. J. Epidemiol. 1998, 148, 1148–1156. [Google Scholar] [CrossRef] [Green Version]
- Peñalvo, J.L.; Castilho, M.C.; Silveira, M.I.N.; Matallana, M.C.; Torija, M.E. Fatty acid profile of traditional soymilk. Eur. Food Res. Technol. 2004, 219, 251–253. [Google Scholar] [CrossRef]
- Månsson, H.L. Fatty acids in bovine milk fat. Food. Nutr. Res. 2008, 52. [Google Scholar] [CrossRef] [Green Version]
- Gillingham, L.G.; Harding, S.V.; Rideout, T.C.; Yurkova, N.; Cunnane, S.C.; Eck, P.K.; Jones, P.J. Dietary oils and FADS1-FADS2 genetic variants modulate [13C]α-linolenic acid metabolism and plasma fatty acid composition. Am. J. Clin. Nutr. 2013, 97, 195–207. [Google Scholar] [CrossRef] [PubMed] [Green Version]
- Research, G.V. Soy Milk Market Size Worth $11.08 Billion By 2025|CAGR: 6.1%. Available online: https://www.grandviewresearch.com/press-release/global-soy-milk-market (accessed on 23 November 2020).
- Simopoulos, A.P. The importance of the ratio of omega-6/omega-3 essential fatty acids. Biomed Pharm. 2002, 56, 365–379. [Google Scholar] [CrossRef]
- Jump, D.B.; Depner, C.M.; Tripathy, S.; Lytle, K.A. Potential for Dietary ω-3 Fatty Acids to Prevent Nonalcoholic Fatty Liver Disease and Reduce the Risk of Primary Liver Cancer. Adv. Nutr. 2015, 6, 694–702. [Google Scholar] [CrossRef] [Green Version]
- Janssen, C.I.F.; Kiliaan, A.J. Long-chain polyunsaturated fatty acids (LCPUFA) from genesis to senescence: The influence of LCPUFA on neural development, aging, and neurodegeneration. Prog. Lipid Res. 2014, 53, 1–17. [Google Scholar] [CrossRef] [PubMed]
- Del Gobbo, L.C.; Imamura, F.; Aslibekyan, S.; Marklund, M.; Virtanen, J.K.; Wennberg, M.; Yakoob, M.Y.; Chiuve, S.E.; Dela Cruz, L.; Frazier-Wood, A.C.; et al. ω-3 Polyunsaturated Fatty Acid Biomarkers and Coronary Heart Disease: Pooling Project of 19 Cohort Studies. JAMA Intern. Med. 2016, 176, 1155–1166. [Google Scholar] [CrossRef] [PubMed] [Green Version]


| Variables | Total Population (n = 1083) | Group “Milk” (n = 671) | Group “Soy” (n = 71) | Group “Both” (n = 269) | Group “No Consumption” (n = 72) | p-Value |
|---|---|---|---|---|---|---|
| Sex | F: 764 (70.5%) M: 319 (29.5%) | F: 466 (69.4%) M: 205 (30.6%) | F: 55 (77.5%) M: 16 (22.5%) | F: 195 (72.5%) M: 74 (27.5%) | F: 48 (66.7%) M: 24 (33.3%) | - |
| Ethnicity | ||||||
| Caucasian | 459 | 305 | 36 | 91 | 27 | - |
| East Asian | 396 | 196 | 27 | 145 | 28 | - |
| South Asian | 125 | 99 | 4 | 13 | 9 | - |
| Other | 103 | 70 | 4 | 20 | 8 | - |
| Bioclinical markers | ||||||
| Age (yrs) | 22.7 ± 2.5 | 22.66 ± 2.47 a,b | 23.30 ± 2.76 a | 22.41 ± 2.32 b | 22.88 ± 2.64 a,b | 0.0468 |
| BMI (kg/m2) | 22.76 ± 3.49 | 23.03 ± 3.62 a | 22.11 ± 3.02 a,b | 22.24 ± 2.99 b | 22.78 ± 4.19 a,b | 0.0058 |
| TAG (mmol/L) | 0.94 ± 0.45 | 0.95 ± 0.47 | 0.91 ± 0.34 | 0.93 ± 0.44 | 0.95 ± 0.40 | 0.8052 |
| hs-CRP (mg/L) | 1.26 ± 2.68 | 1.42 ± 3.00 | 0.92 ± 1.46 | 0.99 ± 2.18 | 1.09 ± 2.06 | 0.0852 |
| Total cholesterol (mmol/L) | 4.23 ± 0.77 | 4.24 ± 0.79 | 4.17 ± 0.70 | 4.18 ± 0.73 | 4.39 ± 0.82 | 0.1738 |
| LDL (mmol/L) | 2.23 ± 0.64 | 2.25 ± 0.66 | 2.14 ± 0.55 | 2.18 ± 0.60 | 2.34 ± 0.70 | 0.1044 |
| HDL (mmol/L) | 1.57 ± 0.39 | 1.55 ± 0.39 | 1.61 ± 0.41 | 1.59 ± 0.38 | 1.62 ± 0.41 | 0.2331 |
| Glucose (mmol/L) | 4.78 ± 0.43 | 4.78 ± 0.37 | 4.83 ± 0.97 | 4.76 ± 0.35 | 4.83 ± 0.46 | 0.5653 |
| Insulin (pmol/L) | 48.48 ± 35.66 | 48.33 ± 28.90 | 43.35 ± 23.59 | 48.81 ± 49.10 | 53.68 ± 42.21 | 0.3906 |
| Dietary intake (FFQ) | ||||||
| Total kcal per day | 1956 ± 647 | 1963 ± 637 a | 1877 ± 673 a,b | 2015 ± 659 a | 1748 ± 629 b | 0.0127 |
| Omega-6/Omega-3 (g) | 10.22 ± 15.52 | 9.83 ± 9.27 a | 15.07 ± 47.16 b | 10.14 ± 12.94 a,b | 9.30 ± 2.67 a,b | 0.0539 |
| ALA and LA plasma concentrations (gas chromatography) | ||||||
| LA (18:2n6) (μg/mL) | 609.1 ± 168.7 | 596.4 ± 171.0 a | 663.7 ± 145.2 b | 622.7 ± 163.5 a,b | 622.3 ± 176.2 a,b | 0.0036 |
| ALA (18:3n3) (μg/mL) | 14.38 ± 7.22 | 13.90 ± 7.38 | 16.12 ± 6.30 | 15.00 ± 6.87 | 14.79 ± 7.54 | 0.0254 |
| LA/ALA (μg/mL) | 47.49 ± 15.57 | 48.34 ± 16.26 | 45.29 ± 14.75 | 45.59 ± 12.67 | 48.92 ± 18.74 | 0.0451 |
| Fatty Acid | % Value | |||||
|---|---|---|---|---|---|---|
| Total Population (n = 1083) | Group “Milk” (n = 671) | Group “Soy” (n = 71) | Group “Both” (n = 269) | Group “No Consumption” (n = 72) | p-Value 5 | |
| Plasma fatty acids 3 | ||||||
| ALA (18:3n-3) | 0.75 ± 0.26 | 0.72 ± 0.26 a | 0.83 ± 0.27 b | 0.79 ± 0.22 b | 0.74 ± 0.33 a,b | <0.0001 $ |
| EPA (20:5n-3) | 0.61 ± 0.43 | 0.59 ± 0.38 | 0.54 ± 0.33 | 0.65 ± 0.54 | 0.68 ± 0.54 | 0.0643 |
| DHA (22:6n-3) | 1.56 ± 0.54 | 1.54 ± 0.51 a,b | 1.42 ± 0.54 b | 1.63 ± 0.58 a | 1.66 ± 0.59 a | 0.0047 |
| LA (18:2n-6) | 32.36 ± 4.08 | 31.81 ± 3.94 a | 34.17 ± 3.65 b | 33.42 ± 3.87 b | 31.78 ± 5.09 a | <0.0001 $ |
| GLA (18:3n-6) | 0.33 ± 0.16 | 0.34 ± 0.16 a | 0.31 ± 0.15 a,b | 0.30 ± 0.16 b | 0.32 ± 0.15 a,b | 0.0043 |
| DGLA (20:3n-6) | 1.23 ± 0.36 | 1.27 ± 0.37 a | 1.14 ± 0.30 b | 1.15 ± 0.33 b | 1.16 ± 0.37 b | <0.0001 $ |
| AA (20:4n-6) | 6.20 ± 1.40 | 6.35 ± 1.41 a | 5.90 ± 1.38 b | 5.87 ± 1.37 b | 6.25 ± 1.20 a,b | <0.0001 $ |
| Product-to-precursor ratios 4 | ||||||
| AA/LA | 0.20 ± 0.07 | 0.20 ± 0.08 a | 0.19 ± 0.05 a,b | 0.18 ± 0.05 b | 0.21 ± 0.12 a | <0.0001 $ |
| EPA/ALA | 0.89 ± 0.69 | 0.88 ± 0.63 | 0.88 ± 0.52 | 0.89 ± 0.83 | 0.90 ± 0.80 | 0.9766 |
| D5D | 5.48 ± 2.05 | 5.40 ± 2.04 | 5.72 ± 2.12 | 5.52 ± 1.86 | 5.96 ± 2.68 | 0.0862 |
| D6D | 0.0106 ± 0.0066 | 0.0111 ± 0.0062 a | 0.0099 ± 0.0053 a,b | 0.0093 ± 0.0057 b | 0.0116 ± 0.0123 a | 0.0004 $ |
| ELOVL2 | 0.0481 ± 0.0734 | 0.0493 ± 0.0747 | 0.0582 ± 0.0747 | 0.0444 ± 0.0693 | 0.0419 ± 0.0765 | 0.4262 |
| ELOVL5 | 4.57 ± 2.85 | 4.50 ± 2.58 | 4.44 ± 2.38 | 4.90 ± 3.61 | 4.21 ± 2.30 | 0.1374 |
| Variables | Total Population (n = 1064) | Group “Dairy” (n = 401) | Group “Both” (n = 663) | p-Value |
|---|---|---|---|---|
| Sex | F: 751 (70.6%) M: 313 (29.4%) | F: 267 (66.6%) M: 134 (33.4%) | F: 484 (73%) M: 179 (27%) | - |
| Ethnicity | ||||
| Caucasian | 448 | 214 | 234 | - |
| Asian | 391 | 53 | 338 | - |
| South Asian | 124 | 76 | 48 | - |
| Other | 99 | 57 | 42 | - |
| Bioclinical markers | ||||
| Age (yrs) | 22.63 ± 2.45 | 22.60 ± 2.42 | 22.64 ± 2.47 | 0.7936 |
| BMI (kg/m2) | 22.79 ± 3.50 | 23.40 ± 3.79 | 22.42 ± 3.26 | <0.0001 |
| TAG (mmol/L) | 0.94 ± 0.45 | 0.95 ± 0.48 | 0.94 ± 0.43 | 0.7270 |
| hs-CRP (mg/L) | 1.27 ± 2.71 | 1.52 ± 2.97 | 1.12 ± 2.53 | 0.0269 |
| Total cholesterol (mmol/L) | 4.23 ± 0.77 | 4.27 ± 0.78 | 4.21 ± 0.77 | 0.2070 |
| LDL (mmol/L) | 2.24 ± 0.64 | 2.30 ± 0.65 | 2.19 ± 0.63 | 0.0082 |
| HDL (mmol/L) | 1.57 ± 0.39 | 1.54 ± 0.39 | 1.59 ± 0.39 | 0.0192 |
| Glucose (mmol/L) | 4.78 ± 0.44 | 4.78 ± 0.37 | 4.78 ± 0.47 | 0.8169 |
| Insulin (pmol/L) | 48.63 ± 35.77 | 51.05 ± 32.27 | 47.17 ± 37.67 | 0.0756 |
| Dietary intake (FFQ) | ||||
| Total kcal per day | 1958 ± 644 | 1950 ± 669 | 1962 ± 628 | 0.7671 |
| Omega-6/Omega-3 (g) | 9.83 ± 9.85 | 9.68 ± 3.94 | 9.92 ± 12.10 | 0.6419 |
| ALA and LA plasma concentrations (gas chromatography) | ||||
| LA (18:2n6) (μg/mL) | 608.1 ± 168.9 | 583.9 ± 170.4 | 622.7 ± 166.5 | 0.0003 |
| ALA (18:3n3) (μg/mL) | 14.27 ± 7.09 | 13.50 ± 6.93 | 14.73 ± 7.15 | 0.0057 |
| LA/ALA (μg/mL) | 47.61 ± 15.49 | 48.99 ± 16.93 | 46.78 ± 14.50 | 0.0301 |
| Fatty Acid | % Value | |||
|---|---|---|---|---|
| Total Population (n = 1064) | Group “Dairy” (n = 401) | Group “Both” (n = 663) | p-Value 4 | |
| Plasma fatty acids 2 | ||||
| ALA (18:3n-3) | 0.74 ± 0.25 | 0.71 ± 0.28 | 0.76 ± 0.23 | 0.0009 $ |
| EPA (20:5n-3) | 0.61 ± 0.43 | 0.60 ± 0.39 | 0.62 ± 0.45 | 0.4991 |
| DHA (22:6n-3) | 1.57 ± 0.52 | 1.49 ± 0.50 | 1.62 ± 0.54 | <0.0001 $ |
| LA (18:2n-6) | 32.32 ± 4.06 | 31.53 ± 3.98 | 32.80 ± 4.02 | <0.0001 $ |
| GLA (18:3n-6) | 0.33 ± 0.16 | 0.35 ± 0.17 | 0.31 ± 0.15 | <0.0001 $ |
| DGLA (20:3n-6) | 1.23 ± 0.36 | 1.30 ± 0.36 | 1.18 ± 0.35 | <0.0001 $ |
| AA (20:4n-6) | 6.20 ± 1.40 | 6.59 ± 1.41 | 5.98 ± 1.34 | <0.0001 $ |
| Product-to-precursor ratios 3 | ||||
| AA/LA | 0.20 ± 0.07 | 0.21 ± 0.07 | 0.19 ± 0.07 | <0.0001 $ |
| EPA/ALA | 0.89 ± 0.68 | 0.93 ± 0.63 | 0.86 ± 0.71 | 0.0824 |
| D5D | 5.48 ± 2.02 | 5.45 ± 2.05 | 5.50 ± 2.01 | 0.7042 |
| D6D | 0.0106 ± 0.0066 | 0.0117 ± 0.0076 | 0.0099 ± 0.0058 | <0.0001 $ |
| ELOVL2 | 0.0484 ± 0.0738 | 0.0500 ± 0.0705 | 0.0467 ± 0.0758 | 0.5918 |
| ELOVL5 | 4.59 ± 2.86 | 4.45 ± 2.78 | 4.67 ± 2.90 | 0.2250 |
Publisher’s Note: MDPI stays neutral with regard to jurisdictional claims in published maps and institutional affiliations. |
© 2021 by the authors. Licensee MDPI, Basel, Switzerland. This article is an open access article distributed under the terms and conditions of the Creative Commons Attribution (CC BY) license (https://creativecommons.org/licenses/by/4.0/).
Share and Cite
Gonzalez-Soto, M.; Abdelmagid, S.A.; Ma, D.W.L.; El-Sohemy, A.; Mutch, D.M. Soy Consumption, but Not Dairy Consumption, Is Inversely Associated with Fatty Acid Desaturase Activity in Young Adults. Nutrients 2021, 13, 2817. https://doi.org/10.3390/nu13082817
Gonzalez-Soto M, Abdelmagid SA, Ma DWL, El-Sohemy A, Mutch DM. Soy Consumption, but Not Dairy Consumption, Is Inversely Associated with Fatty Acid Desaturase Activity in Young Adults. Nutrients. 2021; 13(8):2817. https://doi.org/10.3390/nu13082817
Chicago/Turabian StyleGonzalez-Soto, Melissa, Salma A Abdelmagid, David W.L. Ma, Ahmed El-Sohemy, and David M Mutch. 2021. "Soy Consumption, but Not Dairy Consumption, Is Inversely Associated with Fatty Acid Desaturase Activity in Young Adults" Nutrients 13, no. 8: 2817. https://doi.org/10.3390/nu13082817
APA StyleGonzalez-Soto, M., Abdelmagid, S. A., Ma, D. W. L., El-Sohemy, A., & Mutch, D. M. (2021). Soy Consumption, but Not Dairy Consumption, Is Inversely Associated with Fatty Acid Desaturase Activity in Young Adults. Nutrients, 13(8), 2817. https://doi.org/10.3390/nu13082817