1. Introduction
Apatite is a chain phosphate mineral (CaPO
4); the high-quality ones are considered semi-precious gemstones [
1]. Apatite has no preferential precipitation temperature; hence, it is a common accessory mineral widely distributed in Earth’s crust and found in magmatic, sedimentary, metamorphic and hydrothermal systems [
2,
3,
4]. Mafic magmatic rocks contain up to 20–30% of apatite. Apatite is of indicative significance for magma evolution and diagenesis because it is not affected by metamorphism and hydrothermal alteration [
5,
6,
7]. It is enriched with trace elements and halogen elements, such as iron, manganese, rare earth elements (REE), fluorine and chlorine. The REE content generally ranges from 5% up to 11.4% [
8]. These elements not only record and preserve information about the parent magma and indicate the magma’s redox state but also assist in identifying and determining the rock type.
Myanmar, Sri Lanka, India, Madagascar and China are among the main sources of apatite. Madagascar mainly produces blue, green and sky-blue gem-quality apatite [
1].
Apatite belongs to the hexagonal crystal system, specifically the symmetrical type 6/m. Its chemical formula is X
5(ZO
4)
3Y, where X is an ion represented by Ca
2+, which can be isomorphically replaced by Mg
2+, Fe
2+, Sr
2+, Mn
2+, Pb
2+, Zn
2+, Ba
2+, Ag
+ and REE
3+. Z = P, As, V, Si, S, C, etc. Y is an additional anion [
9]. The most common phase in rocks is fluorapatite (Ca
5[PO
4]
3F) [
10]. Ca
2+ occupies two kinds of positions in the apatite lattice represented by Ca1 (coordination 9 with nine oxygen ions) and Ca2 (coordination 7 with six oxygen ions and an additional anion). The number ratio of Ca1 and Ca2 is 4:6, and their ion radii are 1.18 Å and 1.06 Å, respectively [
8]. Apatite structure can tolerate relatively large structural distortions and allow different substitutions [
11]. Light REE preferably occupy the Ca2 site [
12]. Na
+, Eu
2+, Fe
2+, Mg
2+, Pb
2+, Mn
2+, Sr
2+, REE
3+, U
4+ and Th
4+ occupy the X site, Si
4+, S
6+ and C
4+ tend to occupy the Z site. Na
+ is usually situated at the Ca1 site. It can access fluorapatite through three substitutions (below, where V = vacancy) [
12,
13,
14]: REE
3+ + Na
+ = 2Ca
2+; Na
+ + S
6+ = Ca
2+ + P
5+; and 2Na
+ = Ca
2+ + [V]. Due to the law of charge conversation, the monovalent ion addition is indicated in the existence of alternative ionic groups, such as REE
3+ and SO
42−. REE
3+ and Y
3+ can occur in higher concentrations and occupy the Ca2 site. The possible alternative reactions for REE
3+ and Y
3+ are as follows [
11,
12,
15,
16,
17]: REE
3+ + Mn
2+ + Na
+ = 3Ca
2+; REE
3+ + SiO
44− = Ca
2+ + PO
43− and REE
3+ + O
2− = Ca
2+ + F
−. Divalent ions can be doped into apatite at any concentration because they have a common charge and a similar cation size as Ca
2+. In natural apatite, the most abundant tetravalent ions (i.e., Th
4+ and U
4+) can enter apatite through the following complex substitution [
11,
18,
19,
20]: Th
4+(U
4+) + [V] = 2Ca
2+. The PO
43− ion cluster can be substituted by the AsO
43−, SO
42−, CO
32− and SiO
44− ion clusters [
21,
22,
23,
24]. The following substitutions can occur for an instance of SO
42− [
22]: SO
42− + SiO
44− = 2PO
43− and SO
42− + Na
+ = PO
43− + Ca
2+.
As accessory minerals, apatites could provide an extremely reliable record of magma conditions and preserve in the sedimentary record in order to document the formation and evolution of magmas now lost in the geological record. Elements supporting varying states in accessory minerals can reflect the redox conditions through the valence state. Fe, Mn, Ce and Eu offer great potential in obtaining robust estimates of redox conditions. For instance, Ce in zircon has been studied for its relationship to fO
2, an indicator of the availability and ability of oxygen to participate in mineral and liquid reactions [
25].
In this study, gem-quality apatite crystal samples from Madagascar were selected, and gemological and spectroscopy tests were performed to determine specific types. The results obtained herein are useful for subsequent studies on and developments of apatite. Given the gaps in the gemological and spectroscopic studies of Madagascar apatite, in this study, the gemological and spectroscopic analyses will be more detailed, providing a theoretical basis for the forthcoming research of blue to green−blue Paraiba-like apatite and establishing the origin information of Madagascar apatite.
2. Geological Setting
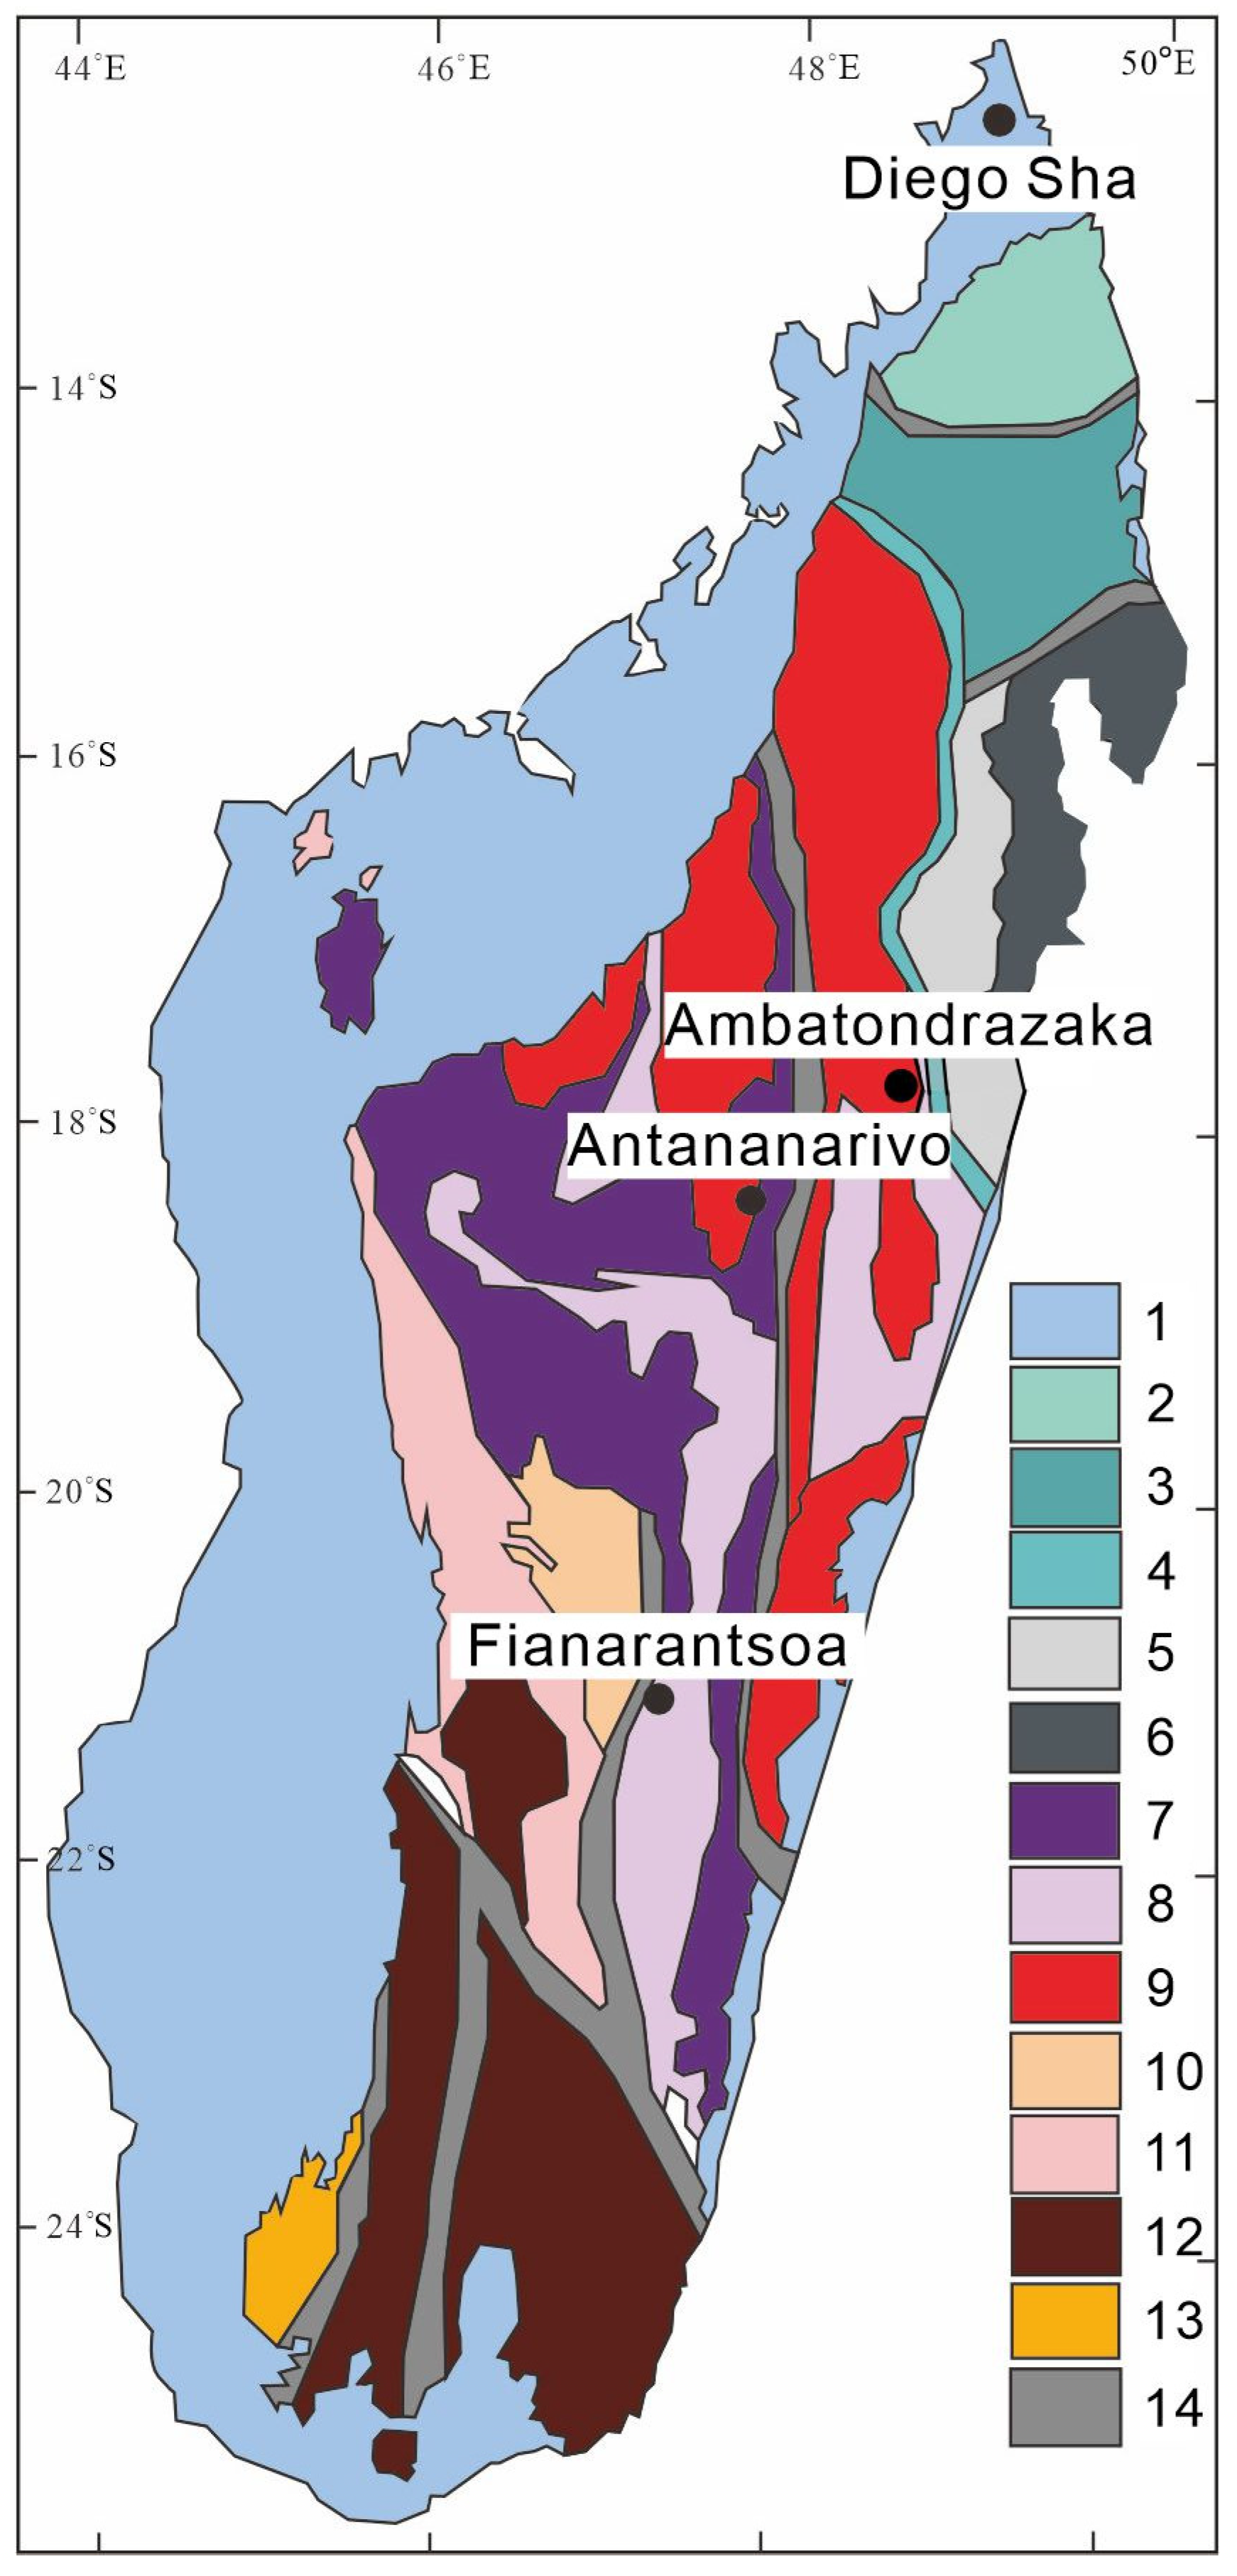
Located in southeastern Africa, Madagascar is the fourth largest island in the world. It is formed by the cleavage of Gondwanaland, part of the African craton, and it is mainly composed of Precambrian tectonic-magmatic-metamorphic heterogeneous rocks, Late Paleozoic–Mesozoic silty clastic carbonate rocks and Mesozoic volcanoes–sedimentary rock systems [
26]. Among them, the Precambrian hybrid rocks are widely distributed, accounting for approximately 75% of the total area (
Figure 1). Recent studies have shown that the Precambrian here mainly experienced tectonic–thermal events, such as Archaic-Paleoproterozoic substrate formation and cover deposition, Middle–Neoproterozoic Continent of Rhodesia’s disintegration, oceanic crust subduction, late Neoproterozoic-Early Paleozoic East-West Gondwana continent convergence, collage, collision orogeny and post−orogenic lithospheric demolition [
27]. The origin and composition of the plot are very complex [
28].
According to previous research, apatite can be produced as an accessory mineral in granite in the Ambatondrazaka region and as a vein mineral in the same region of magma-type vanadium–titanium magnetite [
28,
29]. The magmatic rocks in this area are developed in the form of bands and rock plants, spreading in the north-west and -east directions, mainly in the north-west direction. The granite outcrop area is 50 km
2, making it possible for apatite to be exploited. Magma-type V-Ti magnetite is mainly produced in Precambrian super-base hybrid rocks [
29]. Further gemological and mineralogical studies on apatite from Madagascar are presented herein (
Figure 2).
3. Materials and Methods
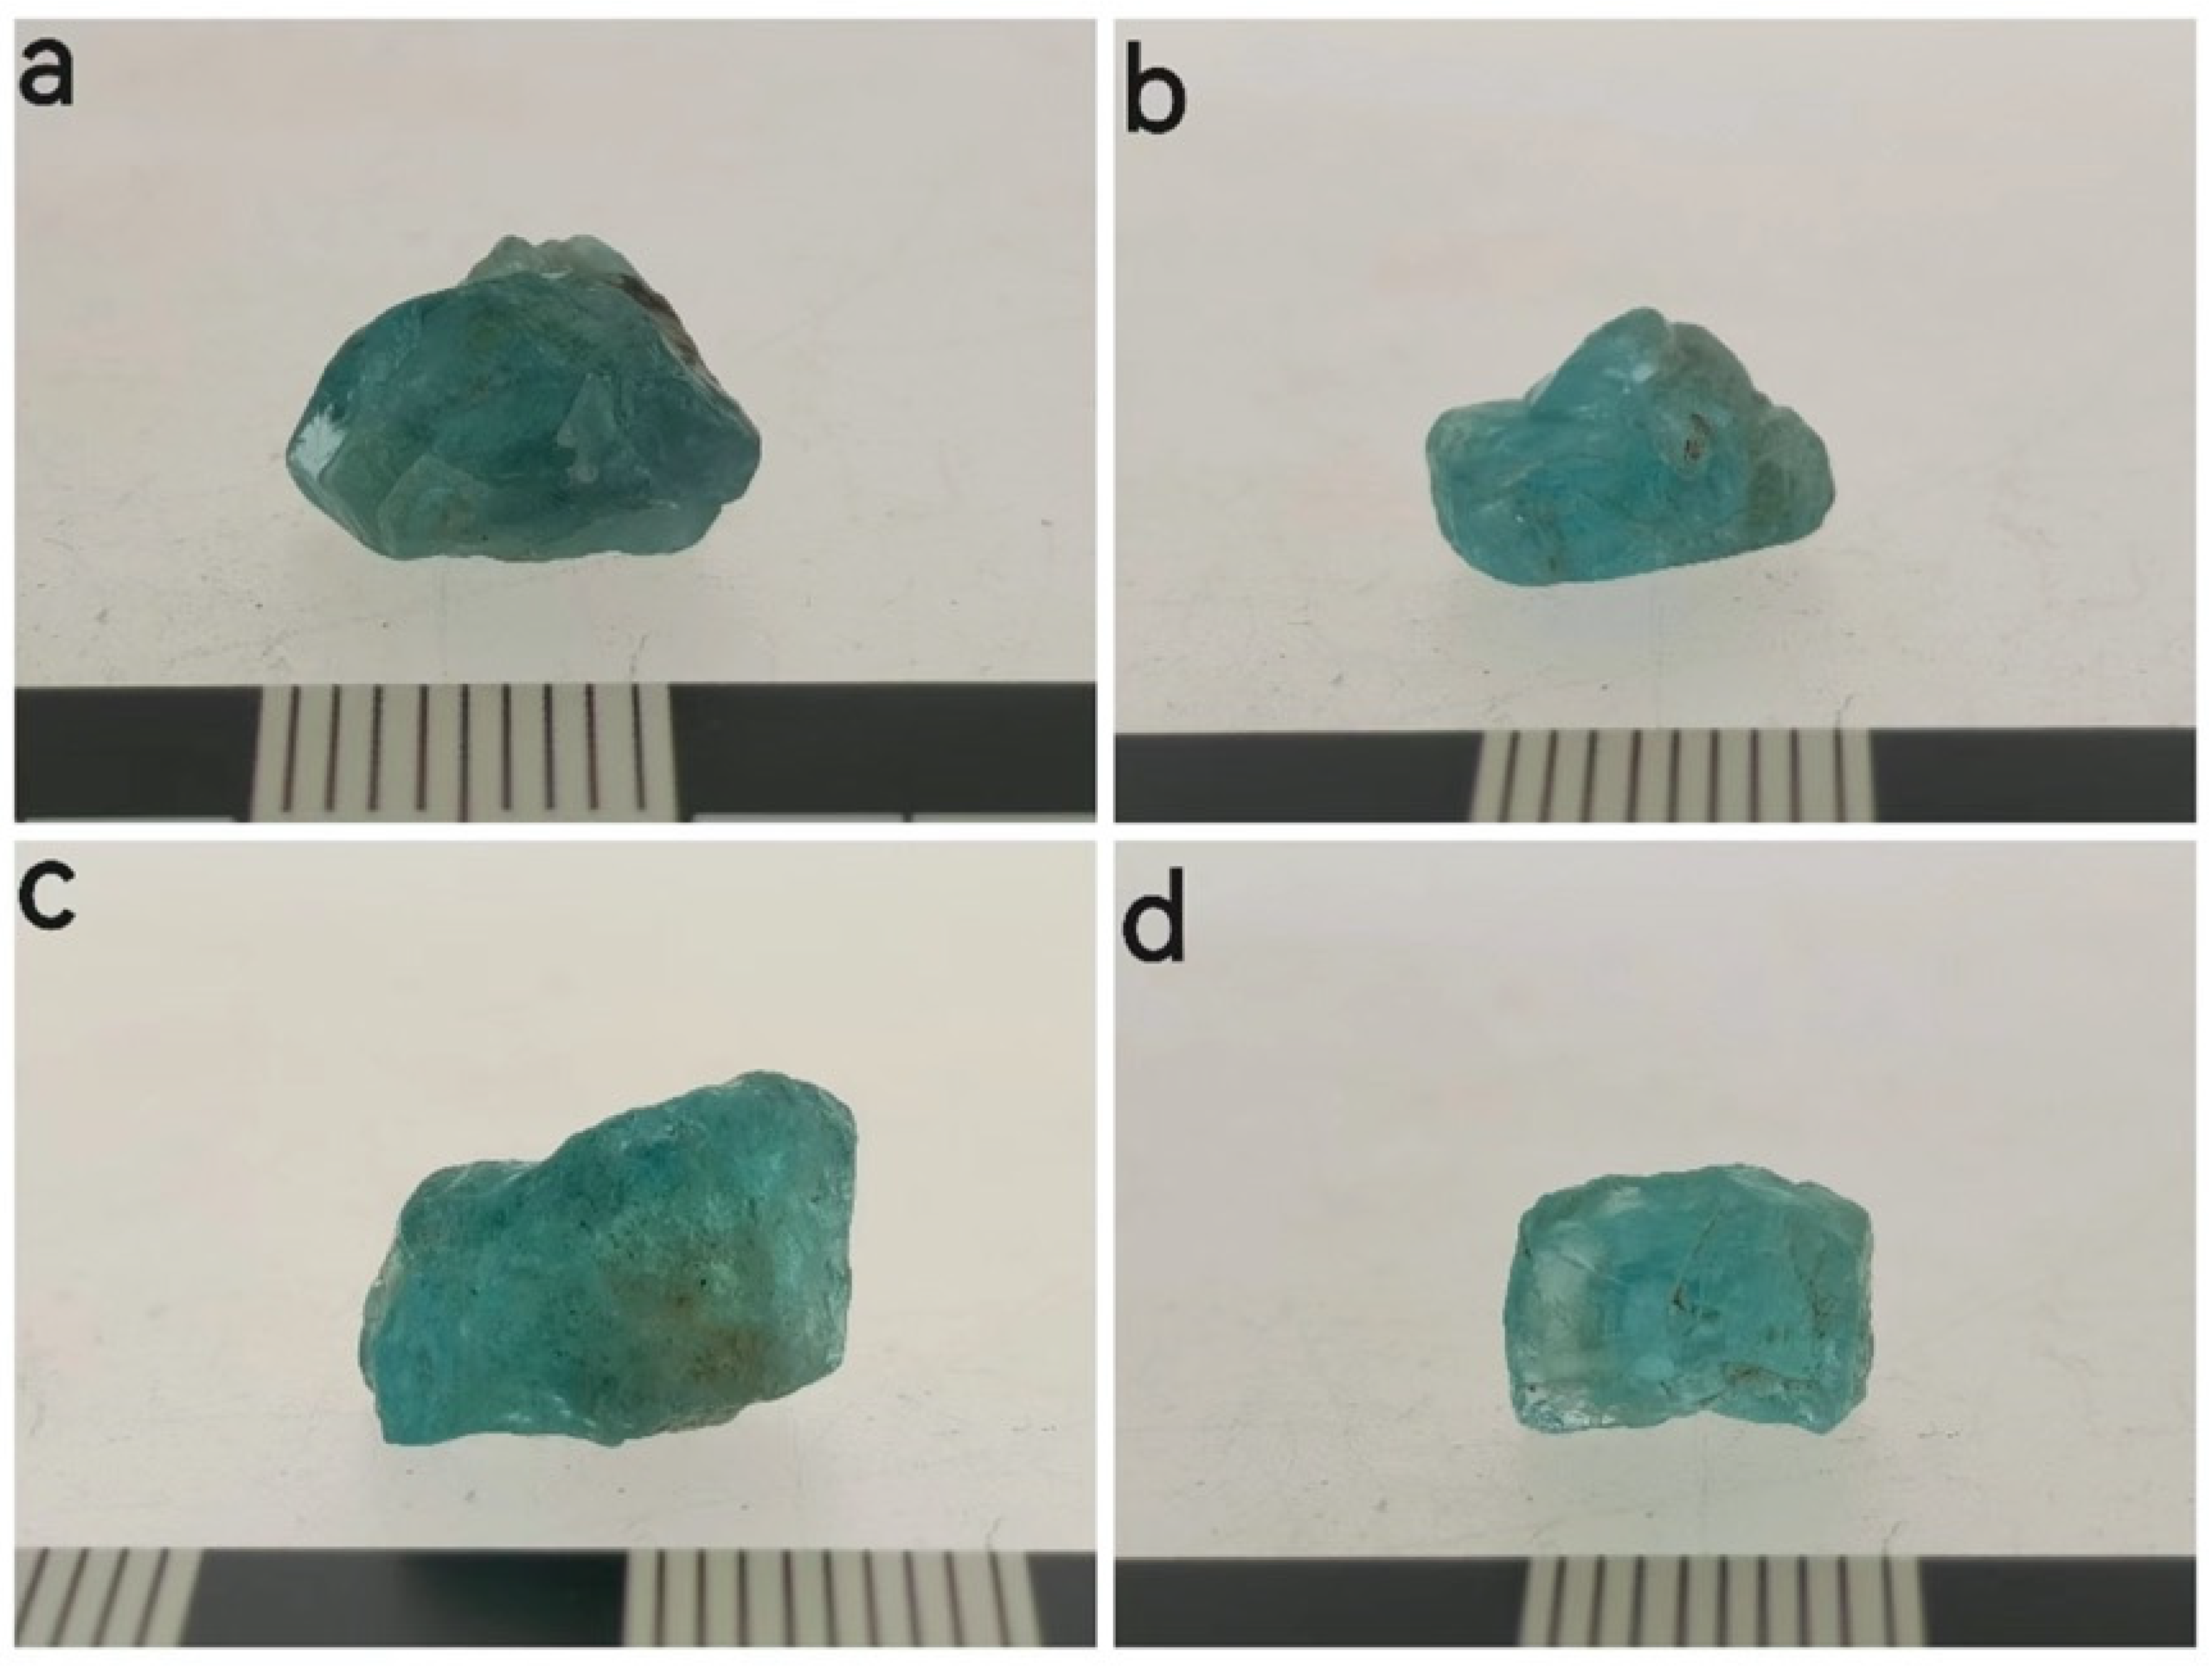
Four apatite samples (i.e., MADB-1–MADB-4,
Figure 2) from Madagascar were subjected to standard gemological tests.
The classic gemological analyses were carried out at the Gemological Research Laboratory of China University of Geosciences, Beijing, including observation, RI, ultraviolet fluorescence detection and specific gravity testing. The optical observations were carried out with a tenfold magnification gem microscope. RI was determined using the spot measurement method. The UV fluorescence detection of samples was performed using UV fluorescent lamps with long and short wavelengths. The specific gravity was tested by the hydrostatic method, and each sample was tested thrice.
The IR analyses were carried out with a Tensor 27 Fourier infrared spectrometer (Bruker, Karlsruhe, Germany) using the reflection method. The test conditions were as follows: 18–25 °C scanning temperature; <70% humidity; 85–265 V scanning voltage; 4 cm−1 resolution; 6 mm grating; 400–2000 cm−1 test range; and 32 times of scanning signal accumulation.
Raman spectroscopy was performed with the HR Evolution Raman microspectrometer (HORIBA, Kyoto, Japan) with the following analytical conditions: 532 nm laser wavelength; 200–2000 cm−1 scanning range; 50 mW laser power; 4 cm−1 resolution; 100 μm slit width; 600 gr/mm grating; 4 s scanning time; and 3 s integration time.
A UV-3600 UV-VIS spectrophotometer (Shimadzu Corporation, Kyoto, Japan) with a reflection method was used to perform the UV-VIS spectroscopy tests. The method conditions were as follows: 200–900 nm wavelength; 20 nm slit width; 1.0 s time constant; medium scanning speed; and 0.5 s sampling interval.
A homogeneous portion of the apatite samples without inclusions was selected for testing to obtain a more representative elemental content.
We selected six spots at MADB-1 and -2 and three spots for each sample. The apatite crystals were first mechanically crushed. The pure inner parts of the sample were then selected under a binocular microscope and placed in an epoxy block to be polished to maximum surface. Before the analyses, the polishing portion was carbon-blasted on the surface. The elements were measured using a JXA-8230 electron probe microanalyser (JEOL, Tokyo, Japan) at Macquarie University, Australia. The following test conditions were applied: 2 × 10⁻⁸ A electron beam current; 15.0 kV accelerating voltage; and 5 μm beam spot. Each element was tested with an accuracy greater than 0.001% and corrected by ZAF calibration.
The trace element compositions were measured using laser ablation inductively coupled plasma mass spectrometer in the Institute of Geomechanics, Chinese Academy of Geological Sciences. Inline testing was performed using a 193 nm excimer laser ablation system (GeoLas HD; Coherent, Santa Clara, CA, USA) and a four-stage rod mass spectrometer (Agilent 7900, Agilent, Palo Alto, Santa Clara, CA, USA) with the carrier gases of Ar and He. NIST SRM 610 and 612 were used as the external standard, whilst 43Ca was employed as an internal marker for the trace element content.
4. Results
4.1. Visual Appearance and Gemological Properties of Apatite
Apatite samples analyzed in this work were greenish-blue uniform color with a glassy luster. The samples were plate-like or irregular in shape; the diaphaneity was transparent. The crystals show internal fissures, black short-columnar and orange-red inclusions. Moreover, greasy and shiny shell-like and irregular fractures were found. The crystal size ranged from 9 to 12 mm, with 6–10 mm thickness.
The RI of the samples was 1.63–1.64, and all samples were inert at the UV long and short wavelengths. The specific gravity values varied from 3.172 to 3.195.
4.2. Spectral Characteristics
4.2.1. Infrared Spectrum
The infrared spectrum is used for determining the phase of apatite and the presence of crystal distortion in order to establish origin information. Previous literature on apatites showed that infrared spectrum vibration was mainly manifested in the [PO
4]
3− ion vibration. Free [PO
4]
3− ions had four fundamental frequencies, namely symmetrical telescopic vibration (
v1), bending vibration (
v2), anti−telescopic vibration (
v3) and bending vibration (
v4) [
11,
13]. The
v2 band came from two strong absorption peaks at 320 and 270 cm
−1 [
9]. The test wavelength was between 2000 and 400 cm
−1. The
v2 bend was invisible and is not discussed below.
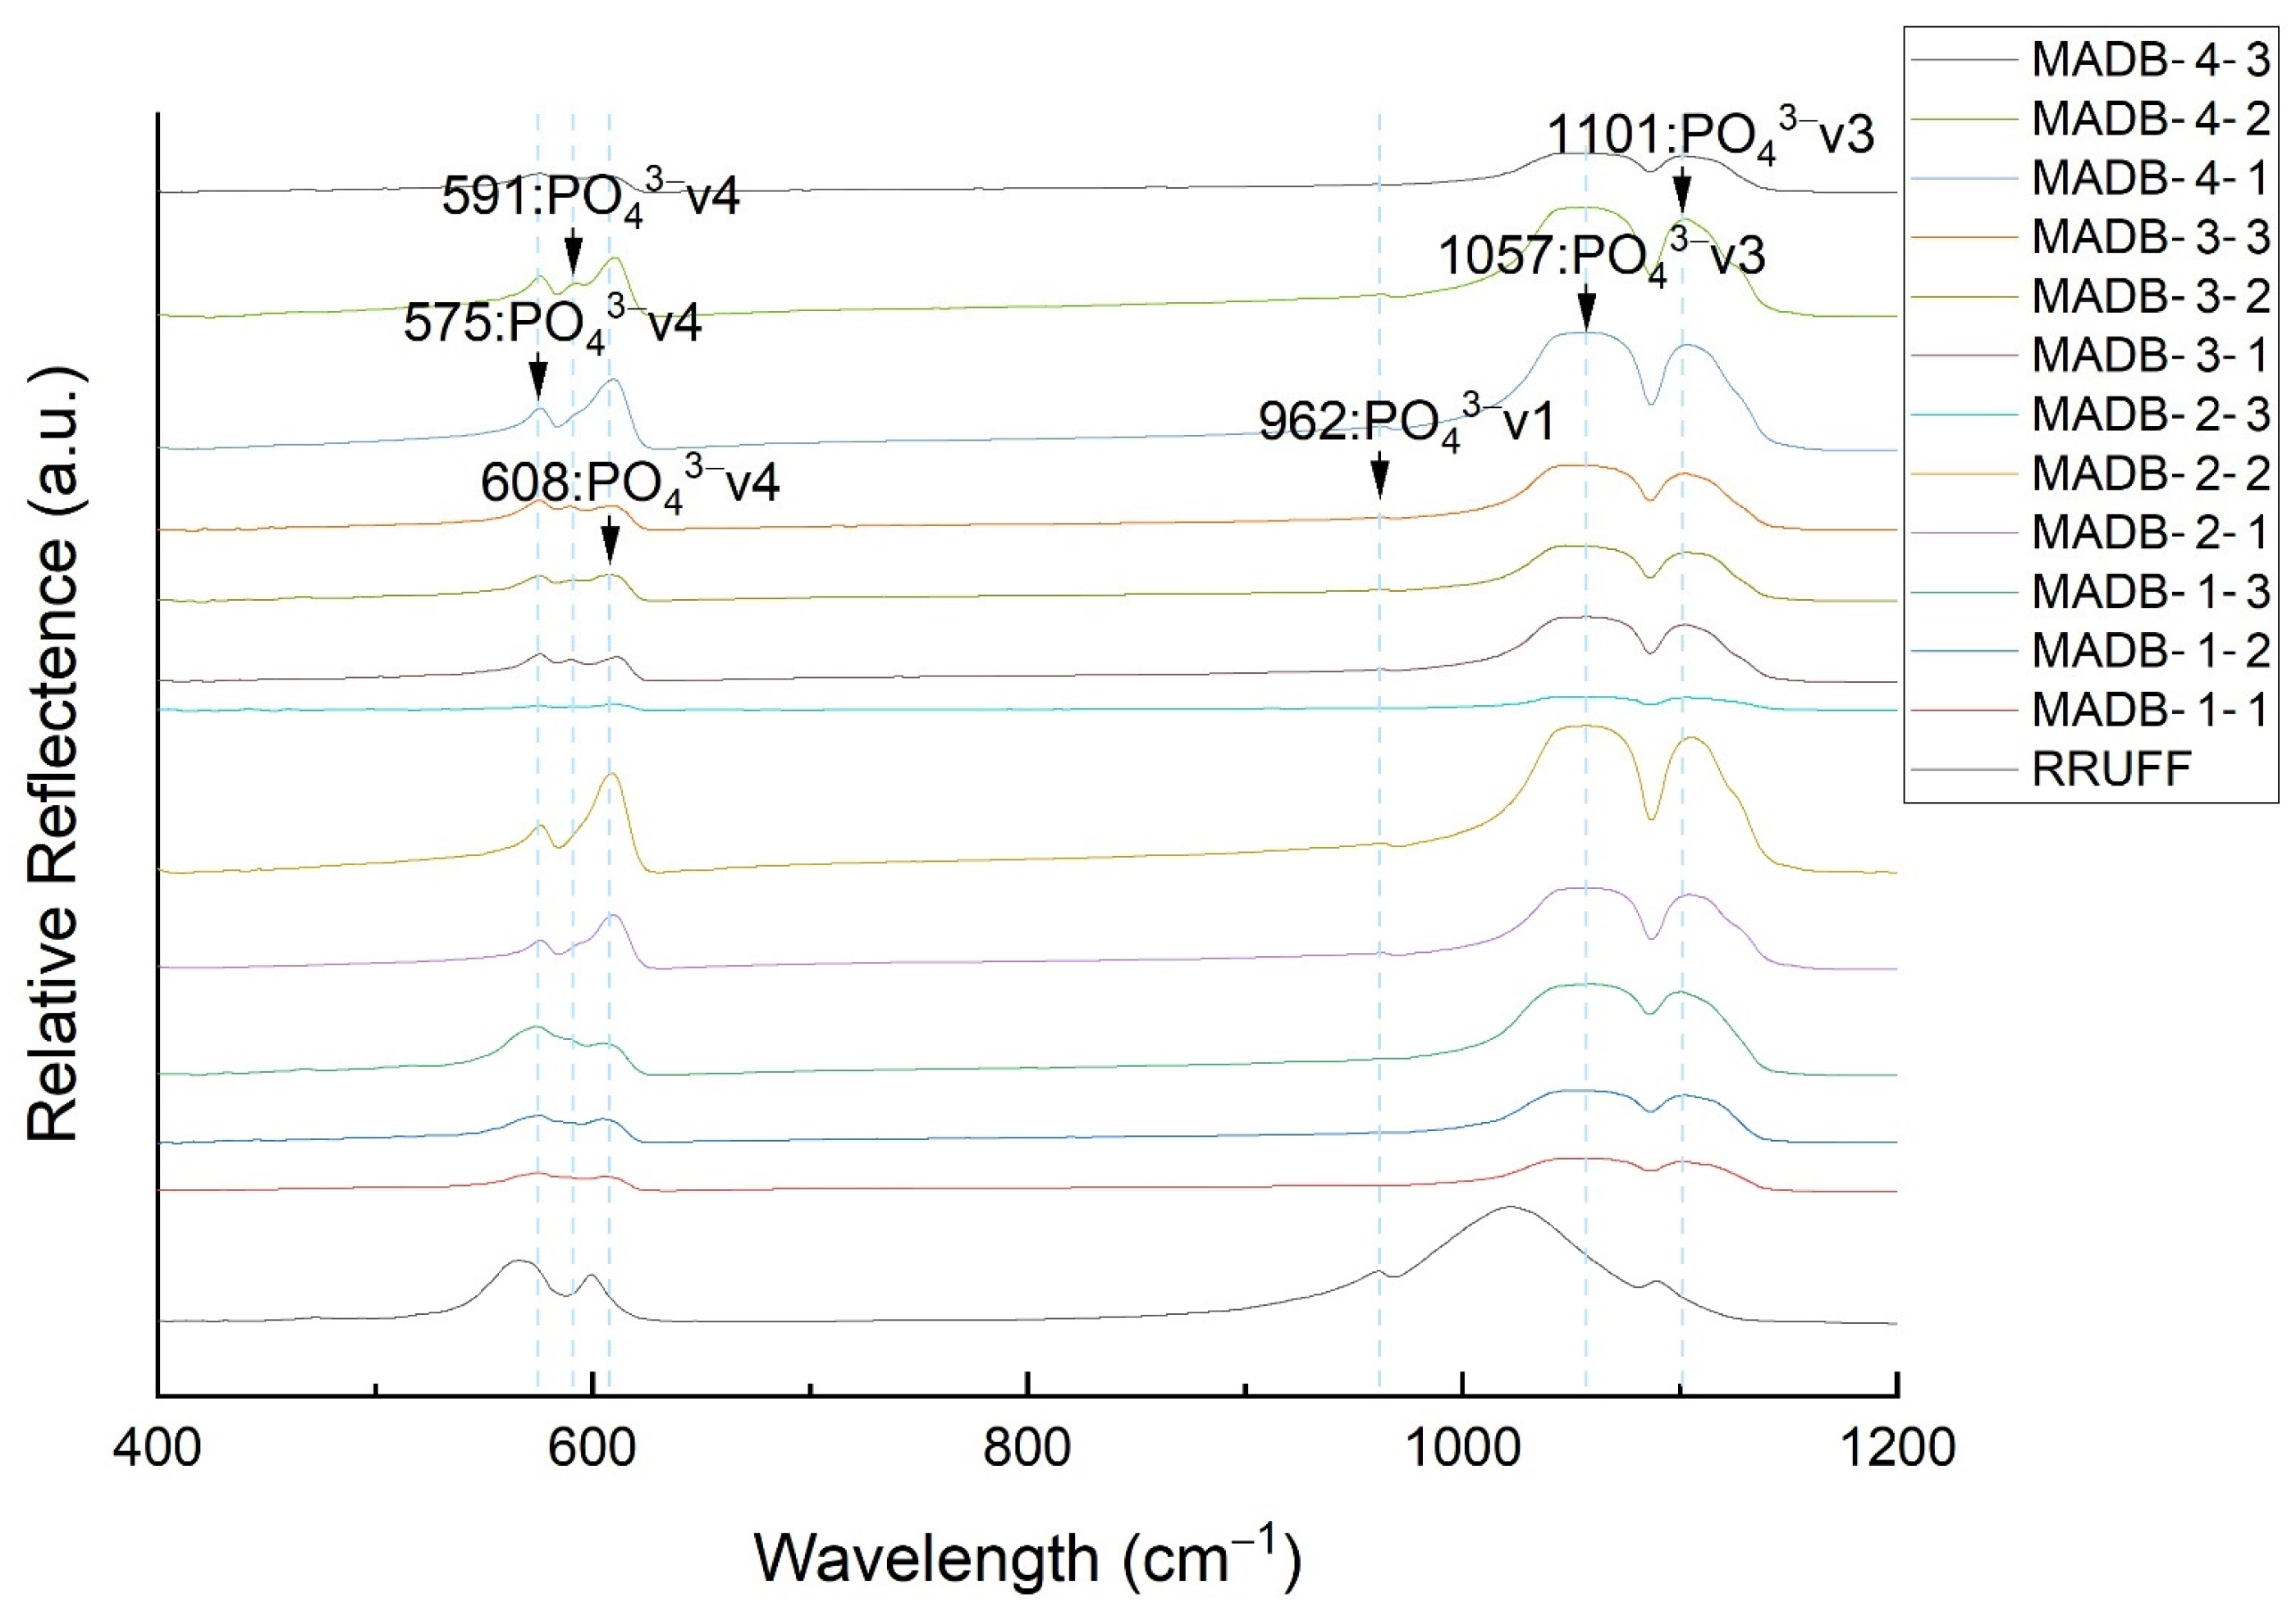
The following characteristic peaks were found (
Figure 3): a weak, single absorption band at 962 cm
−1 assigned to the symmetric stretching vibration (
v1); a wide, strong absorption shoulder near 1057 cm
−1; a strong absorption band at 1101 cm
−1 assigned to the anti-symmetric stretching vibration (
v3) of [PO
4]
3−. The moderately strong absorption bands at 575 and 608 cm
−1 were assigned to the bending vibration (
v4) of the [PO
4]
3− ion; a slightly weak absorption band at 591 cm
−1 was observed in MADB−3 and MADB−4 spectra. This absorption band was also assigned to the bending vibration (
v4) of [PO
4]
3−.
The R050274 fluorapatite from the RRUFF database was selected for comparison with the Madagascar samples. This sample from Minas Gerais, Brazil, was blue, with two moderately strong
v4 bands at 567 and 600 cm
−1, a sharp
v1 band found at 962 cm
−1 and two
v3 bands near 1022 cm
−1 and 1090 cm
−1. Comparing the MADB samples with R050274, we found an extra 591 cm
−1 weak analyzed band because of the orientation. It was also assigned to
v4 vibration of [PO
4]
3−. The
v3 vibration of [PO
4]
3− showed an obvious right shift, and the
v3 bands widened. The splitting of the P−O bond and the interaction of the [PO
4]
3− tetrahedron vibration pattern with the crystal lattice of fluorapatite have been responsible for the
v3 band widening [
30]. In addition, the infrared spectra results of the MADB samples were consistent with fluorapatite. Therefore, apatite of Malagasy origin could preliminarily be judged as fluorapatite, and there is splitting of P−O bond in fluorapatite crystal lattice indicated by infrared spectrum.
4.2.2. Raman Spectra
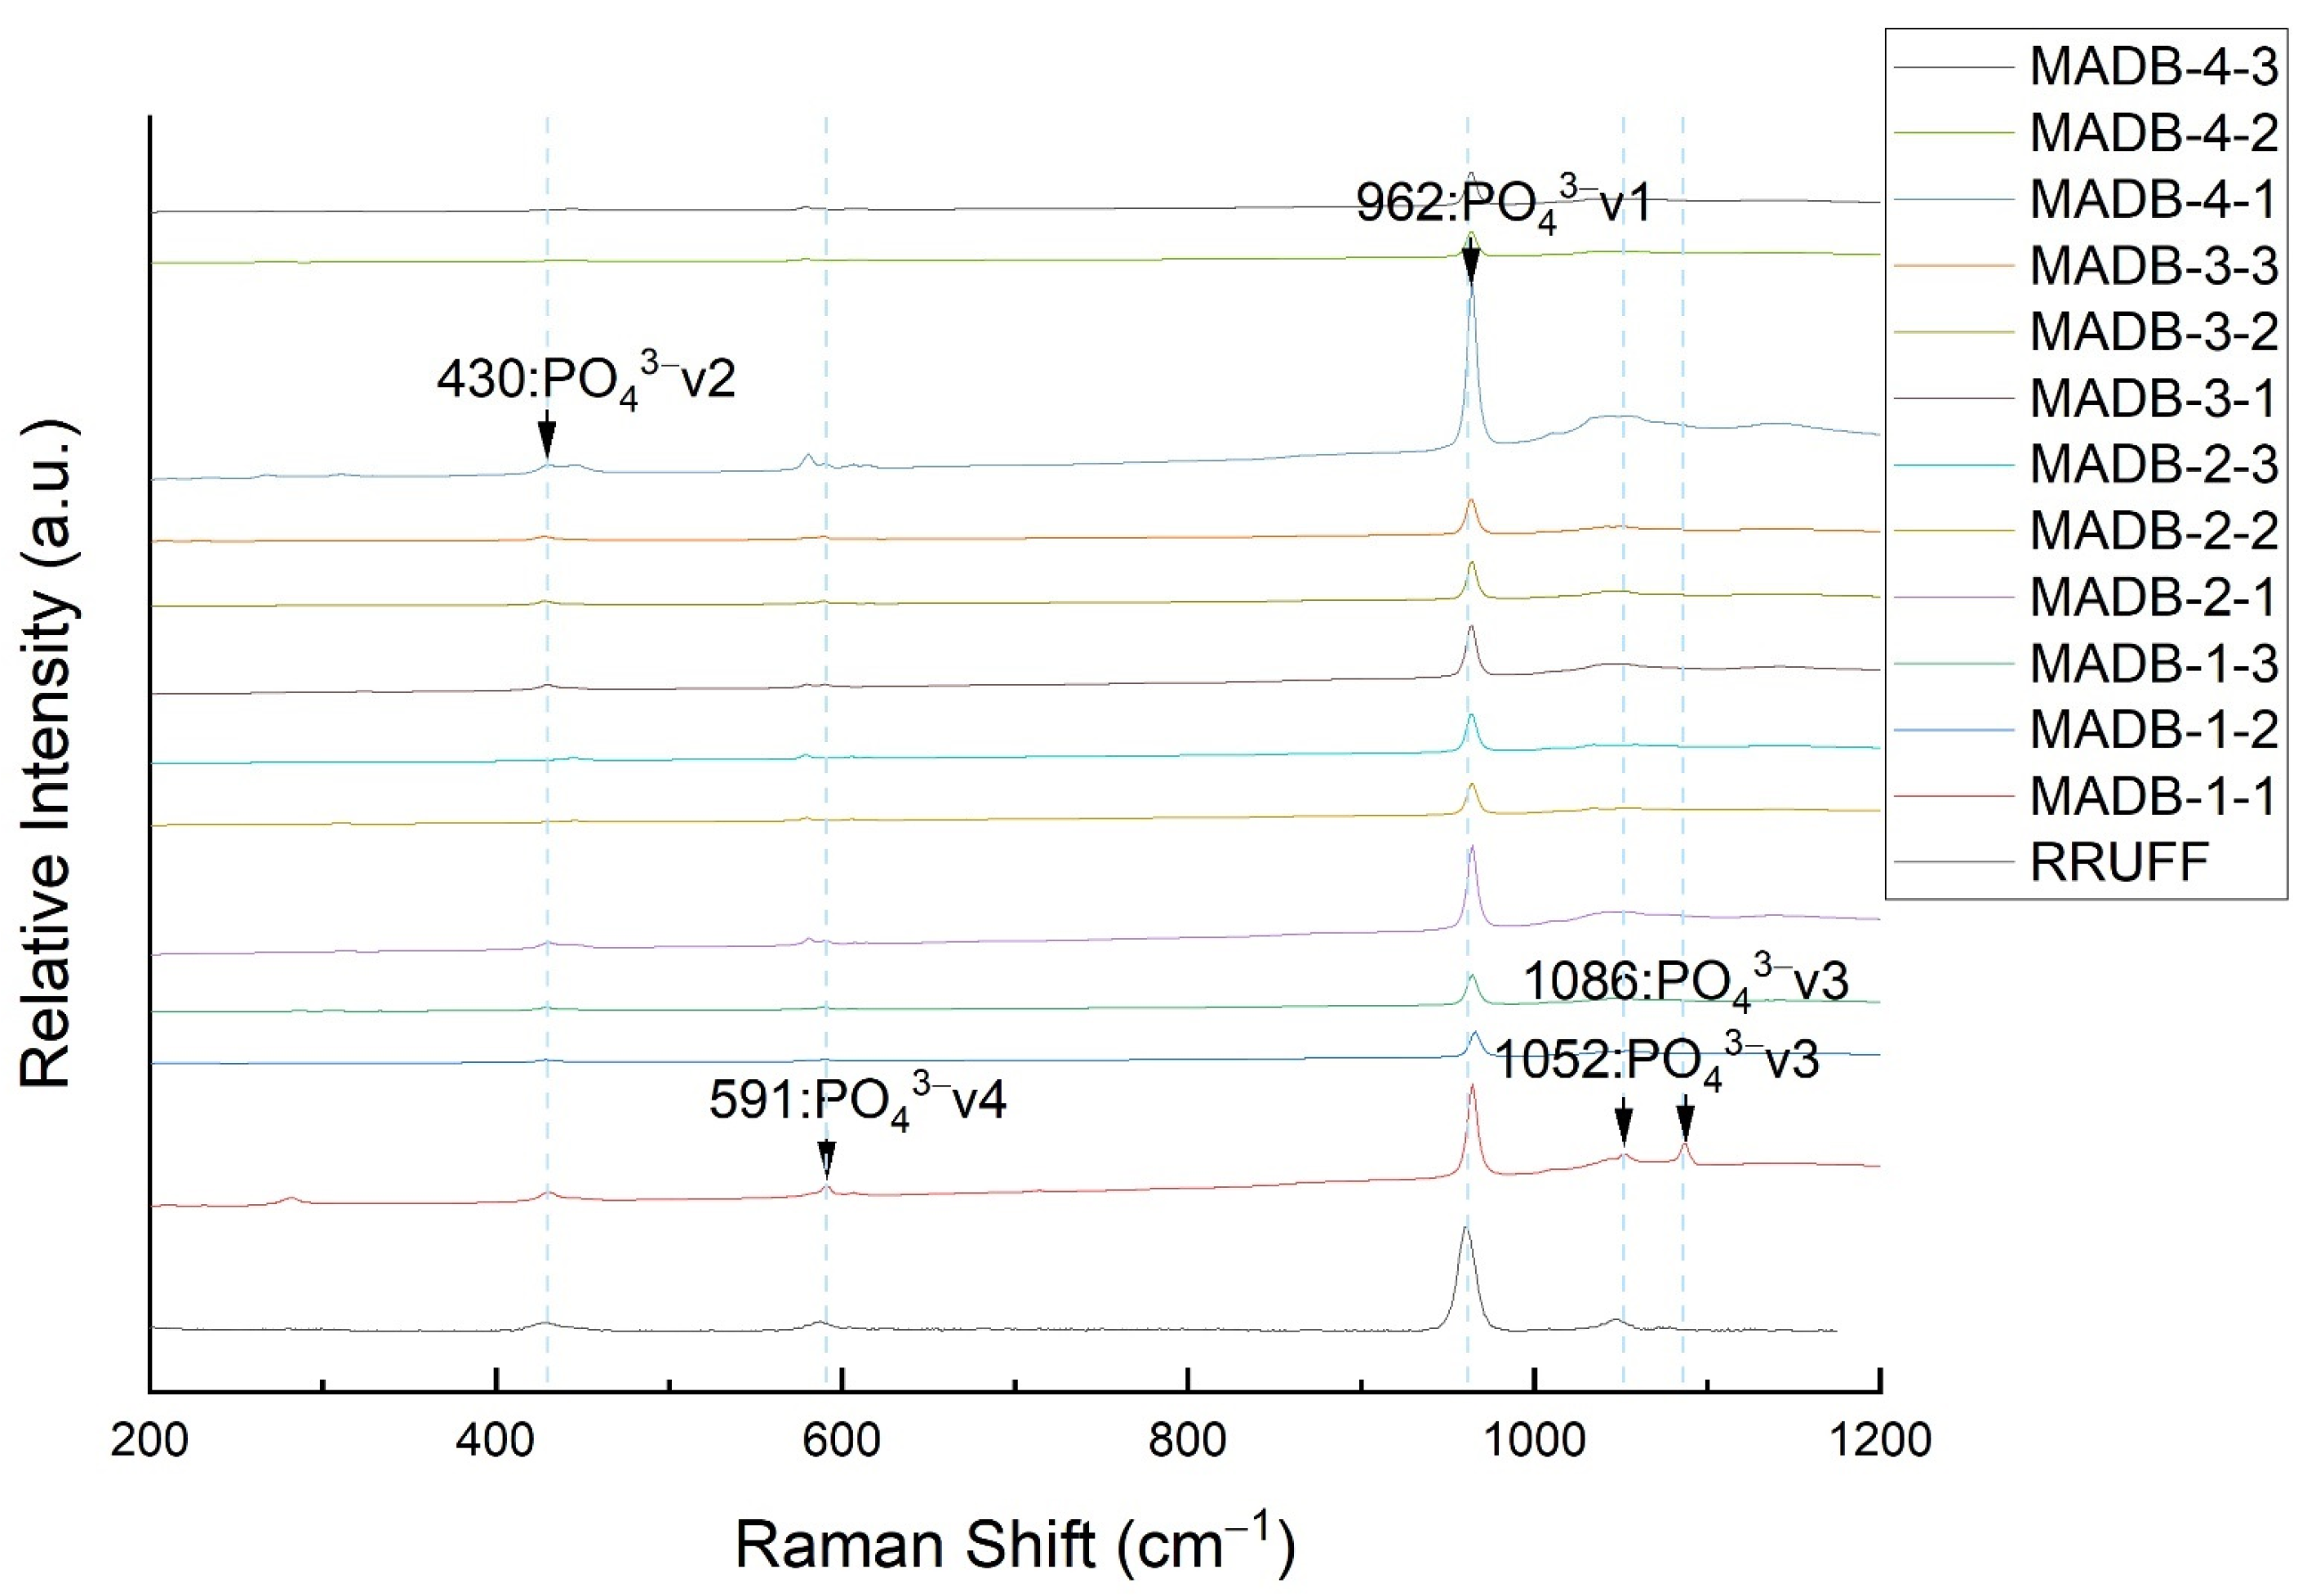
The Raman spectra of the Madagascar apatite appeared at 400−1500 cm
−1 [
8]. The Raman feature bands of the samples were chiefly reflected in the vibration of the [PO
4]
3− ion cluster [
31]. The symmetric stretching vibration (
v1) bands of the ion cluster were seen at 962–965 cm
−1. The bending vibration (
v2) bands were observed at 419–431 cm
−1. Asymmetric stretching vibration (
v3) bands were detected at 1040–1049 cm
−1, whilst asymmetric bending vibration(
v4) bands were detected at 575–593 cm
−1.
Figure 4 shows the Raman characteristic absorption peaks of the apatite samples. The strongest band at 962 cm
−1 was assigned to the symmetrical telescopic vibration(
v1) band of [PO
4]
3−. The symmetrical bending vibration band (
v2) at 430 cm
−1 was a weak band. Bands were found near 1052 cm
−1 and 1086 cm
−1, which were assigned to the asymmetric stretching vibration of [PO
4]
3−. In addition, a medium-strong absorption band at 591 cm
−1 assigned to the asymmetric bending vibration (
v4) was also observed. Since its Raman spectrum matches the standard Raman spectrum of fluorapatite well, the crystals from Madagascar resulted in fluorapatites, which confirms the results of infrared spectra.
4.2.3. UV-VIS Spectrum
The types and contents of REE directly affect the gemological properties of apatite, such as color and luminescence. We can determine the causes of the different colors of apatite through the UV-VIS spectrum and indirectly determine REE content in Madagascar apatite. Apatite with a high REE content absorbs more strongly in the ultraviolet region. This is mainly related to the high content of light REE (LREE) ions [
8]. As the concentration of REE, the apatite absorption of visible increases.
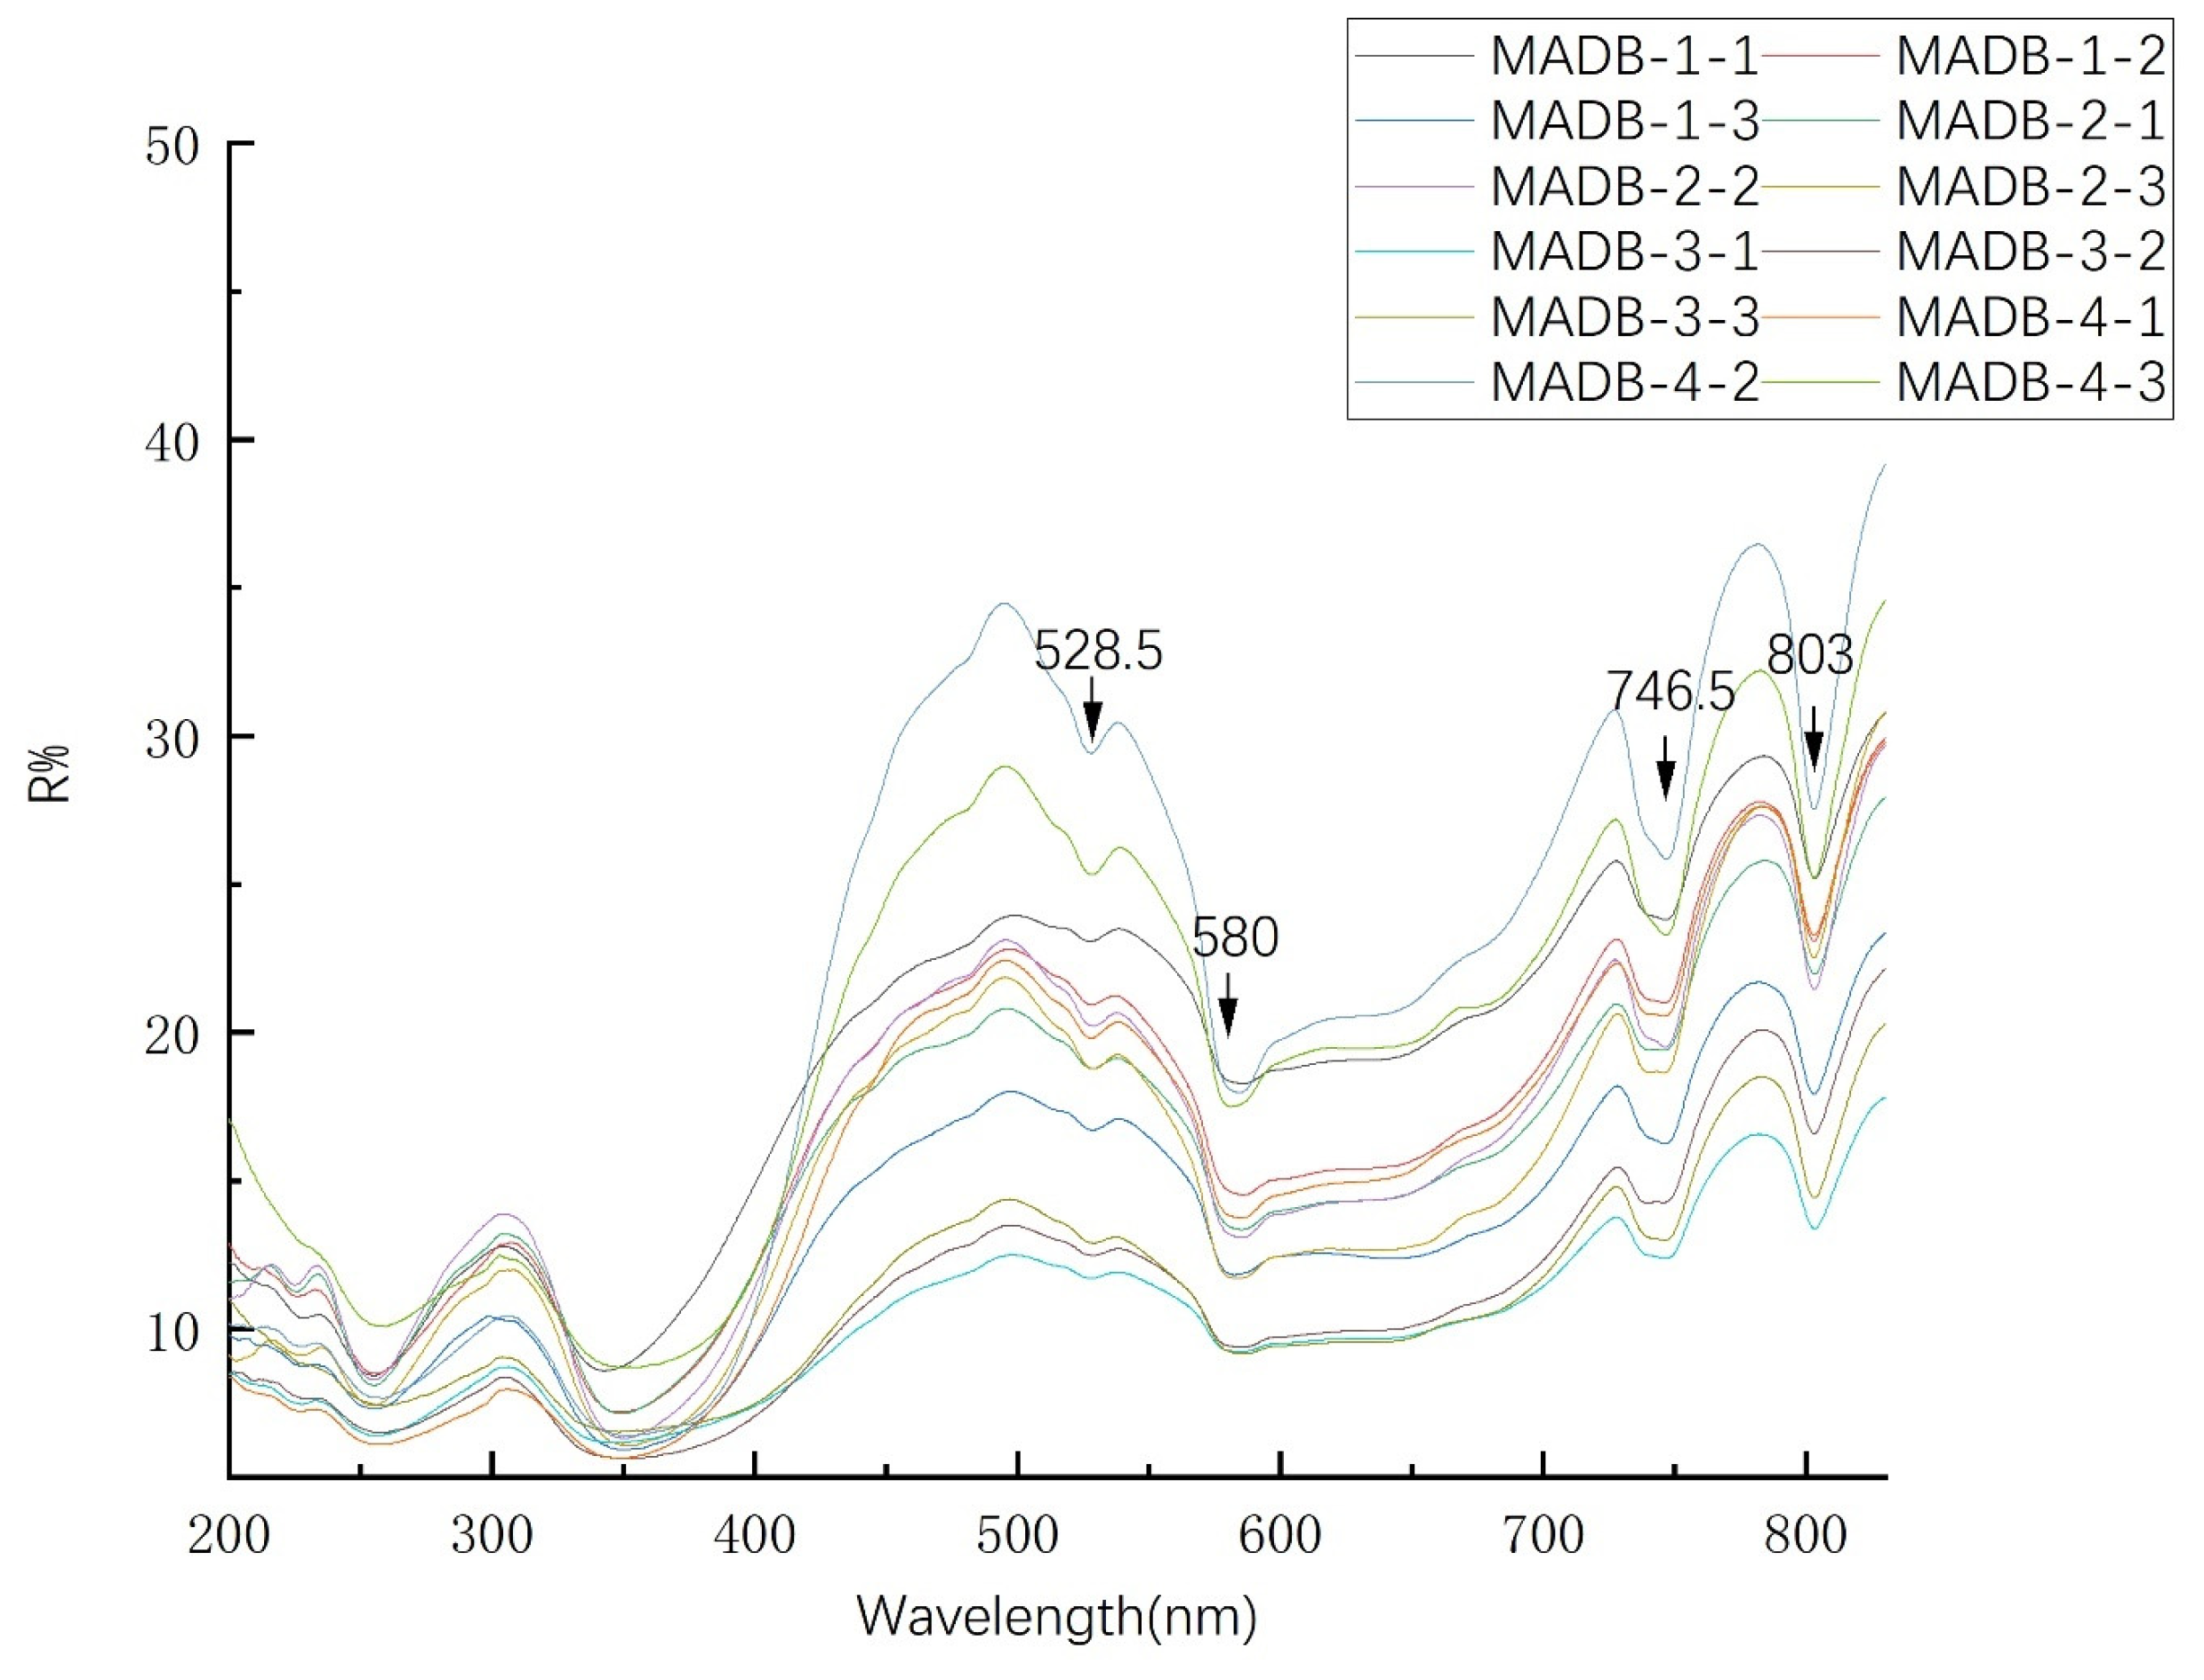
Figure 5 shows the MADB apatite UV-VIS spectra.
The UV-VIS spectrum revealed that the samples have significant absorptions between 580 nm and 700 nm. Strong reflections were found in 400–550 nm and 700–850 nm, that is, the green, blue−violet and near-infrared regions. The reflectivity in the ultraviolet region was generally low due to the strong absorption of Ce in the ultraviolet region. Moreover, compared with other rare earth elements, Ce has a more significant effect on the weakening of absorption in the blue and orange-red regions [
8]. The visible region had moderately pronounced reflectance troughs near 580 nm and 528.5 nm, whilst the infrared region showed sharp, strong hollow near 746.5 nm and 803 nm related to the Nd
3+ ion absorption [
13]. In a word, the color mechanism of MADB apatite was selective absorption of Ce and Nd in the orange-red areas and the ultraviolet regions. The appearance color and the UV-VIS spectrum can corroborate each other. Additionally, the absorptions at 528.5 nm, 580 nm, 746.5 nm and 803 nm can be one of the origin characteristics of Madagascar apatite.
4.3. Major and Trace Elements
Table A1 and
Table A2 present the major and trace elements of the analyzed apatite crystals. On the basis of the analytical results, the main chemical components of Madagascar apatite were CaO (54.16–54.92 wt%) and P
2O
5 (39.10–40.79 wt.%). The results were consistent with the compositional range of pyrogenic apatite (CaO = 54–57 wt.% and P
2O
5 = 39–44 wt.%) described by Belousova [
4].
According to the EPMA results, the chemical formula of MADB−1 was calculated to be (Ca4.499, Na0.015, Mn0.002, Sr0.013, Ce0.012)[P2.605Si0.047S0.009O12](F0.804, Cl0.022), whilst that of MADB−2 was (Ca4.513, Na0.006, Sr0.009, Ce0.012)[P2.607Si0.052S0.010O12](F0.780, Cl0.025), which is that of fluorapatite.
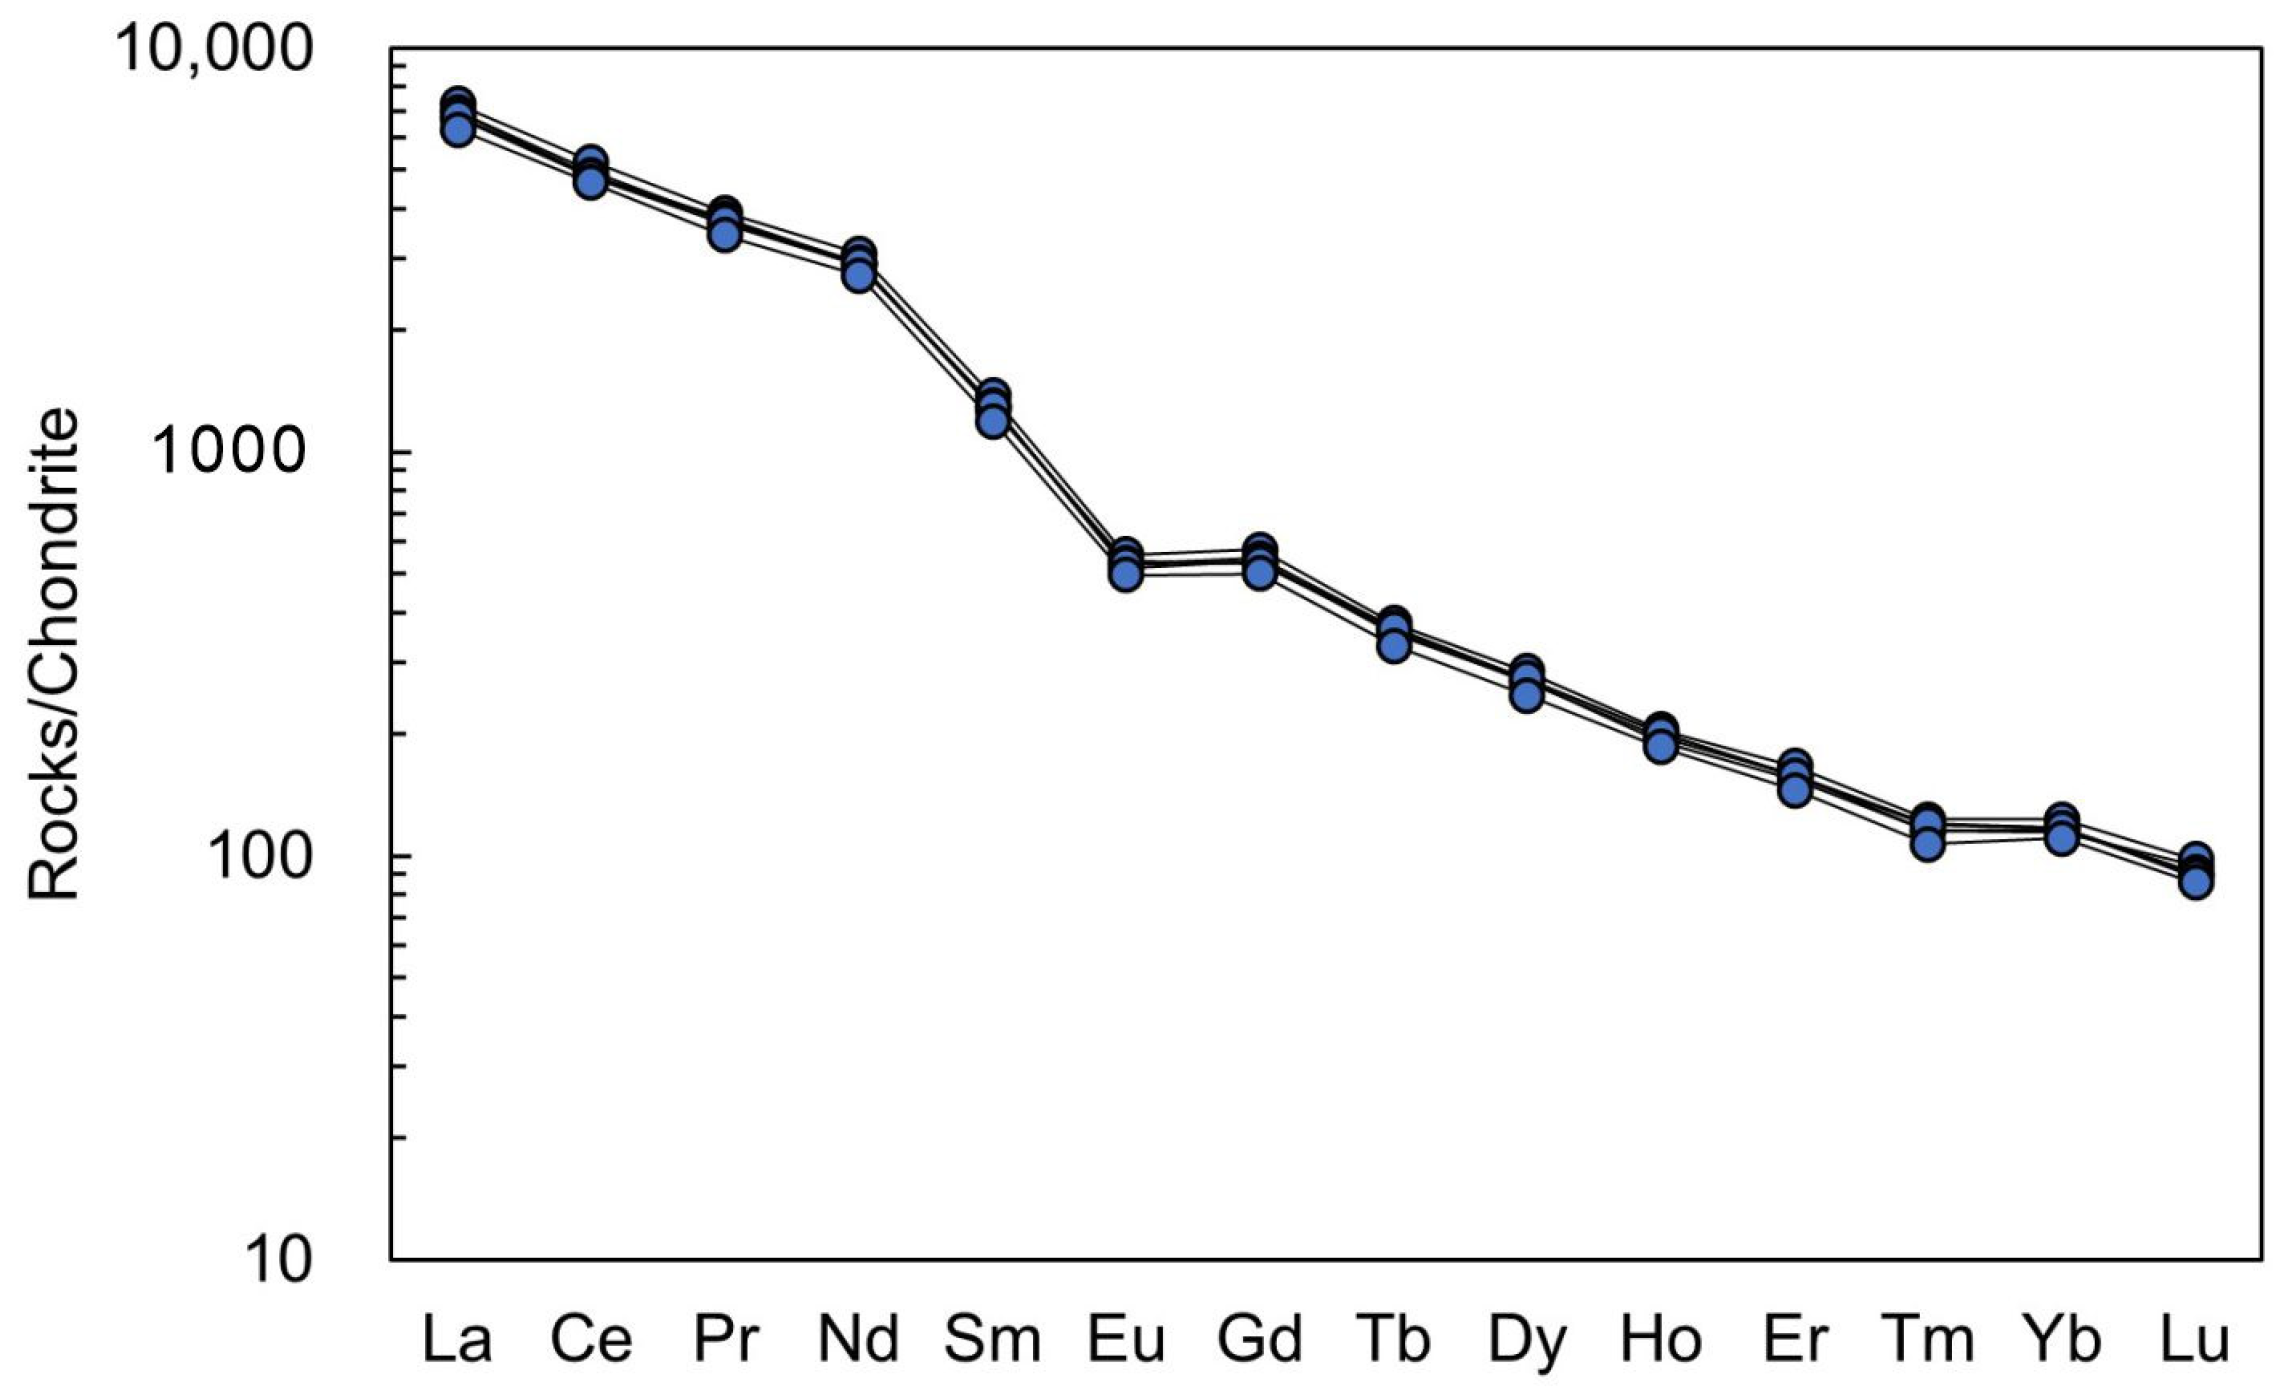
The trace elements in the Madagascar apatite included REE, Mn, Sr, Fe and Th. The samples contained 250–270 ppm of Mn, 2900–3095 ppm of Sr, 350–370 ppm of Fe and 665–900 ppm of Th. The total REE content of samples was 9000–10225 ppm. The LREE content was 8690–9860 ppm. The analytical results showed that in the chondrite standardization model (
Figure 6), the LREE were slightly enriched, and the HREE were relatively deficient. The δEu range was 0.62–0.66, showing a weak negative Eu anomaly. δCe ranged from 0.94 to 1.00 with no obvious Ce anomaly [
32].
5. Discussion
5.1. Gemological Characteristics
In this part, apatites from Madagascar, Morocco, Mexico and China (Shanxi, Shaanxi, Anhui) were in comparison (
Table A3). The color of the Madagascar apatite analyzed in this study was greenish blue, which is considered optimal in apatite gem evaluations. Apatites from other origins are yellow or green. Madagascar apatite diaphaneity is better than any other origin’s in comparison. The SG of Madagascar apatite was slightly lower than that of the apatite from other origins. Apatites from Madagascar and China (Shanxi and Shaanxi) were inert at the UV, while those from Mexico, Morocco and China (Anhui) had varying degrees of fluorescence. The shape of Madagascar apatite was plate-like or anhedral instead of hexagonal columnar from Shanxi, China.
5.2. Major and Trace Elements
5.2.1. Major Elements Characteristics of Apatite
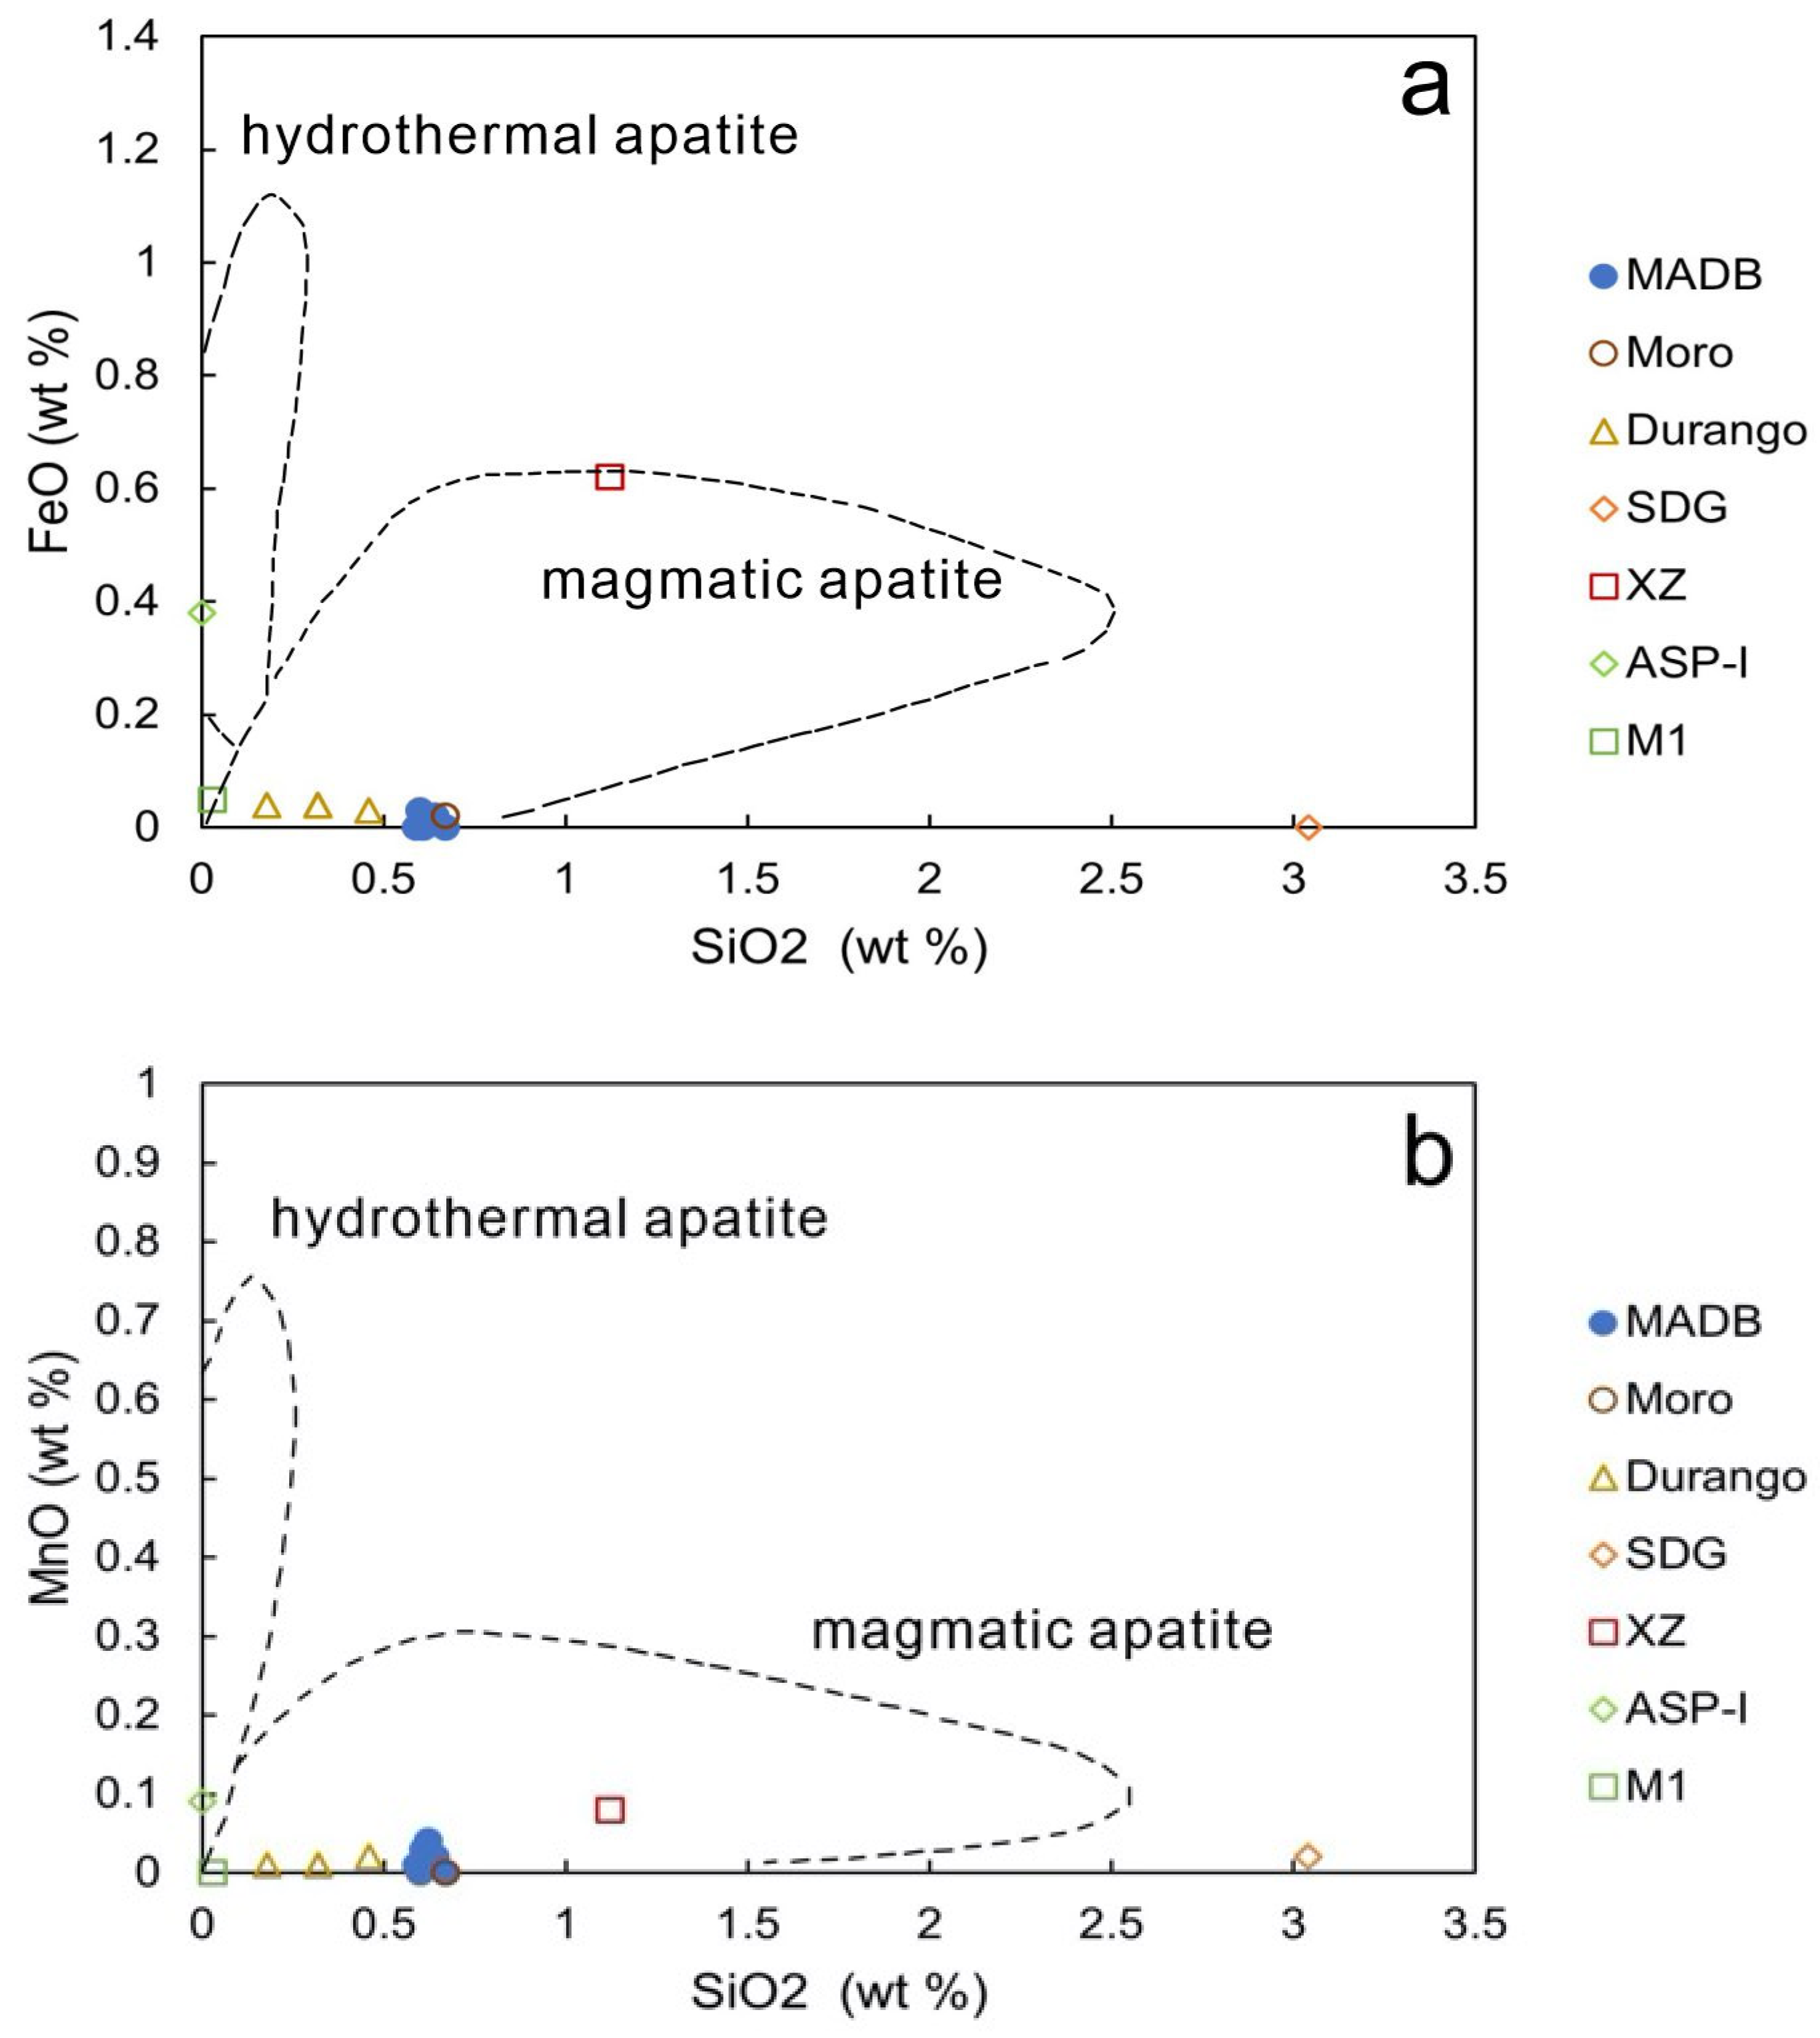
The previous studies [
31,
34,
35,
36] tested the following apatite samples: Durango in an iron mine from Mexico; Moro in igneous phosphate block rock from Morocco; SDG in an alkaline mafic complex, XZ in mafic sill and M1 in phosphorite-type rare earth deposit from China; ASP-I in Quaternary ignimbrites from Japan. The relationship between SiO
2, FeO and MnO contents in apatite can reflect the apatite origin [
31,
37,
38]; therefore, the MADB apatite were plotted against those from the other sources (
Figure 7). The plots confirm the magmatic origin of the blue–green apatite analyzed in this work.
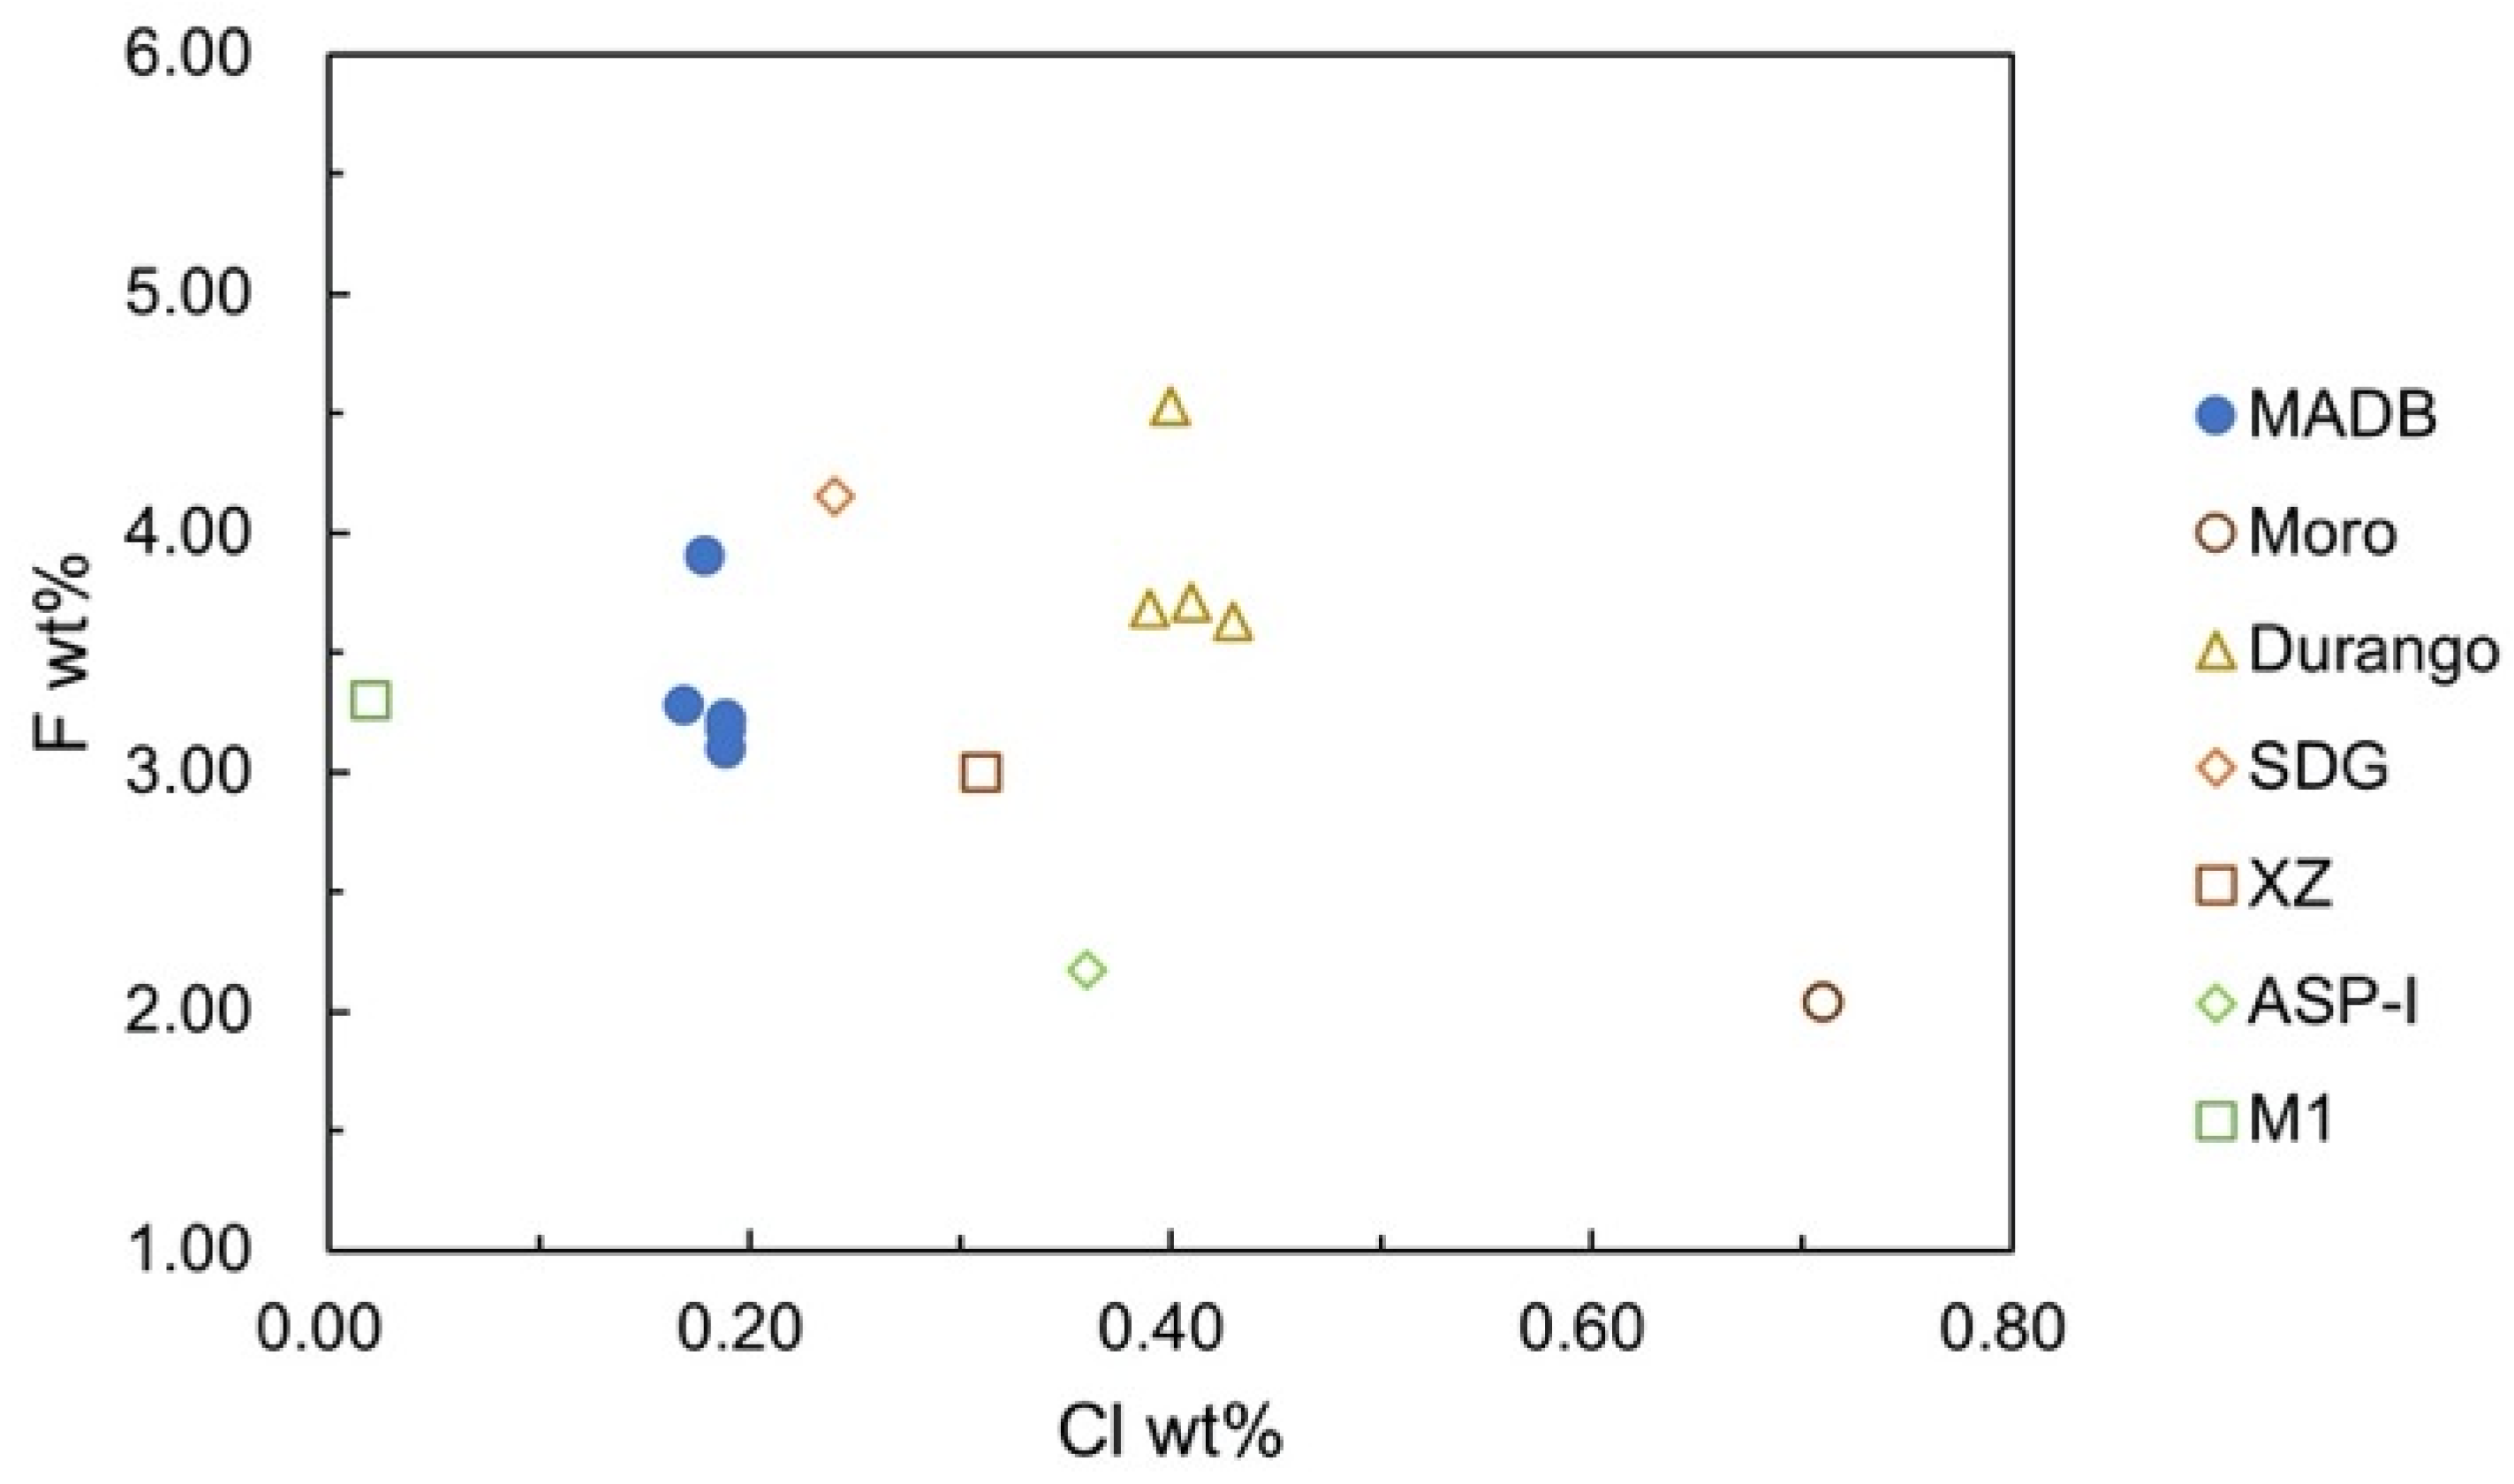
The F content of apatite in Madagascar ranged from 3.10 wt.% to 3.90 wt.%, and the Cl content ranged from 0.17 wt.% to 0.19 wt.% (
Appendix A Table A1), showing that the MADB apatite is fluorapatite. The Madagascar apatite had a high F/Cl ratio (16.47 to 21.89) compared with apatite from Mexico, Morocco and Japan (
Figure 8,
Table A4). The Cl content in the apatite was directly related to the Cl content in the parent magma, suggesting that the Madagascar magma had a lower Cl content than magma from the other regions. F was difficult to remove due to its low solubility in water. Therefore, the rock mass remelted in the crust often exhibited F-rich and Cl-poor characteristics reflected in the F and Cl compositions of apatite [
39]. The MADB apatite was verified to be of magmatic origin [
40,
41]. Sha et al. (2018) verified that the high F/Cl ratio is also related to the Cl loss during the weathering processes forming the source rocks [
13].
5.2.2. Rare Earth Element Characteristics of Apatite
The trace element data for apatite showed that apatite can accommodate a wide range of structural distortion due to chemical substitutions [
25] (
Table A2 and
Table A5).
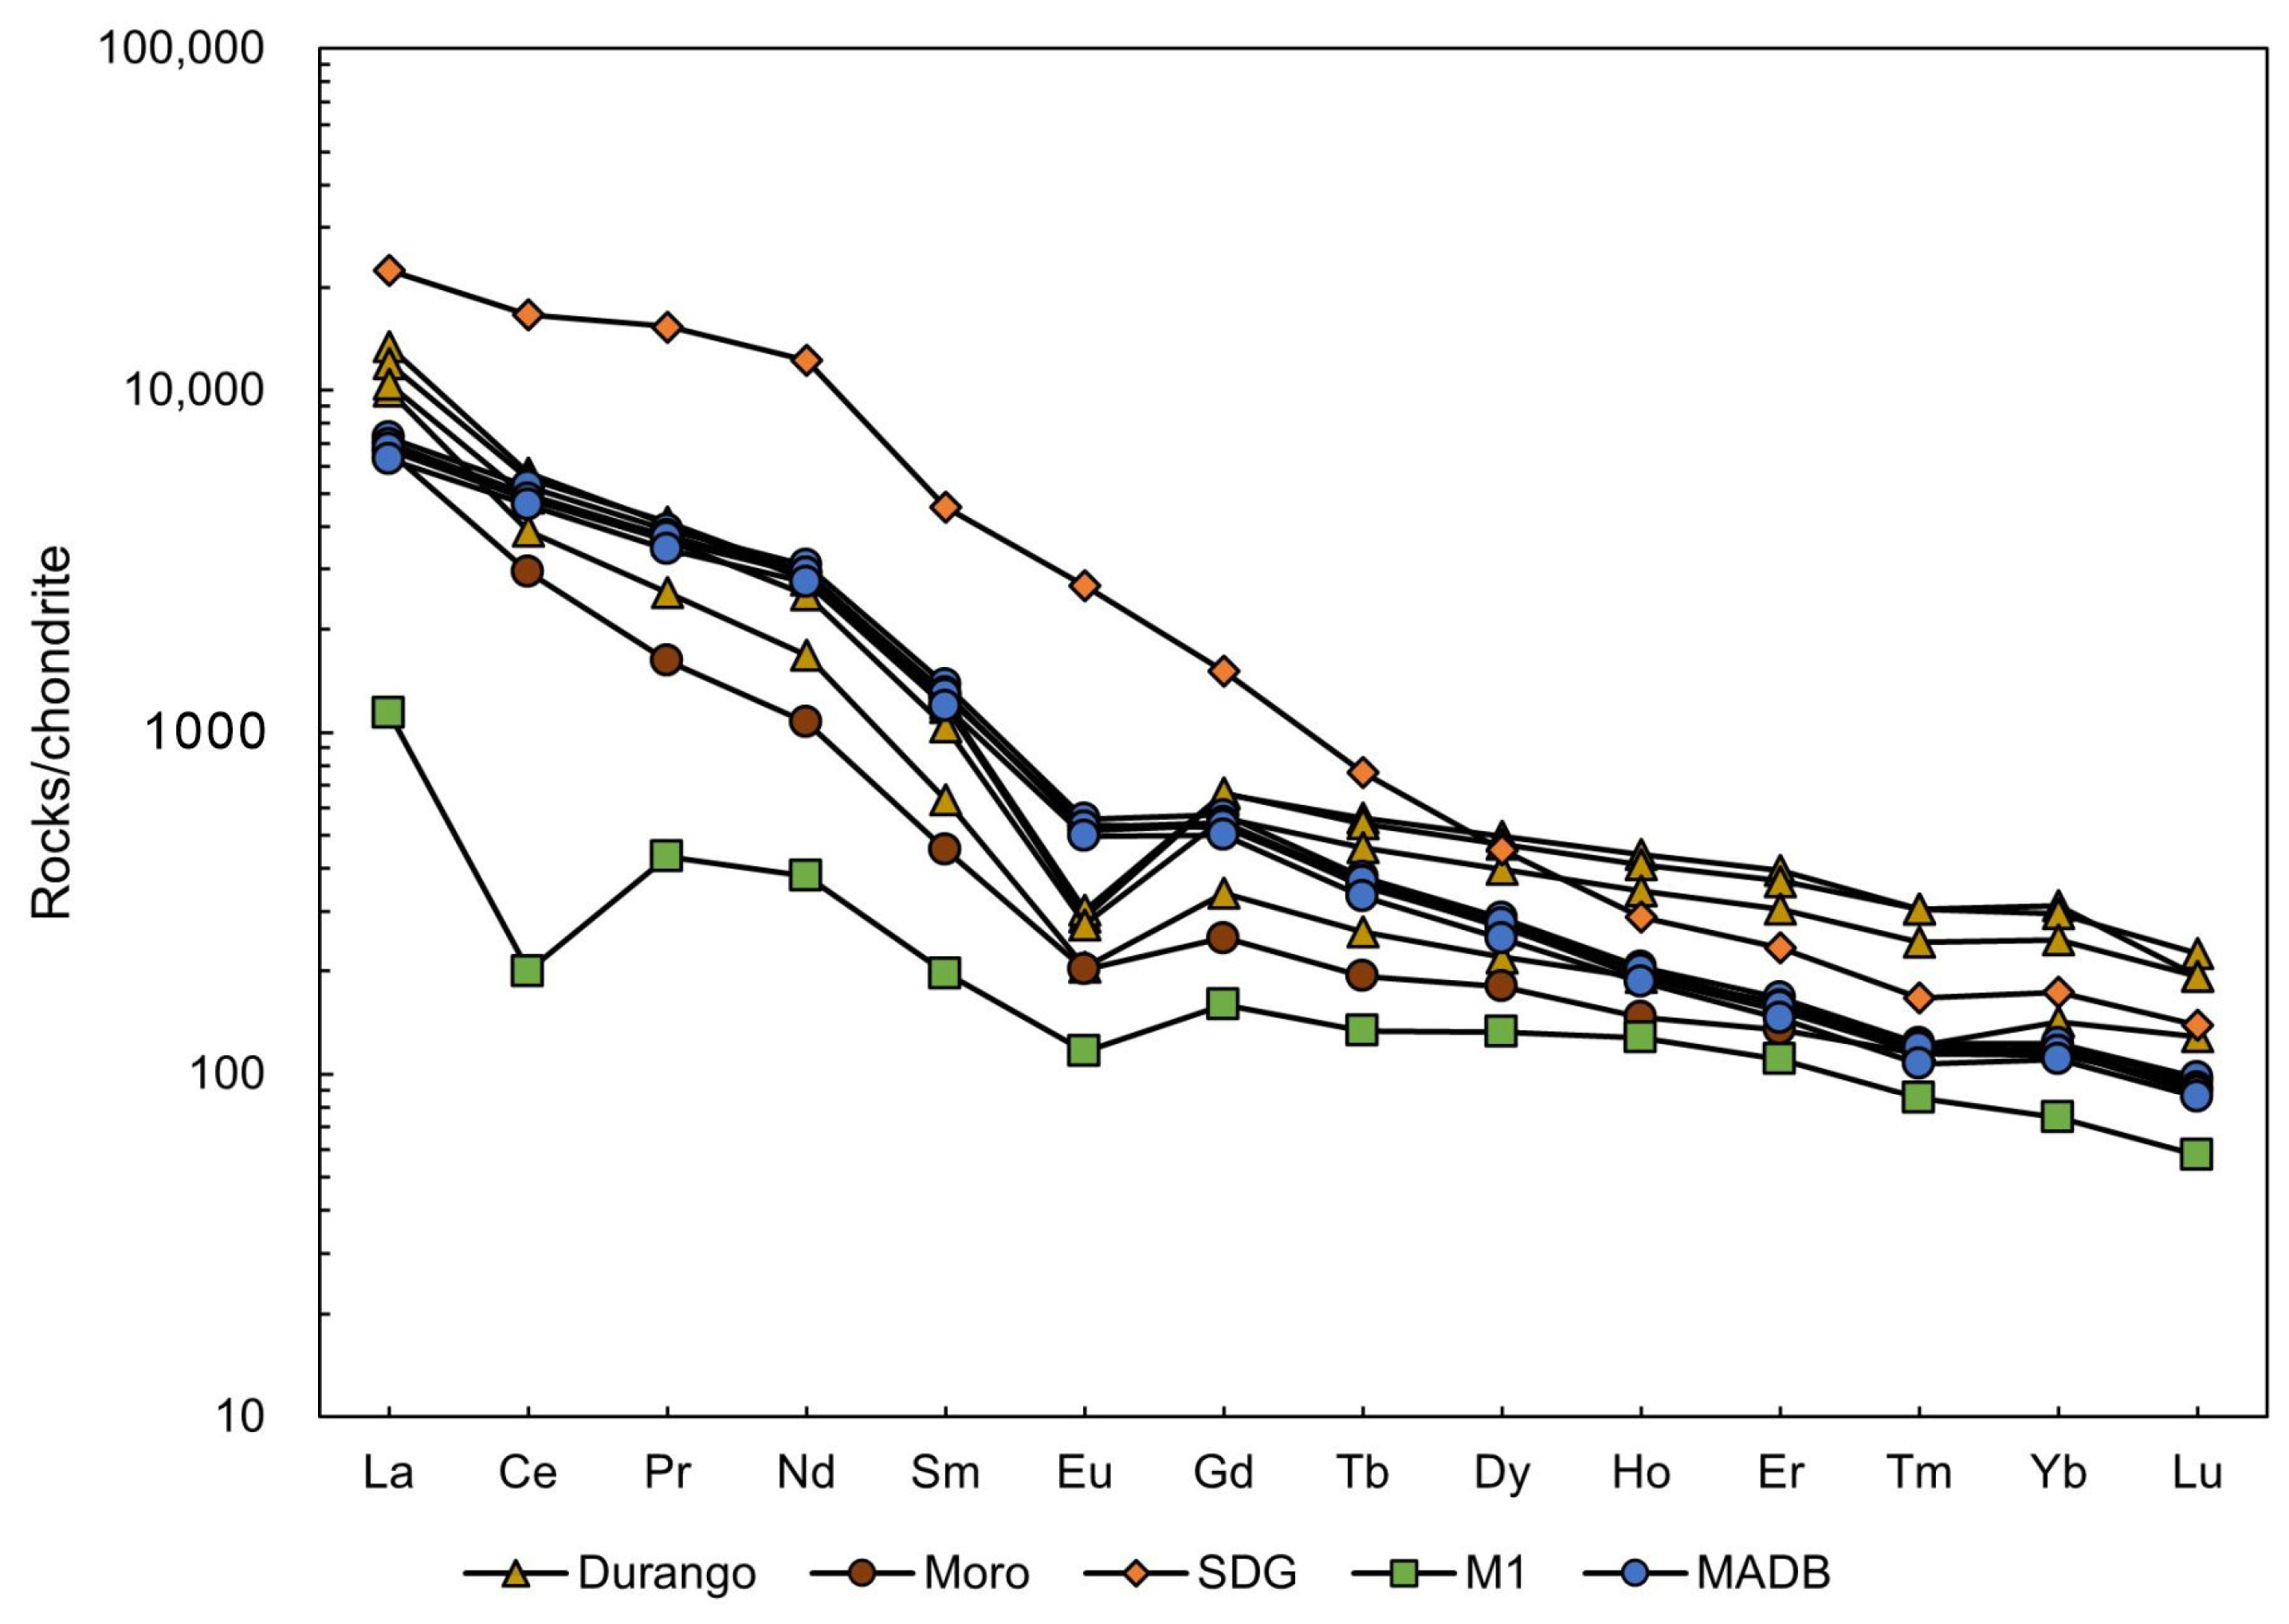
The chondrite-normalized REE distribution patterns of apatite usually show negative slopes (high (Ce/Yb)
N), indicating a relative enrichment in the LREE (
Figure 9) [
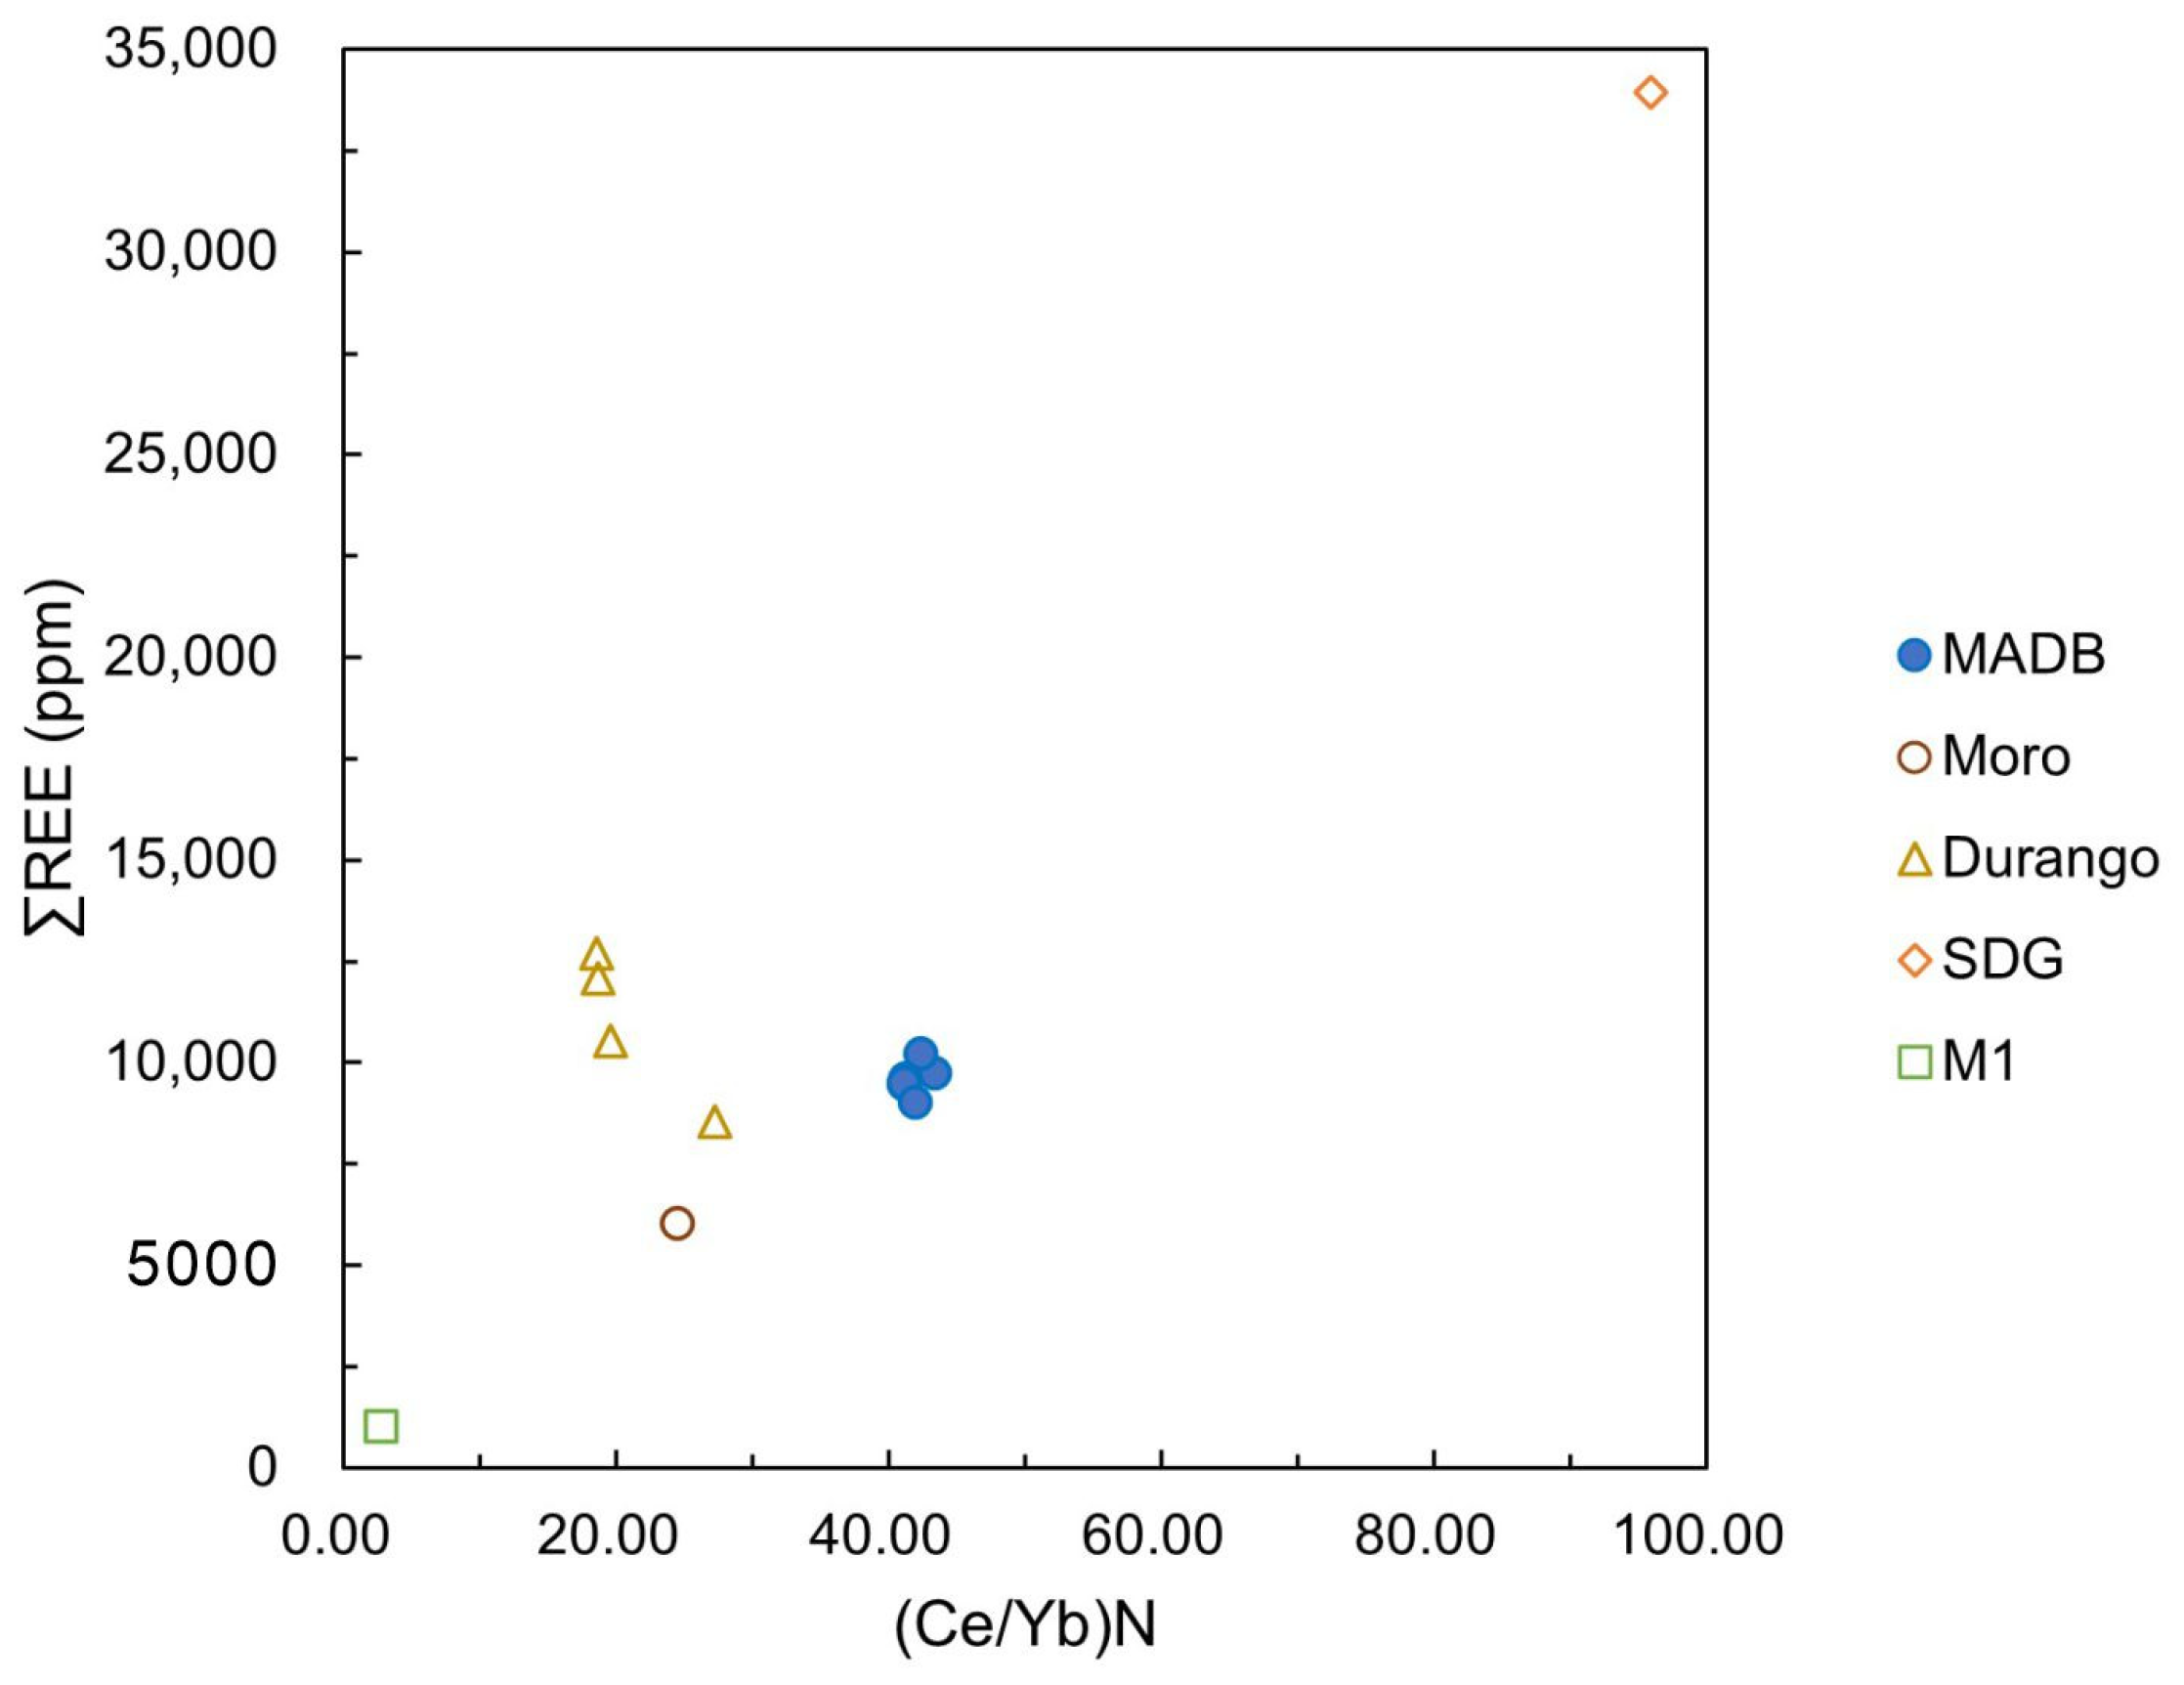
4]. The Madagascar apatite had (Ce/Yb)
N equaling 41.07–43.36, showing its LREE enrichment (
Figure 10). The Moro and Durango samples had (Ce/Yb)
N equaling 24.51 and 18.52–27.21, respectively. M1 apatite only had that equaling 2.68. In general, the δCe of igneous apatite was almost equal to 1, indicating the absence of an obvious Ce anomaly. However, microcrystalline apatite M1 from sedimentary carbonate rocks showed a negative Ce anomaly, which could be one of the differences between the igneous and sedimentary apatite. In contrast, a negative Eu anomaly was found in the magmatic apatite samples (i.e., Durango, Moro and MADB), whilst the M1 apatite had a weak negative Eu anomaly, and the SDG apatite had no obvious Eu anomaly. Conversely, the ΣREE in magmatic apatite were much more abundant compared to the sedimentary apatite. As shown in the slope in
Figure 9, the distribution of the REE content of the sedimentary apatite is more uniform.
5.2.3. Redox Characteristics of Magma
The Mn content in the apatite was negatively correlated with the magma oxygen fugacity. Miles et al. [
25] proposed an empirical formula for calculating the magma oxygen fugacity with the Mn content in apatite: lg fO
2 = −0.0022(±0.0003) Mn (ppm) − 9.75(±0.46). Introducing the experimental data from the MADB apatite into the formula, we obtained the results of −10.30 to −10.35. Overall, the magma in the Madagascar area had a high oxygen fugacity. Sha et al. [
13] also pointed out that apatite with <900 ppm Mn and <2100 ppm Fe had a high oxygen fugacity, which was consistent with the above-mentioned description.
The study of Prowatke et al. [
43] indicated that the Mg and Fe contents of apatite were positively related to those of the source magma. The Mg and Fe contents of Madagascar apatite were extremely low, with 21.65–23.44 ppm of Mg and 349.36–372.50 ppm of Fe. It can be rolled out that the magma had very few Mg and Fe elements, which is an iconic feature of felsic magmatic rocks. The XZ and ASP−I apatite were rich in Mg and Fe, corresponding to the characteristics of the parent rock (i.e., XZ was from mafic rocks) [
44].
6. Conclusions
After the analyses above, the origin information of Madagascar apatite has been established.
Madagascar apatite crystals have a rare greenish–blue color and excellent diaphaneity, with a low degree of self-formation and slightly lower SG (3.172–3.195). The color mechanism of Madagascar apatite is selective absorption of Ce and Nd in the orange−red areas and the ultraviolet regions indicated by UV–VIS spectrum. In the crystal lattice, there exists splitting of the P–O bond indicated by the infrared spectrum.
According to the spectroscopic and major element analyses, Madagascar apatite is determined as igneous fluorapatite, with an extremely high F/Cl ratio (16.47–21.89). Due to the Cl loss during the weathering processes forming the source rocks, the F/Cl ratio of Madagascar apatite was the highest among the igneous apatite from different origins in comparison, and it also indicates the F-rich and Cl-poor characteristics in the parent rock. In addition, the FeO, MgO and SiO2 content of Madagascar apatite can also reflect its magmatic origin.
Madagascar apatite has a relatively high LREE enrichment compared with other origins apatite, except SDG. The high (Ce/Yb)N (41.07–43.36) makes Madagascar apatite different from others. Additionally, the Mn, Mg and Fe concentrations of Madagascar apatite indicated the high oxygen fugacity and the felsic magmatic parent rocks (such as granite in the Ambatondrazaka region).
In summary, the igneous greenish blue apatite from Madagascar has a good scientific value and can be further studied as a standard sample.
Author Contributions
Writing—original draft, Z.-Y.Z.; writing—review and editing, Z.-Y.Z., B.X., P.-Y.Y. and Z.-X.W.; investigation, B.X.; data curation, Z.-Y.Z.; software, Z.-Y.Z.; methodology, B.X.; resources, B.X. All authors have read and agreed to the published version of the manuscript.
Funding
This research was funded by the National Key Technologies R&D Program 2019YFC0605201, 2019YFA0708602, 2020YFA0714802, National Natural Science Foundation of China (42073038, 41803045), Young Talent Support Project of CAST (IGCP-662), Fundamental Research Funds for the Central Universities (265QZ2021012) and Innovation and Entrepreneurship Training Program for College Students of China University of Geosciences (Beijing) (202211415060).
Data Availability Statement
The data presented in this study are available within the article.
Acknowledgments
This is the 9th contribution of BX to the National Mineral Rock and Fossil Specimens Resource Center. Thanks to the two reviewers and the editors for their comprehensive and professional suggestions.
Conflicts of Interest
The authors declare no conflict of interest.
Appendix A
Table A1.
Chemical composition and structural formula of Madagascar apatite, determined by EMPA (in wt%).
Table A1.
Chemical composition and structural formula of Madagascar apatite, determined by EMPA (in wt%).
| | F | Na2O | CaO | P2O5 | SO3 | SiO2 | FeO | MnO | Cl | SrO | Ce2O3 | Total |
| MADB−1−1 | 3.28 | 0.10 | 54.16 | 39.68 | 0.45 | 0.61 | 0.00 | 0.03 | 0.17 | 0.21 | 0.42 | 99.10 |
| MADB−1−2 | 3.90 | 0.11 | 54.68 | 39.10 | 0.41 | 0.62 | 0.01 | 0.04 | 0.18 | 0.13 | 0.42 | 99.59 |
| MADB−1−3 | 3.10 | 0.08 | 54.92 | 39.56 | 0.50 | 0.64 | 0.02 | 0.02 | 0.19 | 0.25 | 0.30 | 99.57 |
| MADB−2−1 | 3.18 | 0.04 | 54.31 | 39.71 | 0.50 | 0.67 | 0.00 | 0.00 | 0.19 | 0.15 | 0.42 | 99.14 |
| MADB−2−2 | 3.22 | 0.06 | 54.54 | 40.10 | 0.50 | 0.60 | 0.03 | 0.00 | 0.19 | 0.24 | 0.38 | 99.86 |
| MADB−2−3 | 3.22 | 0.12 | 54.26 | 40.79 | 0.50 | 0.59 | 0.00 | 0.01 | 0.19 | 0.21 | 0.34 | 100.22 |
| | Si4+ | Fe2+ | Mn2+ | Ca2+ | Na+ | F− | Cl− | S6+ | Sr2+ | P5+ | Ce2+ | |
| MADB−1−1 | 0.047 | 0.000 | 0.002 | 4.503 | 0.015 | 0.805 | 0.022 | 0.009 | 0.004 | 2.607 | 0.012 | |
| MADB−1−2 | 0.048 | 0.001 | 0.003 | 4.508 | 0.016 | 0.949 | 0.023 | 0.008 | 0.003 | 2.547 | 0.012 | |
| MADB−1−3 | 0.050 | 0.001 | 0.001 | 4.564 | 0.012 | 0.760 | 0.025 | 0.010 | 0.005 | 2.598 | 0.009 | |
| MADB−2−1 | 0.047 | 0.000 | 0.002 | 4.503 | 0.015 | 0.805 | 0.022 | 0.009 | 0.004 | 2.607 | 0.012 | |
| MADB−2−2 | 0.045 | 0.000 | 0.000 | 4.515 | 0.006 | 0.780 | 0.025 | 0.010 | 0.003 | 2.609 | 0.012 | |
| MADB−2−3 | 0.047 | 0.000 | 0.001 | 4.446 | 0.018 | 0.779 | 0.025 | 0.010 | 0.004 | 2.641 | 0.010 | |
Table A2.
Chemical composition and structural formula of Madagascar apatite, analyzed by LA−ICP−MS.
Table A2.
Chemical composition and structural formula of Madagascar apatite, analyzed by LA−ICP−MS.
| Element | | MADB−1−1 | MADB−1−2 | MADB−1−3 | MADB−1−4 | MADB−1−5 | MADB−2−1 |
|---|
| Mg | ppm | 22.50 | 22.26 | 22.31 | 23.44 | 22.00 | 21.65 |
| Si | ppm | 1.13 | 0.00 | 1.13 | 0.98 | 0.00 | 0.00 |
| P | % | 28.762672 | 29.974847 | 28.265906 | 28.425884 | 27.471936 | 27.462787 |
| Cl | ppm | 1530.50 | 1830.53 | 1450.26 | 1229.59 | 1162.63 | 962.15 |
| Ca | % | 57.194298 | 57.452847 | 55.776887 | 54.186530 | 54.832854 | 52.793121 |
| Ti | ppm | 0.02 | 0.04 | 0.10 | 0.00 | 0.33 | 0.44 |
| Mn | ppm | 270.14 | 271.57 | 265.52 | 266.64 | 252.03 | 254.65 |
| Fe | ppm | 369.65 | 372.50 | 350.25 | 353.04 | 349.36 | 353.09 |
| Rb | ppm | 0.00 | 0.00 | 0.09 | 0.00 | 0.00 | 0.00 |
| Sr | ppm | 3093.09 | 3132.23 | 3044.83 | 2944.21 | 2902.41 | 2941.15 |
| Zr | ppm | 0.00 | 0.00 | 0.00 | 0.00 | 0.00 | 0.00 |
| Nb | ppm | 0.74 | 0.92 | 1.12 | 1.29 | 0.69 | 1.19 |
| Ba | ppm | 0.29 | 0.81 | 0.80 | 0.52 | 0.17 | 0.52 |
| La | ppm | 2231.74 | 2319.83 | 2216.59 | 2145.67 | 2161.80 | 2008.82 |
| Ce | ppm | 4651.92 | 4903.57 | 4529.55 | 4498.58 | 4509.20 | 4353.56 |
| Pr | ppm | 447.20 | 467.68 | 452.40 | 437.65 | 445.81 | 411.92 |
| Nd | ppm | 1769.42 | 1852.47 | 1755.73 | 1735.78 | 1745.71 | 1641.37 |
| Sm | ppm | 254.67 | 275.52 | 258.72 | 260.48 | 257.39 | 237.86 |
| Eu | ppm | 39.20 | 40.59 | 38.63 | 37.56 | 38.42 | 36.17 |
| Gd | ppm | 163.59 | 177.31 | 168.50 | 165.87 | 164.65 | 154.73 |
| Tb | ppm | 17.93 | 18.82 | 18.23 | 17.75 | 18.29 | 16.53 |
| Dy | ppm | 83.52 | 88.63 | 84.73 | 84.05 | 85.11 | 77.26 |
| Ho | ppm | 14.29 | 14.98 | 14.68 | 13.98 | 14.63 | 13.55 |
| Er | ppm | 33.09 | 35.00 | 33.17 | 32.34 | 32.93 | 30.49 |
| Tm | ppm | 3.79 | 4.06 | 3.96 | 3.81 | 3.94 | 3.52 |
| Yb | ppm | 21.68 | 23.40 | 22.21 | 22.14 | 22.19 | 20.98 |
| Lu | ppm | 2.92 | 3.04 | 2.82 | 2.78 | 2.75 | 2.65 |
| Hf | ppm | 0.04 | 0.02 | 0.03 | 0.03 | 0.03 | 0.03 |
| Ta | ppm | 0.01 | 0.02 | 0.01 | 0.02 | 0.02 | 0.02 |
| Hg | ppm | 0.00 | 0.00 | 0.00 | 0.00 | 0.00 | 0.00 |
| Pb | ppm | 14.53 | 18.24 | 17.54 | 17.56 | 17.64 | 16.70 |
| Th | ppm | 665.42 | 835.65 | 825.05 | 819.24 | 854.73 | 800.74 |
| U | ppm | 22.98 | 25.80 | 23.07 | 22.63 | 22.93 | 21.45 |
| ΣLREE | ppm | 9394.14 | 9859.66 | 9251.60 | 9115.72 | 9158.34 | 8689.70 |
| ΣHREE | ppm | 340.80 | 365.24 | 348.29 | 342.71 | 344.48 | 319.71 |
| ΣREE | ppm | 9734.94 | 10224.90 | 9599.89 | 9458.43 | 9502.81 | 9009.41 |
| δEu | | 0.66 | 0.63 | 0.63 | 0.62 | 0.64 | 0.64 |
| δCe | | 0.97 | 0.98 | 0.94 | 0.97 | 0.96 | 1.00 |
Table A3.
Characteristics of apatite from different production areas. Data derived from [
31,
38].
Table A3.
Characteristics of apatite from different production areas. Data derived from [
31,
38].
| Origin | Color | Lustre | Diaphaneity | RI | DR | SG | UV | Size | Feature |
|---|
| Madagascar | Greenish blue | Glassy luster | Transparent | 1.63−1.64 | | 3.17−3.20 | Inert | The largest of which measured 12∗10∗9 mm | Plate-like or anhedral, with internal fissures, flat surface black short−columnar and orange−red inclusions |
| Durango, Mexico | Uniform yellow−green | Glassy luster | Transparent | 1.631−1.636 | 0.005 | 3.21 | Inert to long−wave; weak yellow to short−wave | The largest of which measured 14.97∗9.47∗7.97 mm | Emerald- and cushion-cut. The cushion-cut stone revealed straight growth zoning. The emerald-cut contained a small liquid feather |
| Anemzi, Morocco | Yellow−green | Glassy to weak glassy luster | Translucent | 1.635−1.640 | | 3.18−3.20 | Inert to long−wave; weak purple to short−wave | The largest of which measured 14∗8∗7.97 mm | Hexagonal columnar crystal shape, with many fissures, shell-like or irregular fractures, visible crystal face longitudinal pattern |
| Shanxi, China | Yellow, dark green to dark blue−green | Glassy luster | Translucent | 1.632−1.639 | 0.004 | 3.19−3.23 | Inert | The largest of which measured 30∗10∗5 mm | Hexagonal columnar or subhexagonal columnar crystal form; high degree of self-formation showing massive or columnar |
| Shaanxi, China | Gray−green | Glassy luster | Sub−transparent | 1.633−1.637 | 0.004 | 3.21−3.23 | Inert | The largest of which measured 6.5∗4∗4 mm | Massive, with hexagonal columnar crystal form, high degree of self−formation, smooth surface, and poor cleavage |
| Anhui, China | Light yellow | Glassy luster to weak glassy luster | Transparent to translucent | 1.633−1.637 | 0.004 | 3.18−3.20 | Medium yellow−green | The largest of which measured 15∗4∗5 mm | Sheet-like and plate-like, poorly self-formation, no obvious crystalline shape, longitudinal lines between crystal faces |
Table A4.
Chemical composition and structural formula of apatite from other origins, determined by EMPA (in wt%). Data derived from [
31,
34,
35,
36,
42].
Table A4.
Chemical composition and structural formula of apatite from other origins, determined by EMPA (in wt%). Data derived from [
31,
34,
35,
36,
42].
| | DurangoChew | DurangoFishier | DurangoGriffin | DurangoHou | Moro | SDG | XZ | ASP−I | M1 |
|---|
| F | 3.71 | 3.63 | 4.53 | 3.68 | 2.04 | 4.15 | 3.00 | 2.17 | 3.30 |
| CaO | 53.90 | 53.99 | 53.85 | 53.85 | 54.10 | 51.58 | 54.58 | 53.89 | 55.57 |
| P2O5 | 41.88 | 42.16 | 41.91 | 41.91 | 39.63 | 34.48 | 41.57 | 43.56 | 38.17 |
| SiO2 | 0.46 | 0.18 | 0.32 | 0.32 | 0.67 | 3.04 | 1.12 | − | 0.03 |
| FeO | 0.03 | 0.04 | 0.04 | 0.04 | 0.02 | − | 0.62 | 0.38 | 0.05 |
| MnO | 0.02 | 0.01 | 0.01 | 0.01 | 0.00 | 0.02 | 0.08 | 0.09 | 0.00 |
| Cl | 0.41 | 0.43 | 0.40 | 0.39 | 0.71 | 0.24 | 0.31 | 0.36 | 0.02 |
| SrO | 0.05 | 0.04 | 0.05 | 0.05 | 0.03 | 1.44 | − | − | |
| MgO | 0.04 | 0.02 | 0.02 | 0.02 | − | 0.01 | 0.20 | 0.20 | 0.06 |
| Ce2O3 | − | − | − | − | − | − | − | 0.28 | |
| Y2O3 | − | − | − | − | − | − | − | 0.32 | |
| Al2O3 | − | − | − | − | − | − | 0.17 | − | 0.01 |
| ions | | | | | | | | | |
| Ca2+ | 4.667 | 4.651 | 4.665 | 4.648 | 4.736 | 4.946 | 4.389 | 4.371 | 4.731 |
| Fe2+ | 0.002 | 0.003 | 0.003 | 0.002 | 0.001 | 0.001 | 0.039 | 0.024 | 0.024 |
| Mn2+ | 0.001 | 0.001 | 0.001 | 0.001 | 0.000 | 0.001 | 0.005 | 0.006 | 0.006 |
| P5+ | 2.865 | 2.870 | 2.869 | 2.877 | 2.741 | 2.812 | 2.641 | 2.792 | 2.792 |
| Mg2+ | 0.005 | 0.002 | 0.002 | 0.004 | − | 0.000 | 0.022 | 0.023 | 0.007 |
| F− | 0.105 | 0.109 | 0.102 | 0.099 | 0.184 | 0.014 | 0.712 | 0.520 | 0.520 |
| Cl− | 0.056 | 0.059 | 0.055 | 0.053 | 0.099 | 0.007 | 0.039 | 0.046 | 0.046 |
Table A5.
Chemical composition and structural formula of Moroccan apatite, analyzed by LA−ICP−MS. Data derived from [
31,
34,
42].
Table A5.
Chemical composition and structural formula of Moroccan apatite, analyzed by LA−ICP−MS. Data derived from [
31,
34,
42].
| | | DurangoChew | DurangoFishier | DurangoGriffin | DurangoHou | Moro | SDG | M1 |
|---|
| Rb | ppm | 0.12 | 0.11 | 0.13 | 0.12 | 0.12 | 0.2 | − |
| Sr | ppm | 482 | 456 | 491 | 476 | 618.13 | 11368 | − |
| Ba | ppm | 1.7 | 1.4 | 1.8 | 1.5 | 1.29 | 1.3 | − |
| Nb | ppm | 1 | 0.02 | 0.03 | 0.02 | 0.01 | 2.4 | − |
| Ta | ppm | 0 | 0 | 0 | 0 | 0 | 0.03 | − |
| Zr | ppm | 1.4 | 0.6 | 1.1 | 0.8 | 0 | 48 | − |
| Hf | ppm | 0.23 | 0.19 | 0.23 | 0.26 | 0.01 | 0.39 | − |
| Pb | ppm | 0.9 | 0.4 | 0.7 | 0.6 | 1.62 | 50 | − |
| Th | ppm | 320 | 151 | 270 | 231 | 184.37 | 705 | − |
| U | ppm | 20 | 7 | 11 | 11 | 16.48 | 47 | − |
| La | ppm | 4285 | 3194 | 3819 | 3334 | 2117.01 | 7209 | 364 |
| Ce | ppm | 5405 | 3635 | 5178 | 4561 | 2763.91 | 15668 | 188 |
| Pr | ppm | 488 | 307 | 496 | 436 | 193.71 | 1843 | 52 |
| Nd | ppm | 1677 | 1009 | 1745 | 1514 | 639.77 | 7344 | 227 |
| Sm | ppm | 237 | 127 | 244 | 207 | 90.72 | 911 | 39.4 |
| Eu | ppm | 21 | 15 | 22 | 20 | 14.78 | 196 | 8.5 |
| Gd | ppm | 204 | 105 | 206 | 174 | 77.45 | 468 | 49.4 |
| Tb | ppm | 28 | 13 | 27 | 23 | 9.68 | 38 | 6.7 |
| Dy | ppm | 154 | 68 | 146 | 123 | 55.94 | 140 | 41 |
| Ho | ppm | 32 | 14 | 30 | 25 | 10.67 | 21 | 9.3 |
| Er | ppm | 83 | 34 | 77 | 64 | 28.34 | 49 | 23.2 |
| Tm | ppm | 10 | 4 | 10 | 8 | 3.78 | 5.5 | 2.8 |
| Yb | ppm | 59 | 27 | 56 | 47 | 22.79 | 33 | 14.2 |
| Lu | ppm | 6 | 4 | 7 | 6 | 2.99 | 4.3 | 1.8 |
| Y | ppm | 911 | 427 | 886 | 762 | − | 605 | 472 |
| ΣLREE | ppm | 12113 | 8269 | 11504 | 10072 | 5819.89 | 33171 | 878.9 |
| ΣHREE | ppm | 576 | 269 | 559 | 470 | 211.65 | 758.8 | 148.4 |
| ΣREE | ppm | 12689 | 8538 | 12063 | 10542 | 6031.54 | 33929.8 | 1027.3 |
| δEu | | 0.29 | 0.4 | 0.3 | 0.32 | 0.54 | 0.92 | 0.91 |
| δCe | | 0.92 | 0.9 | 0.92 | 0.93 | 1.06 | 1.05 | 0.31 |
References
- Zhang, B.-L. Systematic Gemology; Geological Publishing House: Beijing, China, 2006; pp. 324–327. [Google Scholar]
- Bruand, E.; Fowler, M.; Storey, C.; Darling, J. Apatite trace element and isotope applications to petrogenesis and provenance. Am. Mineral. 2017, 102, 75–84. [Google Scholar] [CrossRef]
- Boyce, J.W.; Hervig, R.L. Apatite as a Monitor of Late-Stage Magmatic Processes at Volcán Irazú, Costa Rica. Contrib. Mineral. Petrol. 2009, 57, 135–145. [Google Scholar] [CrossRef]
- Belousova, E.A.; Griffin, W.L.; O’Reilly, S.Y.; Fisher, N.I. Apatite as an indicator mineral for mineral exploration: Trace-element compositions and their relationship to host rock type. Geochem. Explor. 2002, 76, 45–69. [Google Scholar] [CrossRef]
- Xu, B.; Hou, Z.-Q.; Griffin, W.L.; O’Reilly, S.Y. Apatite halogens and Sr–O and zircon Hf–O isotopes: Recycled volatiles in Jurassic porphyry ore systems in southern Tibet. Chem. Geol. 2022, 605, 10. [Google Scholar] [CrossRef]
- Zhang, F.; Li, W.; White, N.; Zhang, L.; Qiao, X.; Yao, Z. Geochemical and isotopic study of metasomatic apatite: Implications for gold mineralization in Xindigou, northern China. Ore Geol. Rev. 2020, 127, 103853. [Google Scholar] [CrossRef]
- Ren, Z.; Cui, J.; Liu, C.; Li, T.; Chen, G.; Dou, S.; Tian, T.; Luo, Y. Apatite Fission Track Evidence of Uplift Cooling in the Qiangtang Basin and Constraints on the Tibetan Plateau Uplift. Acta Geol. Sin.-Engl. Ed. 2015, 89, 467–484. [Google Scholar]
- Li, W. Study on Gemological and Chromatic Characteristics of Blue-Green Apatite. Master’s Thesis, China University of Geosciences, Beijing, China, 2021. [Google Scholar]
- Yang, Y.-F. Gem Mineralogy of Different Colors of Apatite. Master’s Thesis, China University of Geosciences, Beijing, China, 2019. [Google Scholar]
- Rossi, M.; Ghiara, M.R.; Chita, G.; Capitelli, F. Crystal-Chemical and Structural Characterization of Fluorapatites in Ejecta from Somma−Vesuvius Volcanic Complex. Am. Mineral. 2011, 96, 1828–1837. [Google Scholar] [CrossRef]
- Pan, Y.; Fleet, M.E. Compositions of the Apatite-Group Minerals: Substitution Mechanisms and Controlling Factors. Rev. Mineral. Geochem. 2002, 48, 13–49. [Google Scholar] [CrossRef]
- Zhu, X.Q.; Wang, Z.G.; Huang, Y. Rare earth composition of apatite and its tracing significance. Rare Earths 2004, 25, 41–45+63. (In Chinese) [Google Scholar] [CrossRef]
- Sha, L.-K.; Chappell, B.W. Apatite Chemical Composition, Determined by Electron Microprobe and Laser-Ablation Inductively Coupled Plasma Mass Spectrometry, as a Probe into Granite Petrogenesis. Geochim. Cosmochim. Acta 1999, 63, 3861–3881. [Google Scholar] [CrossRef]
- Xu, B.; Hou, Z.-Q.; Griffin, W.L.; Lu, Y.; Belousova, E.; Xu, J.-F.; O’Reilly, S.Y. Recycled Volatiles Determine Fertility of Porphyry Deposits in Collisional Settings. Am. Mineral. 2021, 106, 656–661. [Google Scholar] [CrossRef]
- Chen, N.; Pan, Y.; Weil, J.A. Electron Paramagnetic Resonance Spectroscopic Study of Synthetic Fluorapatite: Part I. Local Structural Environment and Substitution Mechanism of Gd3+ at the Ca2 Site. Am. Mineral. 2002, 87, 37–46. [Google Scholar] [CrossRef]
- Fleet, M.E.; Pan, Y. Site Preference of Rare Earth Elements in Fluorapatite. Am. Mineral. 1995, 80, 329–335. [Google Scholar] [CrossRef]
- Mao, M.; Rukhlov, A.S.; Rowins, S.M.; Spence, J.; Coogan, L.A. Apatite Trace Element Compositions: A Robust New Tool for Mineral Exploration. Econ. Geol. 2016, 111, 1187–1222. [Google Scholar] [CrossRef]
- Rakovan, J.F.; Hughes, J.M. Strontium in the apatite structure: Strontium fluorapatite and belovite-(Ce). Can. Mineral. 2000, 38, 839–845. [Google Scholar] [CrossRef]
- Piccoli, P.M.; Candela, P.A. Apatite in Igneous Systems. Rev. Mineral. Geochem. 2002, 48, 255–292. [Google Scholar] [CrossRef]
- Hughes, J.M.; Ertl, A.; Bernhardt, H.-J.; Rossman, G.R.; Rakovan, J. Mn−Rich Fluorapatite from Austria: Crystal Structure, Chemical Analysis, and Spectroscopic Investigations. Am. Mineral. 2004, 89, 629–632. [Google Scholar] [CrossRef]
- Sudarsanan, K.; Young, R.A.; Wilson, A.J.C. The Structures of Some Cadmium ‘apatites’ Cd5(MO4)3X. I. Determination of the Structures of Cd5(VO4)3I, Cd5(PO4)3Br, Cd3(AsO4)3Br and Cd5(VO4)3Br. Acta Crystallogr. Sect. B Struct. Crystallogr. Cryst. Chem. 1977, 33, 3136–3142. [Google Scholar] [CrossRef]
- Peng, G.; Luhr, J.F.; McGee, J.J. Factors Controlling Sulfur Concentrations in Volcanic Apatite. Am. Mineral. 1997, 82, 1210–1224. [Google Scholar] [CrossRef]
- Perseil, E.-A.; Blanc, P.; Ohnenstetter, D. As-Bearing Fluorapatite in Manganiferous Deposits from St. Marcel-praborna, val d’aosta, Italy. Can. Mineral. 2000, 38, 101–117. [Google Scholar] [CrossRef]
- Xu, B.; Hou, Z.-Q.; Griffin, W.L.; Zheng, Y.-C.; Wang, T.; Guo, Z.; Hou, J.; Santosh, M.; O’Reilly, S.Y. Cenozoic Lithospheric Architecture and Metallogenesis in Southeastern Tibet. Earth-Sci. Rev. 2021, 214, 103472. [Google Scholar] [CrossRef]
- Miles, A.J.; Graham, C.M.; Hawkesworth, C.J.; Gillespie, M.R.; Hinton, R.W.; Bromiley, G.D. Apatite: A New Redox Proxy for Silicic Magmas? Geochim. Cosmochim. Acta 2014, 132, 101–119. [Google Scholar] [CrossRef] [Green Version]
- Che, J.Y.; Zhao, Y.D. A review of the basal characteristics of Precambrian metamorphic substrates in Madagascar. Geol. Resour. 2013, 4, 341. [Google Scholar]
- Xu, B.; Griffin, W.L.; Xiong, Q.; Hou, Z.-Q.; O’Reilly, S.Y.; Guo, Z.; Pearson, N.; Greau, Y.; Zheng, Y.-C. Ultrapotassic rocks and xenoliths from South Tibet: Contrasting styles of interaction between lithospheric mantle and asthenosphere during continental collision. Geology 2017, 45, 51–54. [Google Scholar] [CrossRef]
- Huang, G.P.; Hu, Q.L.; Chen, D.M.; Li, L.; Zhang, Z.; Zhu, A.A.; Xu, H.B. Overview of Geology and Mineral Resources of Madagascar. Resour. Environ. Eng. 2014, 28, 626–632. [Google Scholar]
- Wang, H.B.; Xia, F.F.; Wu, H.X. A brief analysis of geological characteristics and minerals in Ambatondrazaka area. Mod. Min. 2012, 27, 33−34, 37. [Google Scholar]
- Zolotarev, V.M. Optical Constants of an Apatite Single Crystal in the IR Range of 6–28 Μm. Opt. Spectrosc. 2018, 124, 262–272. [Google Scholar] [CrossRef]
- Yuan, P.Y.; Xu, B.; Wang, Z.X.; Liu, D.Y. A Study on Apatite from Mesozoic Alkaline Intrusive Complexes, Central High Atlas, Morocco. Crystals 2022, 12, 461. [Google Scholar] [CrossRef]
- Zhao, Z.-G.; Gao, L.-M. Standardization of δEu, δCe calculation methods. Stand. Cover. 1998, 5, 24–26. [Google Scholar]
- Wang, R.J. Application of rare earth elements in petrology. Geol. Sci. Technol. Inf. 1983, 3, 32–39. [Google Scholar]
- Yang, Y.-H.; Wu, F.-Y.; Yang, J.-H.; Chew, D.M.; Xie, L.-W.; Chu, Z.-Y.; Zhang, Y.-B.; Huang, C. Sr and Nd Isotopic Compositions of Apatite Reference Materials Used in U–Th–Pb Geochronology. Chem. Geol. 2014, 385, 35–55. [Google Scholar] [CrossRef]
- Su, X.D.; Peng, P.; Wang, C.; Sun, F.B.; Zhang, Z.Y.; Zhou, X.T. Whole-rock and mineral chemical data from a profile of the ~900 Ma Niutishan Fe-Ti-rich sill in XuZhou, North China. Data Brief 2018, 21, 727–735. [Google Scholar] [CrossRef] [PubMed]
- Takashima, R.; Kuwabara, S.; Sato, T.; Takemura, K.; Nishi, H. Utility of trace elements in apatite for discrimination and correlation of Quaternary ignimbrites and co−ignimbrite ashes, Japan. Quat. Geochronol. 2017, 41, 151–162. [Google Scholar] [CrossRef]
- Liu, J.-W. Characterization of Granitic Apatite Speciation in Jiu Dong and Xiao Qin Ling and Its Geological Significance. Master’s Thesis, China University of Geosciences, Beijing, China, 2019. [Google Scholar]
- Liu, D.-Y. Gemological Characteristics of Apatite in Three Origins. Master’s Thesis, China University of Geosciences, Beijing, China, 2021. [Google Scholar]
- Xu, B.; Hou, Z.-Q.; Griffin, W.L.; Zhou, Y.; Zhang, Y.F.; Lu, Y.J.; Belousova., E.A.; Xu, J.F.; O’Reilly, S.Y. Elevated Magmatic Chlorine and Sulfur Concentrations in the Eocene–Oligocene Machangqing Cu–Mo Porphyry System. SEG Spec. Publ. 2021, 24, 257–276. [Google Scholar]
- O’Reilly, S.Y.; Griffin, W.L. Apatite in the mantle: Implications for metasomatic processes and high heat production in Phanerozoic mantle. Lithos 2000, 53, 217–232. [Google Scholar] [CrossRef]
- Chen, W.; Simonetti, A. In-situ determination of major and trace elements in calcite and apatite, and U-Pb ages of apatite from the Oka carbonatite complex: Insights into a complex crystallization history. Chem. Geol. 2013, 353, 151–172. [Google Scholar] [CrossRef]
- Liu, X.Q.; Zhang, H.; Tang, Y.; Liu, Y.L. REE Geochemical Characteristic of Apatite: Implications for Ore Genesis of the Zhijin Phosphorite. Minerals 2020, 10, 1012. [Google Scholar] [CrossRef]
- Prowatke, S.; Klemme, S. Trace element partitioning between apatite and silicate melts. Geochim. Cosmochim. Acta 2006, 70, 4513–4527. [Google Scholar] [CrossRef]
- Xu, B.; Hou, Z.-Q.; Griffin, W.L.; O’Reilly, S.Y.; Zheng, Y.-C.; Wang, T.; Fu, B.; Xu, J.F. In-situ mineralogical interpretation of the mantle geophysical signature of the Gangdese Cu-porphyry mineral system. Gondwana Res. 2022, 111, 53–63. [Google Scholar] [CrossRef]
| Publisher’s Note: MDPI stays neutral with regard to jurisdictional claims in published maps and institutional affiliations. |
© 2022 by the authors. Licensee MDPI, Basel, Switzerland. This article is an open access article distributed under the terms and conditions of the Creative Commons Attribution (CC BY) license (https://creativecommons.org/licenses/by/4.0/).


