
Cropland Suitability Assessment Using Satellite-Based Biophysical Vegetation Properties and Machine Learning


Abstract
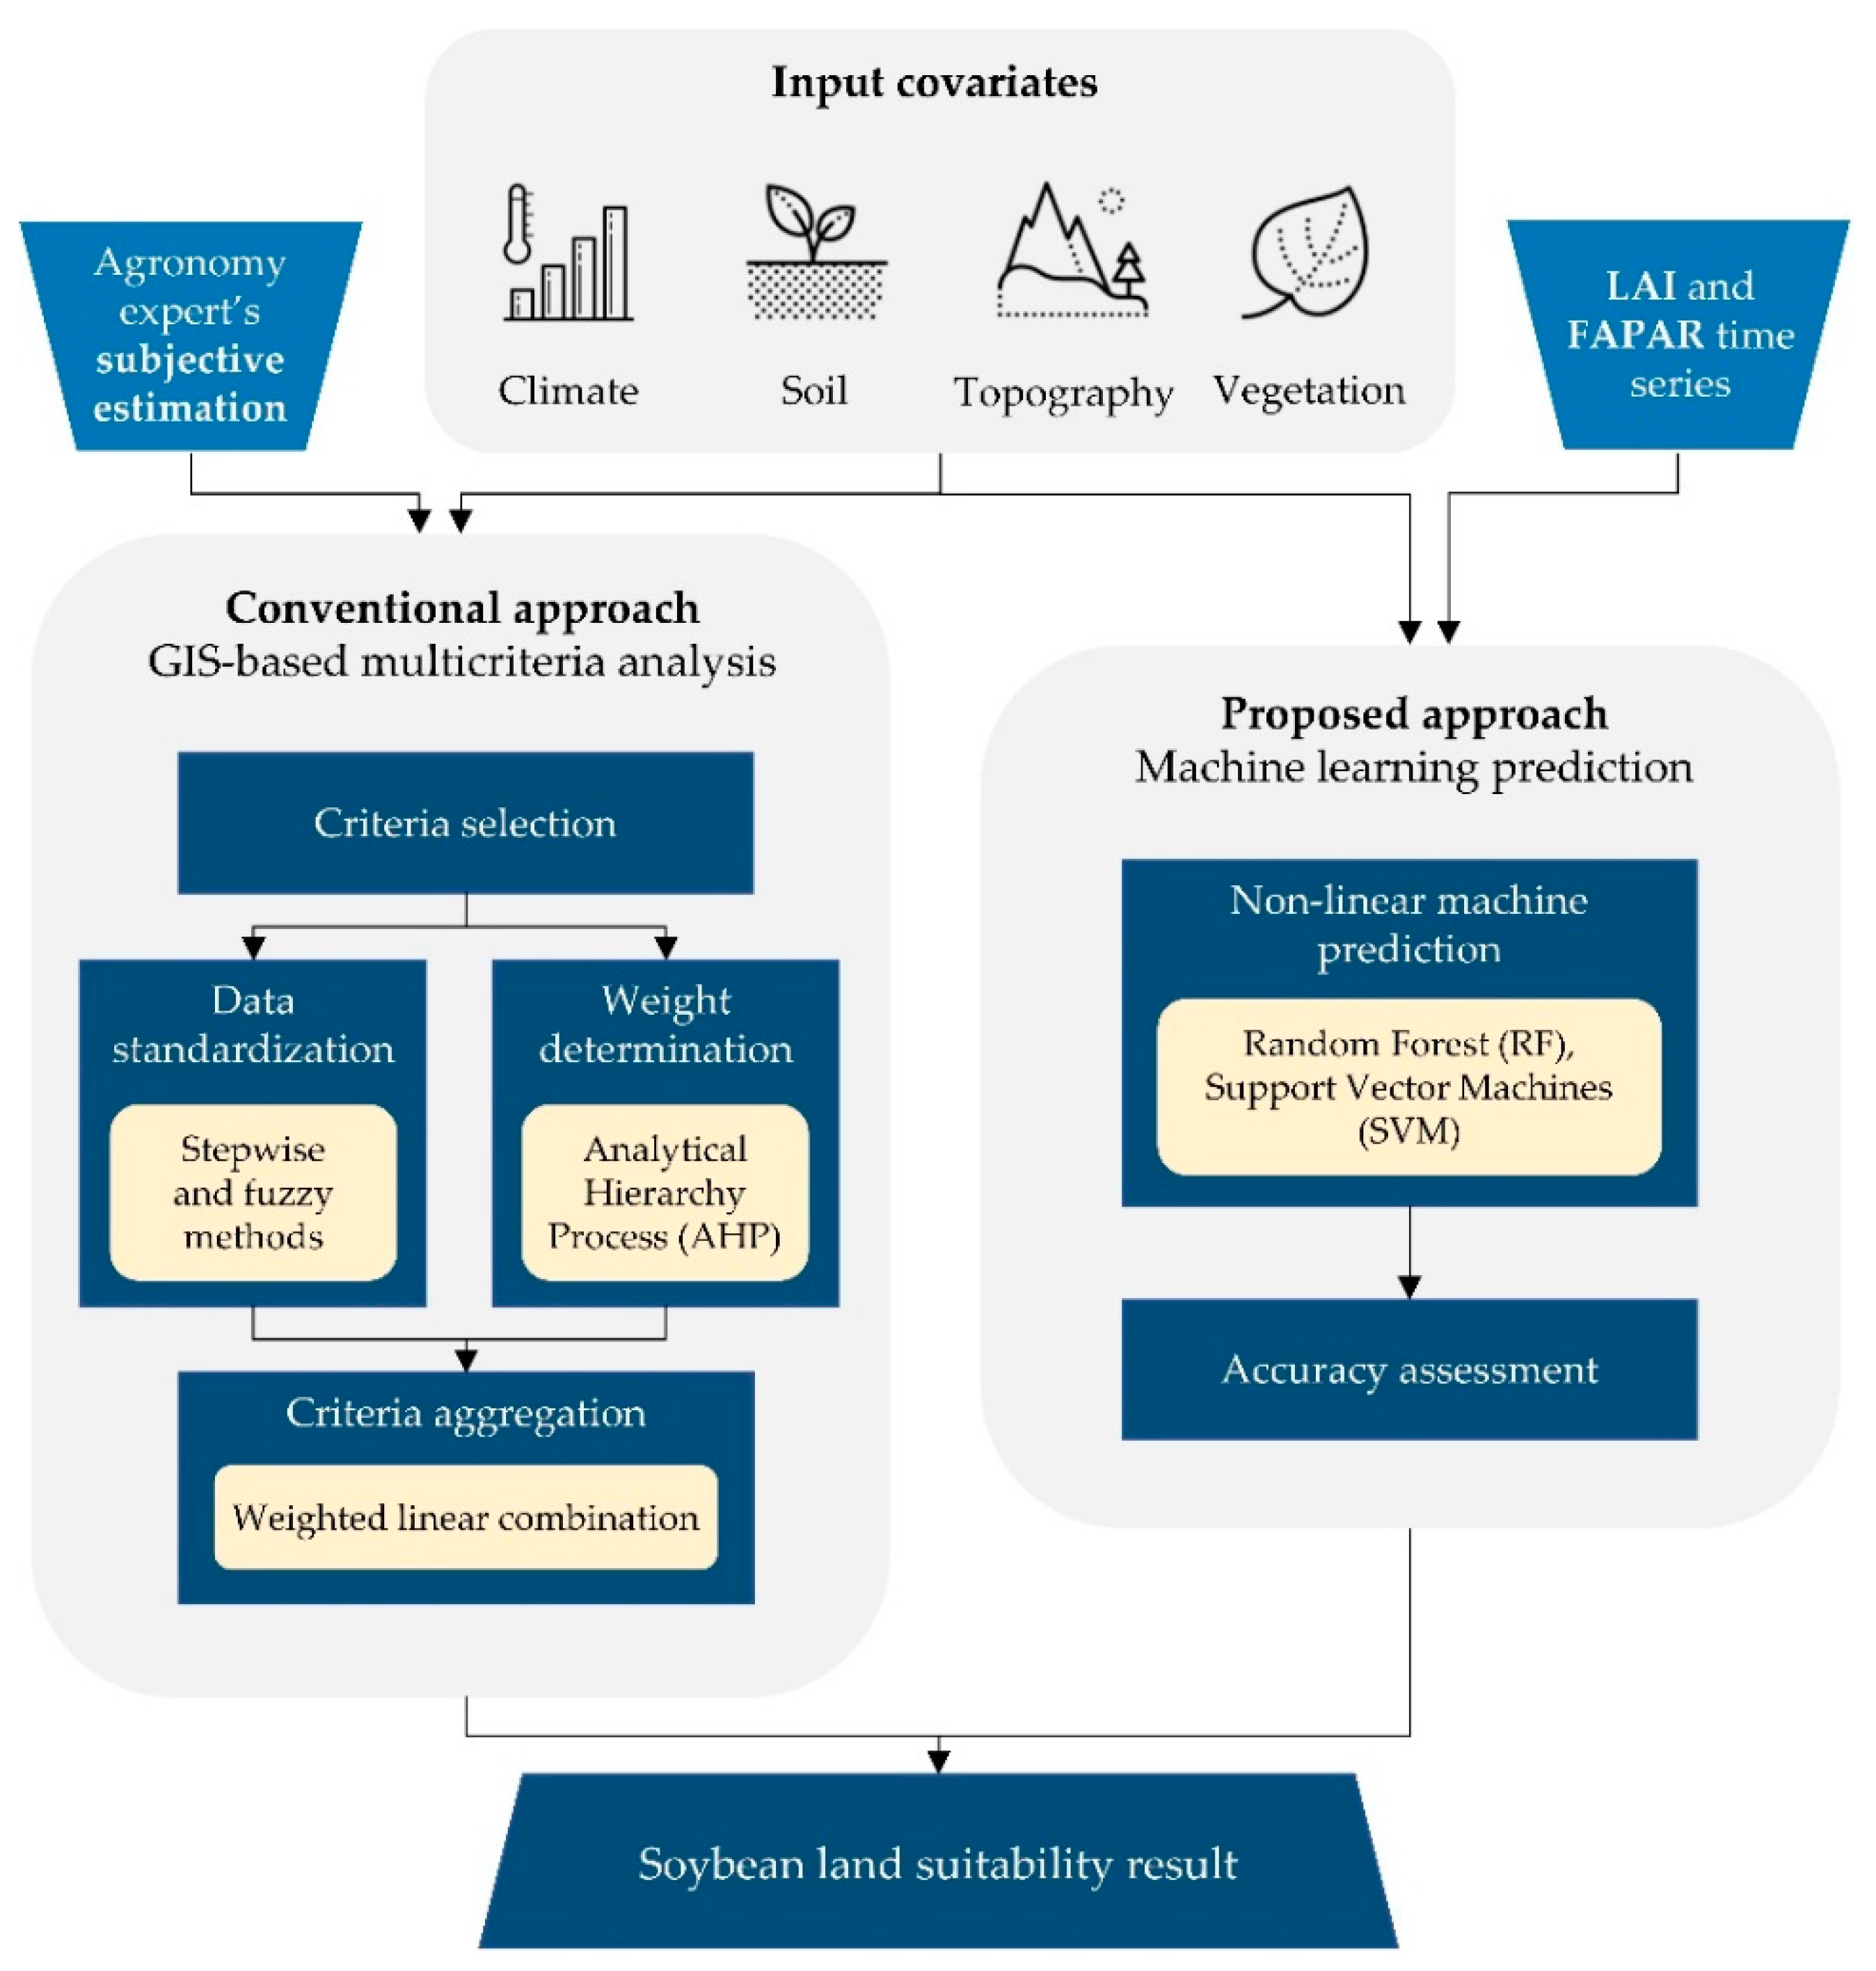
:1. Introduction
2. Materials and Methods
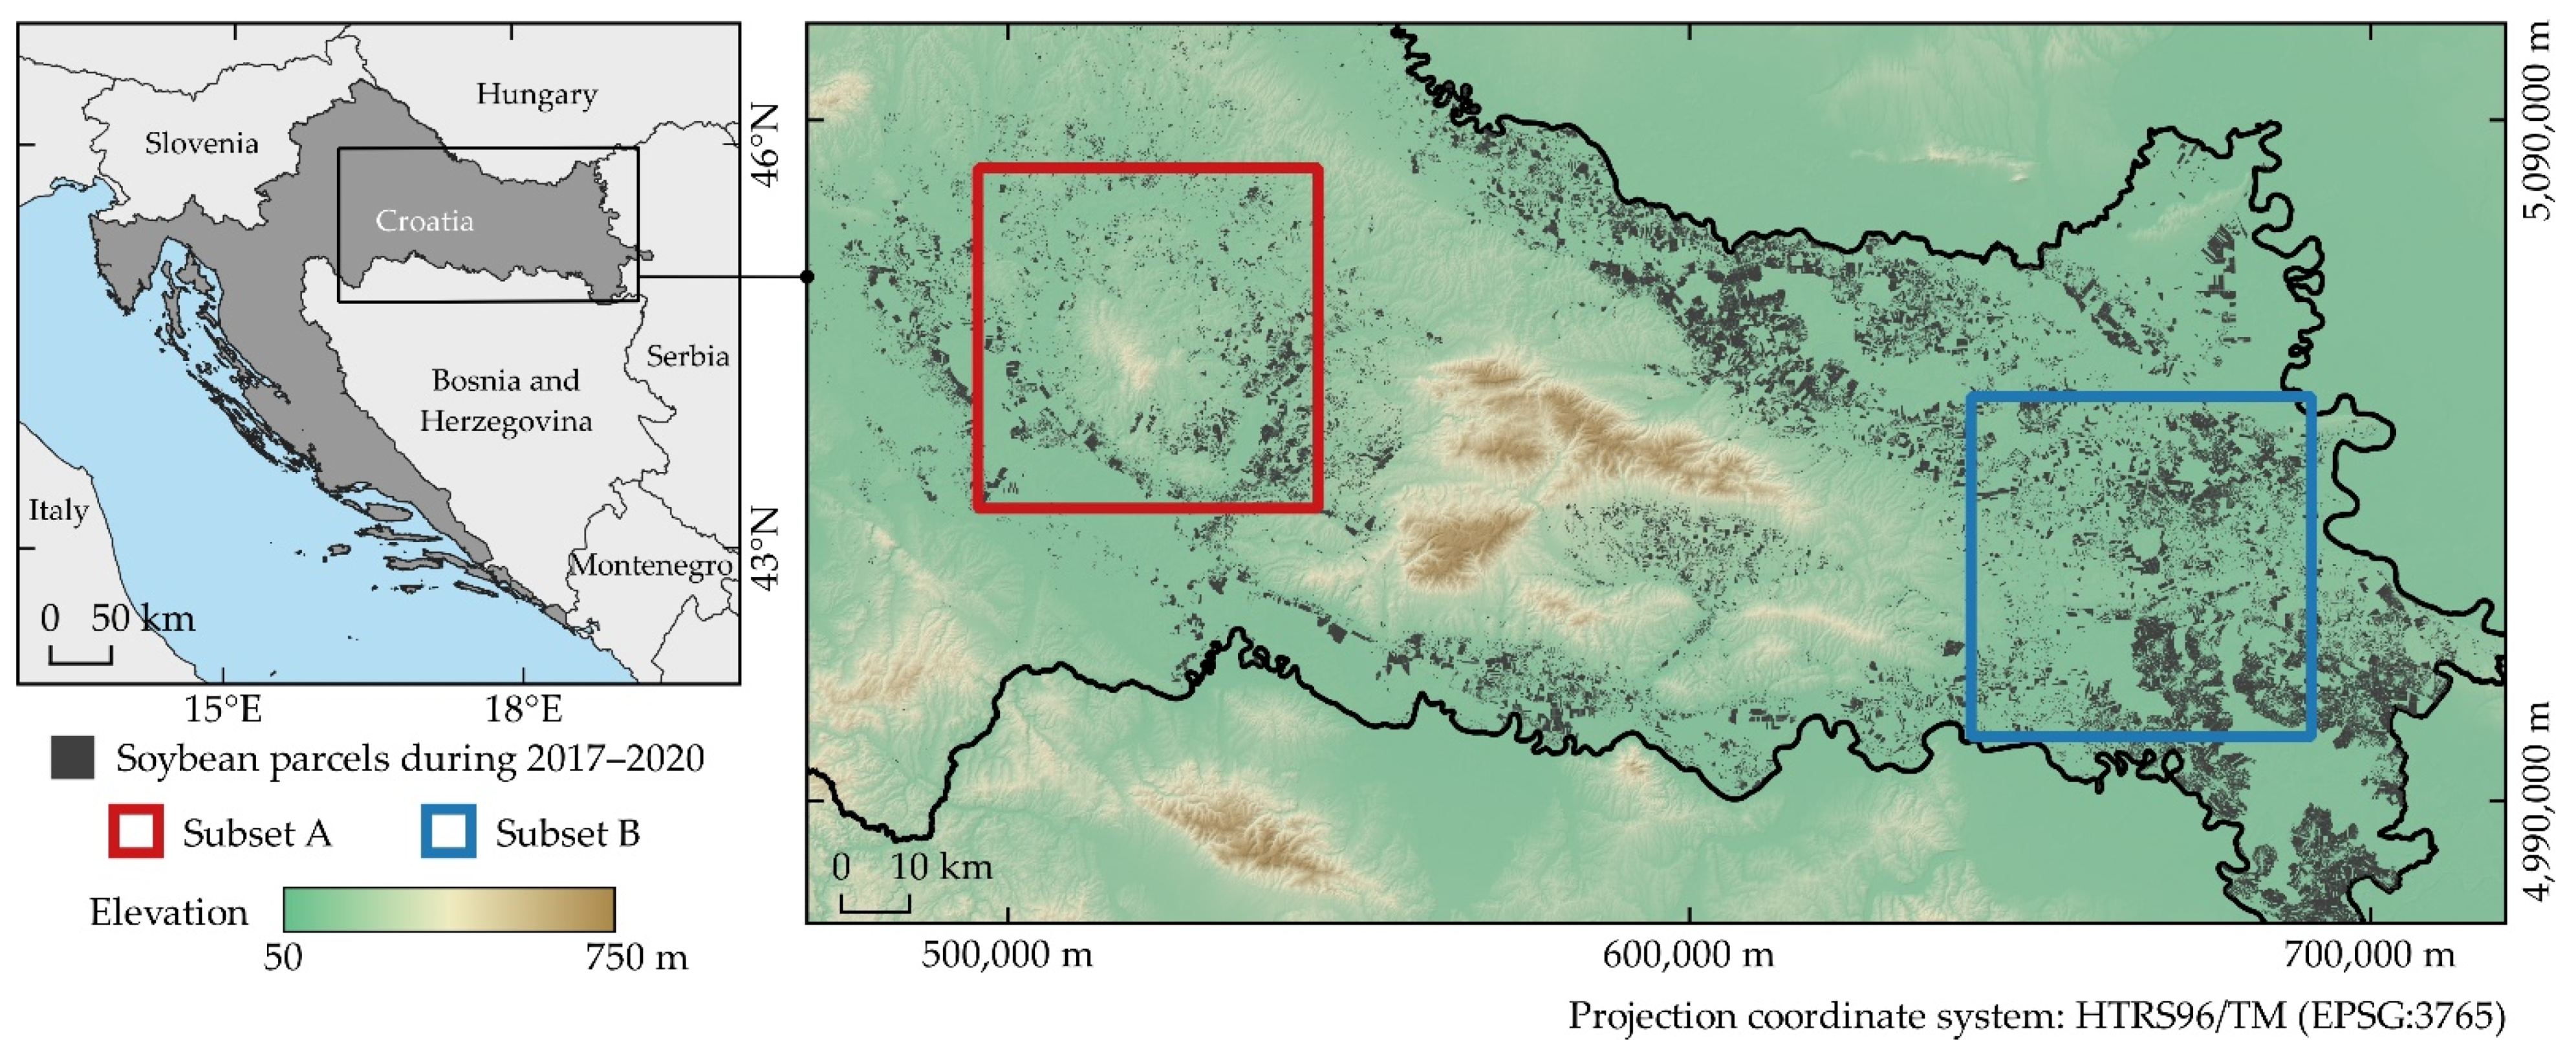
2.1. Study Area
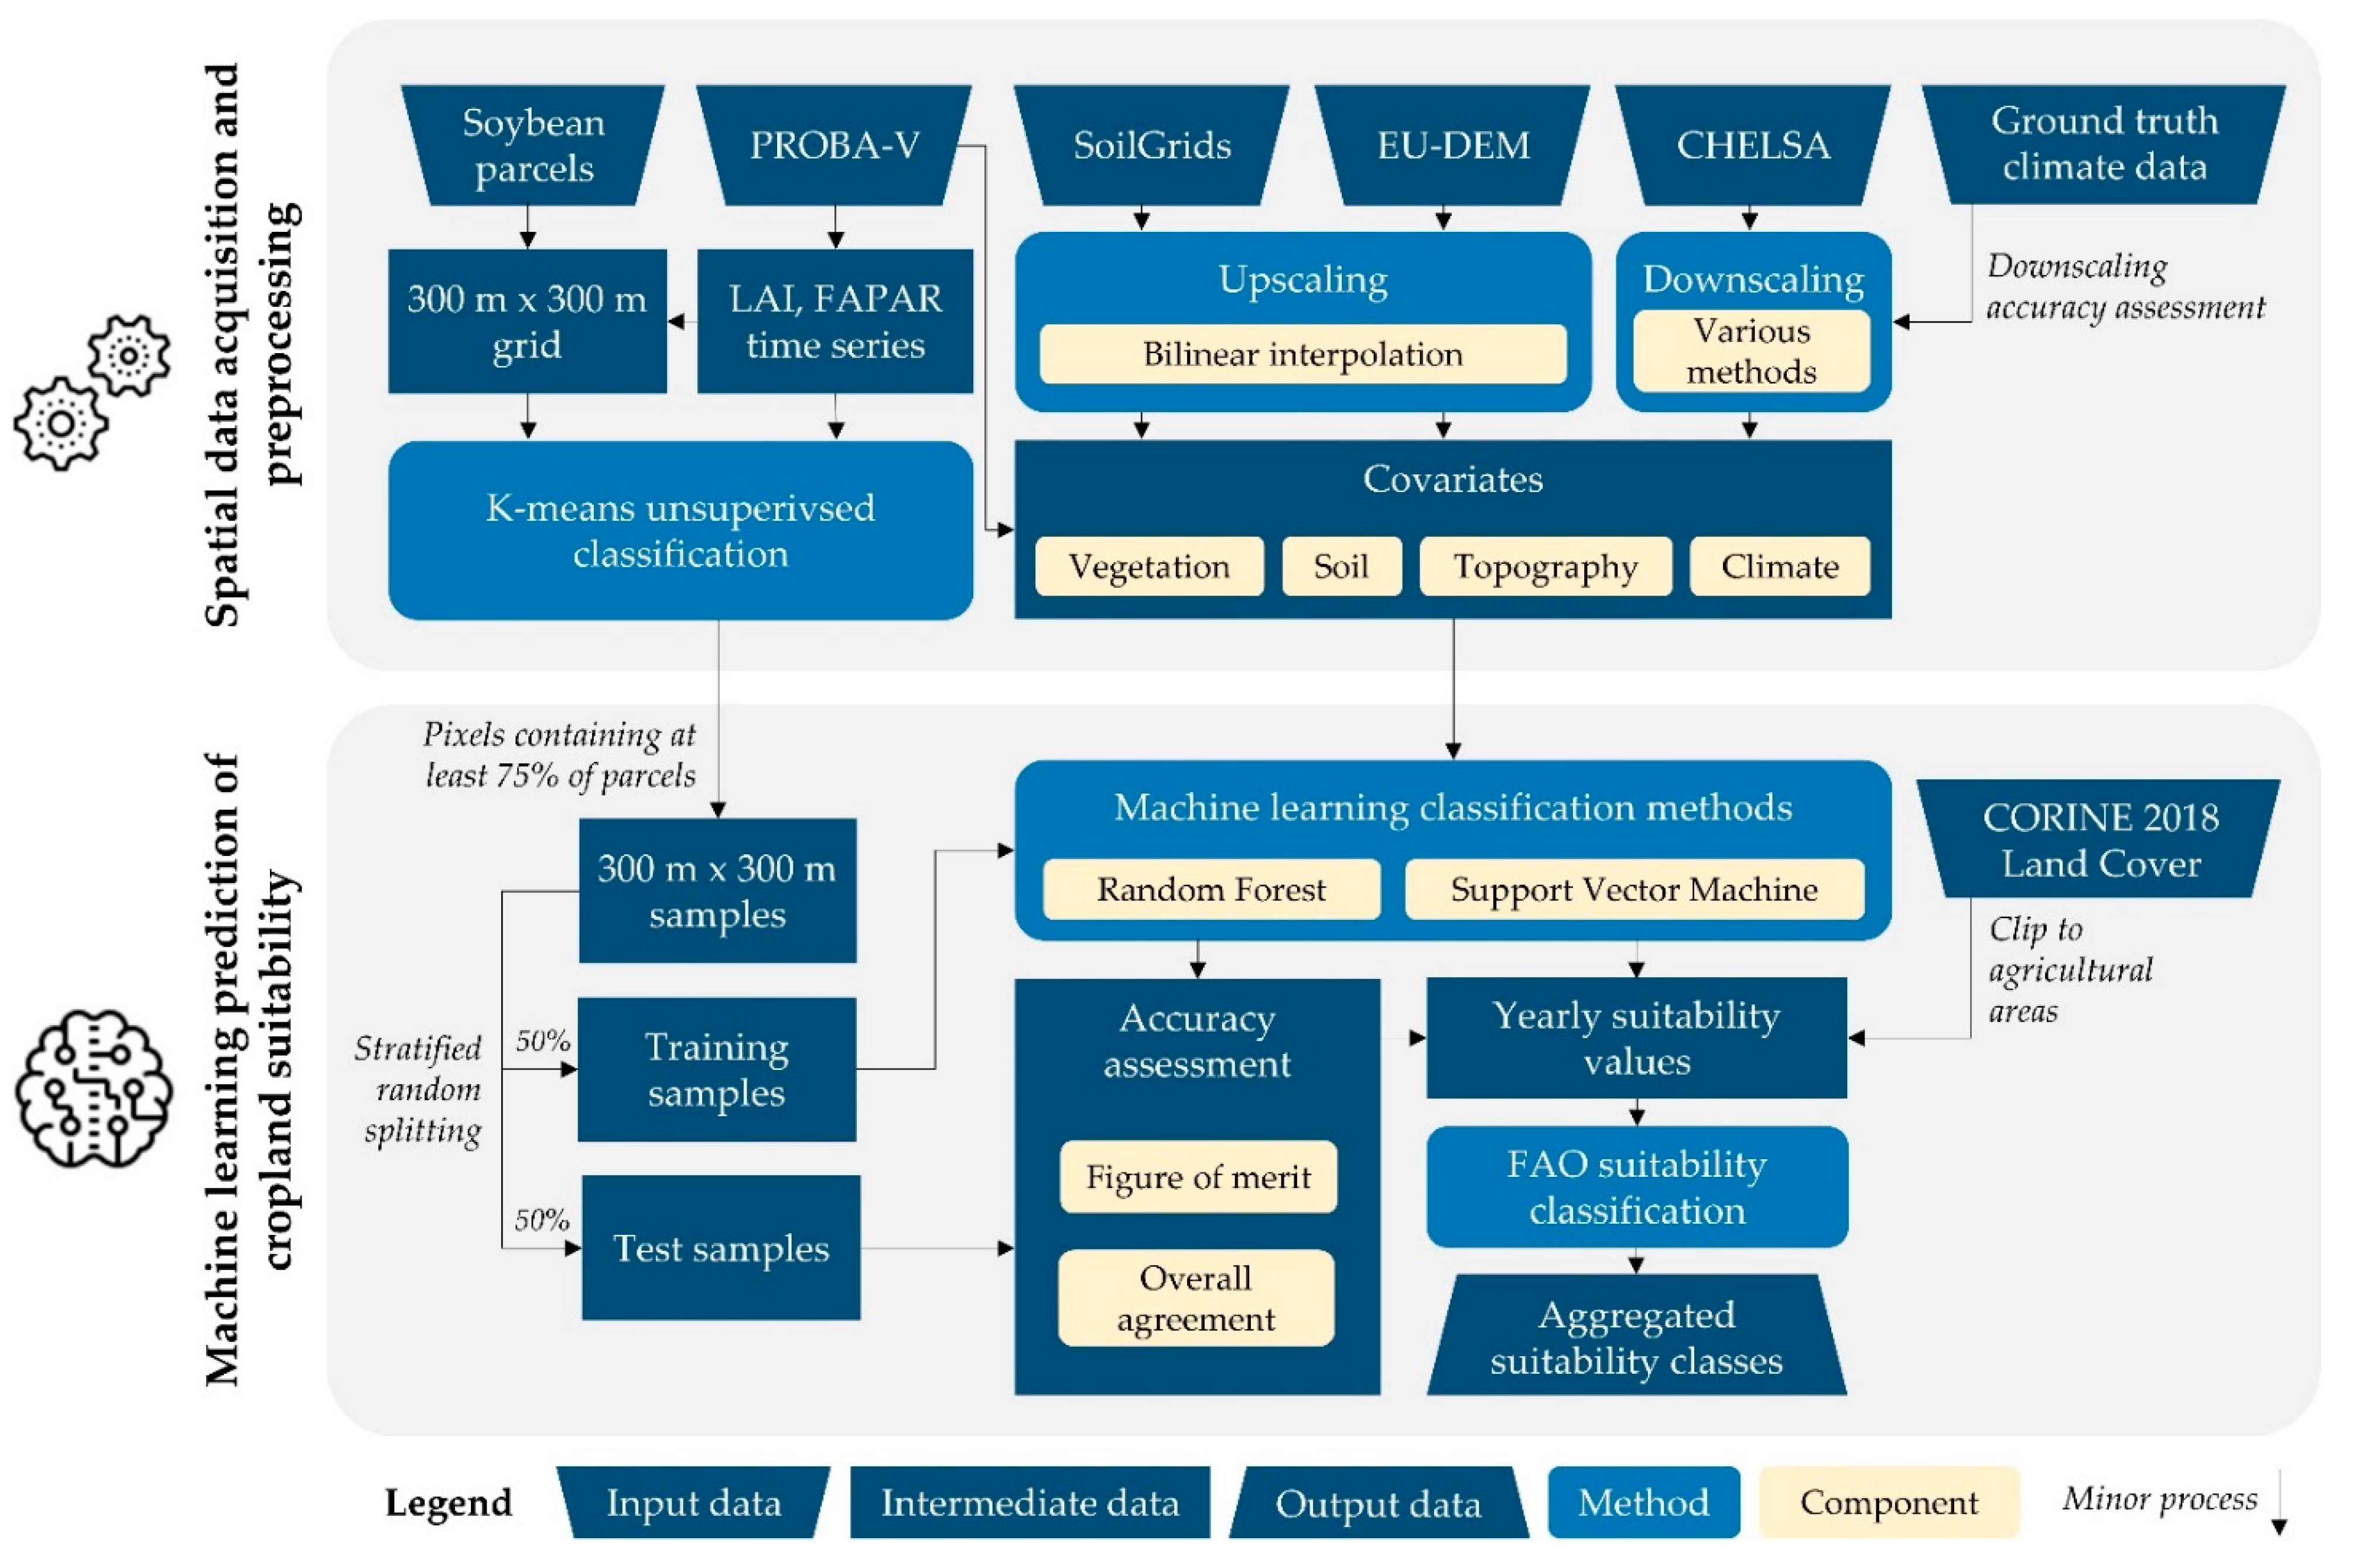
2.2. Spatial Data Acquisition and Preprocessing
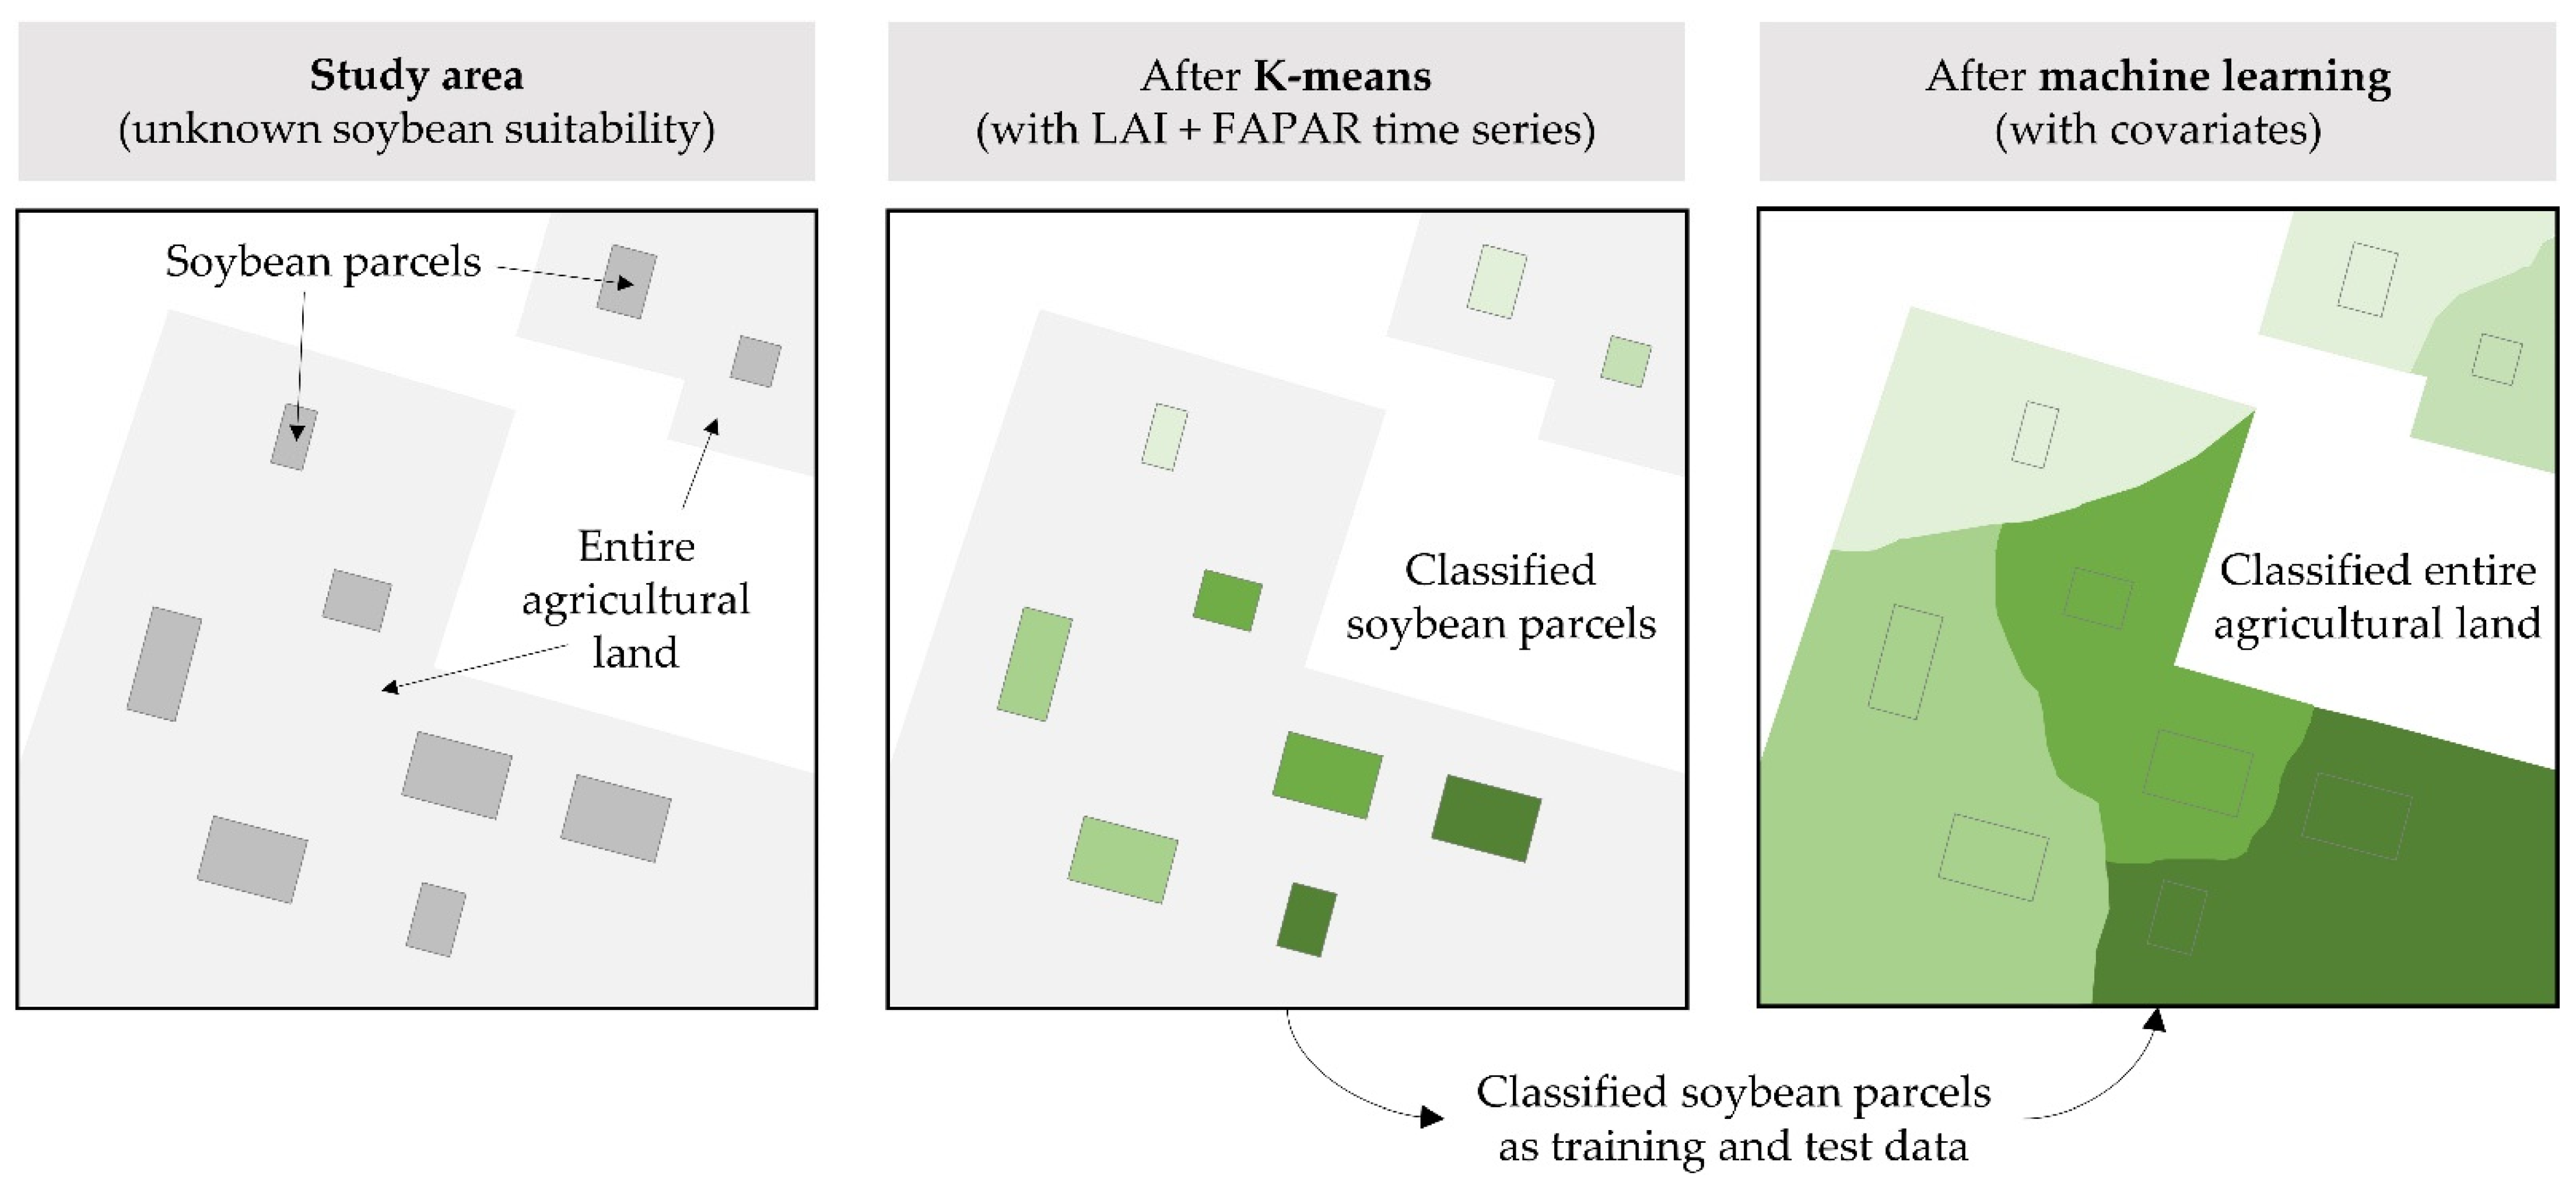
2.3. Machine Learning Prediction of Cropland Suitability
3. Results
4. Discussion
- adopting performance evaluation for multiple crop types with the aim of determining the multidimensional cropland suitability dataset for a particular study area, presenting a complete solution for the agricultural land management;
- modification of the suitability assessment approach using high-resolution Sentinel-2 satellite images for the cropland suitability assessment at micro-locations;
- improvement of the present suitability assessment method considering the optimization of training samples and input covariates;
- implementation of the predicted soybean cropland suitability in practice considering present agricultural practices in the study area.
5. Conclusions
Author Contributions
Funding
Acknowledgments
Conflicts of Interest
Appendix A

| Subset/Year | Air Temperature (April–October) | Precipitation (April–October) | ||||
|---|---|---|---|---|---|---|
| Mean CHELSA | Annual | Difference from Mean | Mean CHELSA | Annual | Difference from Mean | |
| A/2020 | 17.5 °C | 17.1°C | –2.1% | 547.6 mm | 640.1 mm | +16.9% |
| A/2019 | 17.4°C | –0.3% | 689.5 mm | +25.9% | ||
| A/2018 | 18.4°C | +5.2% | 479.6 mm | –12.4% | ||
| A/2017 | 17.4°C | –0.5% | 546.5 mm | –0.2% | ||
| B/2020 | 17.9 °C | 17.8°C | –0.3% | 449.2 mm | 462.3 mm | +2.9% |
| B/2019 | 18.1°C | +1.3% | 558.7 mm | +24.4% | ||
| B/2018 | 19.2°C | +7.2% | 422.0 mm | –6.1% | ||
| B/2017 | 18.0°C | +0.8% | 449.5 mm | +0.1% | ||
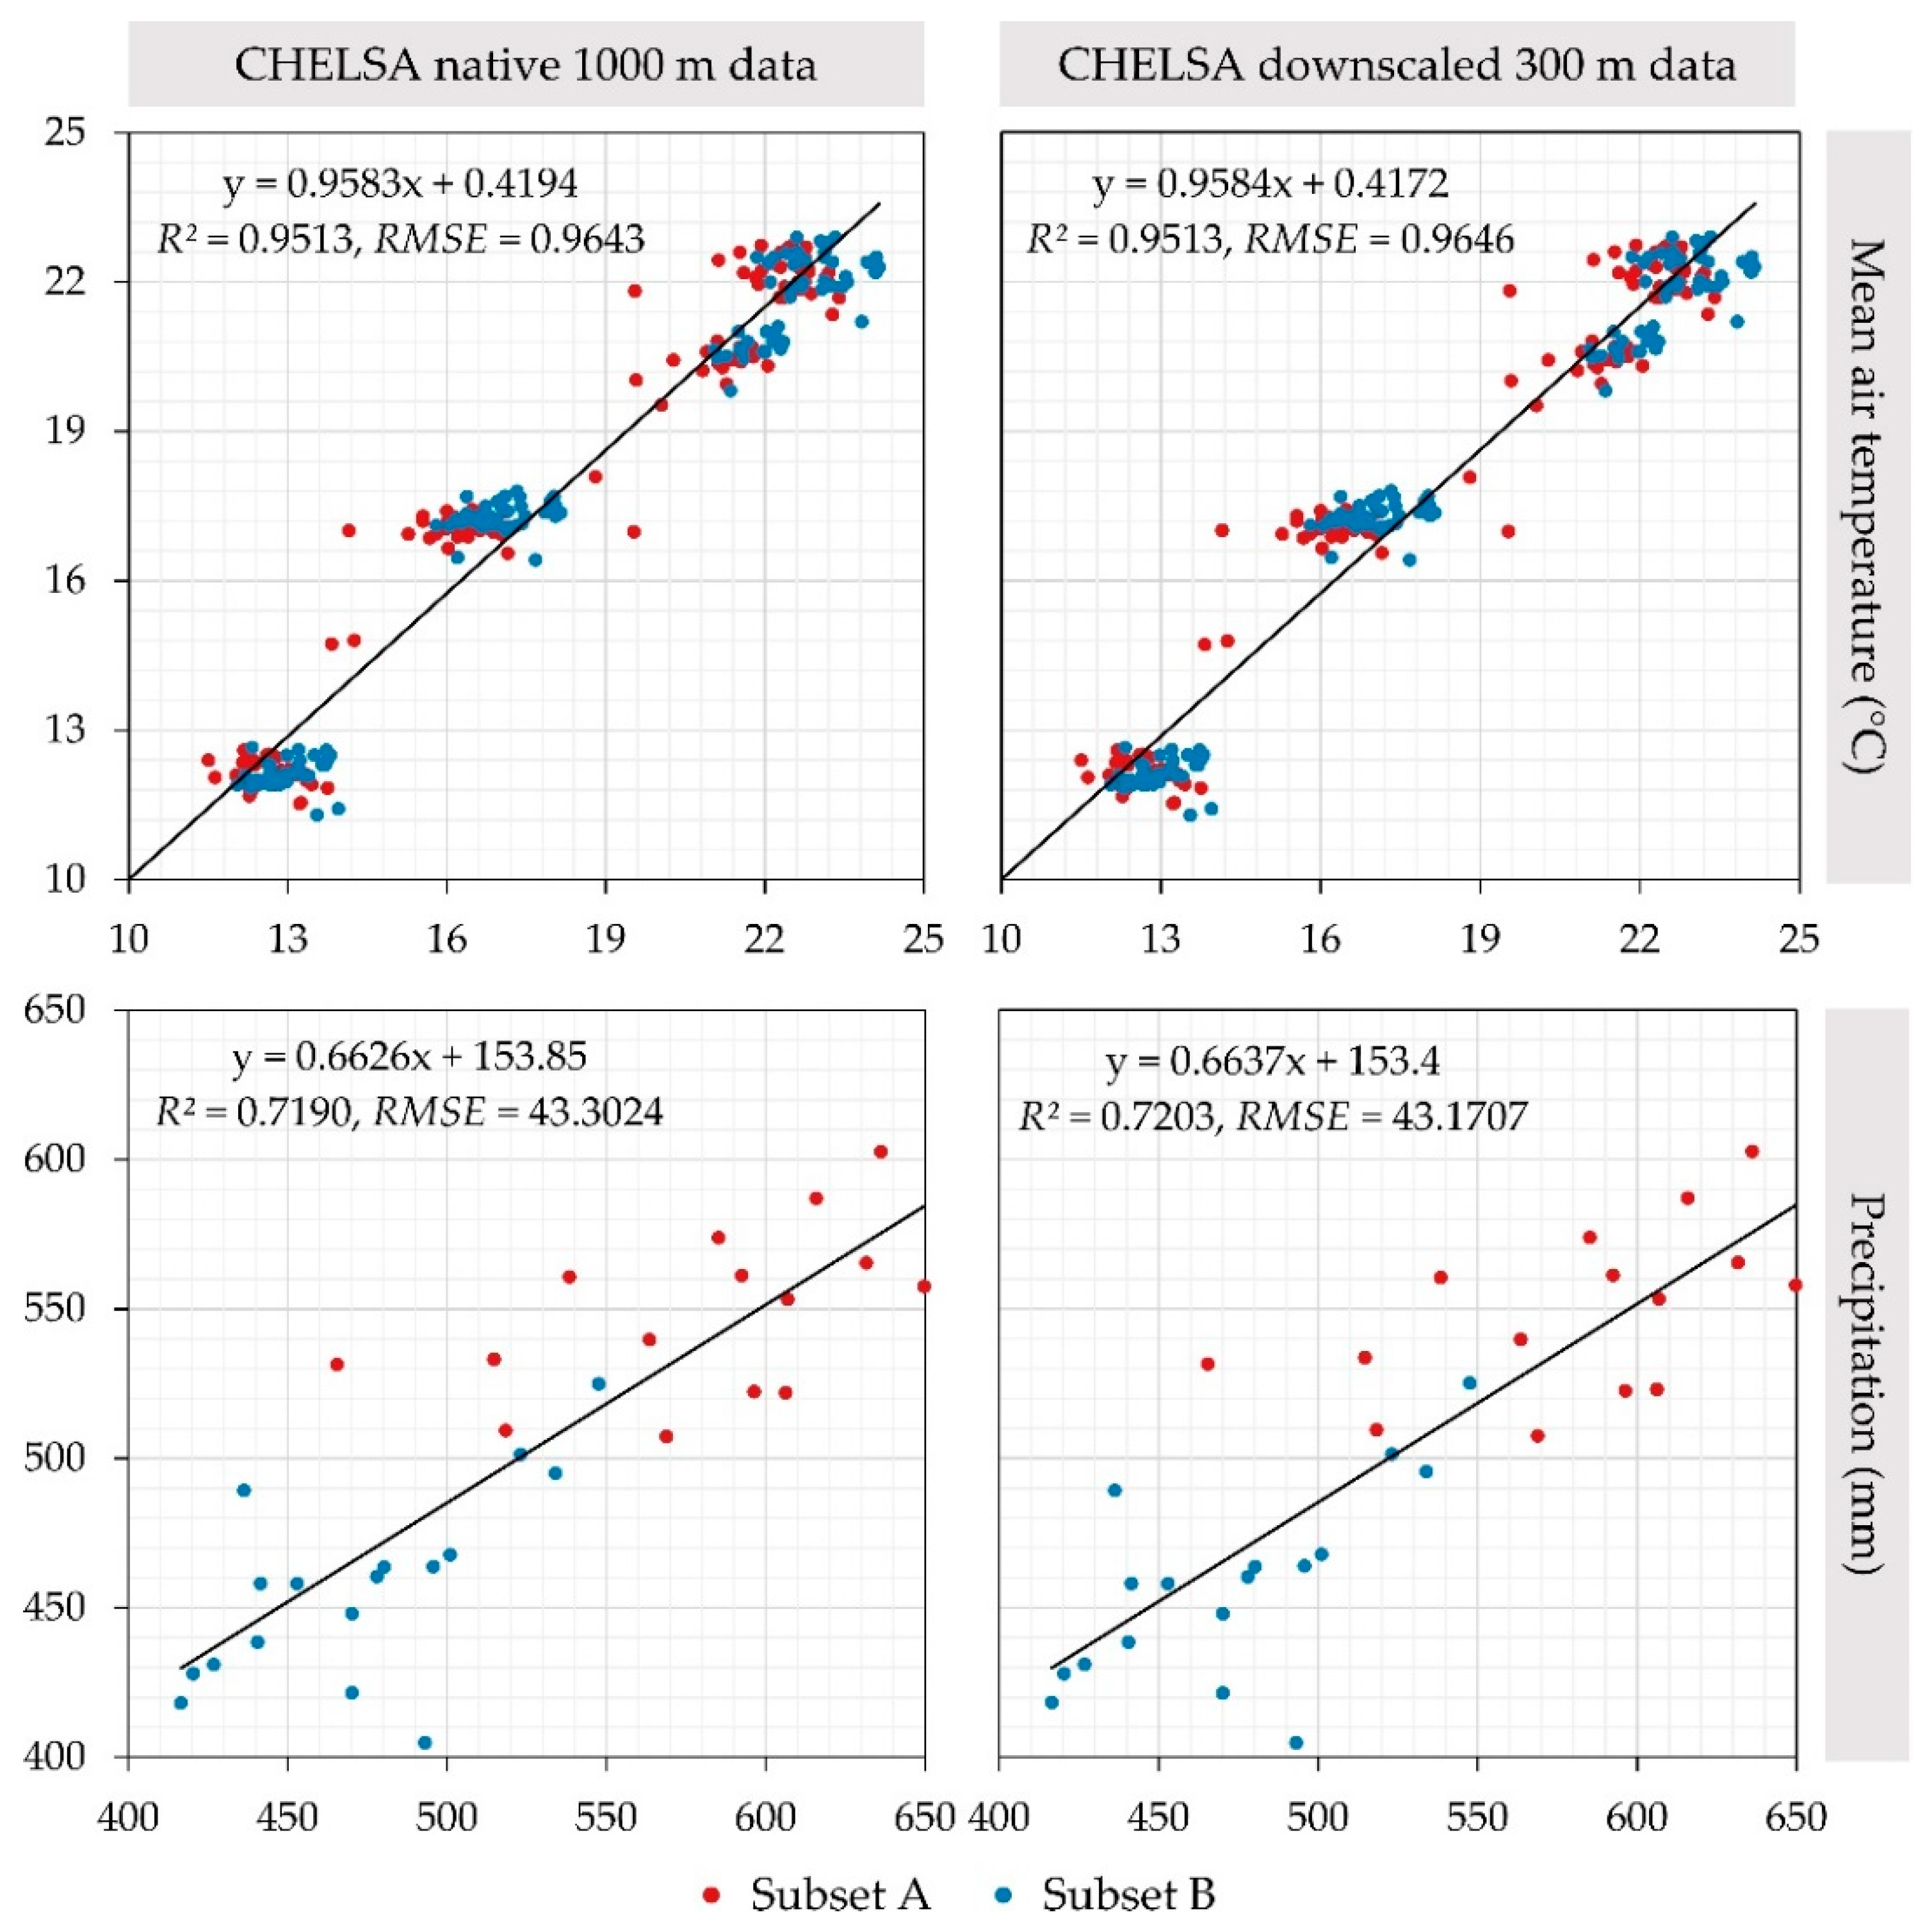
| CHELSA Dataset | Mean Air Temperature (°C) | Precipitation (mm) | ||
|---|---|---|---|---|
| R2 | RMSE | R2 | RMSE | |
| Native (1000 m) | 0.9513 | 0.9643 | 0.7190 | 43.3024 |
| NN (300 m) | 0.9507 | 0.9659 | 0.7137 | 43.9376 |
| BI (300 m) | 0.9512 | 0.9631 | 0.7128 | 43.9296 |
| BSI (300 m) | 0.9513 | 0.9646 | 0.7203 | 43.1707 |
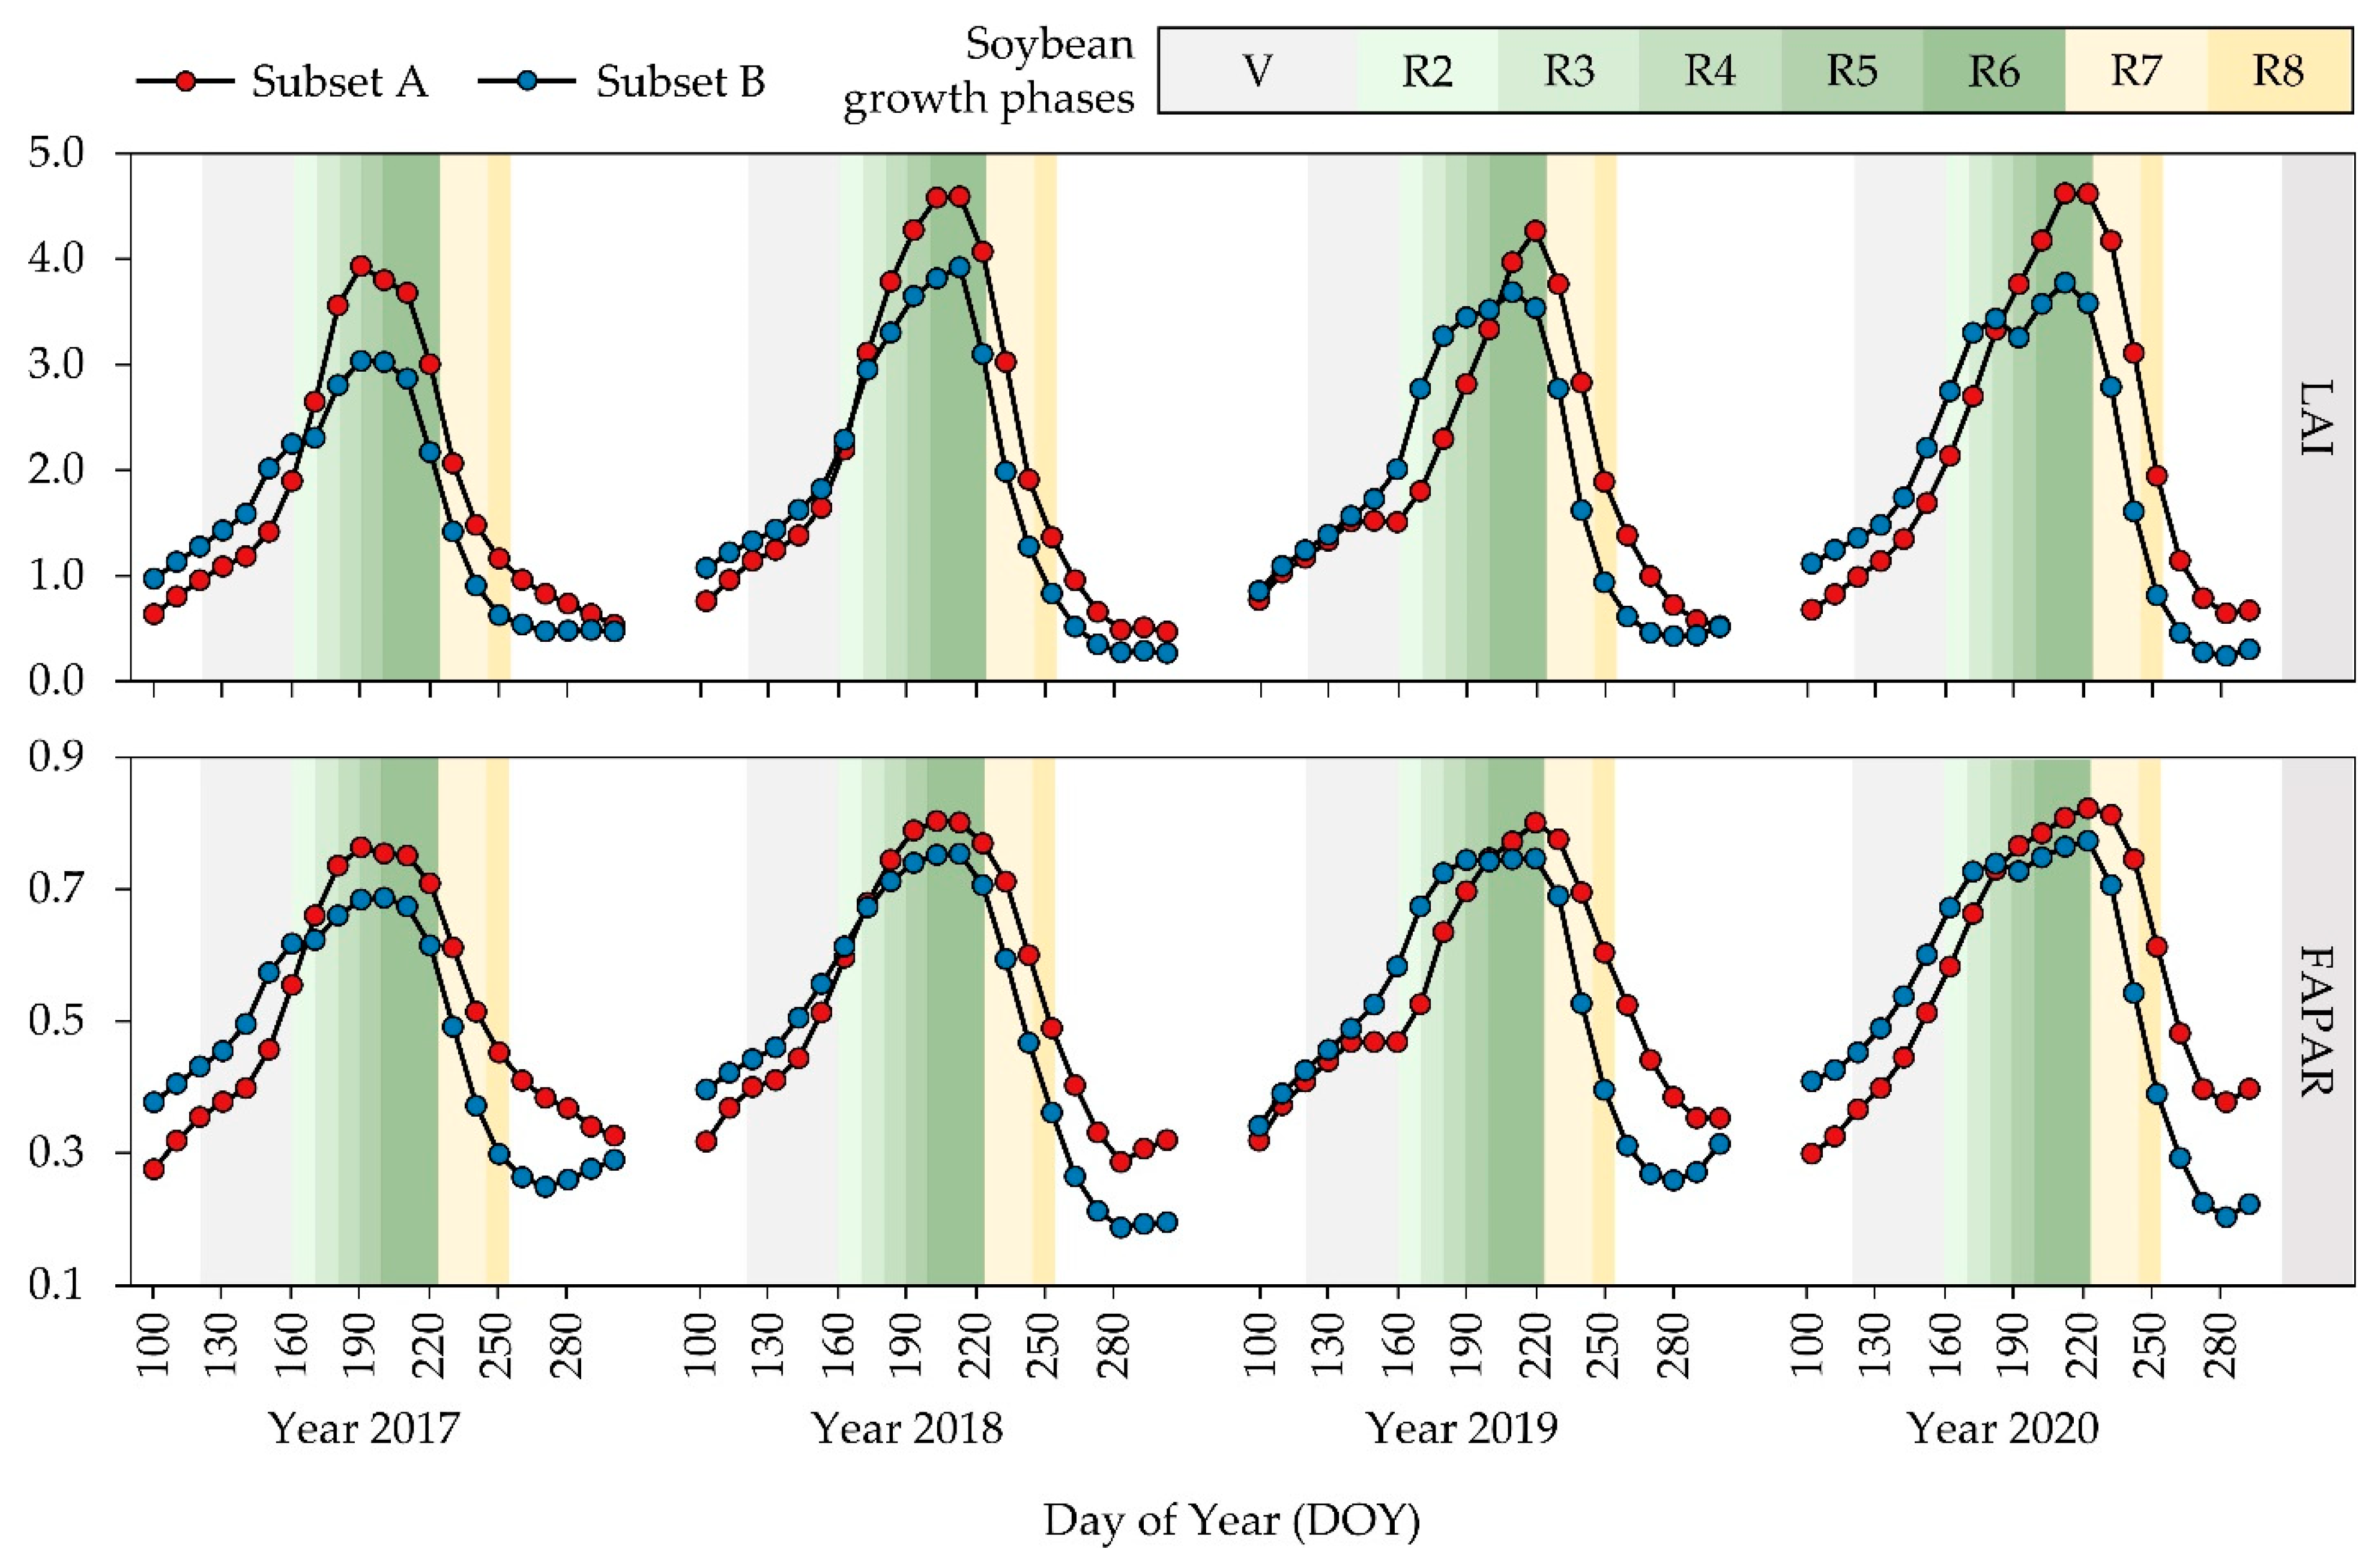
| Year | Suitability Class | Subset A | Subset B | ||||
|---|---|---|---|---|---|---|---|
| Elements | Mean LAI | Mean FAPAR | Elements | Mean LAI | Mean FAPAR | ||
| 2020 | S1 | 23 | 3.058 | 0.647 | 52 | 2.787 | 0.551 |
| S2 | 42 | 2.488 | 0.535 | 148 | 2.355 | 0.545 | |
| S3 | 52 | 2.376 | 0.571 | 74 | 1.990 | 0.545 | |
| N1 | 57 | 2.126 | 0.552 | 171 | 1.988 | 0.534 | |
| N2 | 62 | 1.924 | 0.561 | 115 | 1.556 | 0.495 | |
| 2019 | S1 | 32 | 2.122 | 0.582 | 48 | 1.969 | 0.541 |
| S2 | 47 | 2.280 | 0.533 | 69 | 2.366 | 0.493 | |
| S3 | 54 | 1.912 | 0.544 | 157 | 2.166 | 0.507 | |
| N1 | 39 | 1.967 | 0.506 | 186 | 1.833 | 0.507 | |
| N2 | 34 | 1.808 | 0.520 | 158 | 1.651 | 0.508 | |
| 2018 | S1 | 74 | 2.524 | 0.538 | 75 | 2.496 | 0.498 |
| S2 | 37 | 2.291 | 0.521 | 153 | 2.183 | 0.500 | |
| S3 | 66 | 1.954 | 0.560 | 197 | 1.848 | 0.490 | |
| N1 | 63 | 2.072 | 0.526 | 174 | 1.552 | 0.475 | |
| N2 | 64 | 1.788 | 0.511 | 68 | 1.566 | 0.455 | |
| 2017 | S1 | 23 | 2.203 | 0.588 | 128 | 2.076 | 0.495 |
| S2 | 48 | 2.017 | 0.554 | 78 | 1.721 | 0.507 | |
| S3 | 57 | 2.131 | 0.488 | 203 | 1.646 | 0.461 | |
| N1 | 84 | 1.571 | 0.495 | 78 | 1.465 | 0.450 | |
| N2 | 87 | 1.801 | 0.477 | 181 | 1.333 | 0.441 | |
References
- Bengochea Paz, D.; Henderson, K.; Loreau, M. Agricultural Land Use and the Sustainability of Social-Ecological Systems. Ecol. Model. 2020, 437, 109312. [Google Scholar] [CrossRef] [PubMed]
- Food and Agriculture Organization of the United Nations (Ed.) The Future of Food and Agriculture: Trends and Challenges; Food and Agriculture Organization of the United Nations: Rome, Italy, 2017; ISBN 978-92-5-109551-5. [Google Scholar]
- Yu, J.; Wu, J. The Sustainability of Agricultural Development in China: The Agriculture–Environment Nexus. Sustainability 2018, 10, 1776. [Google Scholar] [CrossRef] [Green Version]
- Nelson, G.; Bogard, J.; Lividini, K.; Arsenault, J.; Riley, M.; Sulser, T.B.; Mason-D’Croz, D.; Power, B.; Gustafson, D.; Herrero, M.; et al. Income Growth and Climate Change Effects on Global Nutrition Security to Mid-Century. Nat. Sustain. 2018, 1, 773–781. [Google Scholar] [CrossRef]
- Tang, L.; Hayashi, K.; Kohyama, K.; Leon, A. Reconciling Life Cycle Environmental Impacts with Ecosystem Services: A Management Perspective on Agricultural Land Use. Sustainability 2018, 10, 630. [Google Scholar] [CrossRef] [Green Version]
- Jurišić, M.; Radočaj, D.; Šiljeg, A.; Antonić, O.; Živić, T. Current Status and Perspective of Remote Sensing Application in Crop Management. J. Cent. Eur. Agric. 2021, 22, 156–166. [Google Scholar] [CrossRef]
- Song, G.; Zhang, H. Cultivated Land Use Layout Adjustment Based on Crop Planting Suitability: A Case Study of Typical Counties in Northeast China. Land 2021, 10, 107. [Google Scholar] [CrossRef]
- Akpoti, K.; Kabo-bah, A.T.; Zwart, S.J. Agricultural Land Suitability Analysis: State-of-the-Art and Outlooks for Integration of Climate Change Analysis. Agric. Syst. 2019, 173, 172–208. [Google Scholar] [CrossRef]
- Harrison, P. (Ed.) World Agriculture: Towards 2015/2030: Summary Report; Food and Agriculture Organization of the United Nations: Rome, Italy, 2002; ISBN 978-92-5-104761-3. [Google Scholar]
- United States Department of Agriculture. World Agricultural Supply and Demand Estimates. Available online: https://www.usda.gov/oce/commodity/wasde/wasde0421.pdf (accessed on 13 May 2021).
- Radočaj, D.; Jurišić, M.; Gašparović, M.; Plaščak, I. Optimal Soybean (Glycine Max L.) Land Suitability Using GIS-Based Multicriteria Analysis and Sentinel-2 Multitemporal Images. Remote Sens. 2020, 12, 1463. [Google Scholar] [CrossRef]
- Dedeoğlu, M.; Dengiz, O. Generating of Land Suitability Index for Wheat with Hybrid System Aproach Using AHP and GIS. Comput. Electron. Agric. 2019, 167, 105062. [Google Scholar] [CrossRef]
- Jurišić, M.; Plaščak, I.; Antonić, O.; Radočaj, D. Suitability Calculation for Red Spicy Pepper Cultivation (Capsicum Annum L.) Using Hybrid GIS-Based Multicriteria Analysis. Agronomy 2020, 10, 3. [Google Scholar] [CrossRef] [Green Version]
- Binte Mostafiz, R.; Noguchi, R.; Ahamed, T. Agricultural Land Suitability Assessment Using Satellite Remote Sensing-Derived Soil-Vegetation Indices. Land 2021, 10, 223. [Google Scholar] [CrossRef]
- Radočaj, D.; Obhođaš, J.; Jurišić, M.; Gašparović, M. Global Open Data Remote Sensing Satellite Missions for Land Monitoring and Conservation: A Review. Land 2020, 9, 402. [Google Scholar] [CrossRef]
- Seyedmohammadi, J.; Sarmadian, F.; Jafarzadeh, A.A.; McDowell, R.W. Development of a Model Using Matter Element, AHP and GIS Techniques to Assess the Suitability of Land for Agriculture. Geoderma 2019, 352, 80–95. [Google Scholar] [CrossRef]
- Saaty, T.L.; Ozdemir, M.S. Why the Magic Number Seven plus or Minus Two. Math. Comput. Model. 2003, 38, 233–244. [Google Scholar] [CrossRef]
- Li, Z.; Fan, Z.; Shen, S. Urban Green Space Suitability Evaluation Based on the AHP-CV Combined Weight Method: A Case Study of Fuping County, China. Sustainability 2018, 10, 2656. [Google Scholar] [CrossRef] [Green Version]
- Maxwell, A.E.; Warner, T.A.; Fang, F. Implementation of Machine-Learning Classification in Remote Sensing: An Applied Review. Int. J. Remote Sens. 2018, 39, 2784–2817. [Google Scholar] [CrossRef] [Green Version]
- Roell, Y.E.; Beucher, A.; Møller, P.G.; Greve, M.B.; Greve, M.H. Comparing a Random Forest Based Prediction of Winter Wheat Yield to Historical Yield Potential. Agronomy 2020, 10, 395. [Google Scholar] [CrossRef] [Green Version]
- Feyisa, G.L.; Palao, L.K.; Nelson, A.; Gumma, M.K.; Paliwal, A.; Win, K.T.; Nge, K.H.; Johnson, D.E. Characterizing and Mapping Cropping Patterns in a Complex Agro-Ecosystem: An Iterative Participatory Mapping Procedure Using Machine Learning Algorithms and MODIS Vegetation Indices. Comput. Electron. Agric. 2020, 175, 105595. [Google Scholar] [CrossRef]
- Chemura, A.; Mutanga, O.; Dube, T. Separability of Coffee Leaf Rust Infection Levels with Machine Learning Methods at Sentinel-2 MSI Spectral Resolutions. Precis. Agric. 2017, 18, 859–881. [Google Scholar] [CrossRef]
- Jiang, D.; Ma, T.; Ding, F.; Fu, J.; Hao, M.; Wang, Q.; Chen, S. Mapping Global Environmental Suitability for Sorghum Bicolor (L.) Moench. Energies 2019, 12, 1928. [Google Scholar] [CrossRef] [Green Version]
- Gómez, D.; Salvador, P.; Sanz, J.; Casanova, J.L. Potato Yield Prediction Using Machine Learning Techniques and Sentinel 2 Data. Remote. Sens. 2019, 11, 1745. [Google Scholar] [CrossRef] [Green Version]
- Taghizadeh-Mehrjardi, R.; Nabiollahi, K.; Rasoli, L.; Kerry, R.; Scholten, T. Land Suitability Assessment and Agricultural Production Sustainability Using Machine Learning Models. Agronomy 2020, 10, 573. [Google Scholar] [CrossRef]
- Food and Agriculture Organization of the United Nations (FAO). A Framework for Land Evaluation, Chapter 3: Land Suitability Classifications. Available online: http://www.fao.org/3/x5310e/x5310e04.htm (accessed on 2 May 2021).
- Akpoti, K.; Kabo-bah, A.T.; Dossou-Yovo, E.R.; Groen, T.A.; Zwart, S.J. Mapping Suitability for Rice Production in Inland Valley Landscapes in Benin and Togo Using Environmental Niche Modeling. Sci. Total Environ. 2020, 709, 136165. [Google Scholar] [CrossRef]
- Ayu Purnamasari, R.; Noguchi, R.; Ahamed, T. Land Suitability Assessments for Yield Prediction of Cassava Using Geospatial Fuzzy Expert Systems and Remote Sensing. Comput. Electron. Agric. 2019, 166, 105018. [Google Scholar] [CrossRef]
- Wannasek, L.; Ortner, M.; Amon, B.; Amon, T. Sorghum, a Sustainable Feedstock for Biogas Production? Impact of Climate, Variety and Harvesting Time on Maturity and Biomass Yield. Biomass Bioenergy 2017, 106, 137–145. [Google Scholar] [CrossRef]
- Baldini, M.; Ferfuia, C.; Zuliani, F.; Danuso, F. Suitability Assessment of Different Hemp (Cannabis Sativa L.) Varieties to the Cultivation Environment. Ind. Crops Prod. 2020, 143, 111860. [Google Scholar] [CrossRef]
- Fensholt, R.; Sandholt, I.; Rasmussen, M.S. Evaluation of MODIS LAI, FAPAR and the Relation between FAPAR and NDVI in a Semi-Arid Environment Using in Situ Measurements. Remote Sens. Environ. 2004, 91, 490–507. [Google Scholar] [CrossRef]
- Gitelson, A.A.; Peng, Y.; Huemmrich, K.F. Relationship between Fraction of Radiation Absorbed by Photosynthesizing Maize and Soybean Canopies and NDVI from Remotely Sensed Data Taken at Close Range and from MODIS 250m Resolution Data. Remote Sens. Environ. 2014, 147, 108–120. [Google Scholar] [CrossRef] [Green Version]
- Khamala, E. Review of the Available Remote Sensing Tools, Products, Methodologies and Data to Improve Crop Production Forecasts; Food and Agriculture Organization of the United Nations: Rome, Italy, 2017. [Google Scholar]
- Marshall, M.; Thenkabail, P. Developing in Situ Non-Destructive Estimates of Crop Biomass to Address Issues of Scale in Remote Sensing. Remote Sens. 2015, 7, 808–835. [Google Scholar] [CrossRef] [Green Version]
- Casa, R.; Varella, H.; Buis, S.; Guérif, M.; De Solan, B.; Baret, F. Forcing a Wheat Crop Model with LAI Data to Access Agronomic Variables: Evaluation of the Impact of Model and LAI Uncertainties and Comparison with an Empirical Approach. Eur. J. Agron. 2012, 37, 1–10. [Google Scholar] [CrossRef]
- Habyarimana, E.; Piccard, I.; Catellani, M.; De Franceschi, P.; Dall’Agata, M. Towards Predictive Modeling of Sorghum Biomass Yields Using Fraction of Absorbed Photosynthetically Active Radiation Derived from Sentinel-2 Satellite Imagery and Supervised Machine Learning Techniques. Agronomy 2019, 9, 203. [Google Scholar] [CrossRef] [Green Version]
- Gitelson, A.A. Remote Estimation of Fraction of Radiation Absorbed by Photosynthetically Active Vegetation: Generic Algorithm for Maize and Soybean. Remote Sens. Lett. 2019, 10, 283–291. [Google Scholar] [CrossRef]
- Fuster, B.; Sánchez-Zapero, J.; Camacho, F.; García-Santos, V.; Verger, A.; Lacaze, R.; Weiss, M.; Baret, F.; Smets, B. Quality Assessment of PROBA-V LAI, FAPAR and FCOVER Collection 300 m Products of Copernicus Global Land Service. Remote Sens. 2020, 12, 1017. [Google Scholar] [CrossRef] [Green Version]
- Radočaj, D.; Jurišić, M.; Zebec, V.; Plaščak, I. Delineation of Soil Texture Suitability Zones for Soybean Cultivation: A Case Study in Continental Croatia. Agronomy 2020, 10, 823. [Google Scholar] [CrossRef]
- Jurišić, M.; Radočaj, D.; Krčmar, S.; Plaščak, I.; Gašparović, M. Geostatistical Analysis of Soil C/N Deficiency and Its Effect on Agricultural Land Management of Major Crops in Eastern Croatia. Agronomy 2020, 10, 1996. [Google Scholar] [CrossRef]
- Bogunovic, I.; Trevisani, S.; Seput, M.; Juzbasic, D.; Durdevic, B. Short-Range and Regional Spatial Variability of Soil Chemical Properties in an Agro-Ecosystem in Eastern Croatia. Catena 2017, 154, 50–62. [Google Scholar] [CrossRef]
- Croatian Bureau of Statistics, Areas and Production of Cereals and Other Crops. 2020. Available online: https://www.dzs.hr/Hrv_Eng/publication/2020/01-01-18_01_2020.htm (accessed on 15 May 2021).
- Galić Subašić, D. Influence of Irrigation, Nitrogen Fertilization and Genotype on the Yield and Quality of Soybean (Glycine max (L.) Merr.). Ph.D. Thesis, Josip Juraj Strossmayer University of Osijek, Faculty of Agrobiotechical Sciences Osijek, Osijek, Croatia, 2018. [Google Scholar]
- Liu, X.; Jin, J.; Herbert, S.J.; Zhang, Q.; Wang, G. Yield Components, Dry Matter, LAI and LAD of Soybeans in Northeast China. Field Crops Res. 2005, 93, 85–93. [Google Scholar] [CrossRef]
- Yadav, K.; Congalton, R.G. Accuracy Assessment of Global Food Security-Support Analysis Data (GFSAD) Cropland Extent Maps Produced at Three Different Spatial Resolutions. Remote Sens. 2018, 10, 1800. [Google Scholar] [CrossRef] [Green Version]
- Hsieh, P.F.; Lee, L.C.; Chen, N.Y. Effect of Spatial Resolution on Classification Errors of Pure and Mixed Pixels in Remote Sensing. IEEE Trans. Geosci. Remote Sens. 2001, 39, 2657–2663. [Google Scholar] [CrossRef]
- Anthony, P.; Malzer, G.; Sparrow, S.; Zhang, M. Soybean Yield and Quality in Relation to Soil Properties. Agron. J. 2012, 104, 1443–1458. [Google Scholar] [CrossRef]
- Müller, M.; Schneider, J.R.; Klein, V.A.; da Silva, E.; da Silva Júnior, J.P.; Souza, A.M.; Chavarria, G. Soybean Root Growth in Response to Chemical, Physical, and Biological Soil Variations. Front. Plant Sci. 2021, 12, 272. [Google Scholar] [CrossRef] [PubMed]
- Karger, D.N.; Conrad, O.; Böhner, J.; Kawohl, T.; Kreft, H.; Soria-Auza, R.W.; Zimmermann, N.E.; Linder, H.P.; Kessler, M. Climatologies at High Resolution for the Earth’s Land Surface Areas. Sci. Data 2017, 4, 170122. [Google Scholar] [CrossRef] [PubMed] [Green Version]
- Hengl, T.; de Jesus, J.M.; Heuvelink, G.B.M.; Gonzalez, M.R.; Kilibarda, M.; Blagotić, A.; Shangguan, W.; Wright, M.N.; Geng, X.; Bauer-Marschallinger, B.; et al. SoilGrids250m: Global Gridded Soil Information Based on Machine Learning. PLoS ONE 2017, 12, e0169748. [Google Scholar] [CrossRef] [PubMed] [Green Version]
- EU-DEM v1.1—Copernicus Land Monitoring Service. Available online: https://land.copernicus.eu/imagery-in-situ/eu-dem/eu-dem-v1.1 (accessed on 21 April 2021).
- PROBA-V Products User Manual v3.01. Available online: https://proba-v.vgt.vito.be/sites/proba-v.vgt.vito.be/files/products_user_manual.pdf (accessed on 21 April 2021).
- Liu, Y.; Dai, L. Modelling the Impacts of Climate Change and Crop Management Measures on Soybean Phenology in China. J. Clean. Prod. 2020, 262, 121271. [Google Scholar] [CrossRef]
- Liu, S.; Zhang, P.; Marley, B.; Liu, W. The Factors Affecting Farmers’ Soybean Planting Behavior in Heilongjiang Province, China. Agriculture 2019, 9, 188. [Google Scholar] [CrossRef] [Green Version]
- Böhner, J.; Antonić, O. Land-Surface Parameters Specific to Topo-Climatology. In Developments in Soil Science; Hengl, T., Reuter, H.I., Eds.; Geomorphometry; Elsevier: Amsterdam, The Netherlands, 2009; Chapter 8; Volume 33, pp. 195–226. [Google Scholar]
- Stein, A.; Riley, J.; Halberg, N. Issues of Scale for Environmental Indicators. Agric. Ecosyst. Environ. 2001, 87, 215–232. [Google Scholar] [CrossRef] [Green Version]
- Liu, H.; Weng, Q. Scaling Effect of Fused ASTER-MODIS Land Surface Temperature in an Urban Environment. Sensors 2018, 18, 4058. [Google Scholar] [CrossRef]
- Peng, S.; Ding, Y.; Liu, W.; Li, Z. 1 Km Monthly Temperature and Precipitation Dataset for China from 1901 to 2017. Earth Syst. Sci. Data 2019, 11, 1931–1946. [Google Scholar] [CrossRef] [Green Version]
- Dabija, A.; Kluczek, M.; Zagajewski, B.; Raczko, E.; Kycko, M.; Al-Sulttani, A.H.; Tardà, A.; Pineda, L.; Corbera, J. Comparison of Support Vector Machines and Random Forests for Corine Land Cover Mapping. Remote Sens. 2021, 13, 777. [Google Scholar] [CrossRef]
- Colditz, R.R. An Evaluation of Different Training Sample Allocation Schemes for Discrete and Continuous Land Cover Classification Using Decision Tree-Based Algorithms. Remote Sens. 2015, 7, 9655–9681. [Google Scholar] [CrossRef] [Green Version]
- Grabska, E.; Hostert, P.; Pflugmacher, D.; Ostapowicz, K. Forest Stand Species Mapping Using the Sentinel-2 Time Series. Remote Sens. 2019, 11, 1197. [Google Scholar] [CrossRef] [Green Version]
- Pontius, R.G.; Millones, M. Death to Kappa: Birth of Quantity Disagreement and Allocation Disagreement for Accuracy Assessment. Int. J. Remote Sens. 2011, 32, 4407–4429. [Google Scholar] [CrossRef]
- Food and Agriculture Organization of the United Nations (FAO). A Framework for Land Evaluation, Chapter 7: Land Suitability Assessment. Available online: http://www.fao.org/3/t0741e/T0741E10.htm (accessed on 16 May 2021).
- Wolanin, A.; Camps-Valls, G.; Gómez-Chova, L.; Mateo-García, G.; van der Tol, C.; Zhang, Y.; Guanter, L. Estimating Crop Primary Productivity with Sentinel-2 and Landsat 8 Using Machine Learning Methods Trained with Radiative Transfer Simulations. Remote Sens. Environ. 2019, 225, 441–457. [Google Scholar] [CrossRef]
- Waldner, F.; Lambert, M.-J.; Li, W.; Weiss, M.; Demarez, V.; Morin, D.; Marais-Sicre, C.; Hagolle, O.; Baret, F.; Defourny, P. Land Cover and Crop Type Classification along the Season Based on Biophysical Variables Retrieved from Multi-Sensor High-Resolution Time Series. Remote Sens. 2015, 7, 10400–10424. [Google Scholar] [CrossRef] [Green Version]
- Møller, A.B.; Mulder, V.L.; Heuvelink, G.B.M.; Jacobsen, N.M.; Greve, M.H. Can We Use Machine Learning for Agricultural Land Suitability Assessment? Agronomy 2021, 11, 703. [Google Scholar] [CrossRef]
- Gašparović, I.; Gašparović, M.; Medak, D. Determining and Analysing Solar Irradiation Based on Freely Available Data: A Case Study from Croatia. Environ. Dev. 2018, 26, 55–67. [Google Scholar] [CrossRef]
- Darwin, B.; Dharmaraj, P.; Prince, S.; Popescu, D.E.; Hemanth, D.J. Recognition of Bloom/Yield in Crop Images Using Deep Learning Models for Smart Agriculture: A Review. Agronomy 2021, 11, 646. [Google Scholar] [CrossRef]
- Pu, X.; Xie, J.; Cheng, H.; Yang, S. Temporal Trends of Soil Organic Carbon and Total Nitrogen Losses in Seasonally Frozen Zones of Northeast China: Responses to Long-Term Conventional Cultivation (1965–2010). Environ. Process. 2014, 1, 415–429. [Google Scholar] [CrossRef] [Green Version]
- Poggio, L.; de Sousa, L.M.; Batjes, N.H.; Heuvelink, G.; Kempen, B.; Ribeiro, E.; Rossiter, D. SoilGrids 2.0: Producing soil information for the globe with quantified spatial uncertainty. Soil 2021, 7, 217–240. [Google Scholar] [CrossRef]


| Properties | Subset | Data Source | |
|---|---|---|---|
| A | B | ||
| Longitude/Latitude | 16°45′ E, 45°41′ N | 18°38′ E, 45°20′ N | / |
| Major land cover classes | Agricultural areas (55.5%), Forests (39.9%), Urban areas (2.9%) | Agricultural areas (75.7%), Forests (17.8%), Urban areas (5.7%) | CORINE 2018 |
| Total country soybean area in 2020 | 10.1% | 22.8% | APPRRR |
| Mean annual air temperature | 11.0 °C ± 0.2 °C | 11.1 °C ± 0.1 °C | CHELSA |
| Mean air temperature (April–October) | 17.5 °C ± 0.3 °C | 17.9 °C ± 0.1 °C | CHELSA |
| Total annual precipitation | 859.1 mm ± 34.7 mm | 685.9 mm ± 24.9 mm | CHELSA |
| Total precipitation (April–October) | 547.6 mm ± 28.3 mm | 449.2 mm ± 14.2 mm | CHELSA |
| Mean elevation | 134.8 m ± 41.0 m | 91.1 m ± 9.7 m | EU-DEM |
| Mean slope | 1.5° | 0.4° | EU-DEM |
| Major soil types per FAO85 classification | Dystric Gleysol (Gd), Stagno-Gleyic Luvisol (Lgs) | Eutric Gleysol (Ge), Mollic Gleysol (Gm), Orthic Luvisol (Lo) | ESDC |
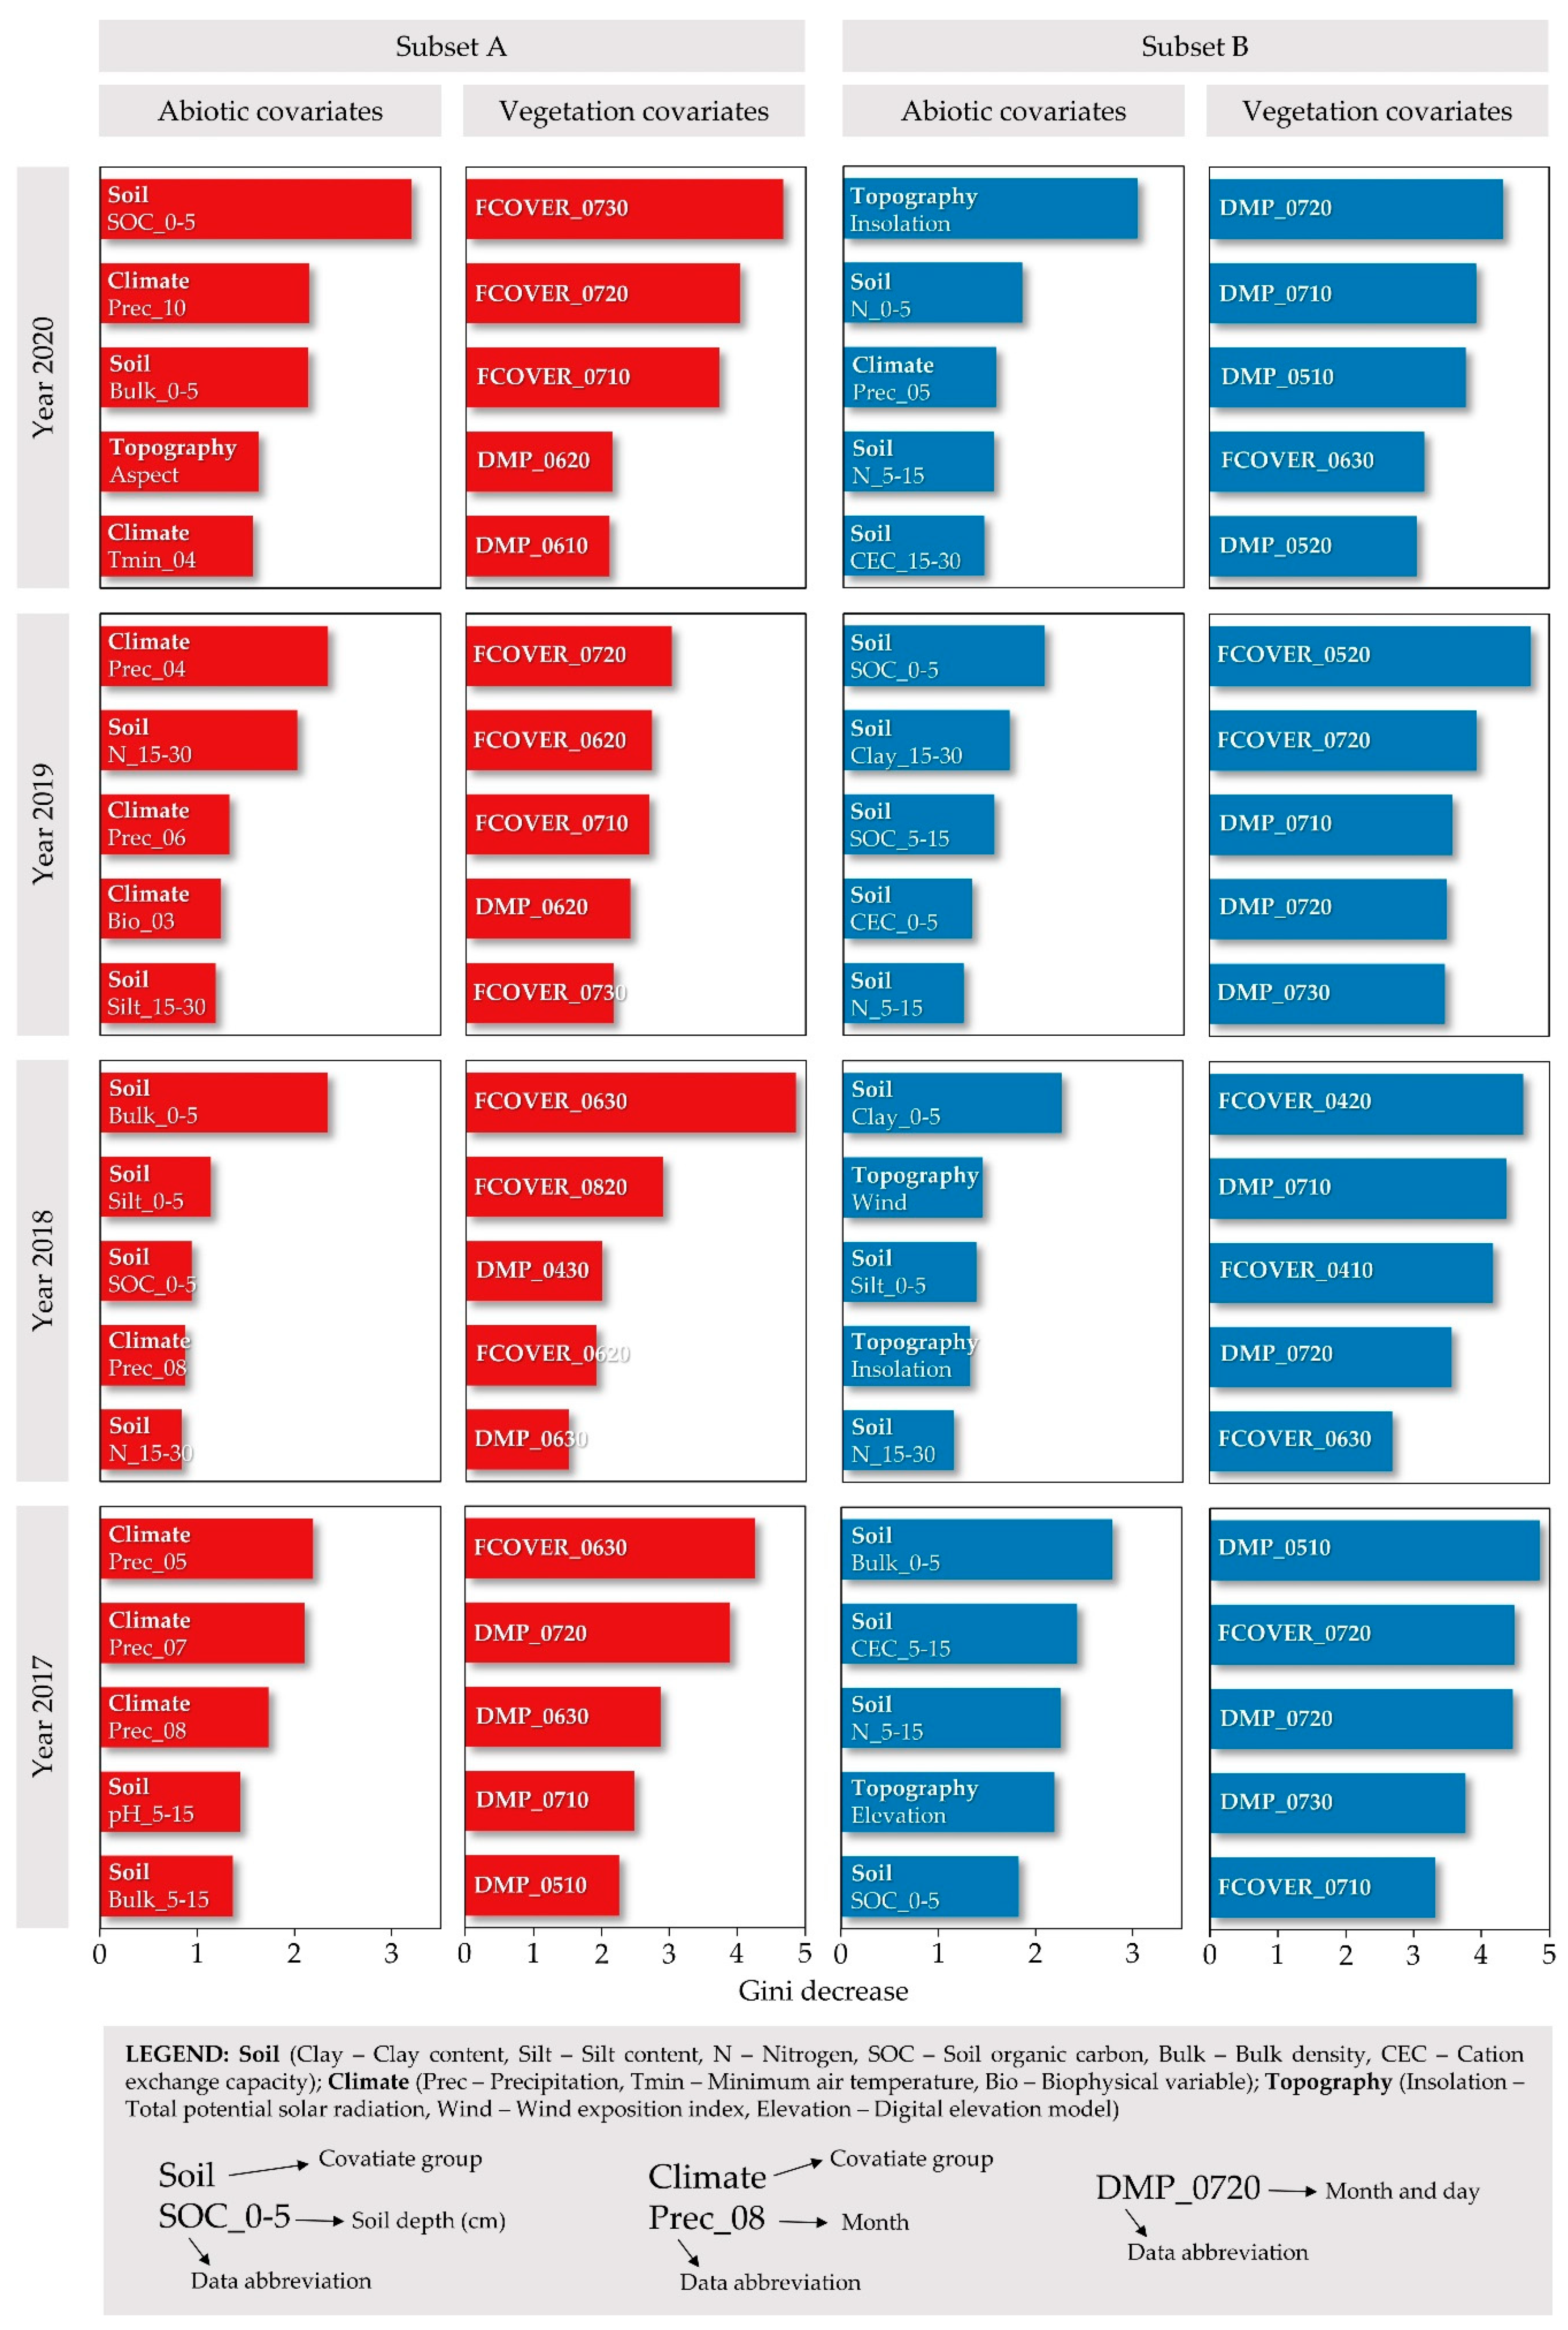
| Covariate Group | Covariate | Measurement Unit | Native Spatial Resolution (m) | Data Source |
|---|---|---|---|---|
| Climate | Mean monthly air temperature | °C | 1000 | CHELSA [49] |
| Minimum monthly air temperature | °C | |||
| Maximum monthly air temperature | °C | |||
| Total monthly precipitation | mm | |||
| Bioclimatic variables | varying | |||
| Soil | Nitrogen | cg kg−1 | 250 | SoilGrids [50] |
| Soil organic carbon | dg kg−1 | |||
| pH | / | |||
| Cation exchange capacity | mmol(c) kg−1 | |||
| Clay content | g kg−1 | |||
| Silt content | g kg−1 | |||
| Sand content | g kg−1 | |||
| Bulk density | cg cm−3 | |||
| Topographic | Digital elevation model | m | 25 | EU-DEM [51] |
| Slope | ° | derived from EU-DEM | ||
| Aspect | ° | |||
| Total potential solar radiation | kWh m−2 | |||
| Topographic wetness index | / | |||
| Wind exposition index | / | |||
| Vegetation | Dry matter productivity | kg ha−1 day−1 | 300 | PROBA-V [52] |
| Fraction of vegetation cover | / |
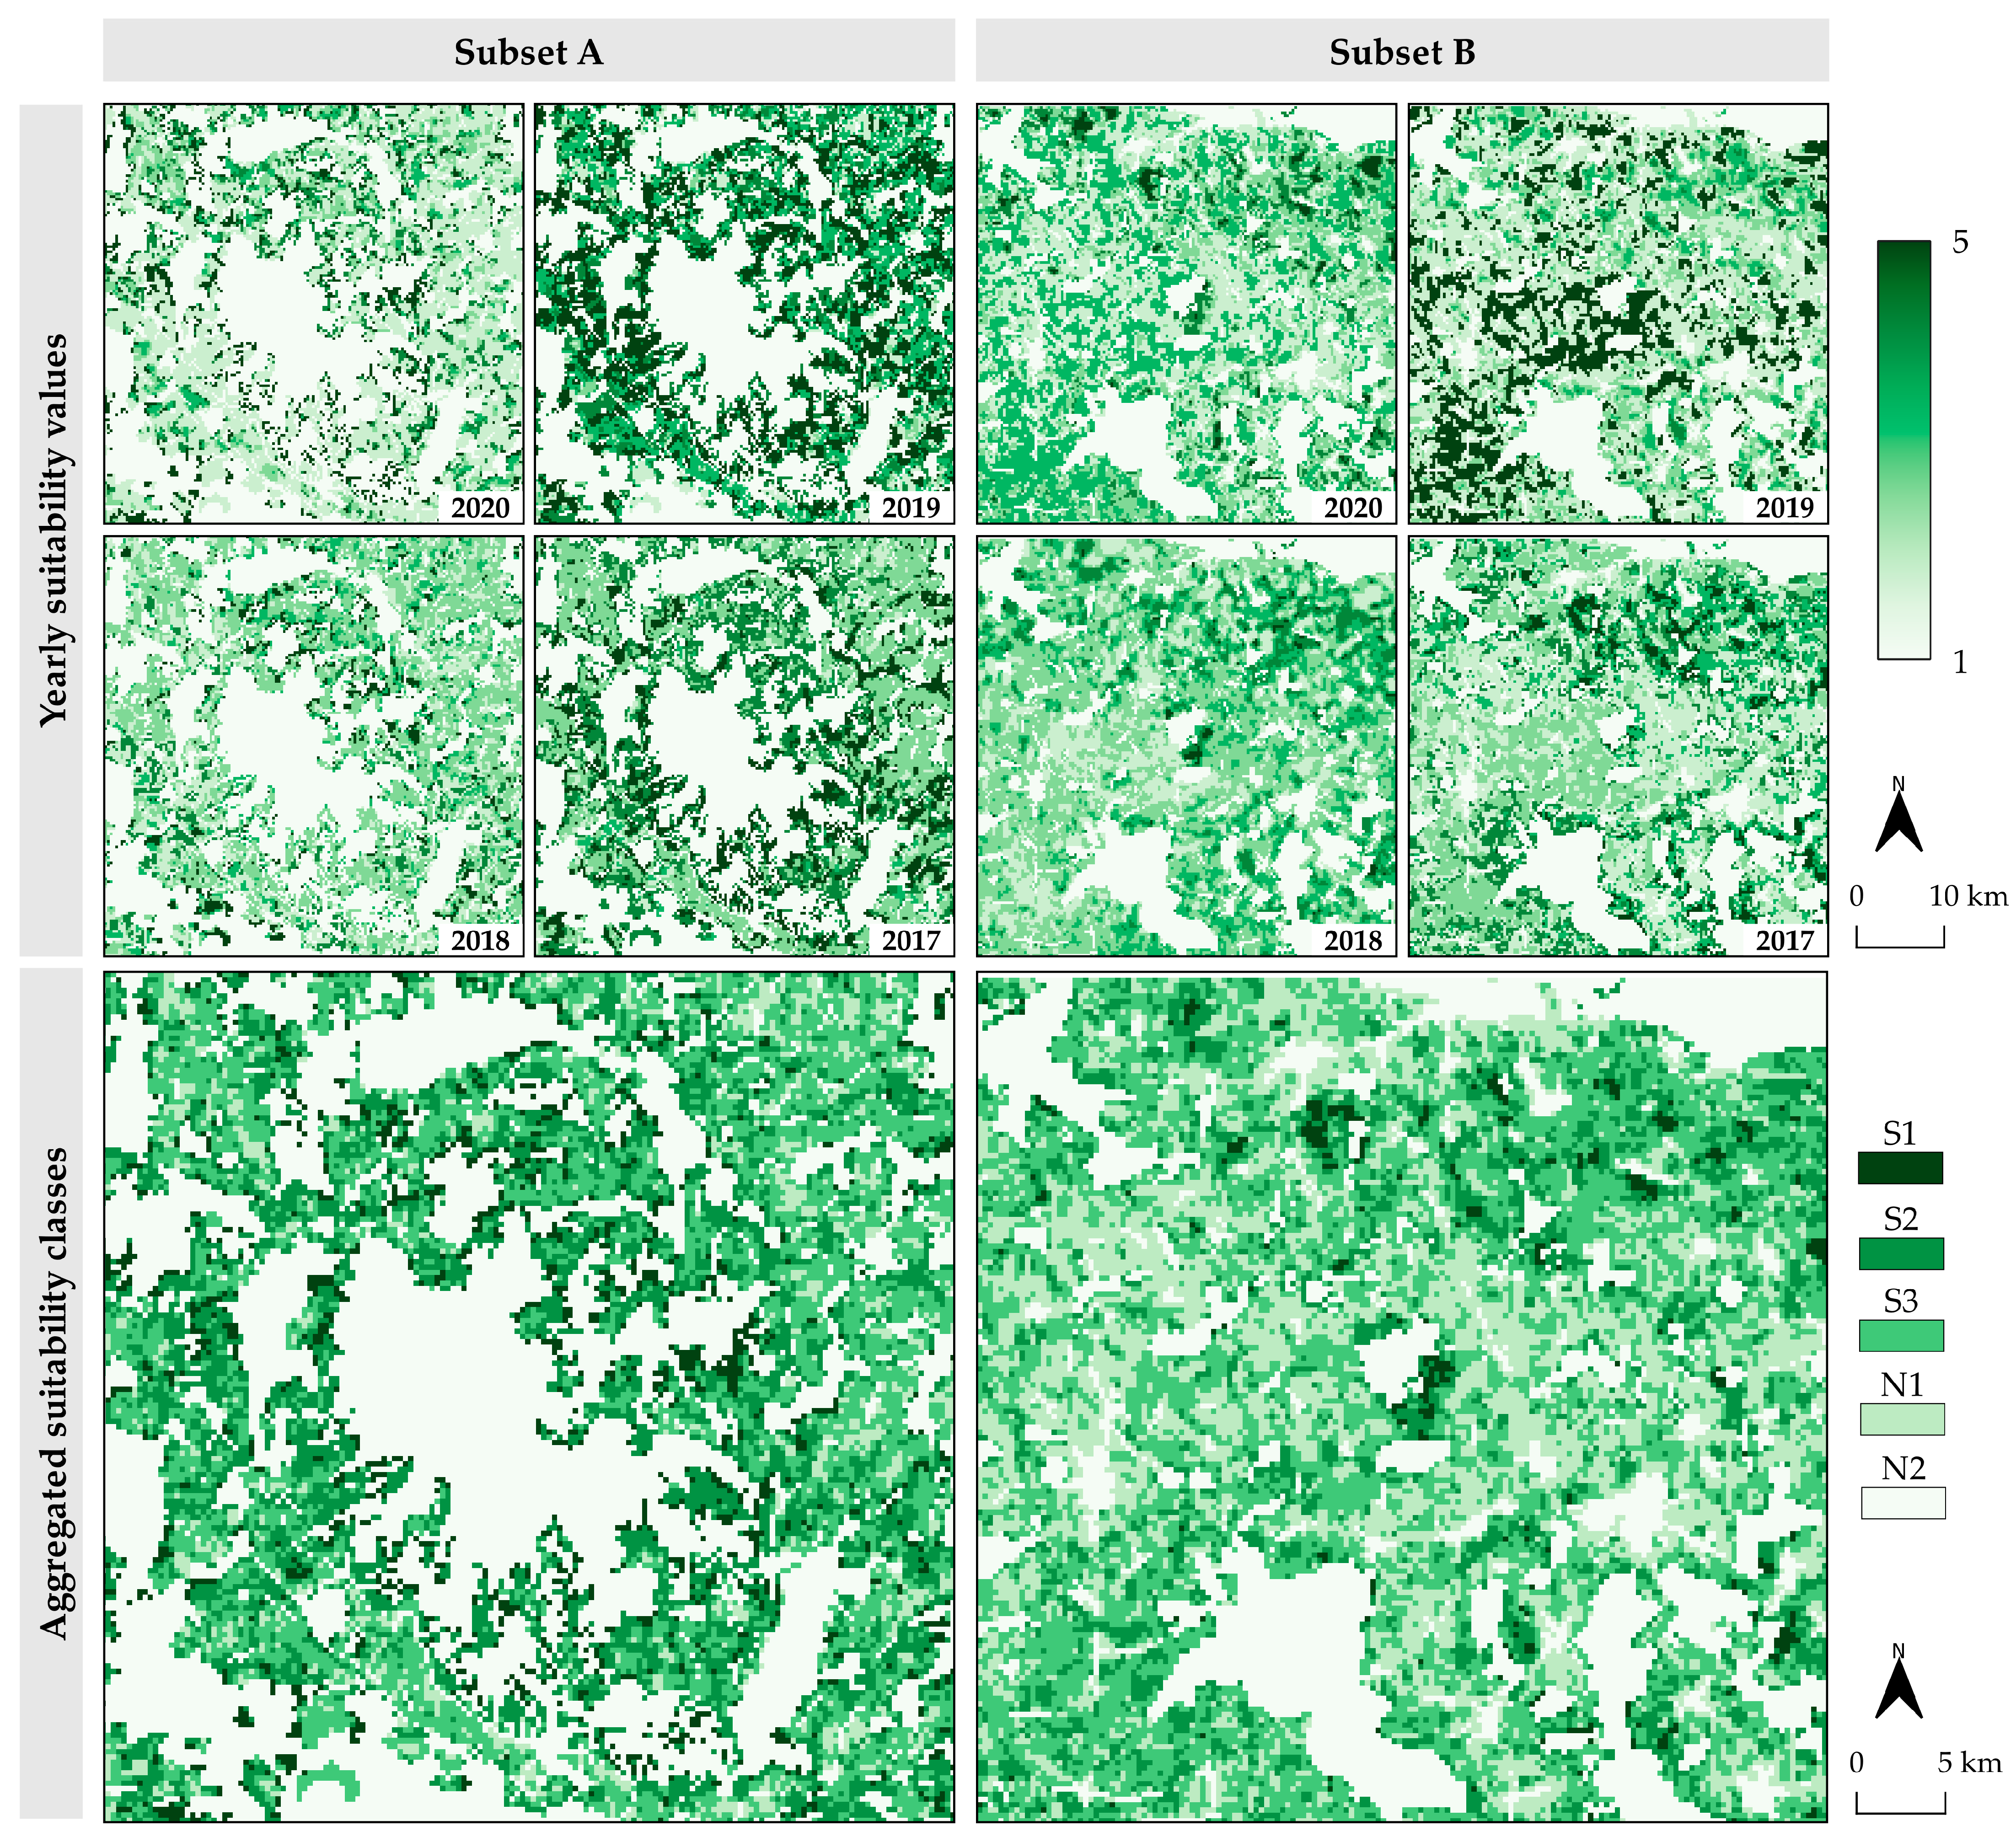
| FAO Suitability Class | Percentage of Maximum Suitability per FAO Specifications [63] | Range of Suitability Values |
|---|---|---|
| S1 | 80–100% | 4–5 |
| S2 | 60–80% | 3–4 |
| S3 | 40–60% | 2–3 |
| N1 | 20–40% | 1–2 |
| N2 | 0–20% | non-agricultural |
| Subset/Year | Total Sample Count | Area (ha) | Percentage of Subset Agricultural Land (%) |
|---|---|---|---|
| A/2020 | 236 | 2124 | 1.53 |
| A/2019 | 206 | 1854 | 1.34 |
| A/2018 | 304 | 2736 | 1.97 |
| A/2017 | 299 | 2691 | 1.94 |
| B/2020 | 560 | 5040 | 2.67 |
| B/2019 | 618 | 5562 | 2.94 |
| B/2018 | 667 | 6003 | 3.18 |
| B/2017 | 668 | 6012 | 3.18 |
| Subset/ Year | Method | Suitability Values | OA | ||||||||||||||
|---|---|---|---|---|---|---|---|---|---|---|---|---|---|---|---|---|---|
| 5 (Very High) | 4 (High) | 3 (Moderate) | 2 (Low) | 1 (Very Low) | |||||||||||||
| F | o | c | F | o | c | F | o | c | F | o | c | F | o | c | |||
| A/2020 | RF | 46.2 | 5.0 | 0.8 | 38.7 | 7.6 | 8.4 | 62.5 | 5.0 | 5.0 | 57.6 | 8.4 | 3.4 | 71.4 | 0.8 | 9.2 | 73.1 |
| SVM | 43.8 | 4.2 | 3.4 | 40.6 | 6.7 | 9.2 | 51.7 | 9.2 | 2.5 | 36.2 | 10.1 | 15.1 | 59.0 | 6.7 | 6.7 | 63.0 | |
| A/2019 | RF | 66.7 | 3.8 | 1.9 | 77.8 | 2.9 | 2.9 | 65.7 | 3.8 | 7.7 | 46.2 | 7.7 | 5.8 | 41.7 | 6.7 | 6.7 | 75.0 |
| SVM | 64.7 | 4.8 | 1.0 | 38.5 | 13.5 | 1.9 | 53.2 | 1.9 | 19.2 | 42.9 | 7.7 | 7.7 | 45.5 | 6.7 | 4.8 | 65.4 | |
| A/2018 | RF | 73.2 | 4.6 | 2.6 | 60.0 | 4.6 | 0.7 | 69.4 | 5.2 | 2.0 | 54.5 | 5.2 | 7.8 | 64.4 | 2.0 | 8.5 | 78.4 |
| SVM | 51.0 | 7.8 | 7.8 | 52.4 | 5.2 | 1.3 | 55.9 | 9.2 | 0.7 | 44.7 | 7.2 | 9.8 | 58.0 | 2.0 | 11.8 | 68.6 | |
| A/2017 | RF | 76.9 | 1.3 | 0.7 | 50.0 | 6.0 | 3.3 | 69.0 | 6.0 | 0.0 | 66.1 | 3.3 | 9.3 | 72.2 | 3.3 | 6.7 | 80.0 |
| SVM | 69.2 | 2.0 | 0.7 | 48.3 | 6.0 | 4.0 | 57.6 | 6.7 | 2.7 | 66.7 | 5.3 | 6.0 | 60.7 | 4.7 | 11.3 | 75.3 | |
| B/2020 | RF | 60.7 | 2.9 | 1.1 | 64.8 | 5.4 | 6.1 | 62.8 | 3.2 | 2.5 | 61.5 | 6.1 | 9.0 | 56.9 | 6.1 | 5.1 | 76.2 |
| SVM | 44.0 | 5.1 | 0.0 | 55.8 | 7.6 | 7.6 | 60.0 | 4.3 | 1.4 | 62.2 | 3.6 | 12.6 | 59.2 | 5.8 | 4.7 | 73.6 | |
| B/2019 | RF | 67.9 | 1.6 | 1.3 | 73.2 | 1.6 | 1.9 | 69.2 | 5.2 | 3.9 | 62.7 | 7.5 | 5.8 | 65.0 | 4.2 | 7.1 | 79.9 |
| SVM | 70.8 | 2.3 | 0.0 | 83.8 | 1.3 | 0.6 | 67.7 | 5.2 | 4.5 | 60.0 | 6.5 | 9.1 | 67.4 | 4.5 | 5.5 | 80.2 | |
| B/2018 | RF | 82.1 | 1.8 | 0.3 | 62.5 | 5.7 | 4.2 | 65.9 | 5.4 | 7.2 | 74.5 | 3.3 | 4.5 | 78.9 | 1.2 | 1.2 | 82.5 |
| SVM | 99.9 | 0.0 | 0.0 | 66.3 | 6.3 | 1.8 | 61.5 | 4.8 | 10.8 | 64.8 | 5.7 | 5.4 | 77.8 | 1.8 | 0.6 | 81.3 | |
| B/2017 | RF | 73.0 | 2.7 | 3.3 | 65.1 | 3.0 | 1.5 | 69.2 | 6.4 | 4.5 | 76.2 | 1.8 | 1.2 | 76.6 | 2.1 | 5.5 | 83.9 |
| SVM | 78.3 | 2.7 | 1.8 | 52.3 | 4.5 | 1.8 | 72.4 | 3.9 | 6.4 | 80.0 | 1.8 | 0.6 | 69.1 | 3.9 | 6.4 | 83.0 | |
| Subset | Class Coverage per Aggregated Suitability Class (%) | ||||
|---|---|---|---|---|---|
| S1 | S2 | S3 | N1 | N2 | |
| A | 6.1 | 21.0 | 22.2 | 5.7 | 45.0 |
| B | 1.5 | 13.4 | 34.6 | 25.1 | 25.3 |
Publisher’s Note: MDPI stays neutral with regard to jurisdictional claims in published maps and institutional affiliations. |
© 2021 by the authors. Licensee MDPI, Basel, Switzerland. This article is an open access article distributed under the terms and conditions of the Creative Commons Attribution (CC BY) license (https://creativecommons.org/licenses/by/4.0/).
Share and Cite
Radočaj, D.; Jurišić, M.; Gašparović, M.; Plaščak, I.; Antonić, O. Cropland Suitability Assessment Using Satellite-Based Biophysical Vegetation Properties and Machine Learning. Agronomy 2021, 11, 1620. https://doi.org/10.3390/agronomy11081620
Radočaj D, Jurišić M, Gašparović M, Plaščak I, Antonić O. Cropland Suitability Assessment Using Satellite-Based Biophysical Vegetation Properties and Machine Learning. Agronomy. 2021; 11(8):1620. https://doi.org/10.3390/agronomy11081620
Chicago/Turabian StyleRadočaj, Dorijan, Mladen Jurišić, Mateo Gašparović, Ivan Plaščak, and Oleg Antonić. 2021. "Cropland Suitability Assessment Using Satellite-Based Biophysical Vegetation Properties and Machine Learning" Agronomy 11, no. 8: 1620. https://doi.org/10.3390/agronomy11081620
APA StyleRadočaj, D., Jurišić, M., Gašparović, M., Plaščak, I., & Antonić, O. (2021). Cropland Suitability Assessment Using Satellite-Based Biophysical Vegetation Properties and Machine Learning. Agronomy, 11(8), 1620. https://doi.org/10.3390/agronomy11081620