1. Introduction
Marker-assisted breeding often requires a large number of samples to be genotyped, especially in early generations, for effective selection [
1,
2]. Molecular markers such as SSRs and SNPs are the most commonly utilized types for marker-assisted selection. With the advent of NGS (Next Generation Sequencing) technology, high-throughput platforms have been used for SNP identification and genotyping in plants. However, the complexity of the polyploid plant genome has complicated the interpretation of SNP calls, and decreased validation success [
3]. Challenges in genotyping polyploids have been reported before [
4,
5]. Bertioli et al. [
6] also reported decreased SNP validation success from genotyping studies in peanut. Moreover, despite a reduction in cost per SNP, the large number of accessions to be genotyped makes the cost of genotyping a population for QTL analysis problematic for many breeding programs.
Cultivated peanut makes an ideal system for testing resequencing in a complex polyploid.
Arachis hypogaea L., along with the closely-related wild tetraploid species
A. monticola, is allotetraploid (2n = 4x = 40), wherein two related genomes are present.
A. hypogaea is widely considered to be derived from a single recent hybridization event between the two diploid species
A. duranensis and
A. ipaënsis, followed by chromosome doubling to form a polyploid [
7,
8,
9,
10]. However, there is also evidence for limited recombination between genomes near the telomeres, resulting in a limited degree of segmental allopolyploidy [
11]. A and B genomes have undergone relatively few changes since polyploidization and thus are very closely related to each other [
10,
12]. The high similarity between the two genome sequences makes it difficult to differentiate homoeologous from homologous variation. The total genome size of the cultivated peanut is estimated to be around 2.7 G bp with a repetitive content of 64% [
10,
13,
14]. Despite using sophisticated bioinformatics tools, homologous sequences obtained by NGS cannot be separated easily from homoeologous and paralogous sequences, and SNP identification using NGS in allopolyploids has had low validation rates [
15]. The software program SWEEP (Sliding Window Extraction of Explicit Polymorphisms) has been developed and implemented to filter out homoeologous SNPs in peanut [
16]. SWEEP uses genome polymorphism haplotypes to filter out homoeologous SNPs as a prelude to identifying true homologous SNPs between genotypes.
SNP genotyping methods mentioned above have been useful at identifying or measuring of variation in peanut. The KASP (LGC Ltd., Teddington, UK) assay that is based on single allele discrimination is used for MAS (Marker Assisted Selection) where there are many individuals x a few numbers of SNPs to identify. Genotype by sequencing and SNP chip are cost-effective when there are few individuals ×x thousands of SNPs to screen [
17,
18]. However, GBS and the SNP chip are expensive for performing QTL analysis for a breeding program. There is a need for the development of a cost-effective method, as low as
$5 to
$15 per sample, for QTL discovery in populations comprising a few hundred individuals.
Targeted resequencing is a method of sequencing regions of interest from the genome. Sequencing a subset of the genome is performed to lower the costs relative to whole genome sequencing and can be effective of detecting low levels of variation due to higher read depth. Several studies for targeted resequencing have been reported in plants, especially polyploids [
19,
20,
21,
22]. In this work, we report the use of the Fluidigm Access Array system for targeted resequencing as a proof of concept in peanut. The Access Array system has been developed by Fluidigm for targeted resequencing using a four-primer system that consists of one pair of nested forward and reverse specific primers, plus a pair of primers containing adapters for Illumina sequencing and barcodes, which are unique tags comprising short sequences and are attached to the end of each DNA sample. These barcodes are used as the identifiers for each DNA sample after pooling for mass sequencing. The Access Array uses an Integrated Fluidic Circuit (IFC) plate, consisting of a silicon chip in the center and made of nano-sized reaction chambers surrounded by 48 wells for primers and 48 wells for DNA samples on the other side. Depending on the chemistry version used, 10–50 plex targets can be used, allowing from 480 to 2400 targets to be run simultaneously. The pooled PCR product is ready for Quality Control (QC) analysis and Illumina sequencing without an additional library preparation step (
http://www.fluidigm.com). High read depth of targeted resequencing coupled with multiplexing could potentially be used for cost-effective QTL analysis in peanut and other allopolyploids.
In the current work, we tested targeted resequencing as a potential cost-effective method for QTL analysis in peanut. Forty-eight SNP targets were used, and 48 accessions were evaluated by multiplexed PCR amplification of targets, followed by mass pooled sequencing. We demonstrate that bioinformatic analysis of sequence products was able to validate target SNPs.
3. Results
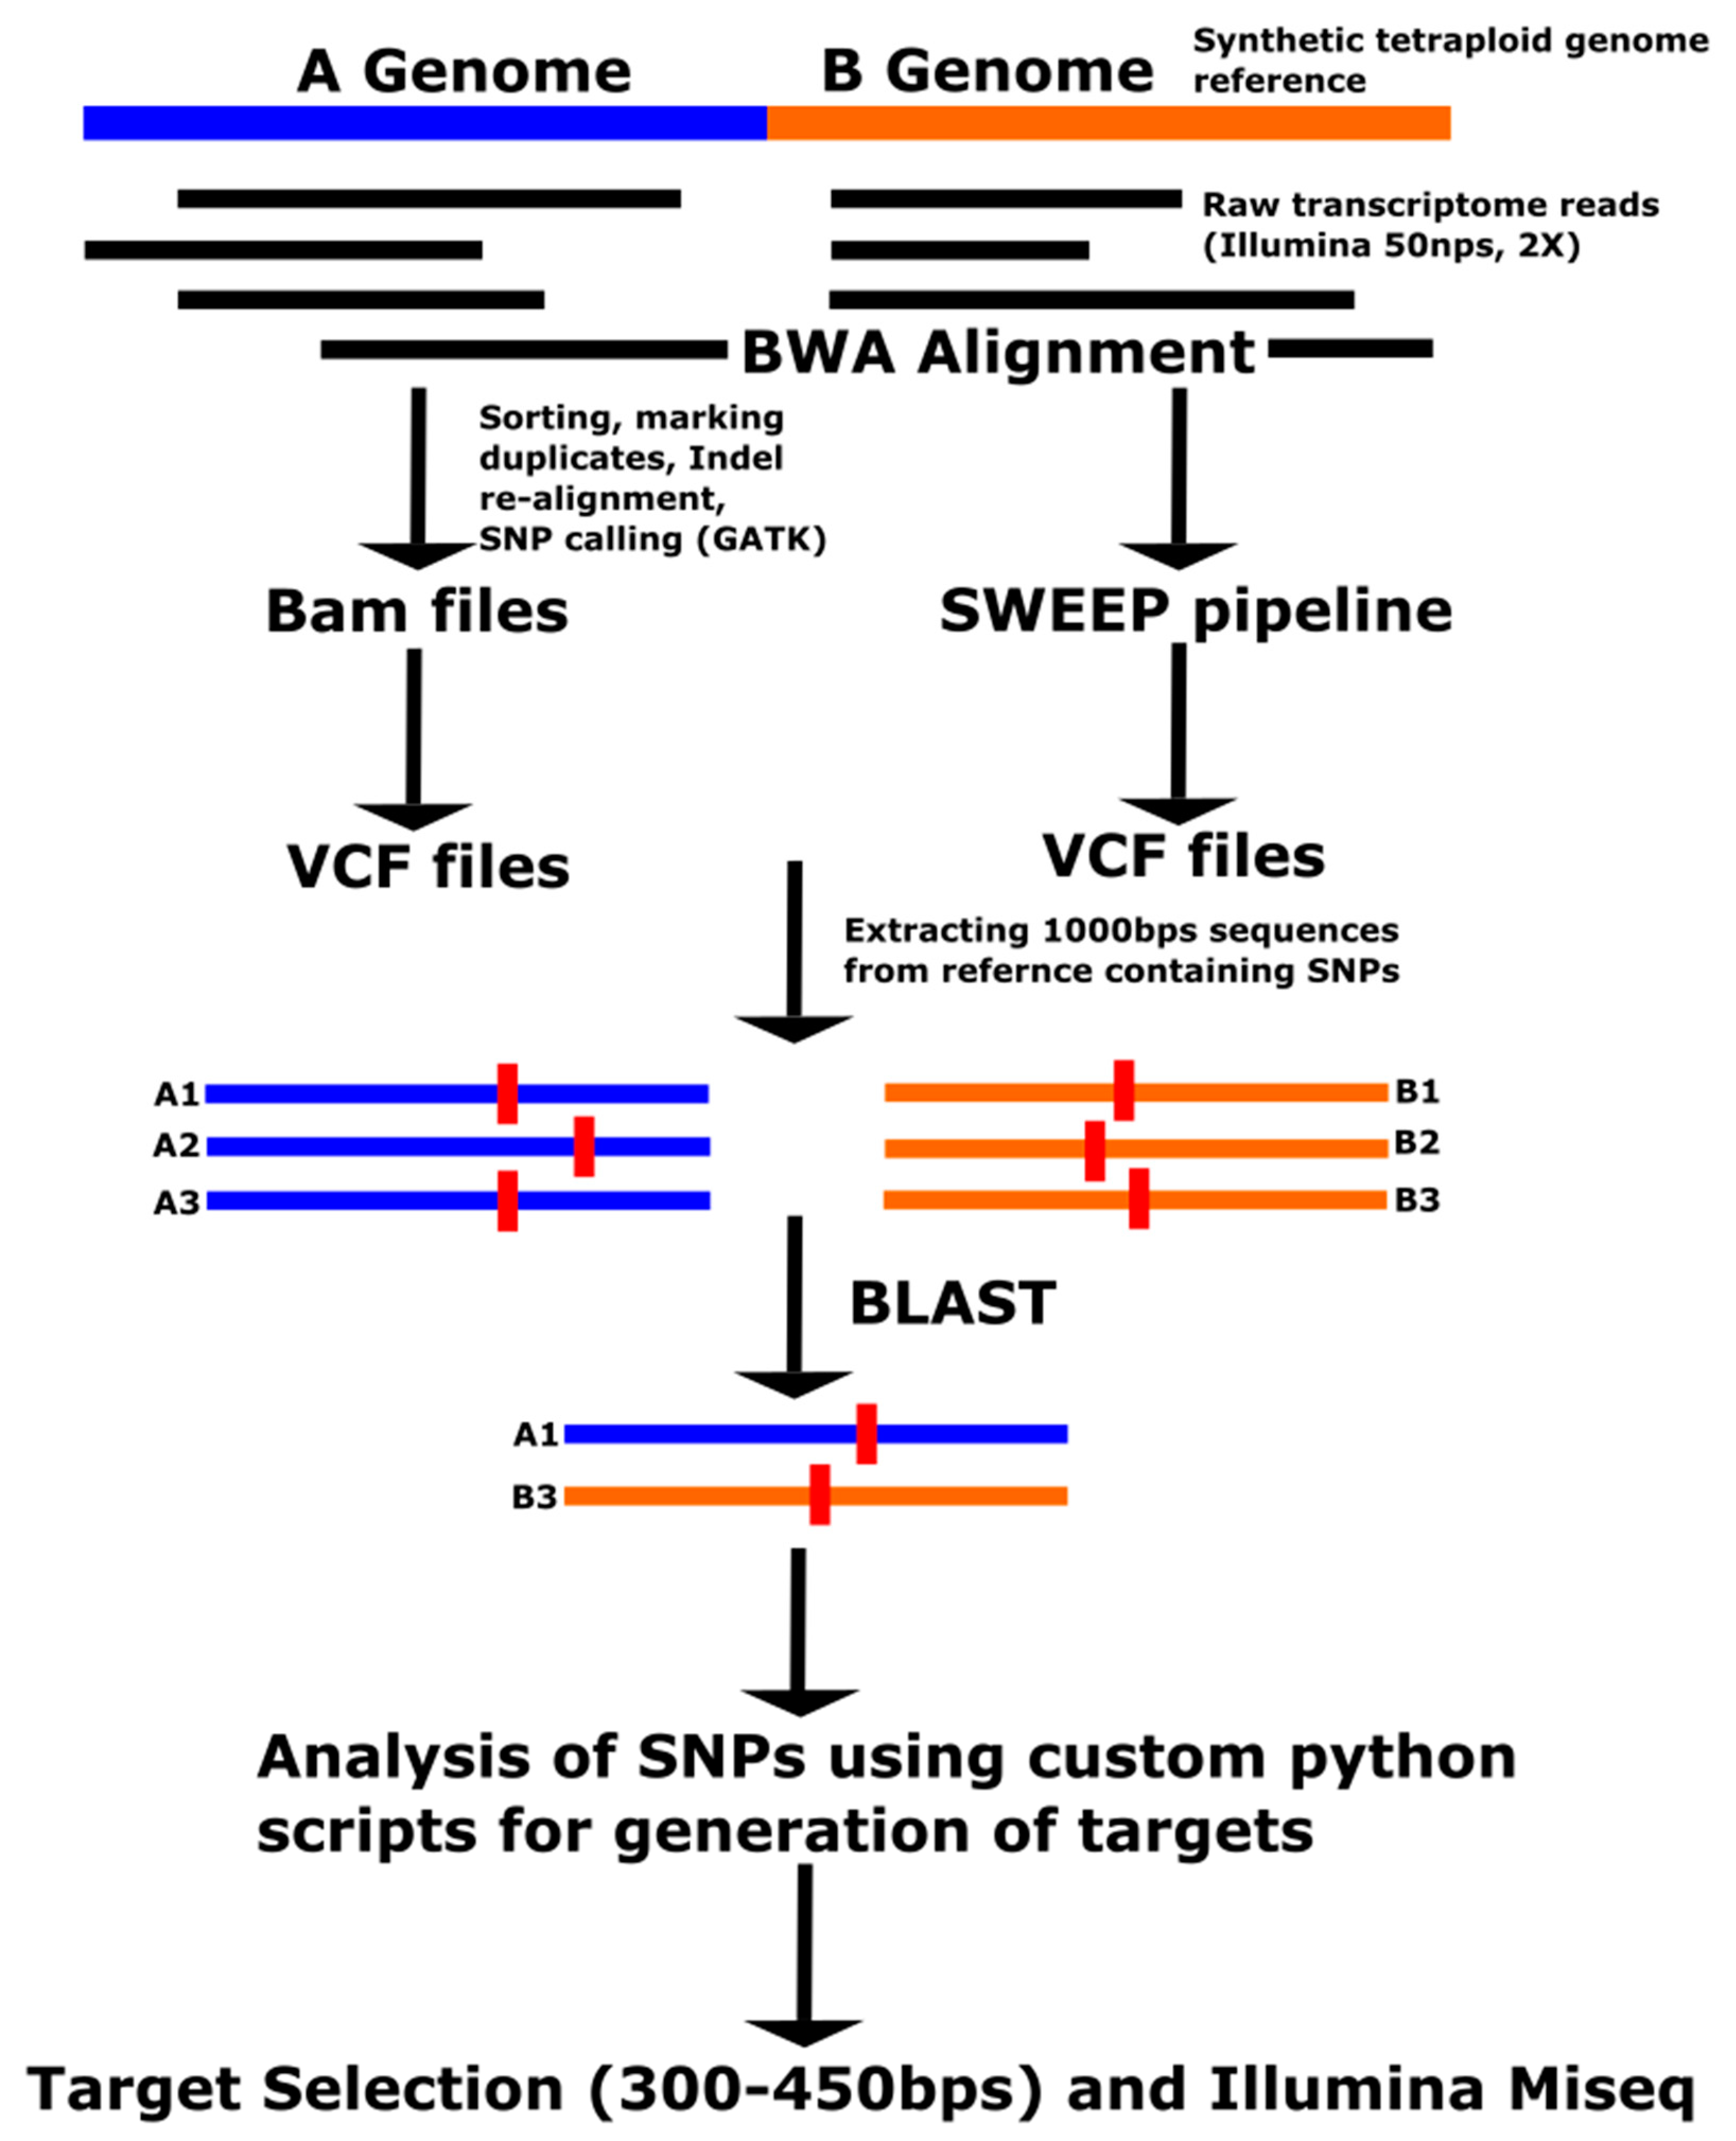
3.1. SNP Identification
From the GATK pipeline, approximately 1.6 million raw SNPs were identified from the SNP identification pipeline (
Table 2). These SNPs were filtered for a minor allele frequency of more than 10%, a read depth of greater than 100 summed across 10 accessions, and Polymorphic Information Content (PIC) of greater than or equal to 0.3. After the filter, 9884 SNPs from 617 A-genome scaffolds and 5684 SNPs from 184 B-genome scaffolds were obtained from tetraploids. Among these, 10,533 SNPs from 418 scaffolds were found to be in the corresponding regions of A genome diploids and also the A genome of the tetraploids, and 502 SNPs were found from 129 genome scaffolds in the homoeologous regions of A genome diploids and A and B genome tetraploids. In the case of the A genome, a greater number of SNPs were present in the diploid/tetraploid comparison than in the A genome of the tetraploids because of the additional SNPs among A genome diploids on the same region that included 250 bp of flanking sequence in each direction surrounding the A-genome tetraploid SNPs. Raw SNPs were also filtered through the SWEEP program. About 40% to 50% of the SNPs identified from GATK were retained by the SWEEP program. SNPs present in the similar regions of A genome diploids and both genomes of tetraploids were used for further target selection. From the alignment with the OLin tetraploid transcriptome reference, 865 SNPs were identified with polymorphic information content greater than 0.3 and with read depth of greater than 100 (
Table 3).
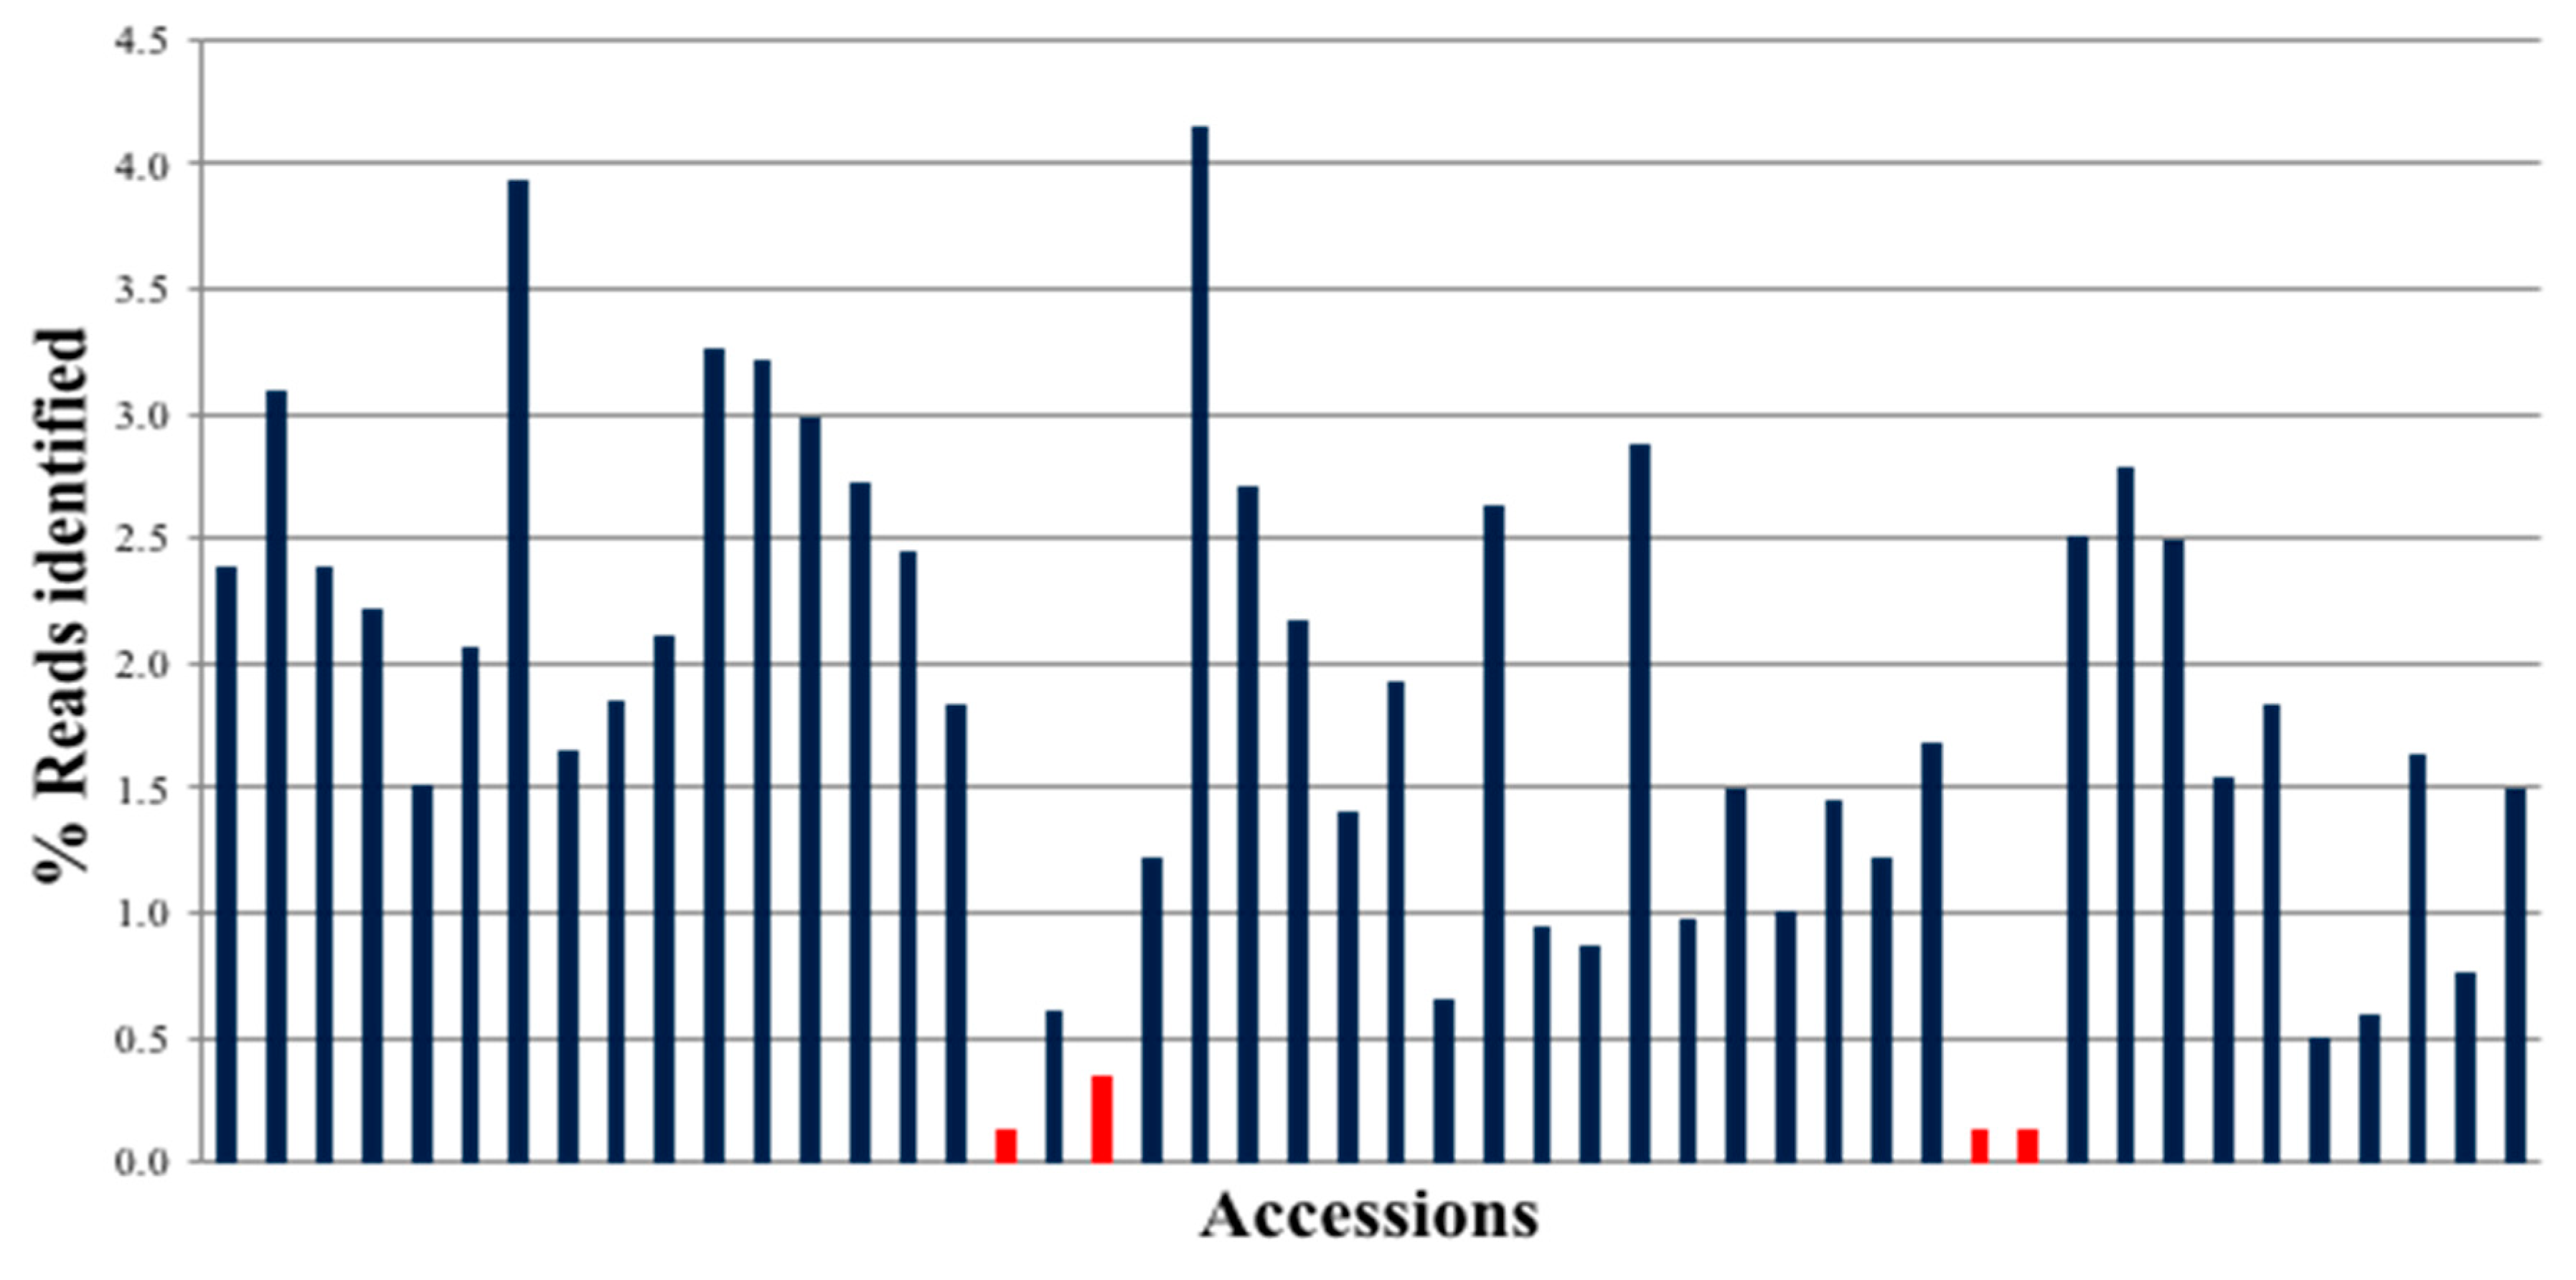
3.2. MiSeq Sequencing
The Illumina MiSeq run for 48 samples × 48 targets generated 30,153,796 reads, of which 24,430,536 were identified with barcodes (
Figure 2). Amplified sequences from all peanut accessions were present, and most of them had similar representation of reads. The exceptions were three samples that had low read depth due to the introduction of bubbles when loading onto the 48.48 IFC.
3.3. SNPs Analysis and Validation
Among the four methods of SNP identification and selection compared, the three methods based on use of a genomic reference gave the highest percentage of validation. GATK had 52.6% of the total polymorphic targets, and 71.4% of SNPs in targets that were successfully identified by sequence analysis validated in the MiSeq run; targets obtained from the SNP chip had 66.7% polymorphism and 66.7% validation, and SNPs filtered through SWEEP had a polymorphism rate of 55.5% and a validation ratio of 62.5%. Targets based on the OLin transcriptome reference [
29] had the lowest polymorphism and validation rates (28.5% and 50%, respectively) (
Table 4).
In the first approach for compiling reads, reads were mapped to the pooled target reference of 48 target regions, and 111 SNPs were identified among the 35 tetraploid accessions. These mapped reads represented 25 genome scaffolds (target regions), as there were many cases where two targets were on a single scaffold. Among these 111 SNPs, 81 SNPs were highly polymorphic with PIC values higher than 0.3 (
Table 5). In contrast to the tetraploids, 246 SNPs representing 38 scaffolds were polymorphic among the four A genome diploid accessions (
A. duranensis KSSc38901,
A. duranensis K7988,
A. cardenasii GKP10017 and
A. diogoi GK10602). Among the four B genome diploid accessions (
A. ipaënsis GKPSSc30076,
A. magna GKSSc30097,
A. cruziana KSSc36024 and
A. batizicoi K9484), 313 SNPs representing 39 scaffolds were highly polymorphic.
In the second approach, reads were mapped to the whole genome reference, from which 73 SNPs were identified among the 35 tetraploid accessions, representing 22 contigs. Among these 73 SNPs, 56 SNPs were highly polymorphic with PIC values higher than 0.3. Among the four A genome diploid accessions (A. duranensis KSSc38901, A. duranensis K7988, A. cardenasii GKP10017 and A. diogoi GK10602), 207 SNPs were highly polymorphic. Among the four B genome diploid accessions (A. ipaënsis GKPSSc30076, A. magna GKSSc30097, A. cruziana KSSc36024 and A. batizicoi K9484), 262 SNPs were highly polymorphic.
In general, a large number of SNPs identified from all the four approaches of initial SNP identification were called as heterozygous (
Supplementary Table S9). Alignment of MiSeq sequences to the synthetic tetraploid reference resulted in a mean of 11.1% heterozygous SNP calls for diploids and 7.5% for tetraploid accessions. Histograms showing SNP distribution were plotted for each accession. Histograms for some diploid and tetraploid accession are shown in
Supplementary Figure S1. Based on these results, it was estimated that a range between 30% to 70% reference allele accurately denoted true heterozygotes in diploids. Peanut is a self-pollinating species, thus, for diploids we do not expect many heterozygotes. Few heterozygotes are expected for tetraploids; however, sequences of homoeologs could have co-mapped and would be considered heterozygotes. Lower percentage heterozygote values were suspected to be incorrect, and the percentage of heterozygotes called based on unfiltered calls varied substantially by accession—from a low of 3.3% in the B genome diploid
A. ipaënsis GKPSSc30076 to 21.2% in the K genome diploid
A. batizicoi K9484. Among tetraploids, the range of heterozygotes called varied from 4.6% (CC 155A) to 24.4% (TxAG-6). After correction for a 20% heterozygote threshold, the percentage of heterozygotes ranged from 0.1% to 0.3% (
Supplementary Table S9).
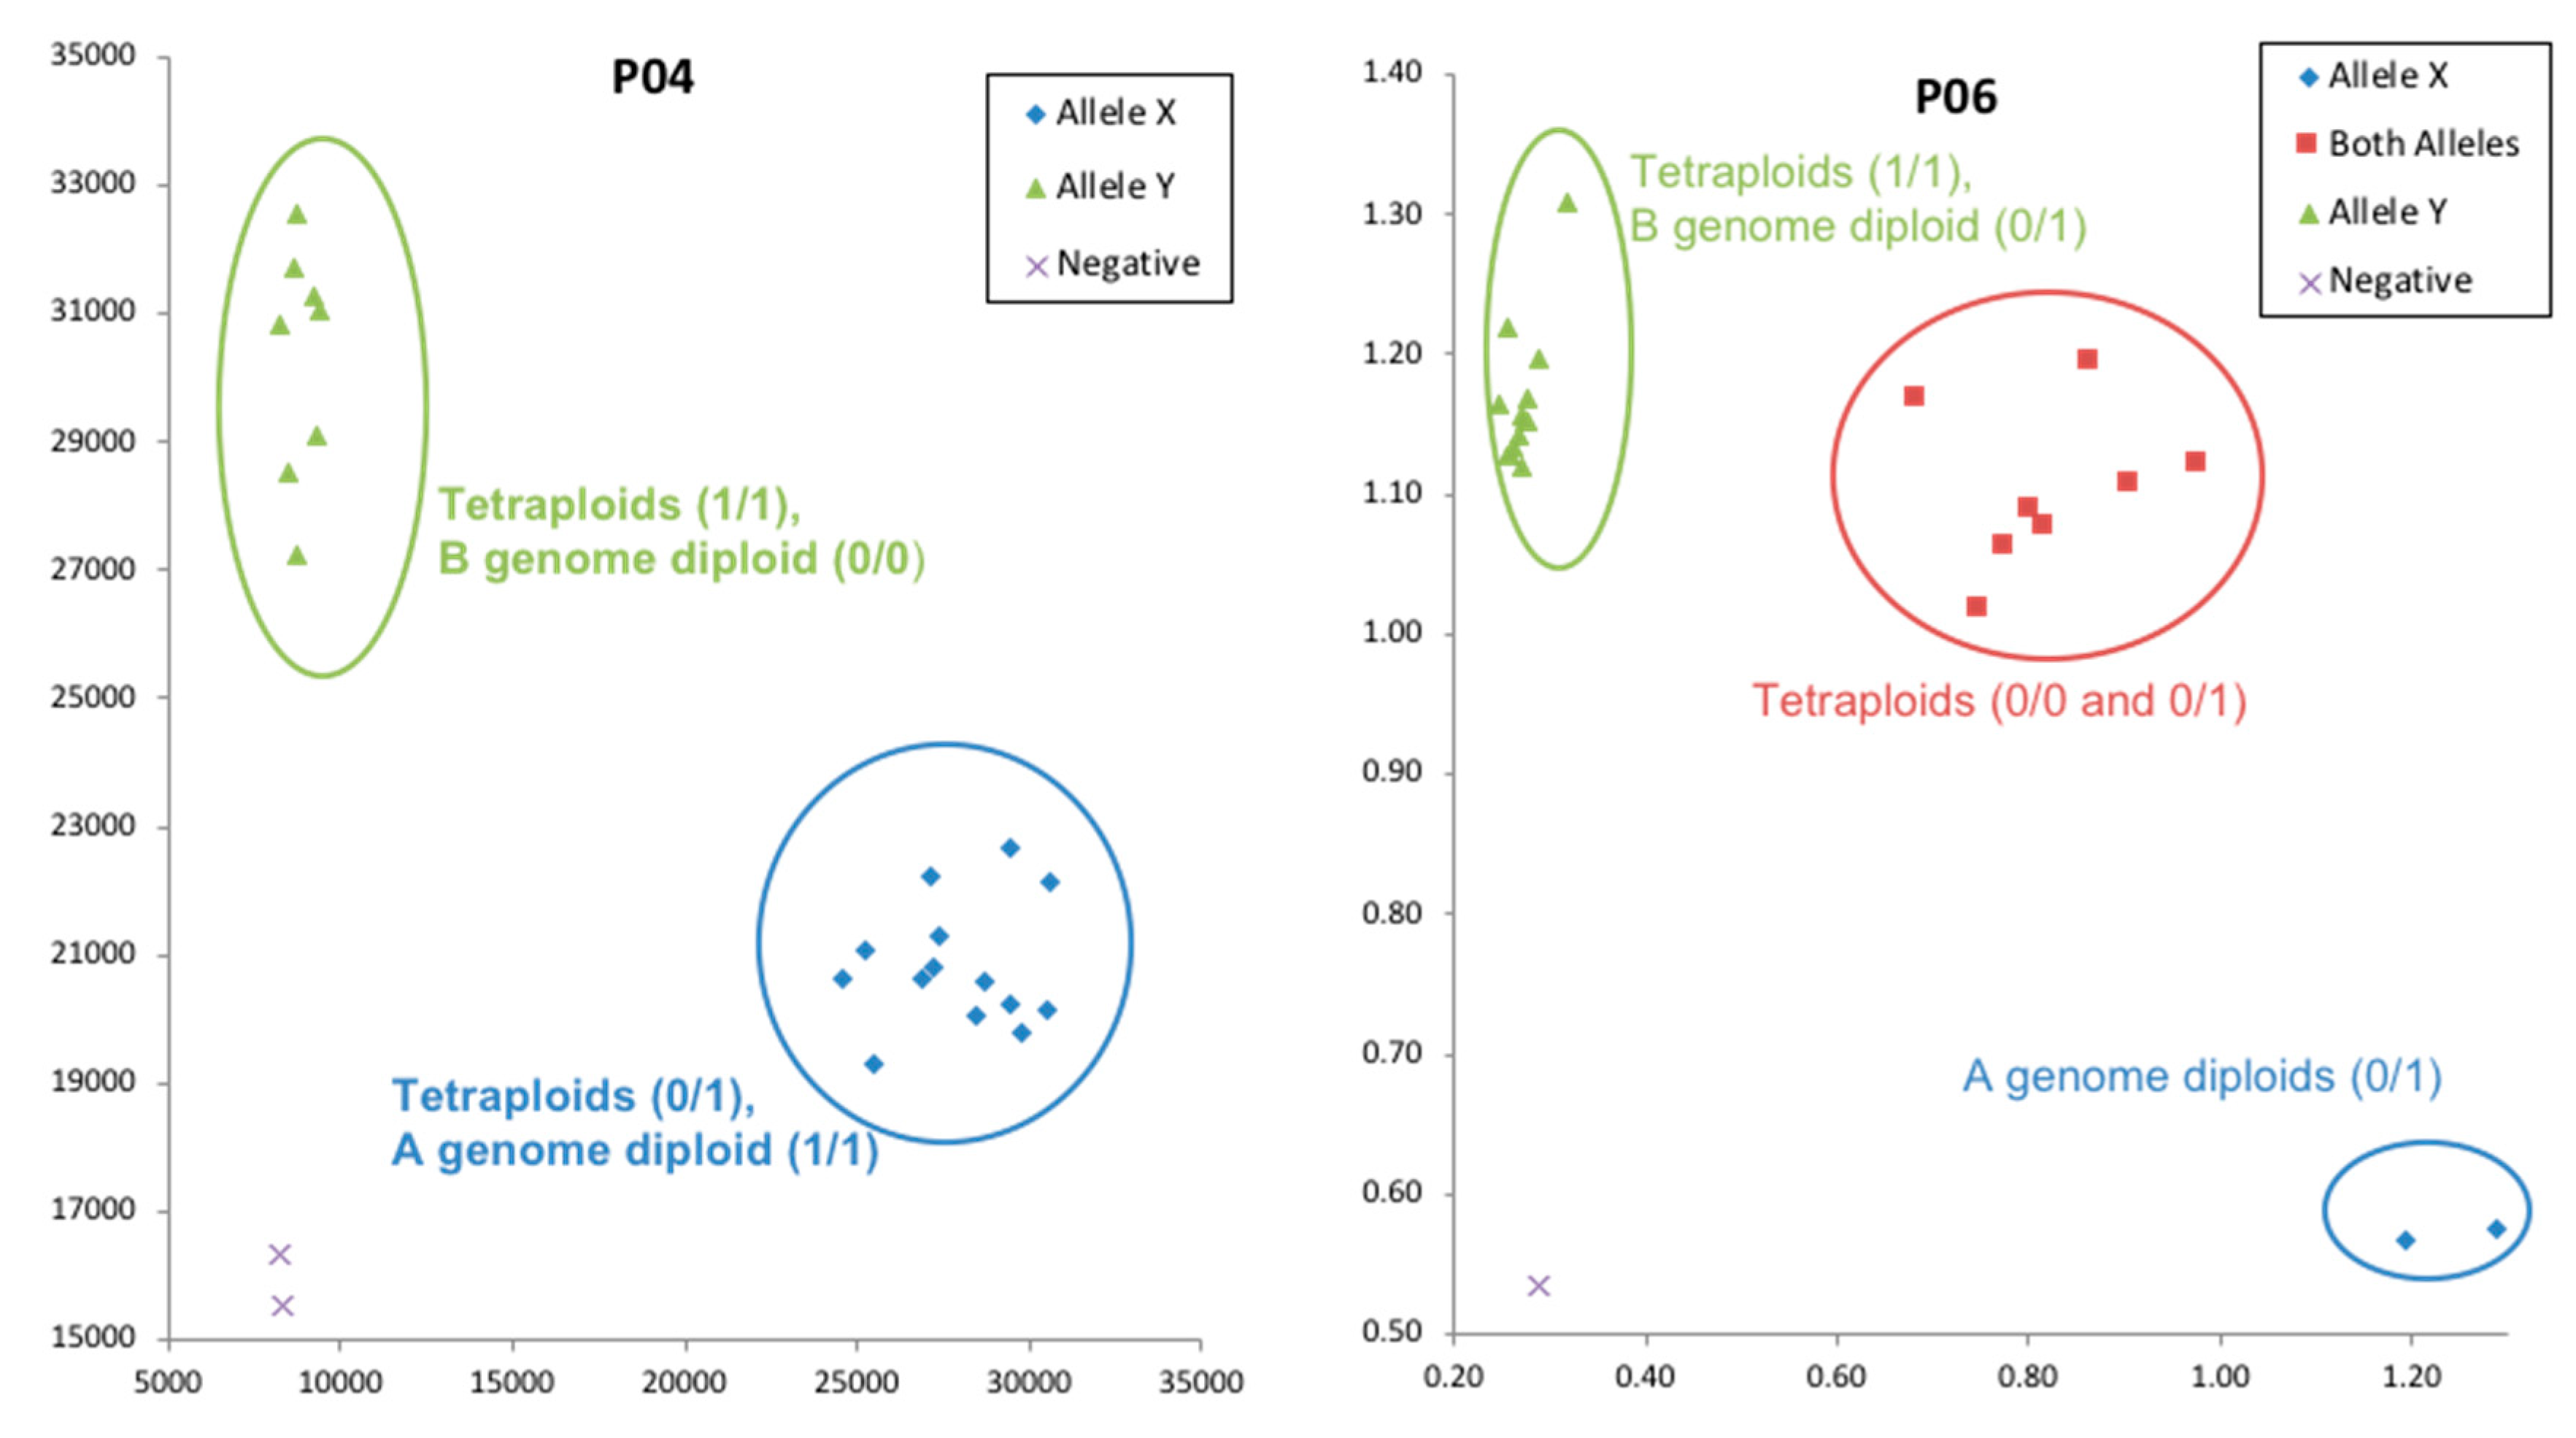
3.4. KASP Validation
SNP calls obtained from the KASP validation experiment for eight selected targets for 24 genotypes were compared with SNP calls from resequencing for further validation. One targeted was monomorphic according to the KASP assay, while for the other seven targets, 86% of the SNP clusters from the KASP assay matched the SNP calls obtained from resequencing (
Table 6). An example of KASP validation for two primers is shown in
Figure 3.
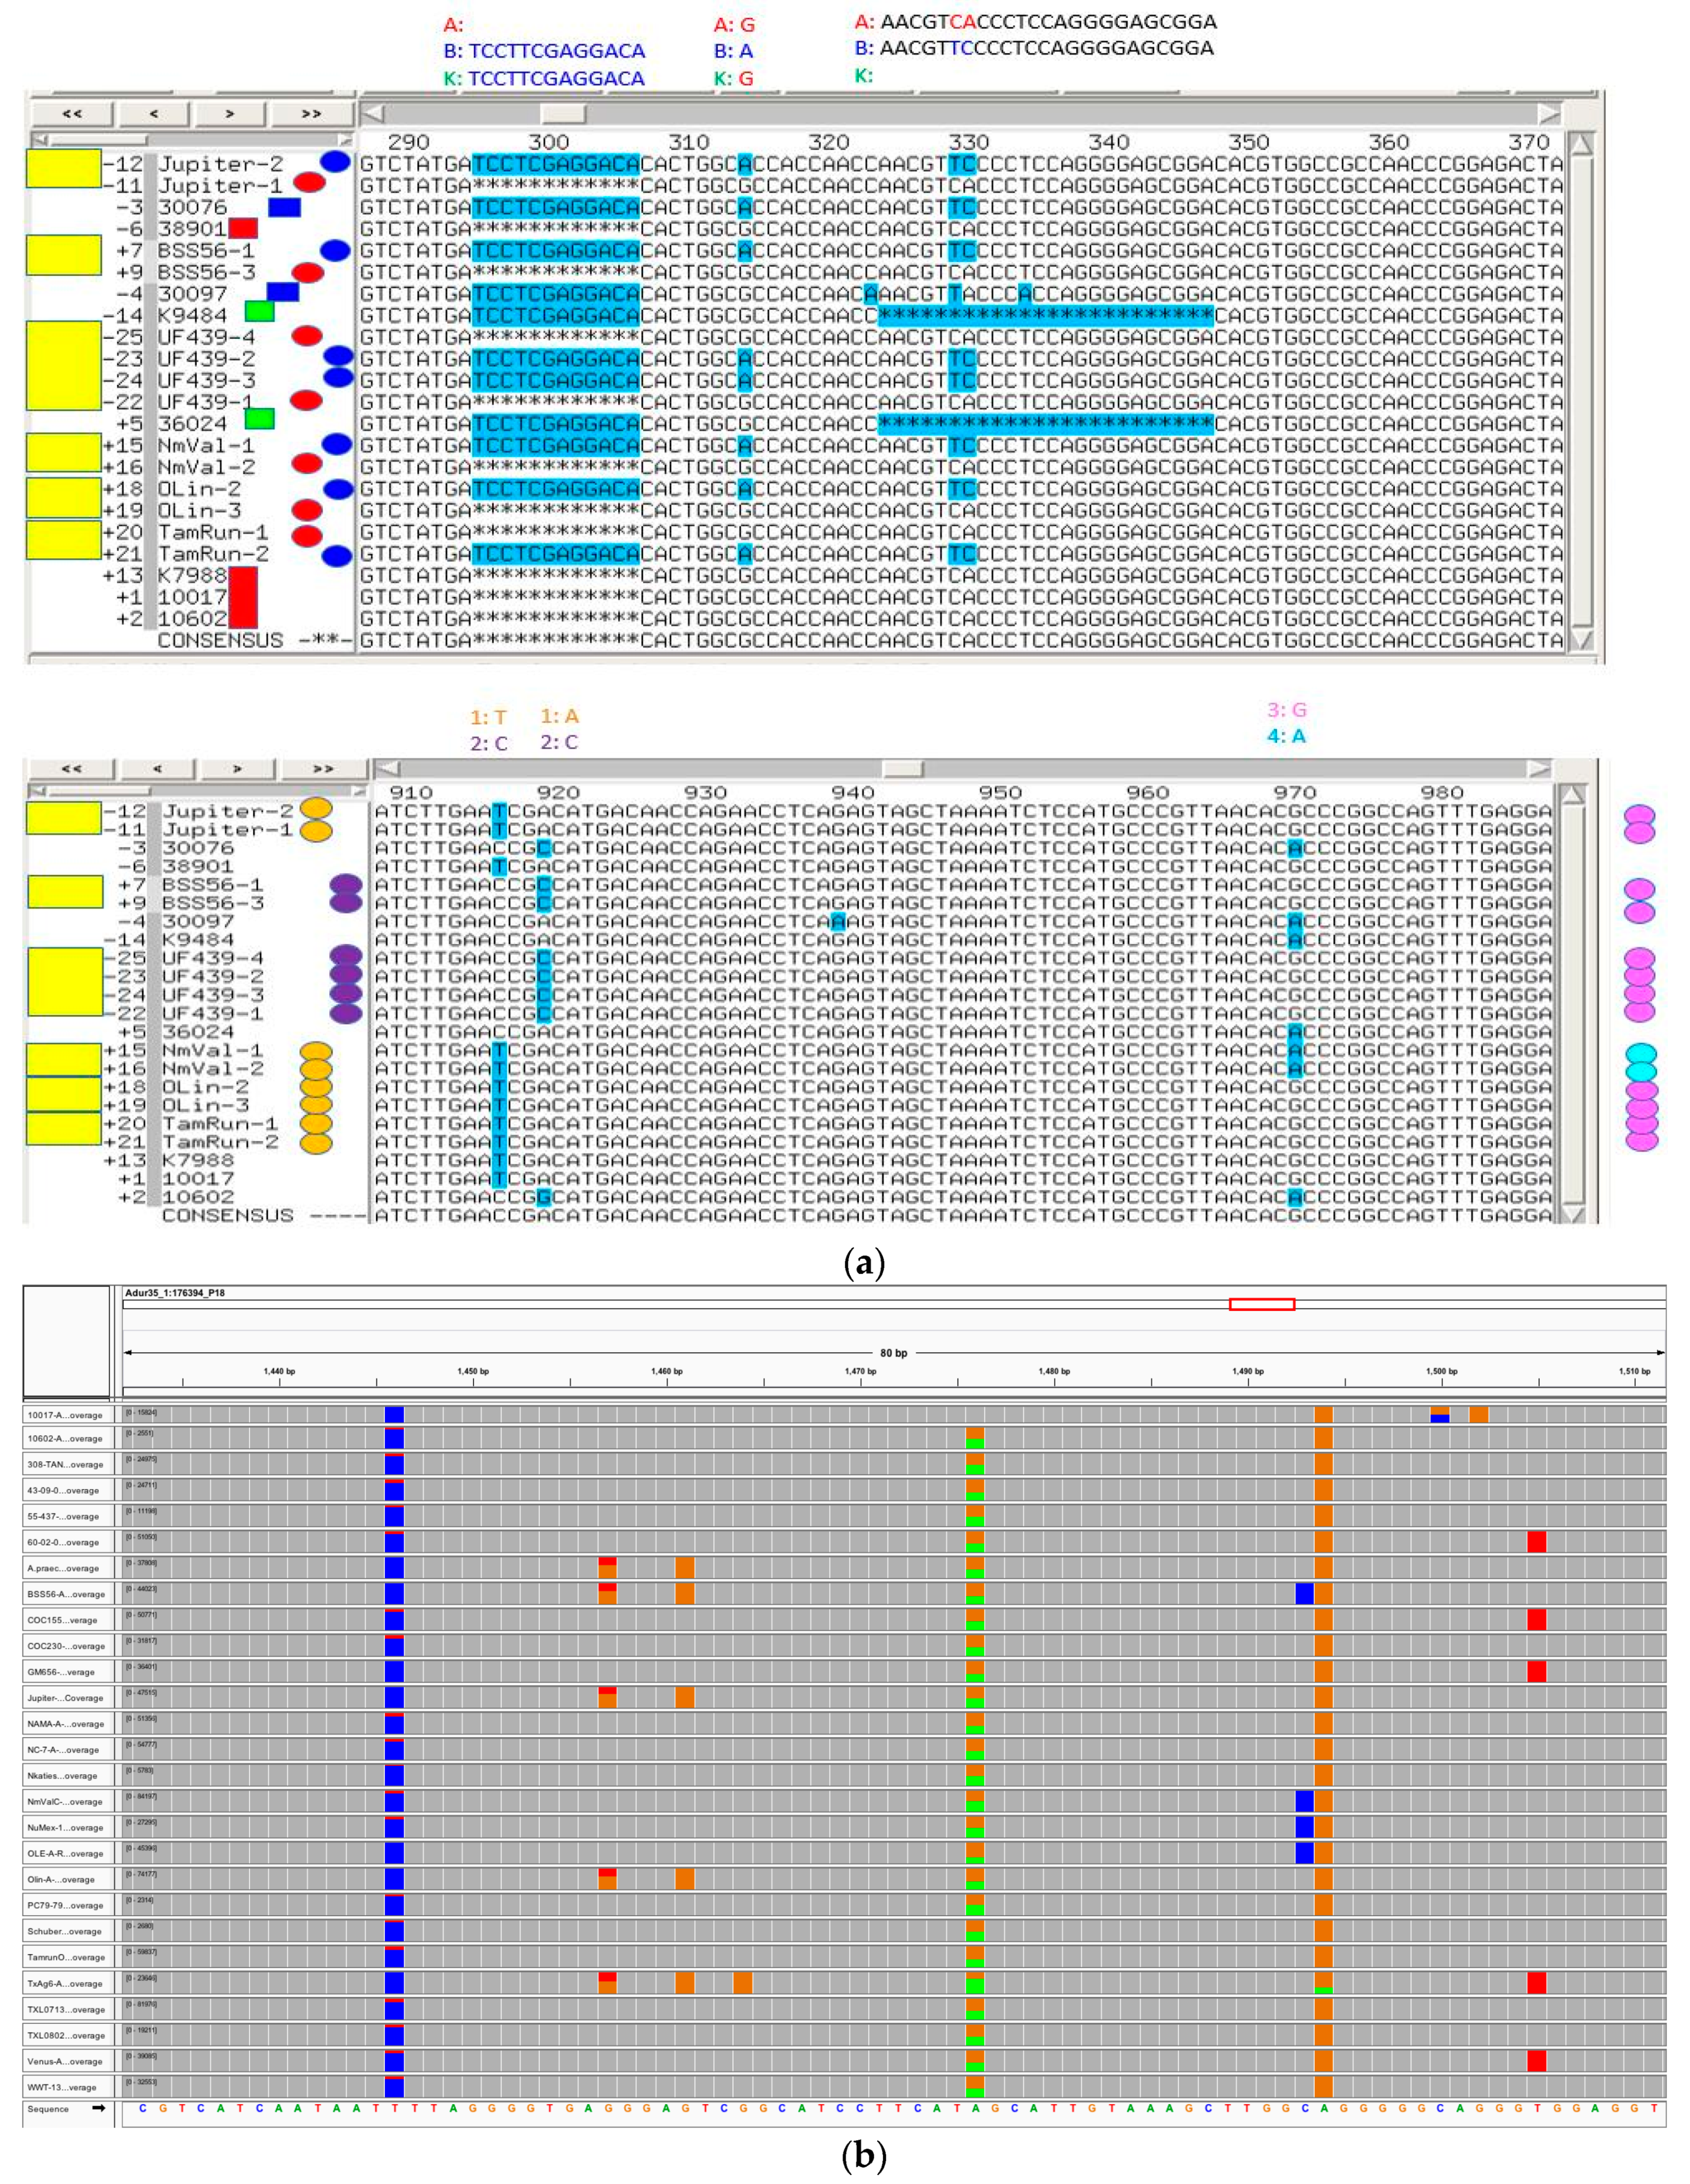
A principal components analysis plot using TASSEL 5.0 [
31] demonstrated a clear separation of clusters between A-genome and B-genome diploid accessions. Tetraploid accessions clustered out separately based on the botanical types hypogaea and fastigiata as expected (
Supplementary Figure S2). Homoeologous SNPs in tetraploids could be differentiated by aligning tetraploid sequences with A genome and B genome diploid sequences and viewing in Integrative Genome Browser (IGV) (
Figure 4).
3.5. Sequencing Cost
Depending on the time and method of analysis, prices were at times competitive vs. RADSeq or the peanut Axiom_Array SNP chip [
18]. From 2016 to 2018, prices for RAD-Seq were
$50/sample at the Texas A&M AgriLife Bioinformatics and Genomics Center, and the same price was indicated for the Axiom_Array SNP chip. Using the 2012 version of the Fluidigm manual and third-party prices, the per plant accession cost of running a 48-sample chip was
$28.75 (
Table 7). The cost was substantially higher,
$77.60, if all reagents and primers were purchased from Fluidigm using the 2016 kit; the greatest difference was in the cost of the primers −45% of the total cost was for purchase of the primers. By contrast, cost of running the samples on 384-well plates using all generic components was estimated as
$17.72 per sample.
For an experiment involving 384 plant samples and 960 amplicon targets, costs were approximately 20% lower per sample, with prices as low as
$23.64/sample (2012 kit) for the Access Array and
$14.08 using all generic components (
Table 8).
Comparing to other means of analysis, prices per sample for resequencing ($28.75) were lower using the 2012 instructions than the prices for RADSeq and the SNP chip in the 2016–2018 time frame. Since then, the prices for the latter two have dropped to $28/sample for RADSeq and the Axiom_Array2 chip. The Fluidigm prices chemistry changed in 2016 to allow higher multiplexing, but the newer protocol dropped instructions on primer design from third parties; the revised prices at $66/sample are higher than other means of analysis. However, we have estimated that running the analysis using generic components in 384-well plates can be as low as $14/sample, half the cost of other analyses, but less convenient than using the Access Array.
The current experiment was designed as a proof of concept, to test resequencing in peanut, and also to determine whether it could provide a lower cost method of genotyping, at a marker density lower than high throughput methods, but sufficient for QTL analysis and marker-assisted selection. Ultimately, a price point of $5/sample would be ideal for breeding programs. The current work suggests that we do not have the ability to perform this at that price; however, it may be possible to drop the price by 50% compared to other methods. This would still be useful. The major costs of such an approach are primer synthesis and sequencing. Lower primer costs are possible; they have been estimated at the 500pmol scale and $0.10/base. Smaller-scale syntheses could reduce costs by 75% at 10 pmol to 50 pmol scales, but the volumes needed for PCR reactions in 384-well plates would not make it possible to synthesize sufficient primer amounts without miniaturization to use the IFCs; however, the costs of the IFCs is greater than the cost savings that could be realized. Throughput of newer sequencers is higher, but the higher cost per run offsets much of the advantage.
4. Discussion
The re-sequencing effort with three approaches, GATK, SWEEP and SNP chip, was successful, with 81% of the targets for the diploids and 68% of the targets for tetraploids being found polymorphic by resequencing (
Table 4). However, a much lower percentage of targets selected using the OLin tetraploid transcriptome reference could be validated. Although the sequences were aligned against the older genome sequence assembly (March 2014), they were validated based on the newer version of the genome assembly (February 2016). The difference in the versions of the reference sequences might be the reason for the inconsistent mapping of the OLin based targets, or lower completeness of the transcriptome identification assembly may be responsible. This suggests that the use of a genome sequence reference is essential for accurate SNP target selection. KASP assays were designed for some of the targets from targeted resequencing as a validation of results. In general, most but not all of the SNP call patterns from KASP assays agreed with the SNP calls obtained from MiSeq.
Three potential difficulties could explain the low (68%) agreement between resequencing and the initial transcriptome sequence results. The first is that SNPs from the GATK, SWEEP and OLin methods were developed from a transcriptome sequence. Some of the SNP targets may have been spurious, a result of lack of expression of some genes; when resequencing or KASP assays were performed, the genotyping was based on genomic DNA and not RNA expression. However, SNP targets selected from the SNP chip, identified by whole genome sequencing, were not more accurate. A second possible explanation is polyploidy; indeed, difficulty in tetraploid SNP validation has been reported before [
6]. Lack of success in validating tetraploid SNPs could possibly be due to difficulty in resolving A and B homoeologs. For most of the heterozygous SNP calls, 0/1 scores were obtained, but it was not always possible to assign the 0/0 or 1/1 score to a particular genome. This issue might be due to several reasons: firstly, BWA aligner is not designed to handle tetraploid alignments, and the targets chosen for SNP validation from both the sub-genomes differed only by 4–5 nucleotides [
32,
33,
34]. Homoeolog sequence differentiation is difficult due to such minimal differences. Thirdly, sequence homology was assumed from BLAST results based on diploid genome sequences. The presence of paralogs and other copies that may be present in the diploid and tetraploid genomes may shift the mapping of sequences from expected targets [
13].
4.1. Source of Superfluous Heterozygote Calls
Variant call files (vcf) of sequences from analysis of MiSeq data had heterozygous SNP calls with means of 11.1% for diploids and 7.5% for tetraploids. These were too low to be likely for any given locus, as 50%, called heterozygosity, is expected for a true diploid heterozygote, or for a pair of tetraploid homoeologs wherein the allele calls for A and B genomes were different but each was homozygous. The observed mean values are too high for the set of targets overall as the peanut accessions are considered to be self-pollinated lines. Diploid accessions not only lack homoeologs, but many are incompatible with each other, and thus, could not be the products of recent hybridization.
Three reasons can be hypothesized for the apparent unexpectedly high proportions of heterozygous allele calls: (1) sequencing error, (2) inaccurate mapping to the A- or B-genome in tetraploids, resulting in overlap of homoeologs or (3) co-mapping of paralogs. Each of these possibilities was considered.
- (1)
Sequence data used a minimum quality (Q) score of 30, thus, an error rate of less than 0.1% might be expected, far less than the heterozygote percentage in the range of 7 to 11% that was observed. A study on MiSeq error profiling suggests that errors from MiSeq sequencing are not random and are more prone to G/A and A/C base substitutions, and there is an increase in sequencing error towards the end of the sequence [
35]. To estimate the error percentages from MiSeq data, error percentages for each base pair substitution from barcode regions of accessions OLin and Jupiter were calculated (
Supplementary Table S10). G/A substitution had the highest error rate (1.38%) followed by A/T substitution with an error rate of 0.84%. These estimates were substantially lower than the observed rate of heterozygous calls, and therefore, were not the major factor contributing to rate of heterozygous calls. Nevertheless, it was evidence that the reported quality values were overestimated.
- (2)
Even though we expect all A genome reads to map against the A genome part of the synthetic tetraploid reference, and all B genome reads to map against B genome part, there is little control over the alignment due to the fact of high similarity between the two genomes. Additionally, the BWA aligner used in this analysis is not a specialized tetraploid aligner and the power for BWA aligner to discern the few differences between the sub-genomes is unclear. However, even though homoeologous sequences were not completely resolved, they were distinguished to some extent by aligning these sequences against corresponding A and B genome diploid sequences (
Figure 4A). Arguing against incomplete resolution of homoelogs was that a high frequency of heterozygous SNP calls was observed among diploid accessions, where two genomes are not present. In the .vcf files, 3.3%, 9.0% and 21.2% heterozygous SNP calls were observed for
A. ipaënsis GKPSSc30076,
A. duranensis GKP10017 and
A. batizicoi K9484, respectively.
- (3)
Due to the highly-repetitive nature of the peanut genome, reads co-mapping to paralogous sequences could contribute towards apparent heterozygosity. To check the presence of paralogs, target primer sequences were compared against the A diploid genome using BLAST (
Supplementary Table S11). There were 183 putative paralogous matches present for 48 targets with an average of 3.81 possible paralogous matches per target. An example of a CLUSTAL alignment of a paralogous match for one of the targets is shown in
Supplementary Table S12.
If paralogs were a major contributing factor to apparent heterozygosity, the rate of heterozygous SNPs in the tetraploids would be expected to be similar to the average of the two diploid parents. An expected frequency of SNP heterozygous calls for UF439-16-10-3-2 could be estimated as 6.2%, and was observed to be 5.7%. Similarly, estimation of heterozygous calls of TxAG-6 (A. cardenasii GKP10017, A. diogoi GK10602 and A. batizicoi K9484) was 16.0%, while the observed rate for TxAG-6 was 24.4%.
4.2. Interpretation and Correction of Calls
Based on observation of the histograms (
Supplementary Figure S1), it was estimated that a range between 30% to 70% reference allele denoted true heterozygotes in diploids, or homozygous homoeologs for tetraploids. This was based on the presence in
A. duranensis,
A. diogoi and
A. batizicoi of peaks in the range of circa 40% to 65% heterozygosity. In addition, there were also peaks between 20% and 30% heterozygosity (
A. batizocoi) or between 70% and 80% heterozygosity (
A. duranensis,
A. diogoi, and
A. batizicoi). Peaks in these three ranges also occurred in the tetraploids TxAG-6 and UF439-16-10-3-2. These were explained as follows: In the case of diploids, a peak of 50% would indicate a true SNP in one gene. The expected percentage heterozygosity would be 50%. In cases of tetraploids, this range can be considered to correspond to cases of a homozygous SNP distinguishing A- and B-genome homoeologs of that accession. In the case of a heterozygous SNP in one genome while the homoeologous allele was homozygous, 25% or 75% would be called heterozygous. In the case of two paralogous genes present, an SNP in one would result in a peak at 25% or 75% assuming equal representations of both genome sequences. This would correspond to the peaks observed in the 20% to 30% range and in the 70% to 80% range for the tetraploids. For diploids, this could represent presence of two paralogs, one homozygous and the other heterozygous and sharing one target nucleotide identical with the homozygous paralog.
The original SNP call dataset was divided into three sub-datasets using cutoff values of 25%, 20% and 15% correction for the minor allele using python scripts. If the percentage of heterozygotes in the minor allele was less than the cutoff value, the minor allele was rescored as a homozygote instead of the heterozygote. We observed validation values of 85.4%, 85.7% and 80.5%, respectively, for 25%, 20% and 15% cutoff-corrected SNP calls. With less correction (15% cutoff), there was a lower validation rate, but the 20% cutoff would allow for identification of true heterozygotes in tetraploids while not reducing the validation rate. This correction reduced an average of heterozygous SNP calls to 0.18% from the initial 8.5% (
Supplementary Table S1). Minor allele frequencies, less than 20%, were deemed to result from a combination of the presence of either two paralogous sequences containing the target region sequence but one present at a higher frequency, or possibly three or more paralogous sequences. Additional contributing factors could include the higher-than-expected sequencing error rate, and/or misidentification of homoeologous sequences. There are several instances where the distortions in the SNP calls are reported in tetraploids and previous reports using other marker types have likewise reported segregation distortion in tetraploid peanut [
6,
36]. Peace et al. [
37] reported the presence of heterozygous SNPs and the inability to resolve the dosage between the sub-genomes in sweet cherries.
In addition to scoring targeted SNPs, sequencing also identified some non-targeted SNPs present in the surrounding regions. In the case of accessions of
A. hypogaea, these were approximately double the number of the targeted SNPs validated; for the diploids, the numbers were much higher. Such SNPs may be in linkage disequilibrium [
38] and may not provide any novel variant information. However, these SNPs can be used to identify conserved haplotypes or to distinguish A and B genomes.
Given that paralogs were found for 37 of 48 targets (
Supplementary Table S11), it is probably not possible to devise a complete set of highly-polymorphic targets without corresponding paralogs. However, selecting targets with relatively-few paralogs may be worthwhile. Additionally, more-accurate analysis of targeted resequencing may be achieved using the newly released tetraploid assembly [
14]. Moreover, a newer statistical approach involving likelihood-based methods is under development (Kulkarni et al., in preparation) [
39], and is expected to improve scoring accuracy. Together, an accurate automated pipeline for SNP calling can be developed.
5. Conclusions
The current experiment was designed as a proof of concept, using the Fluidigm Access Array for multiplexing, to demonstrate the possibility of resequencing in peanut, and also to determine whether it could provide a lower cost method of genotyping, at a marker density sufficient for initial QTL analysis and marker-assisted selection. Validation of results obtained from targeted resequencing suggests that targeted resequencing could be used for QTL mapping studies. For QTL identification, a set of 500 to 2000 highly-polymorphic SNPs can be selected that could potentially be used for any cultivated x cultivated cross. Amplification of targets from both sub-genomes simultaneously can effectively double the number of target loci, increasing the genomic information that can be extracted. Although a price point of $5–10/sample would be ideal for breeding programs, the current work suggests that it may be possible to drop the price by 50% compared to other methods (GBS, SNP chip). In addition, as much of the price of resequencing is the primer cost, once this is paid upfront, genotyping cost per sample drops by 50% to $7/sample thereafter. We believe such an approach can be readily adopted in many allopolyploid species. GBS or the SNP chip could be used subsequently for high-resolution mapping of the target region for genetic studies, if desired.

 ,
, 


