3.3. EIS Measurements: The Effect of Incision and Porous Electrode Behavior
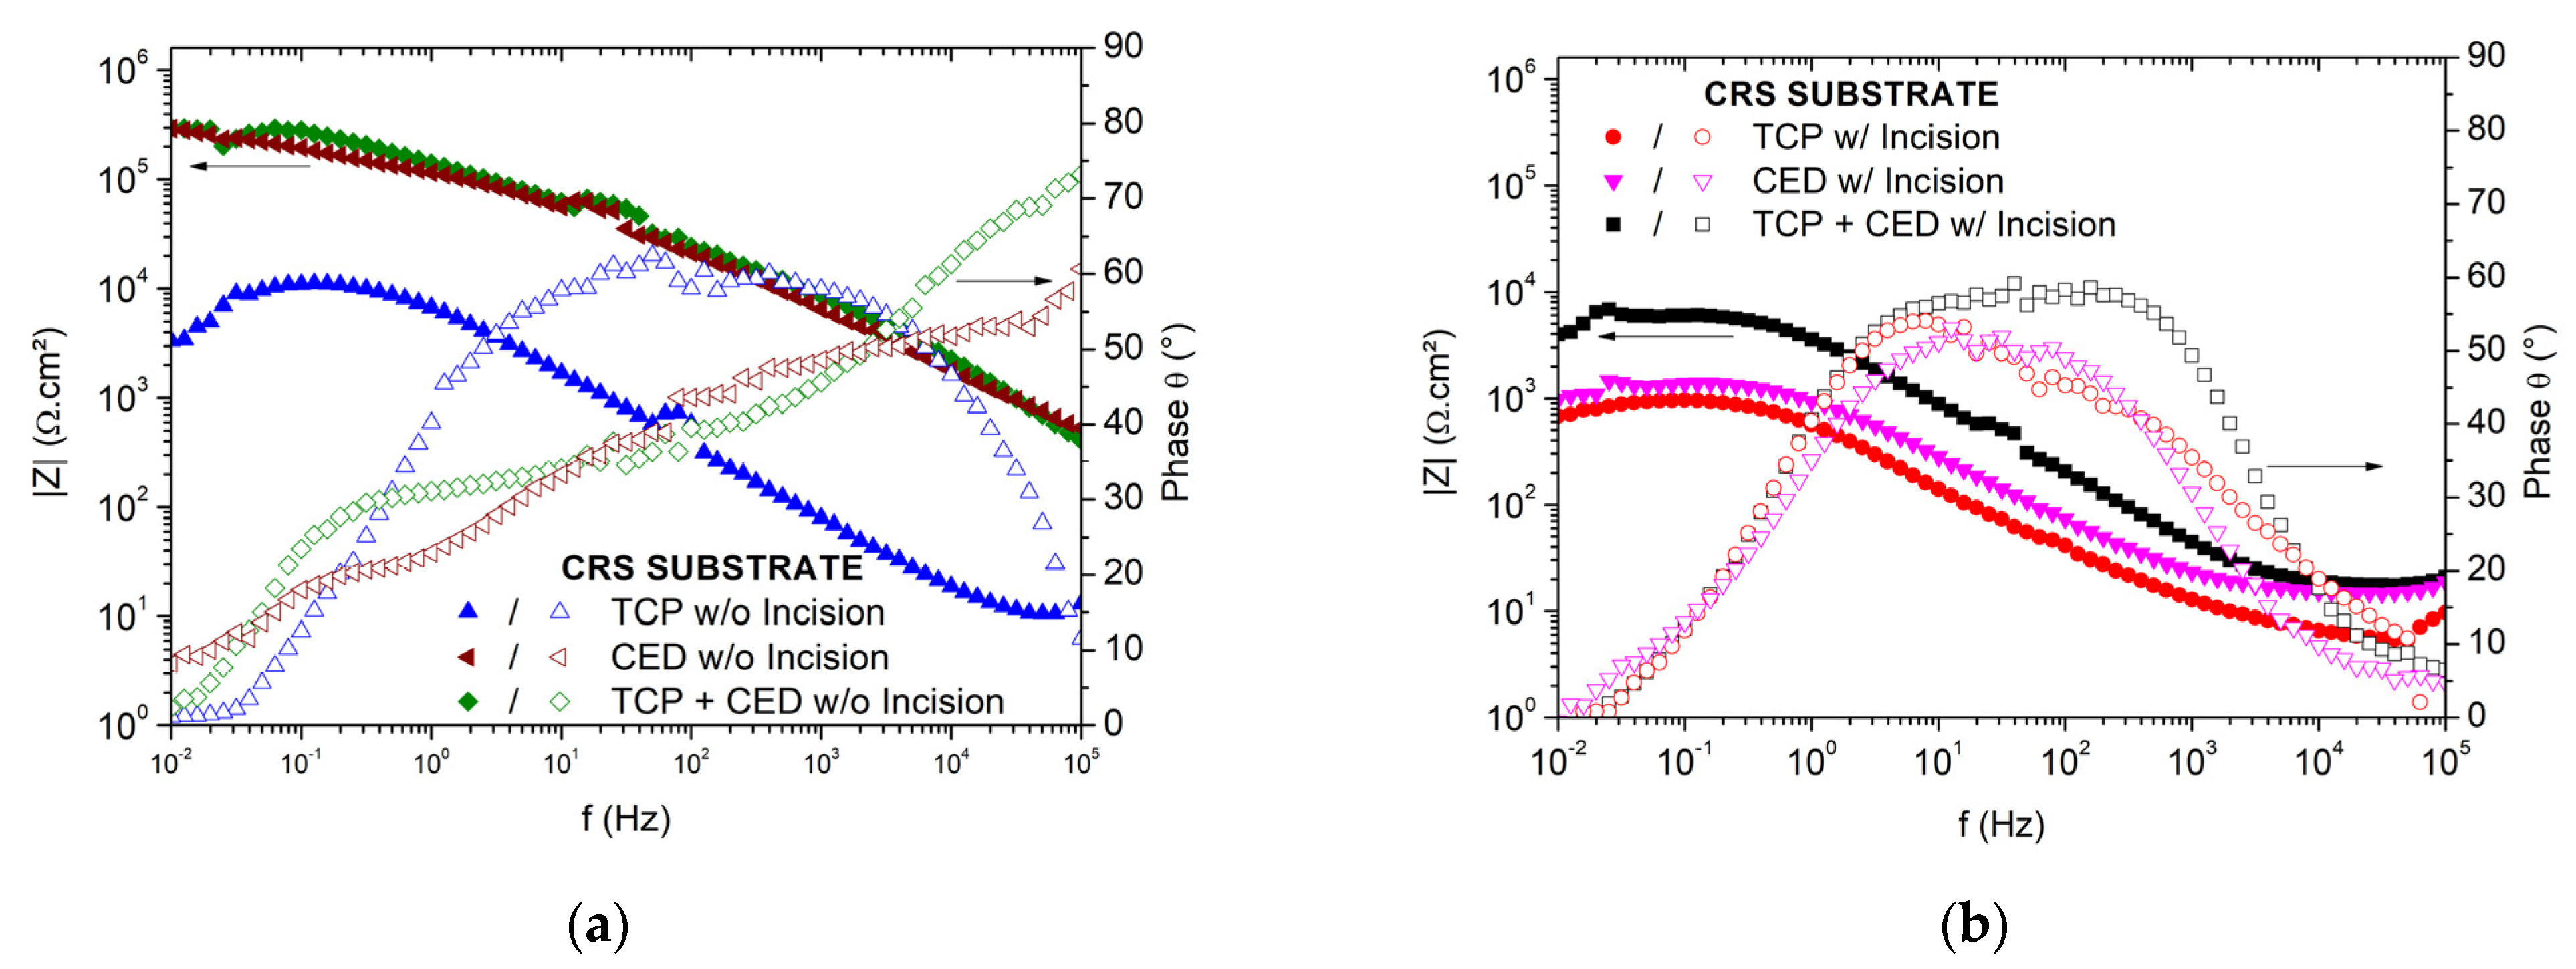
It is verified that three possible constant times prescribe the corrosion behavior of the examined samples without induced-damage. Two constant times help to understand the corrosion mechanism of those damaged samples (with incision). Based on this, a qualitative analysis of the Bode diagrams of those samples without (w/o) incisions and the samples with an incision (w/ Incision) provide important information, as shown in
Figure 4a,b, respectively. A first analysis shows that the TCP + CED and CED coating systems, which have three constant times, have distinctive phase angles at a high frequency domain when the induced-damage samples are compared. Both the TCP + CED and the CED coatings have a phase angle higher than 60°, while the TCP sample has a phase angle closer to zero. This is intimately associated with the porous characteristic of a typical TCP coating system [
10,
11,
12,
20,
21,
23,
24,
25].
It is important to differentiate between a porous material as constituted when a TCP layer is formed, and a porous electrode behavior. A porous structured material, when subjected or immersed into a corrosive medium, electrochemically provides a porous electrode behavior. Depending on the involved intermediate species and its evolution (transport and penetration/diffusion), a barrier protective oxide film can be formed, and corrosion is substantially reduced. On the other hand, when ions are transported and diffusion occurs, the corrosion is reinitiated, and a drastic and severe degradation takes control of the domain of the corrosion mechanism.
When the samples with and without incisions are compared, it is evidenced that, at the low frequency domain, the experimental moduli of impedances are decreased. Moreover, the kinetic of the double layer formation is slightly different to those samples without incisions (two and three constant times, as previously determined). Besides, Bode-phase plots reveal that all examined samples with incisions have at high frequency domain, and their corresponding phase angles are close to zero.
This is considerably distinctive when the CED and TCP + CED coating systems are analyzed. Similar observations were reported [
10,
19,
20] concerning the higher phase angle (at high frequency), favoring a sample with a preserved coating layer, and the substrate (more active material) is not immediately exposed to an electrolyte.
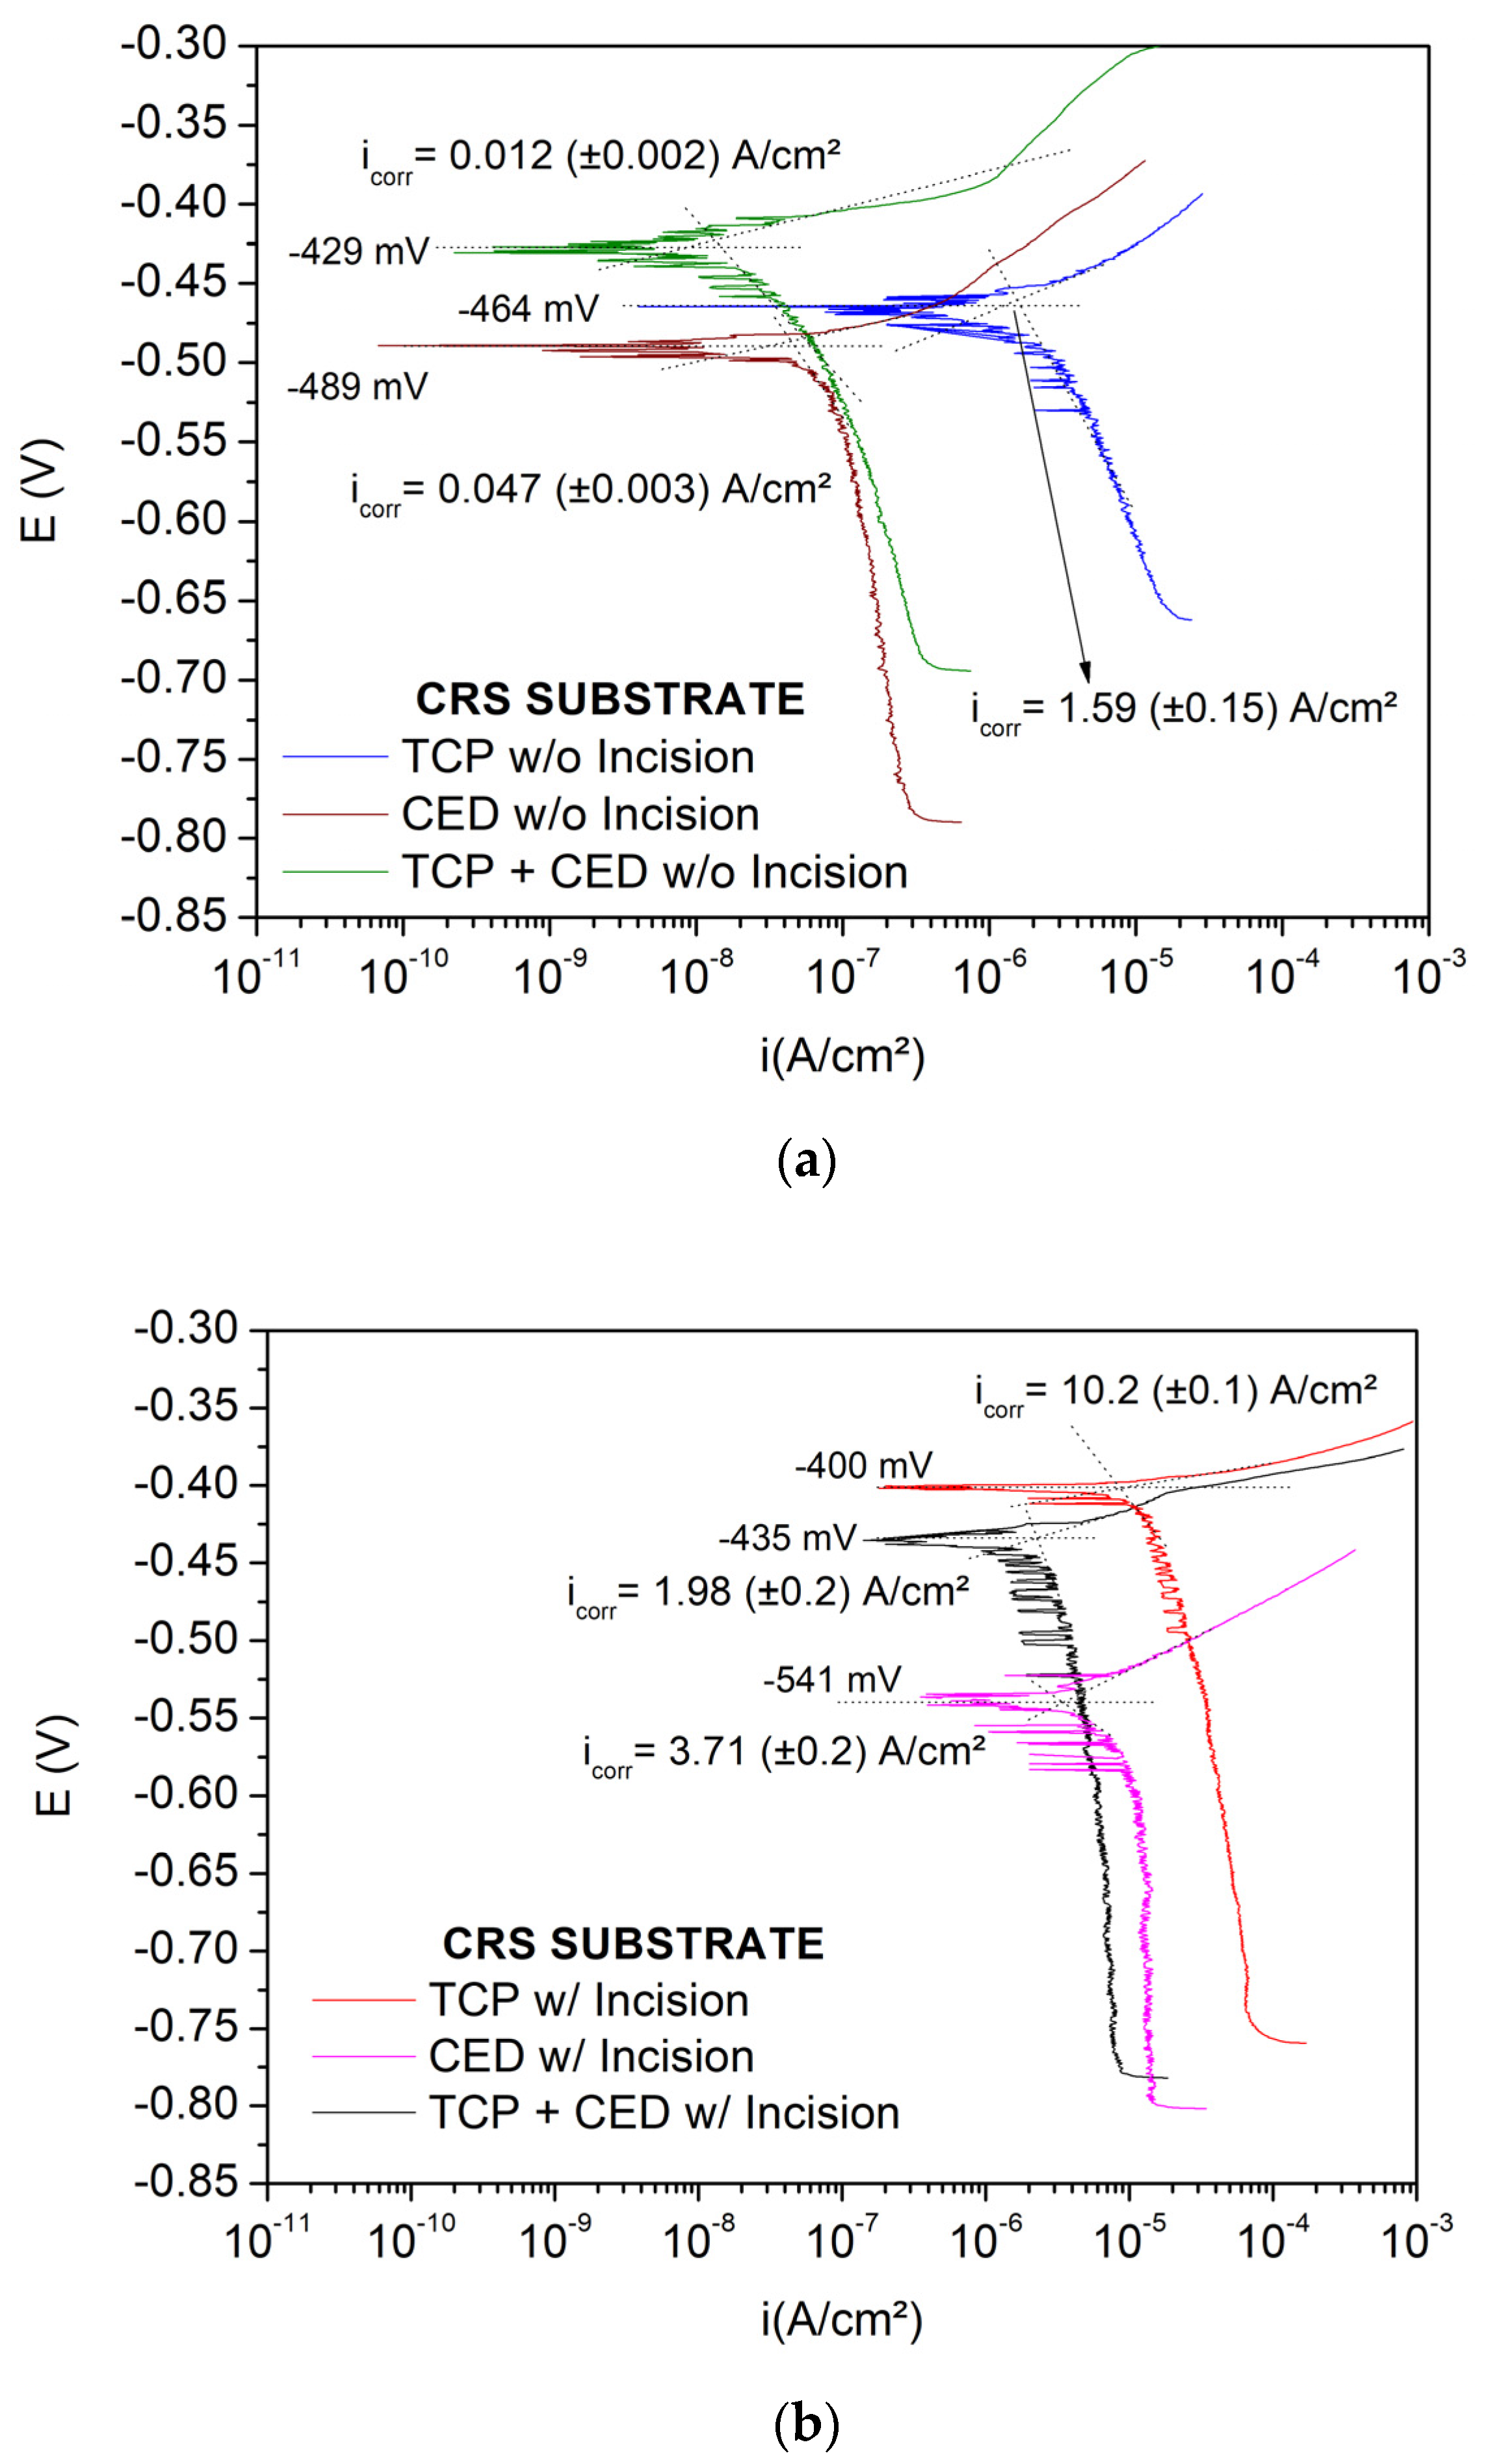
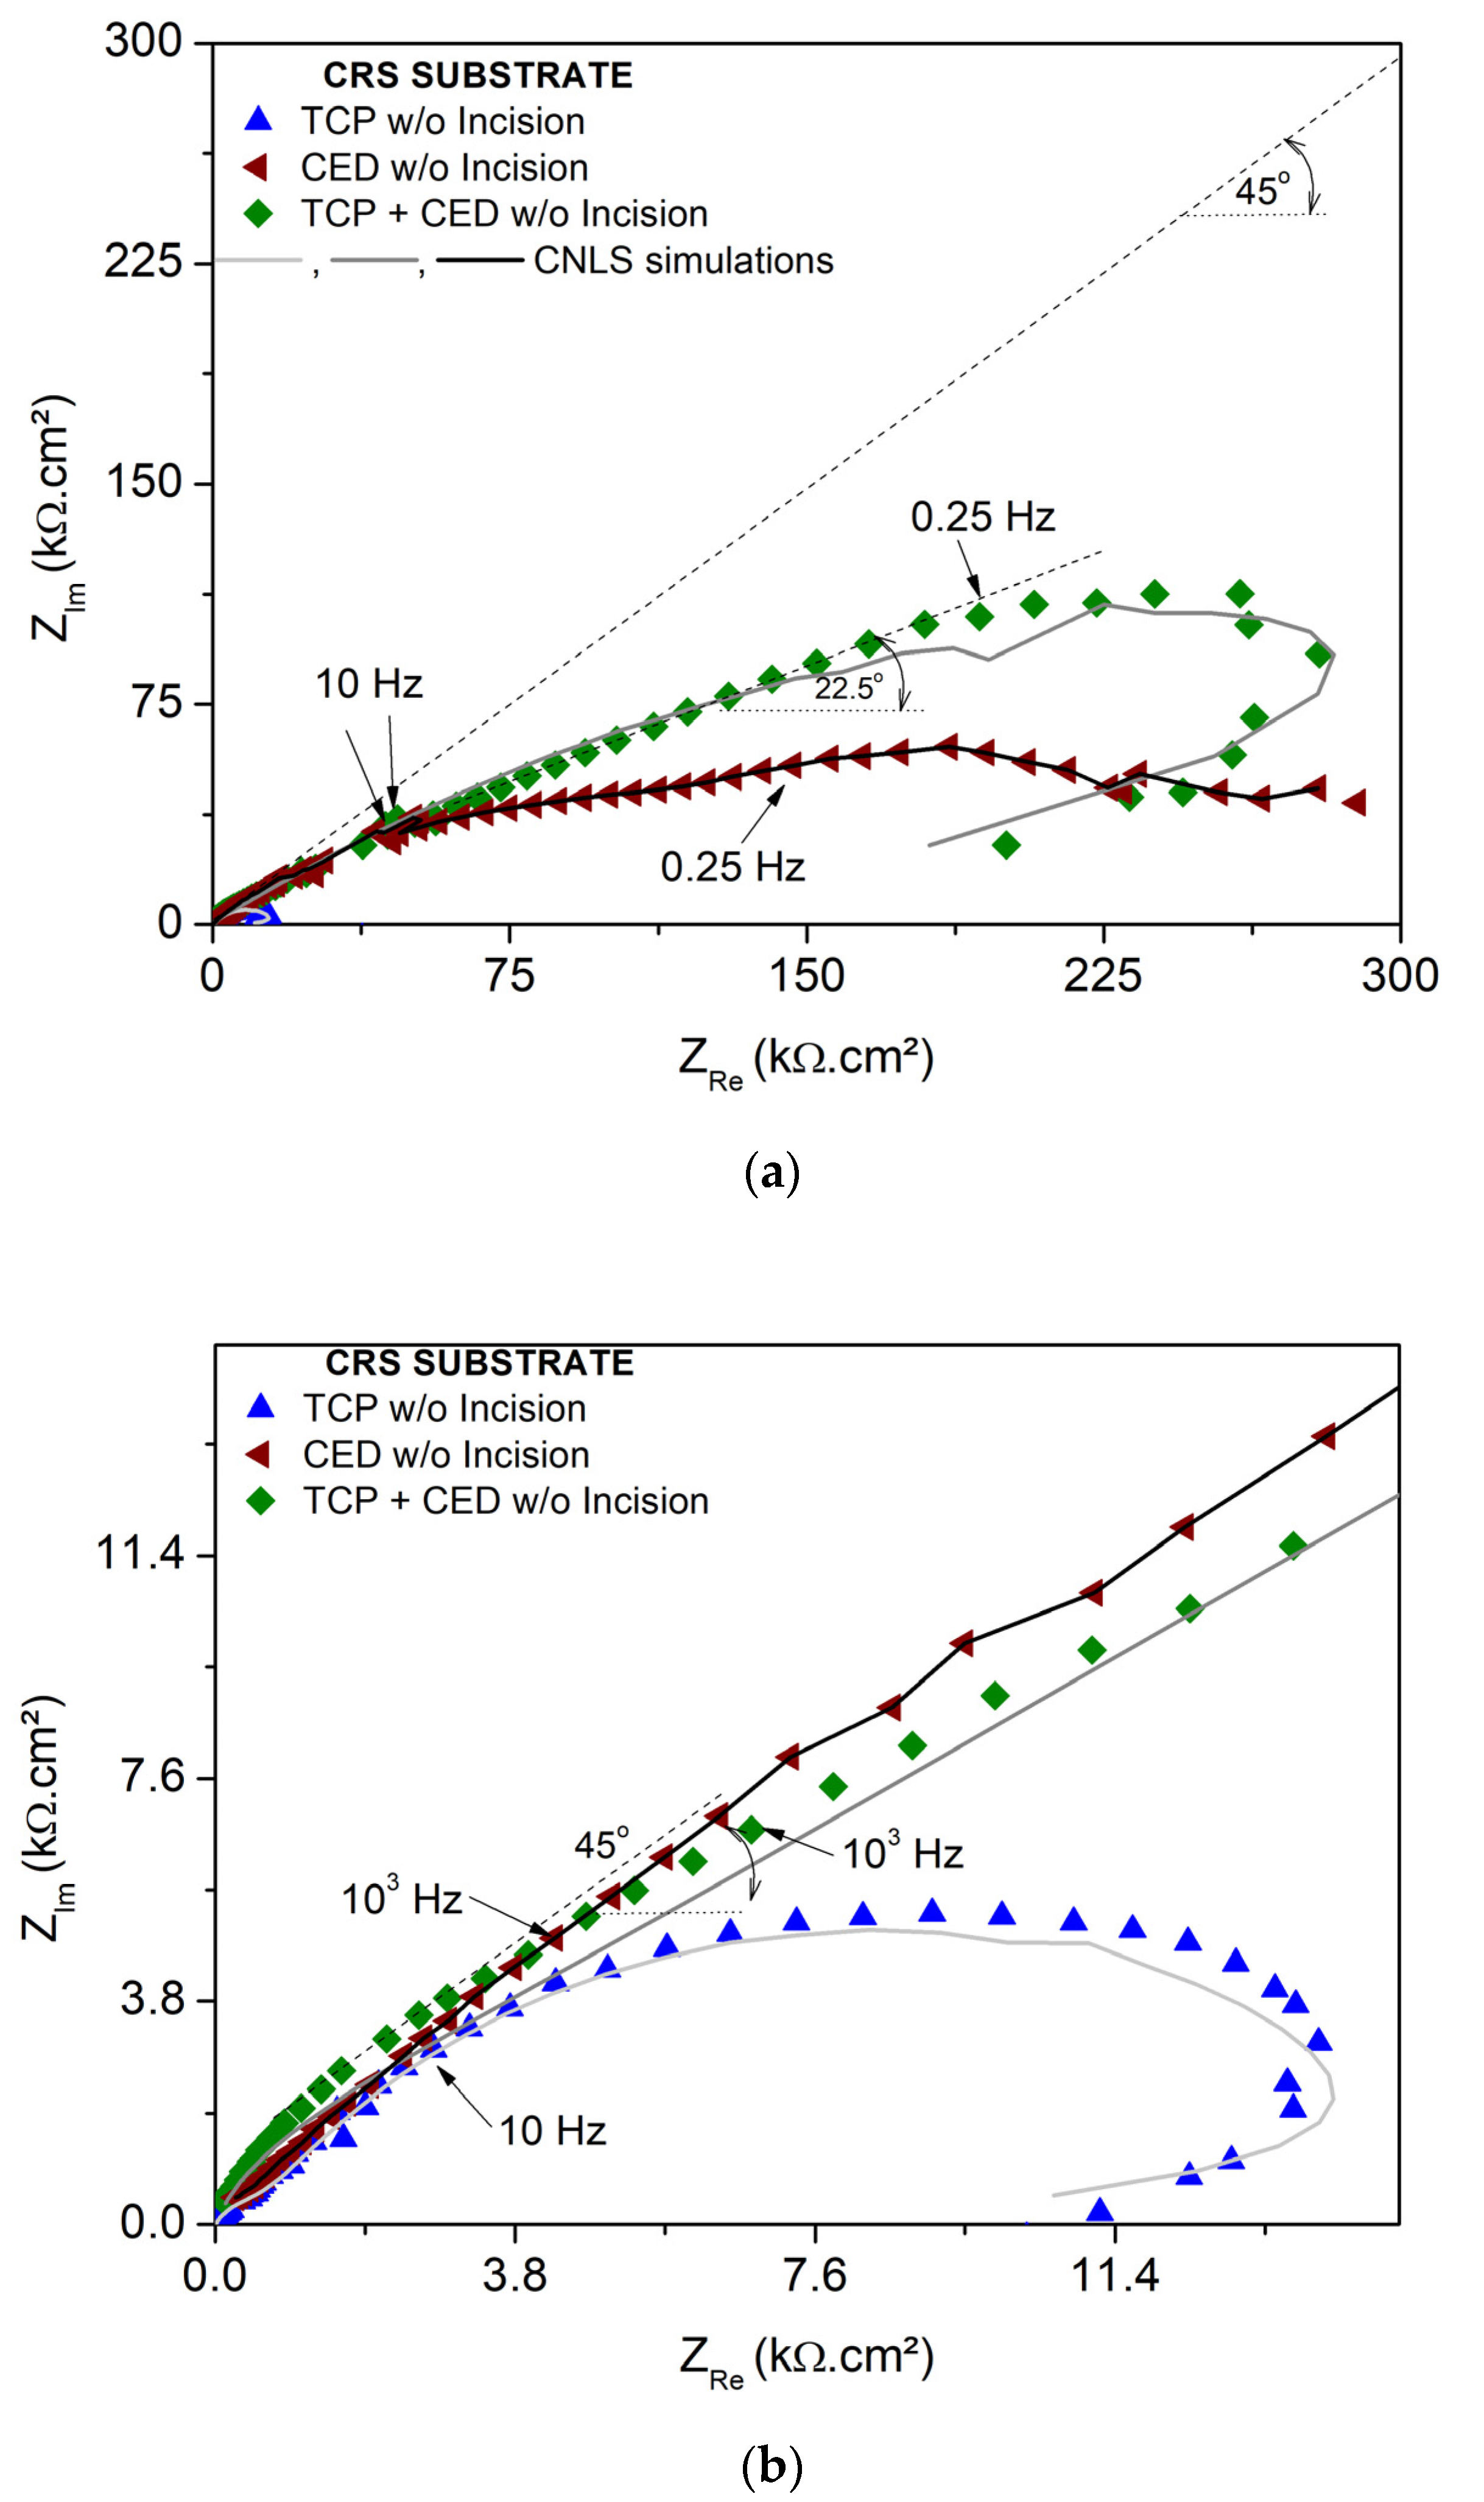
Based on these Bode and Bode-phase plots, considering a qualitative analysis, the same trend is verified in the potentiodynamic polarization curves, i.e., the worst corrosion behavior is that of the TCP, followed by only CED coating and finally, the best corrosion resistance is that of the sample containing the multi-coatings applied (CED on TCP and this on CRS substrate). Although these EIS plots have demonstrated the same corrosion tendency, its new contribution concerns the number of the constant time, which helps to predict the reactions that occur and the kinetic of the double layer formation. However, some other complementary information that is not provided can be achieved when Nyquist plots are evaluated/analyzed. In this sense, the resulting Nyquist plots of the examined TCP, CED, and TCP + CED coating systems without an incision are show in
Figure 5.
Figure 5a depicts the depressed semi arcs with corresponding CNLS simulations, as will be discussed further on. The same results of Nyquist plots in the lower scale range of both Z imaginary (Z
Im) and Z real (Z
Re) are shown in
Figure 5b. With this, the substantial difference in the magnitude of the semi arcs corresponding with the TCP + CED and CED samples and compared with the lowest semi arc of the TCP coating sample, can be observed. Additionally, at a high frequency, the domain ranges up to about 10 Hz, and the straight lines forming 45° are characterized. Between 10 Hz and ~0.25 Hz, the TCP + CED samples trend to form 22.5°, which seems to correspond with transport and diffusional phenomena. Above ~0.25 Hz to the lower frequency domain range, a distorted capacitive arc seems to be associated with finite or semi-infinite pores and with Warburg behavior, as reported by Macdonald [
37], Bastidas [
35] and Murray [
36].
With these observations, it was induced that both the planar and porous electrode behaviors are responsible for predicting the corrosion resistances of all the samples examined. It is remembered that a porous electrode behavior is described by Equation (1):
where R
0 and Z
0 are the electrolyte resistance (Ω/cm) and the interfacial impedance for one-unit length, and L means the length of each pore in cm [
35,
36,
37]. When the angle with the Z
Re tends to 45°, L tends to a semi-infinite condition, and the
coth term reaches 1. This indicates that Warburg impedance is half of that reached by a flat electrode [
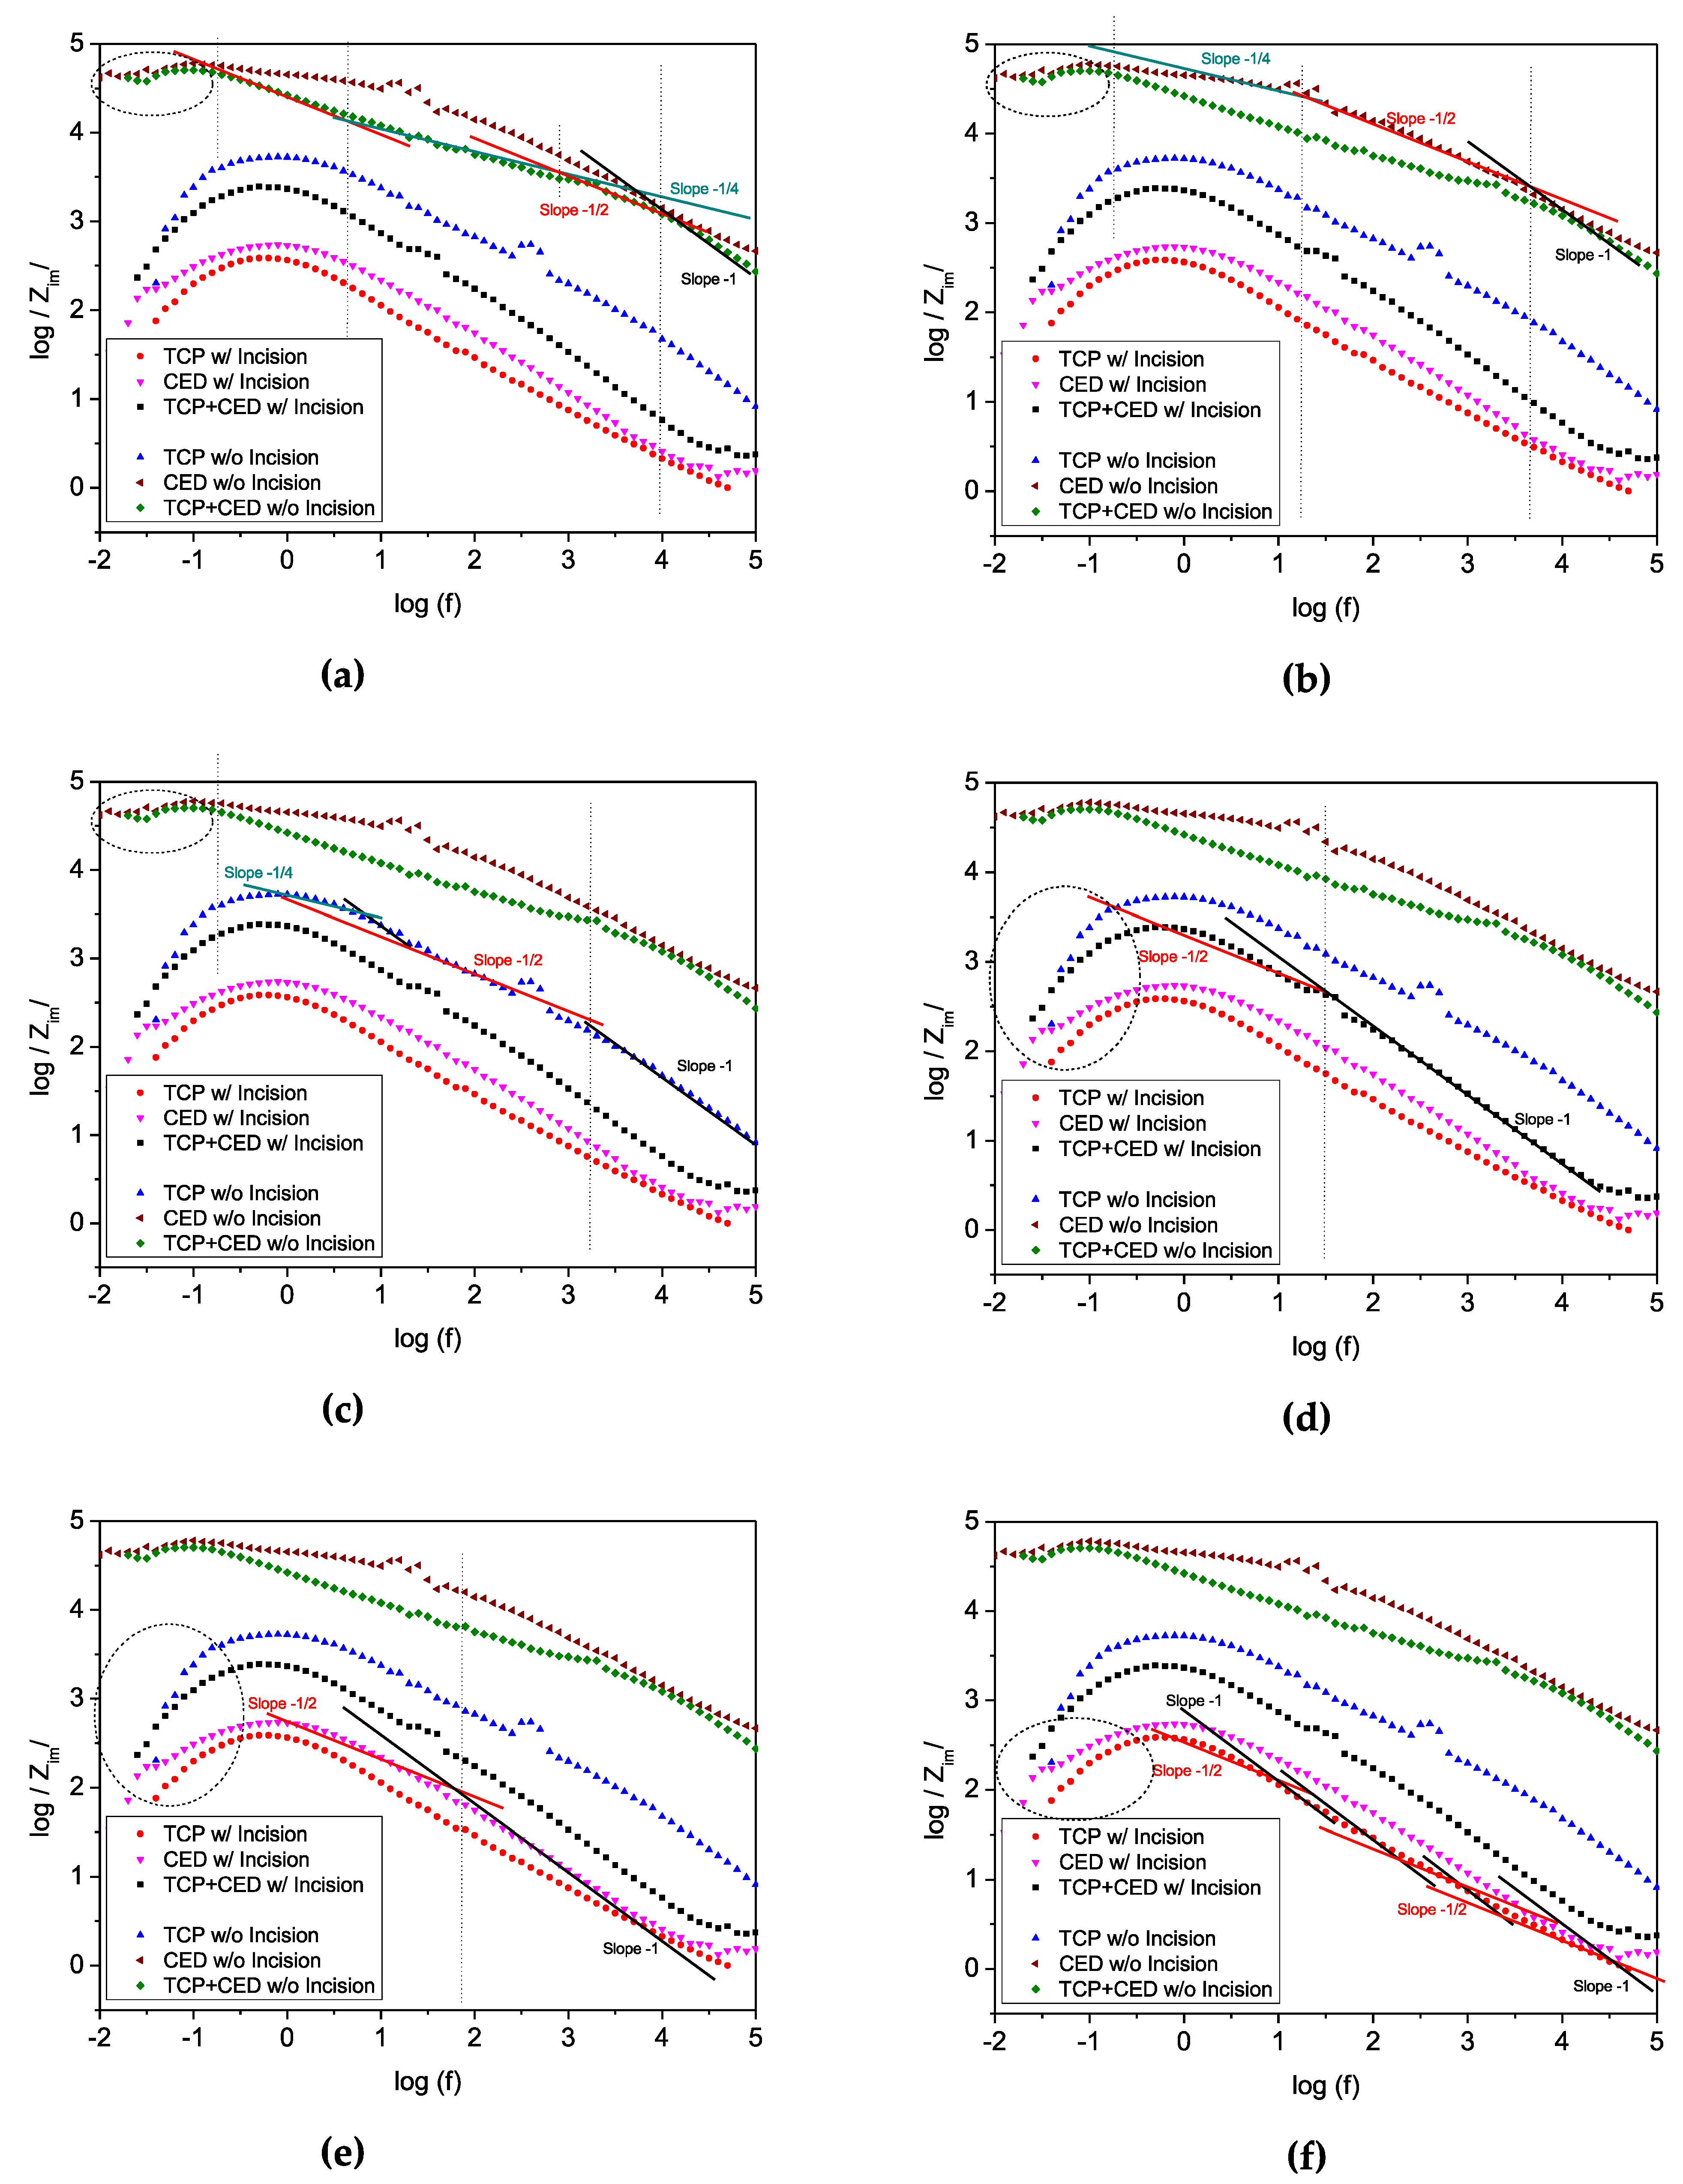
35,
36,
37]. This can also be associated with those verified slopes of −1/2, −1/4 and −1/8, when the modulus of imaginary impedance parts with frequency was shown in
Figure 2 (constant of time).
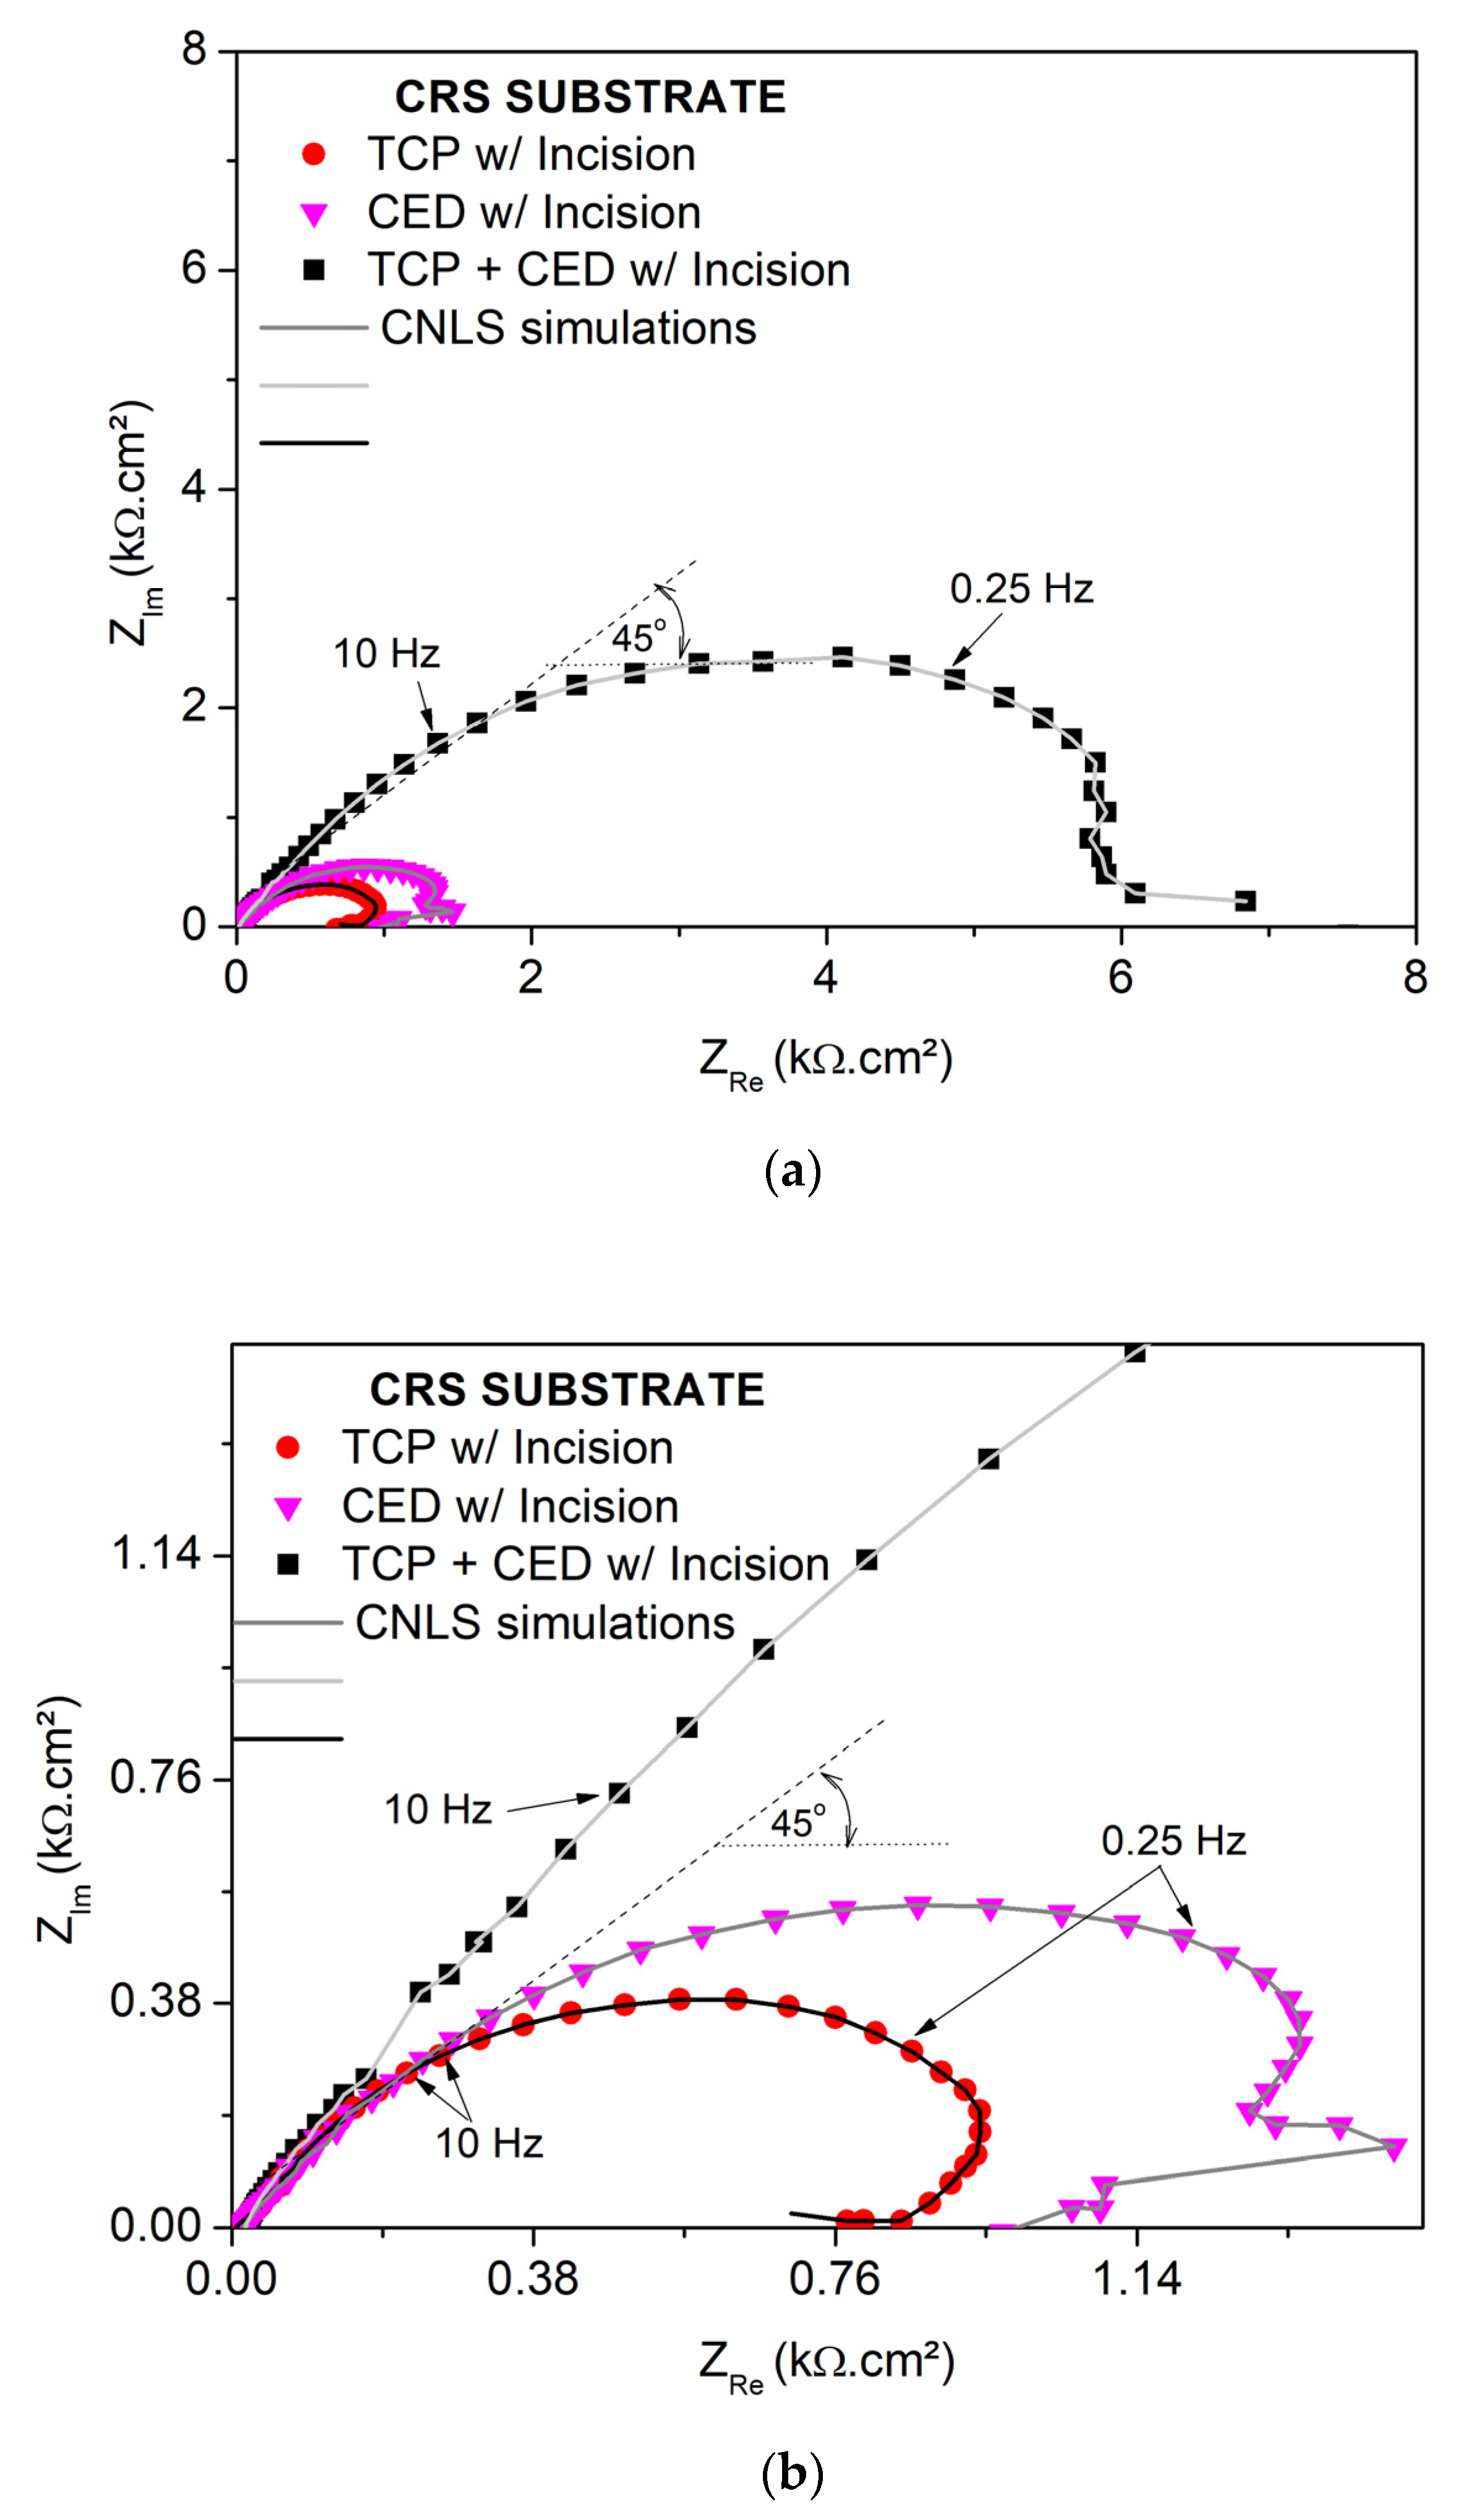
Figure 6 shows the depressed semi arcs and CNLS simulations of the TCP + CED, CED and TCP coating samples with the damage-induced incision. With this, it is possible to compare qualitatively the samples without incision and with incision.
This provides the assertion that the incision has provoked a substantial decrease in those verified semi arcs of all the examined samples. However, the same trend is verified when the polarization curves and EIS plots were analyzed, and it is also observed for these damaged samples, i.e., the increasing tendency of the corrosion resistance is TCP + CED > CED > TCP in the coating sample. Two distinctive magnitudes of the Z
Im vs. Z
Re are shown in
Figure 6a,b, i.e., up to 8 and 1.5 kΩ·cm
2, respectively.
In order to carry out a quantitative analysis concerning EIS measurements, CNLS simulations using an equivalent circuit (EC) into ZView
® software (previously detailed) were carried out. This adopted EC is commonly used to prescribe the corrosion behavior of distinct materials and conditions [
27,
28,
29,
30,
34,
35]. In this present investigation, although distinctive coating systems were analyzed, a unique EC is proposed.
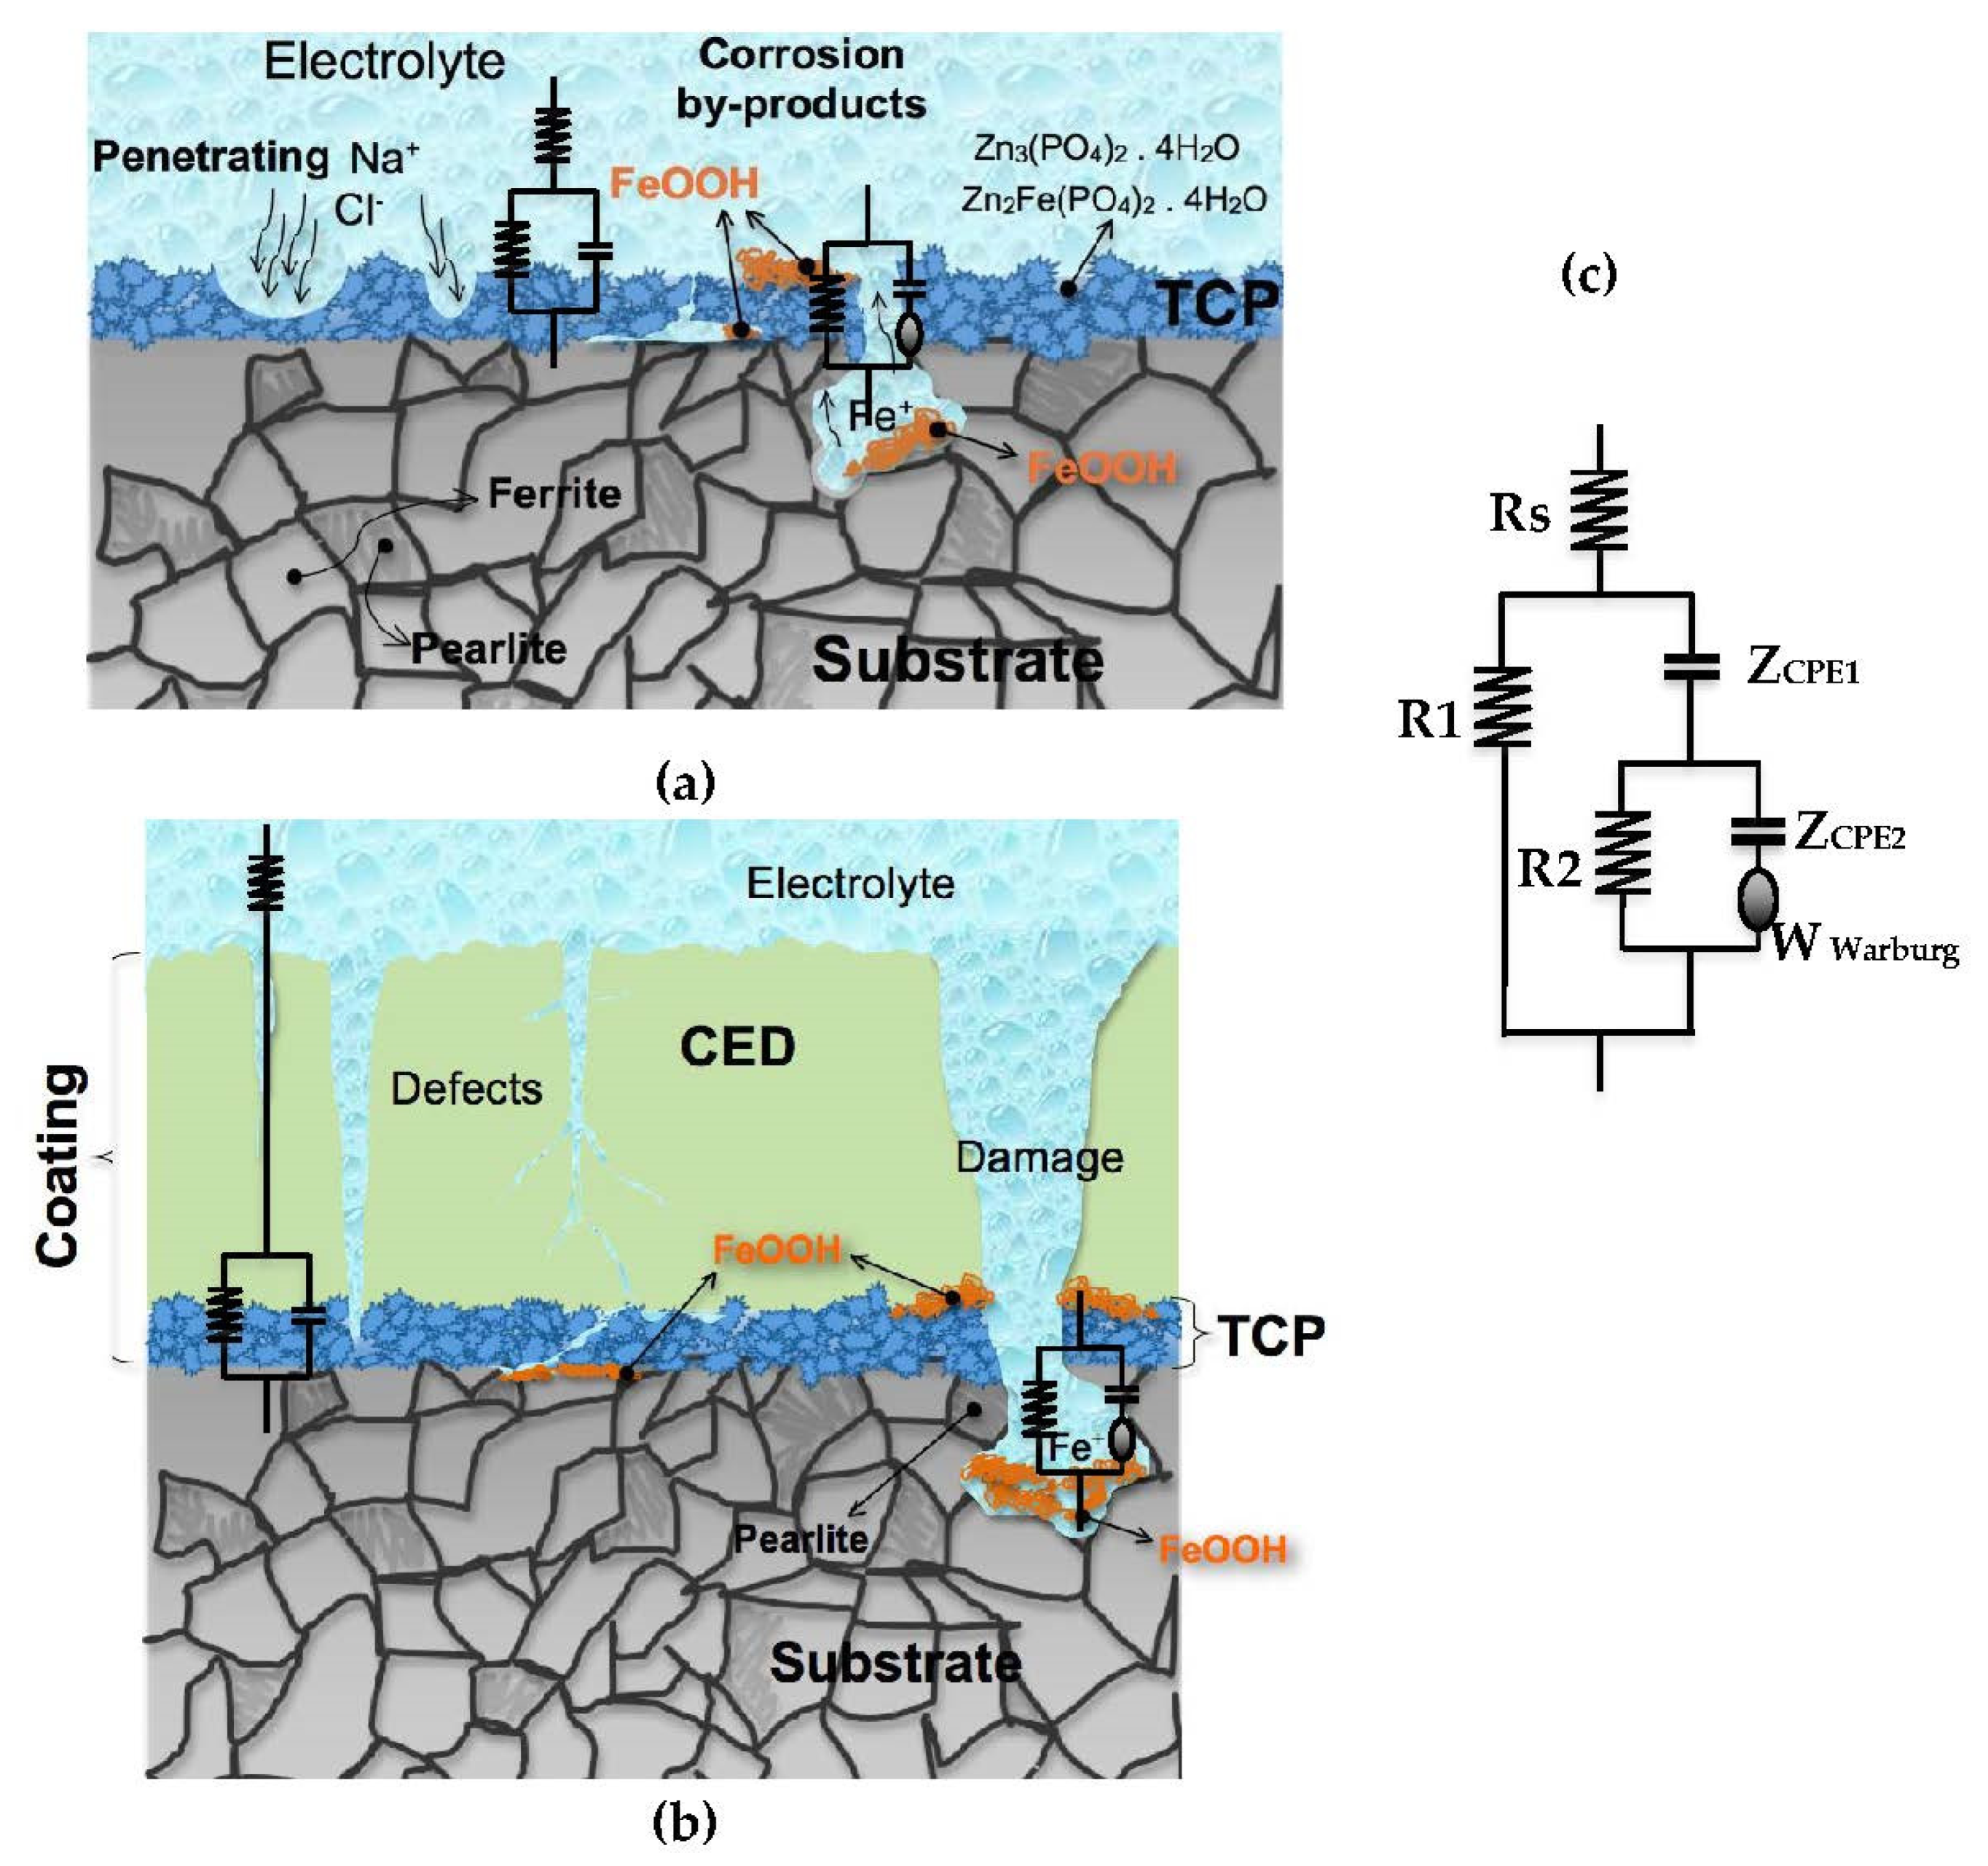
In a general way, all coating systems have a resistance conjugated with a capacitance consta phase elment (CPE), and this is associated with an outer layer (external) interfacing with an electrolyte (NaCl is possibly penetrating). Another resistance and capacitance are associated with the reaction at the substrate/inner layer coating interface. Additionally, a Warburg component in series with resistance against the substrate/inner layer interface is also attributed. This corresponds with diffusional reaction and transport occurring at the interface. The proposed EC adopted in this present investigation to prescribe the electrochemical behavior of coatings has been widely reported in the literature [
38,
39,
40,
41].
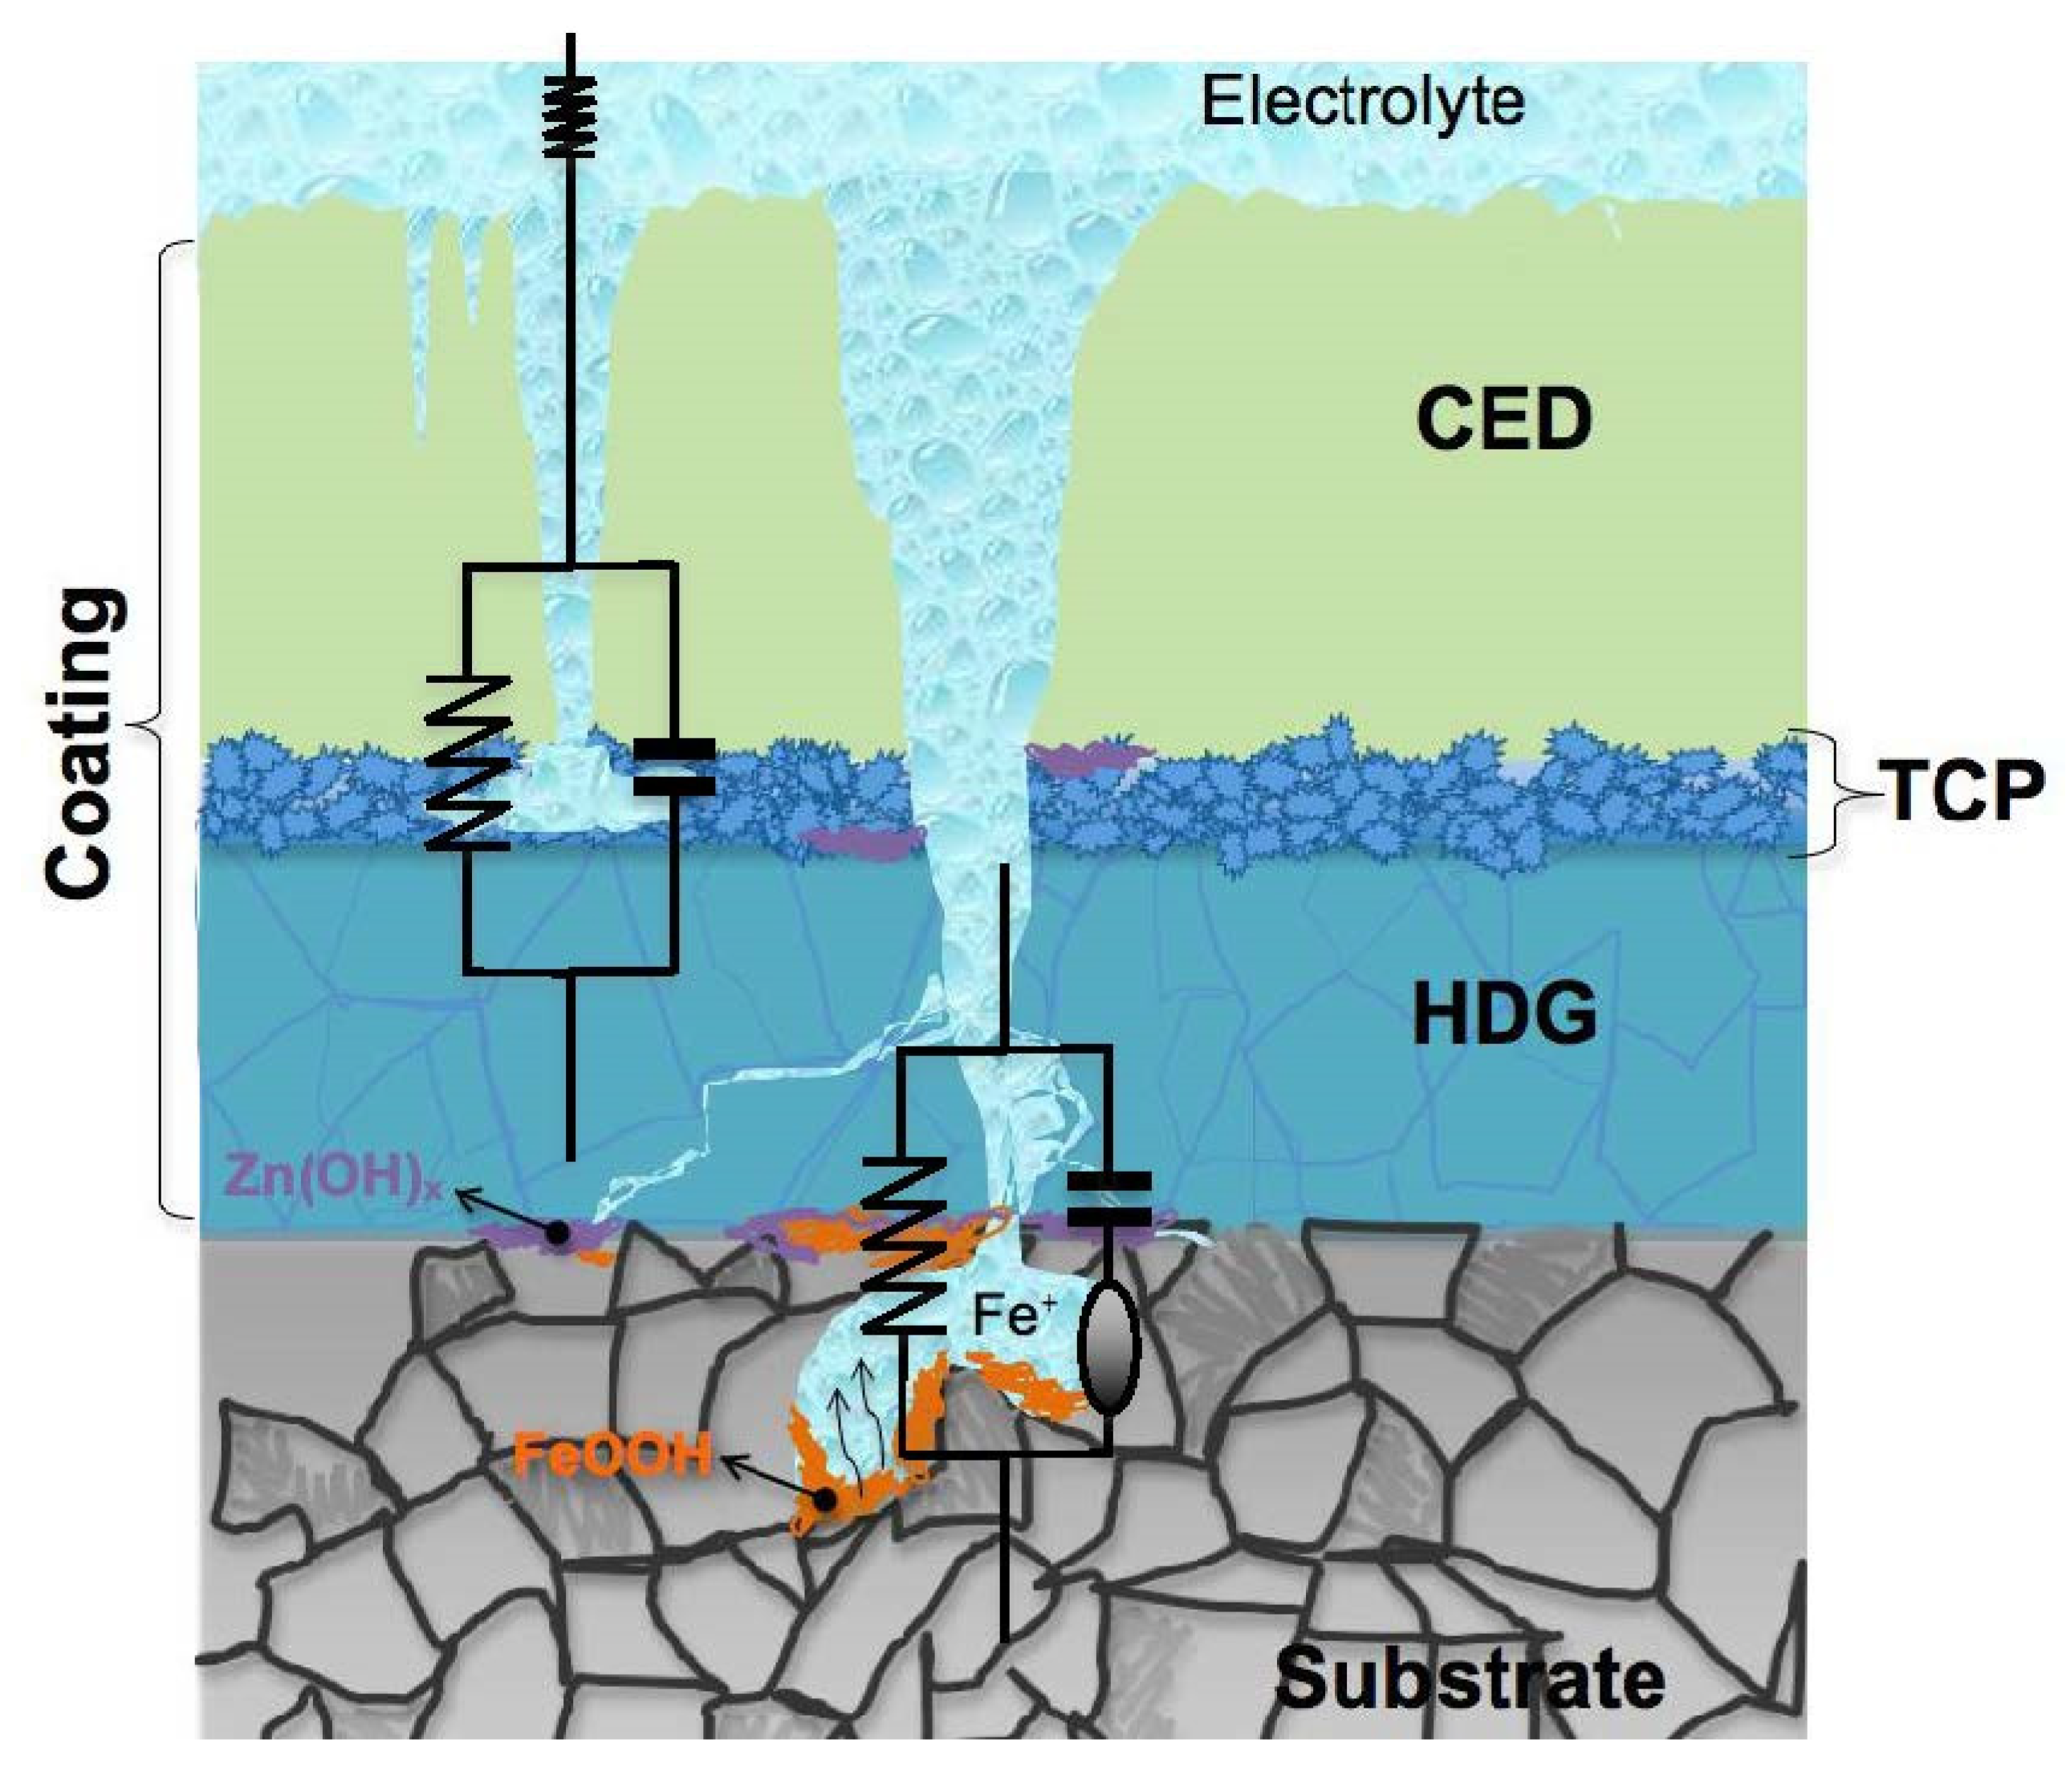
Figure 7a,b shows the schematic representations when only the TCP layer and the conjugated TCP + CED coating systems were constituted, respectively. Associated with the schema of the constituent elements into the coating system involving an electrolyte and the substrate, the proposed EC is also depicted. Its complete configuration is also depicted in
Figure 7c.
Amirudin and Thierry [
42] and colleagues [
18] have proposed a review paper explaining the corrosion mechanism of the phosphate zinc layer on steel substrate. With great scientific merit, they have explained the effects of various factors influencing the corrosion mechanism. These mentioned works help to understand the various stages observed in this investigation. Although they are not represented in
Figure 7, where only CED coating is considered, it can schematically be represented by
Figure 7a. In addition,
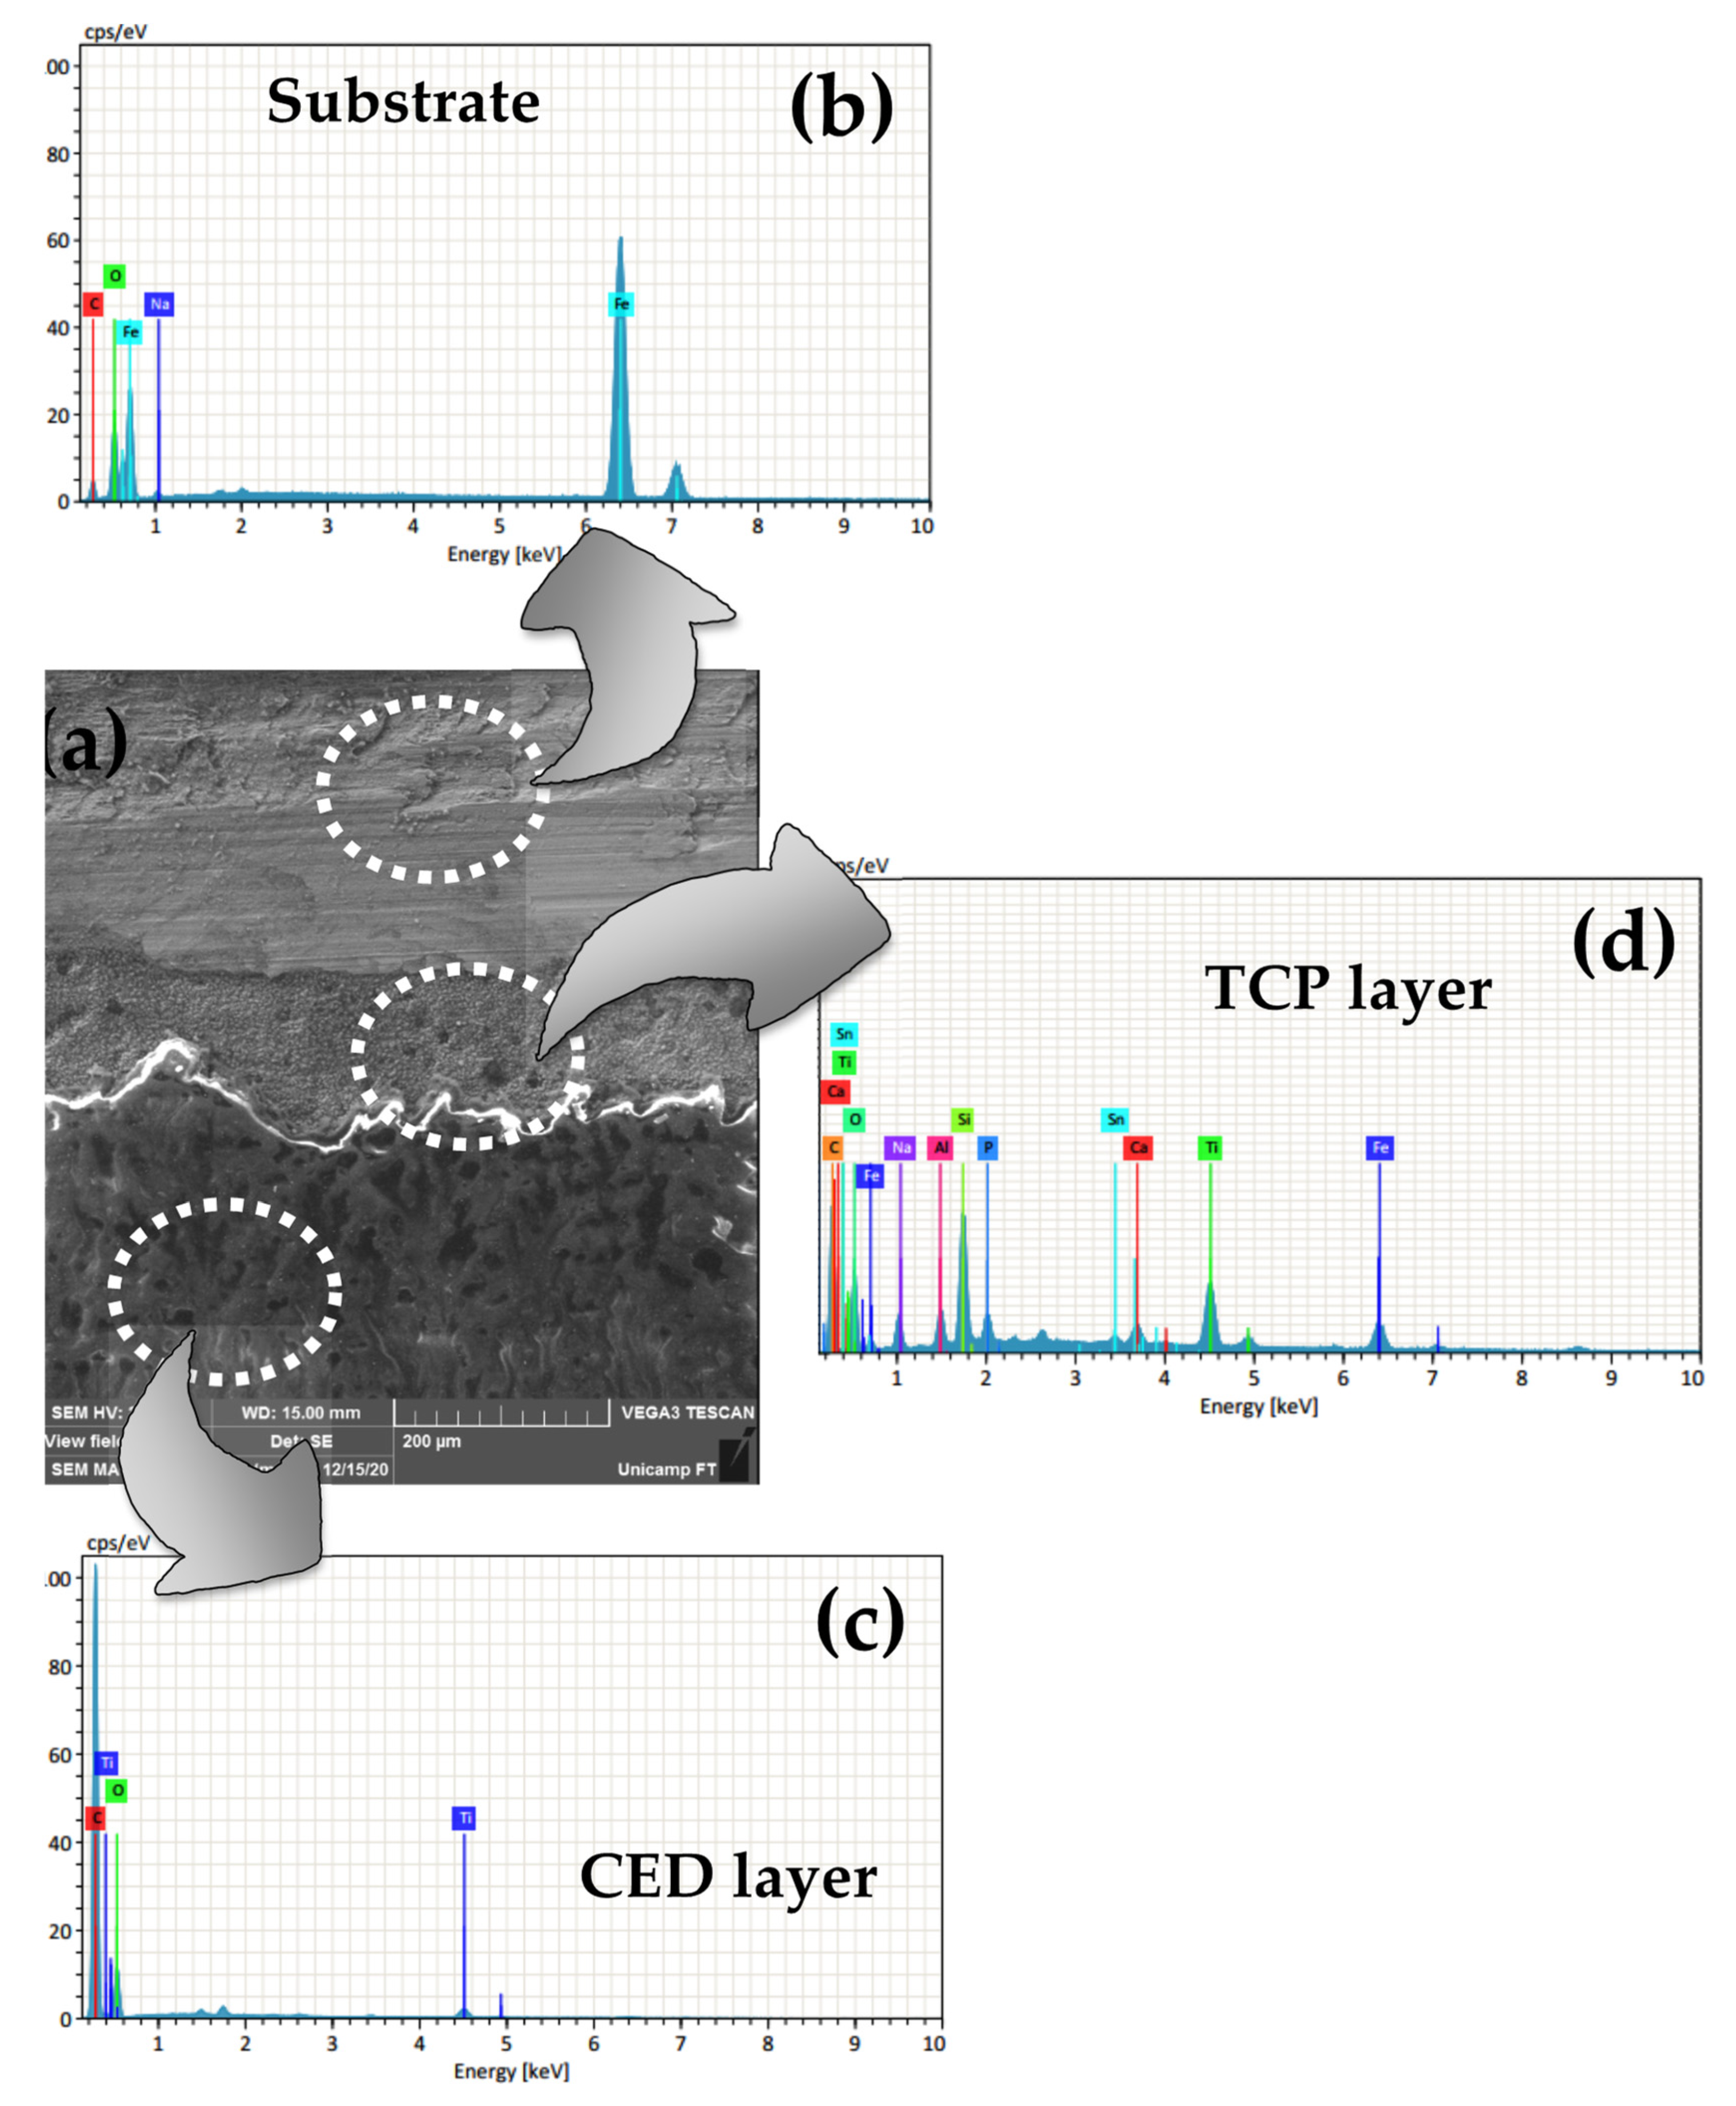
Figure 7 shows the presence of the FeOOH as a corrosion by-product occurring in a CRS. Morcillo et al. [
3] have detailed the importance of the FeOOH and their species in steel corrosion. Furthermore, the presence of FeOOH was found in CRS samples that were available after EIS in the present work, as will be discussed in the next section.
It is evident that the thickness is modified (~5 to 7 times higher than TCP ones) and that the porosity level is different due to the nature of a CED when compared with TCP coating. This is better discussed later on. In
Table 3, the impedance parameters were obtained using a CNLS simulation, ZView
®; EC and experimental data are immersed into a 0.5 M NaCl solution, and no incisions were provoked on the surfaces of the samples examined.
When these parameters were analyzed, and mainly those corresponding with R2 and W (corresponding with resistance of Warburg component, RW), it was clearly observed that the TCP + CED coating had the highest resistance, followed by intermediate values corresponding with those of the CED coating and the lowest was that of the TCP coating, as was also previously observed when polarization (icorr) and qualitative EIS analyses were carried out. It was also remarked that the resistance R2 was higher than all of the other examined resistances. It is also remembered that each resistance is associated with a capacitance CPE.
From the experimental results, all capacitances ZCPE 2 are higher than ZCPE 1 for all of the examined samples. However, this has not an assertive correlation. A decay trend was observed when the TCP, CED and TCP + CED coating systems were compared. This seems to be attributed with the distinctive nature of the coating systems examined. It seemed to be confirmed when both the ZCPE 1 and ZCPE 2 were analyzed.
It is stated that the lowest thickness of coating is that of the TCP coating (between 1 and 1.5 μm), and the highest is that of the TCP + CED coating system (~16 μm). Associated with these values, the capacitances are inversely proportional, and the highest capacitance was that of the TCP coating, the lowest that of the TCP + CED coating system, and the intermediate corresponds with the CED coating, as expected.
In
Table 4, the impedance parameters of the samples with induced-damage incisions on the surface are shown. The same trend is observed when
Table 3 and potentiodynamic polarization curves were analyzed. This demonstrates that incisions do not modify the corrosion resistance tendencies provided, i.e., TCP < CED < TCP + CED.
Comparison with investigations previously reported in the literature is a difficult task due to the several distinct parameters applied. However, when the EIS results of the TCP samples is compared with a previous study developed by Tian et al. [
10], who also examined a steel bare coated tricationic phosphate, independent of the operational parameters, same order of magnitude for Z
CPE 1 and Z
CPE 2 compared with CPE
c and CPE
dl were attained. Although in the studies of Tian et al. [
10] no Warburg component was utilized, similar significances of the EIS parameters permit this comparison. Moreover, interestingly, the results corresponded with a sample coated by a TCP method, and a similar corrosion current density obtained by Tian et al. [
10] is also verified in this present investigation (i.e., ~9.86 μAcm
−2 in Tial et al. [
10] study, while in this present investigation it was ~10.2 μAcm
−2).
An important comparison is one between the EIS results of the examined sample with and without provoked incisions. Thus, when comparing
Table 3, which contains EIS parameters corresponding with the samples without incisions provoked, it was clearly observed that the resulting corrosion resistances of the samples with incisions are substantially decreased. For instance, in a general way, the capacitances (Z
CPE 1 and Z
CPE 2) were increased, while both R
1 and R
2 were decreased. When R
1 is analyzed, which corresponds with the resistance of the outer layer, the TCP and CED samples decreased more than 10×, while the TCP + CED sample was not significantly modified. This is evidence that the thickness and nature of the involved coating systems had no substantial holes in their reactions at the coating/electrolyte interface when an incision is provoked. On the other hand, when R
2 is analyzed, the decrease is of about 15× when the TCP coating is considered, and both CED and TCP + CED coating systems have decrease in the same order of magnitude (~117× and 85×, respectively).
It is remembered that the resistance R
2 is associated with an inner layer of the coating interfacing CED with bare steel bare (designated as the CED sample) and CED with steel coated with a TCP layer (designated as TCP + CED sample). Since the TCP has a lower thickness (up to 1.5 μm), and its typical morphology is porous, this coating constitutes a substrate–coating interface, while the CED and TCP + CED samples are thicker (~15 and 16 μm) than TCP and is similar between them. Besides, the fact that the top coatings are equal, i.e., CED, the electrolyte penetration due to cross-link density was decreased and the micro-sized porous provoked [
20,
24] seems to provide this more intense reduction of R
2 values. It is remarked that the coating thickness is important to compare similar coatings. For example, it is not correct to compare the TCP and CED or TCP + CED. Firstly, the nature, morphology and thickness of TCP and CED are very distinctive. Evidently, this will favor coating with CED layers, which will demonstrate a better corrosion resistance. When same natures of coating are compared, the thickness has its importance level. Acamovic et al. [
25] have reported that a CED coating on steel bare containing thickness of 18 μm (immersed into a 3% NaCl solution for 18 days) has a higher corrosion resistance than others containing only 10 μm.
When the role of the TCP layer in a coating system is analyzed, it is evidenced that it is only a TCP layer on steel bare, which is independent if an incision is provoked; the lowest corrosion resistance (evaluated by polarization and EIS techniques) is that of the TCP sample. As expected, this seems to be intimately associated with porous material and is thinner than other coatings with CED layers. On the other hand, when the CED and TCP + CED coating systems are compared, the attained results favor the sample with the substrate coated with a TCP layer.
Although similar thicknesses are reached for the CED and TCP + CED samples, the initial reactions and its corresponding evolutions indicate that the TCP + CED coating system sample has the porous electrode behavior well characterized in a certain frequency range. Observing the experimental Nyquist plots (
Figure 5), at frequency ranges between 10
5 Hz up to <10
3 Hz, the porous electrodes corresponding with the TCP + CED sample is evidenced (
Figure 5b). The CED samples have porous electrode characteristics up to ~10 Hz. Between 10 Hz and 0.25 Hz, the straight line forming 22.5° suggests that the TCP + CED sample has a complex intermediate species acting as a barrier or as quasi-barrier protection.
When the samples with incisions are evaluated, the role of the TCP layer protection is fundamentally dismissed. This is due to the substrate being evidently exposed. It is expected that all samples examined present similar reactions. In fact, in all the three samples examined, considering a high frequency domain up to ~10 Hz, porous electrode behavior is characterized. At 10 and 0.25 Hz, the highest branch and semi arc segments are that of the TCP + CED sample, followed by the CED and TCP samples, respectively (
Figure 6a,b).
3.5. EIS Measurements: Effect of Incision Conjugated with HDG Coating
Since it was discussed and verified that the effect of the TCP layer concatenated with incision in the resulting electrochemical behavior, the effect of hot dip galvanized (HDG) steel in order to constitute a multi-coating system (i.e., HDG/TCP + CED) is examined. This decision is based on the fact that in industrial applications, the HDG-coated steel substrate has been given great attention and utilization [
13,
18,
19,
44]. Analogue to those results previously discussed, firstly the potentiodynamic polarization, the number of time constants and Bode, Bode-phase and Nyquist plots were evaluated. As expected, by adding a new layer to constitute a new multi-coating system, the resulting thickness is increased. Consequently, due to thicker coating, it is physically predictable that the highest corrosion resistance is achieved. In order to verify this prediction, the coated HDG substrate is analyzed using only a TCP layer and TCP + CED layer, similarly to that made when the substrate without an HDG layer was evaluated.
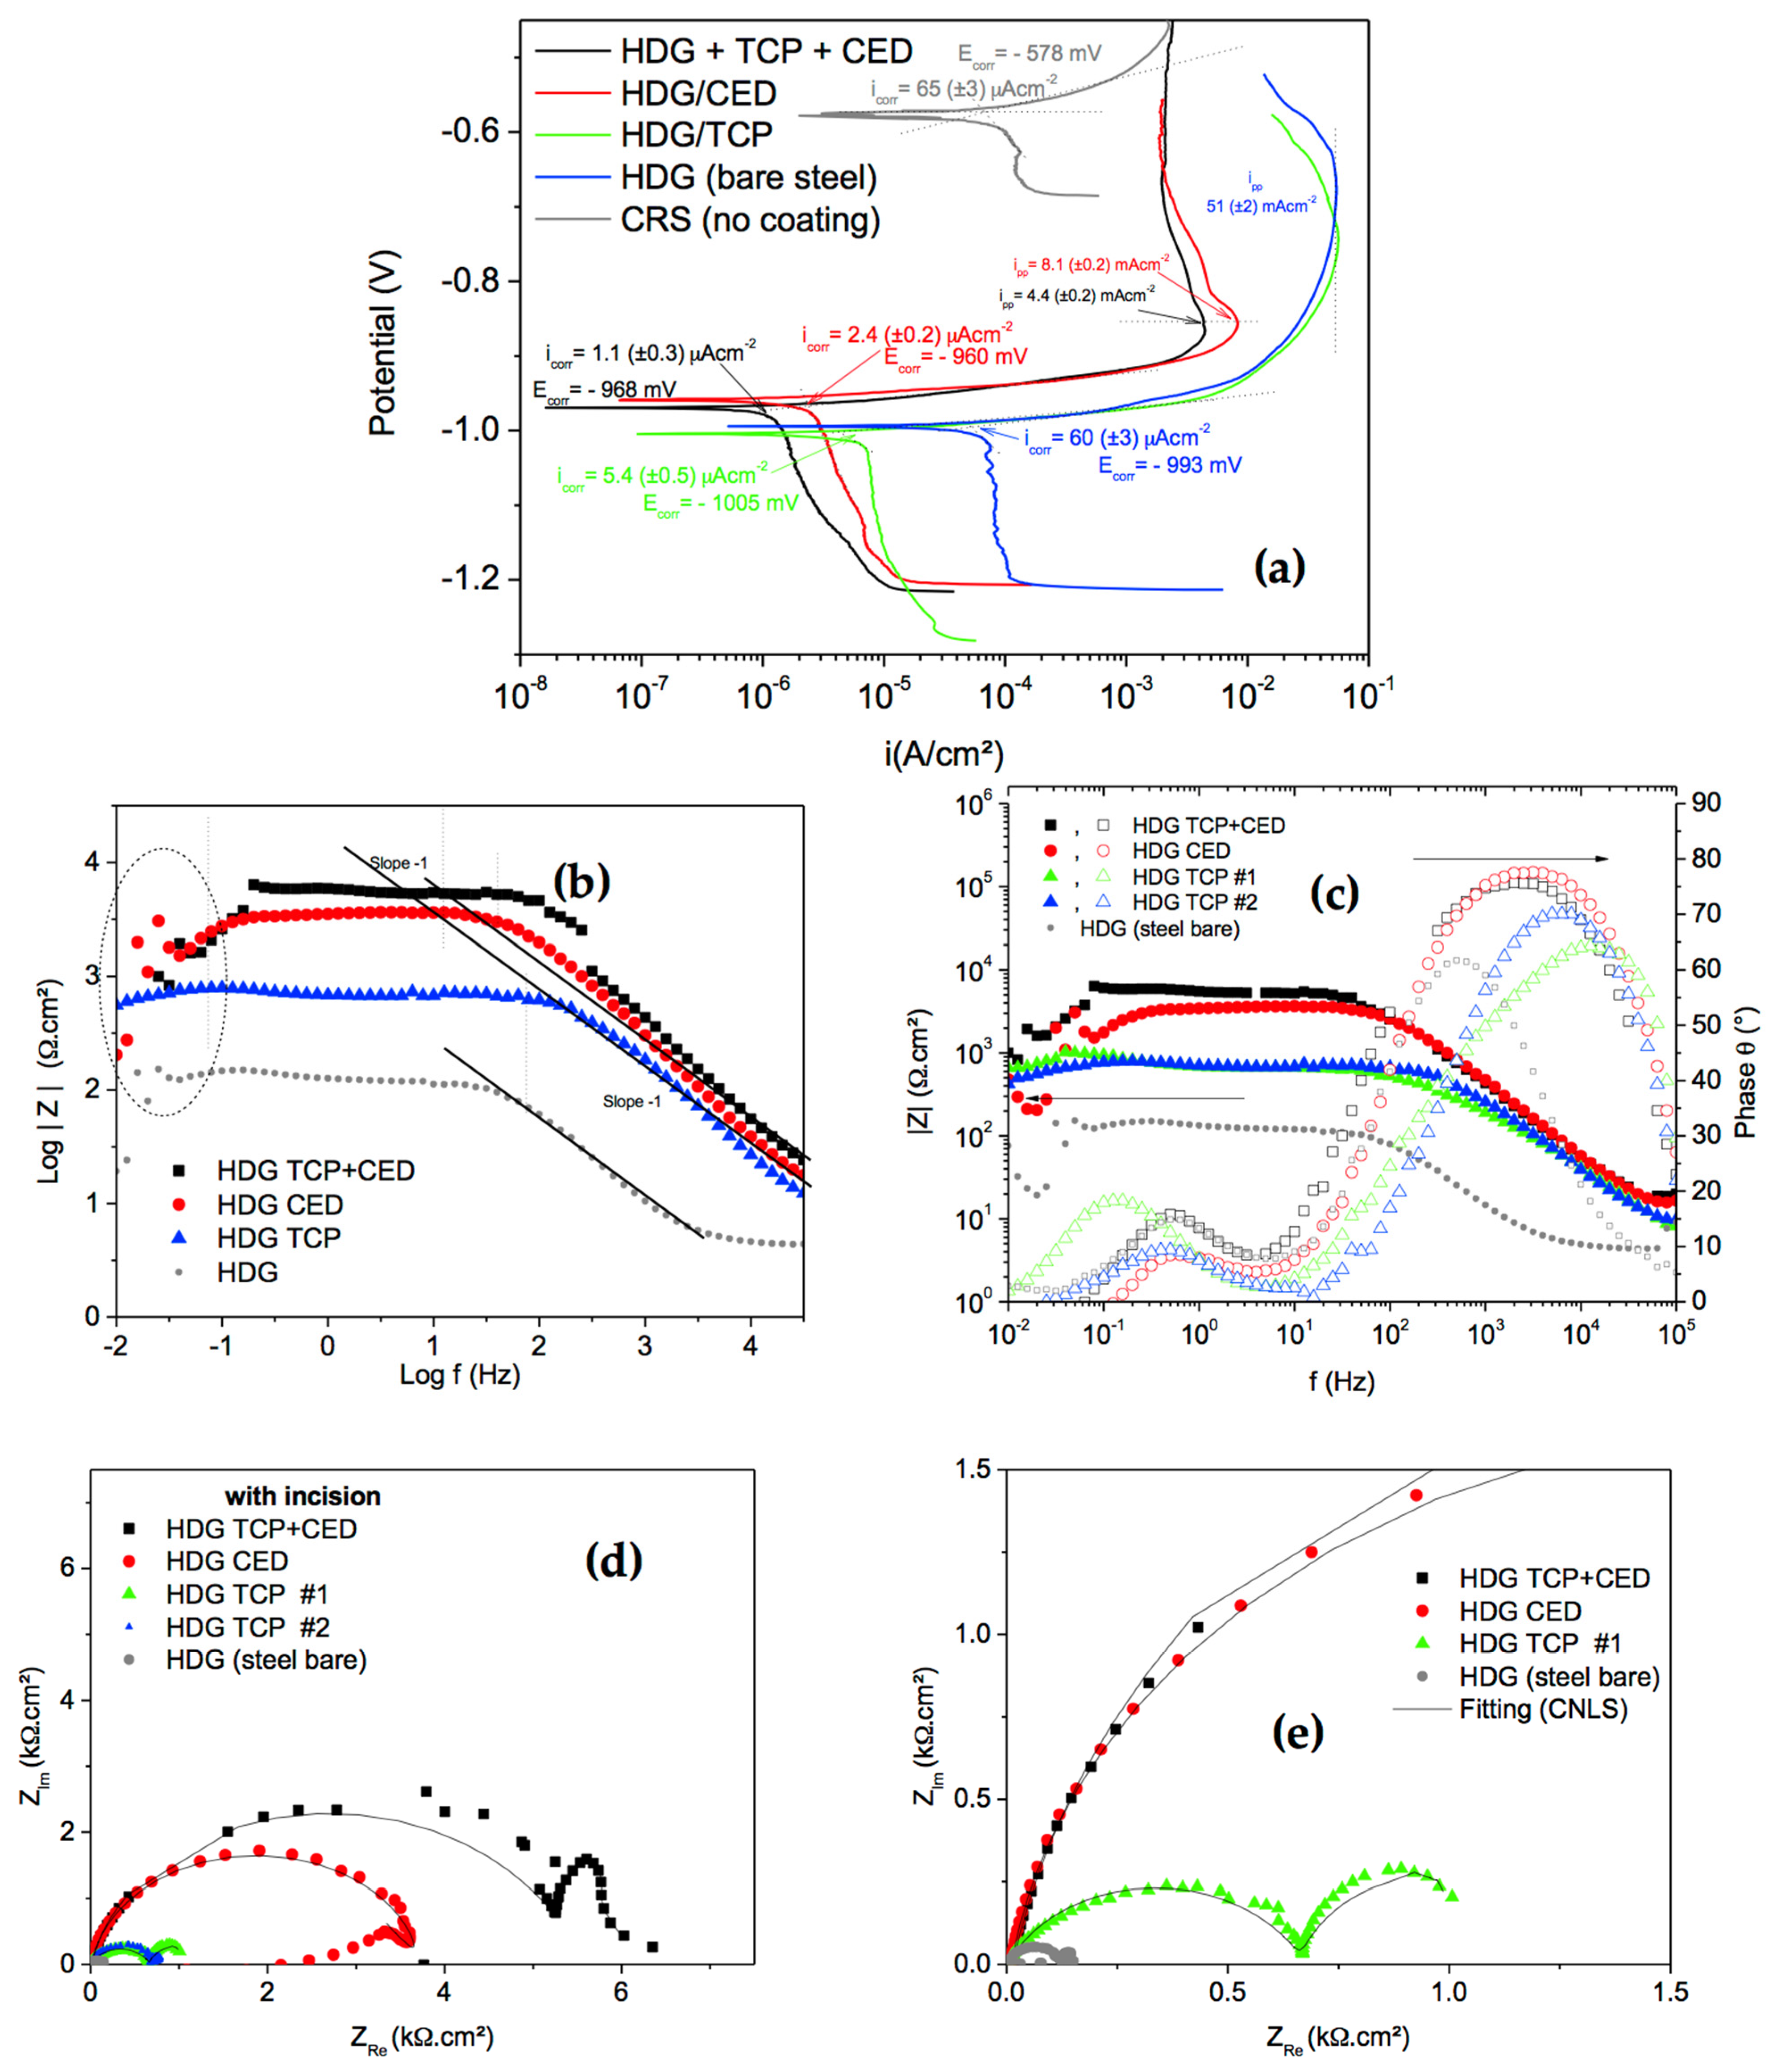
Figure 11a shows the experimental result of the potentiodynamic polarization curves of the four distinct coating systems, i.e., the HDG, HDG/TCP, HDG/CED and HDG/TCP + CED samples. These were examined in a stagnant and naturally aerated 0.5 M NaCl solution at an environmental temperature. All samples also contain incisions to damage the coating systems. It is clearly observed that the lowest corrosion current density (i
corr) is that of the HDG/TCP + CED coating system. The highest i
corr values are those of the CRS steel bare (no coating), i.e., 65 (±3) μAcm
−2, together with the HDG (steel bare) sample, i.e., 60 (±3) μAcm
−2. Based on these results, it is clarified that using only the HDG coating system, no effective protection is provided. Tsai et al. [
44] have reported similar values of i
corr and E
corr when a sample constituted by steel-coated HDG is examined (i.e., ~55 μAcm
−2 and −1129 mV, respectively).
When the TCP layer is used on the substrate coated with HDG, the i
corr decreases by about 10×, attaining about 5 μAcm
−2, as depicted in
Figure 9a. When the CED layer is applied onto the HDG sample, the i
corr decreases by 2× when compared with that of HDG/TCP layers. Interestingly, when a multi-coting system is used, i.e., a steel substrate coated with HDG, followed by TCP and CED layers, the resulting i
corr reaches approximately 1.1 (±0.3) μAcm
−2. This value is about 60× lower than uncoated steel substrate when compared with HDG-coated samples.
Considering the best result of the sample with the substrate first coated with an HDG layer, i.e., HDG/TCP +CED, and comparing it with the best result of that the sample containing only a TCP + CED layer (shown in
Figure 2b), it is clearly observed that the HDG coating has a slight advantage over the TCP + CED sample. The HDG/ TCP + CED coating system has an i
corr ~2 times lower (~1 μAcm
−2) than the TCP + CED sample (~2 μAcm
−2). However, it is verified that the HDG/TCP + CED sample has a corrosion potential considerably displaced to the more active potential side, i.e., −1129 mV against −435 mV (vs. SCE). This has a low deleterious effect when compared with the attained corrosion current density, which seems to be more drastic in terms of the severity of the degradation. Another interesting part of the attained results concerns the primary passive current (i
pp), which is demonstrated by the coating system with the HDG layer. This i
pp firstly occurs for the HDG/TCP + CED followed by the HDG/CED sample. Both the HDG sample and the HDG/TCP sample reveal an i
pp about 10× higher than other two samples. This result favors both the HDG/TCP + CED and HDG/CED samples. This passivation seems to be correlated with the diffusional and transport of intermediate species, which seem to provide some barrier protection when these are allocated inside the porous structure in the TCP layer and hole-defects at the CED layer.
When
Figure 9b,c is analyzed, it is revealed that two time constants are prevalent and the modulus of impedance and the maximum phase angle corresponding with the multi-coating system HDG/TCP + CED samples exhibits the best result. When analyzing Nyquist plots in
Figure 9d,e it is confirmed that the corrosion resistance tendency is HDG < HDG/TCP < HDG/CED < HDG/TCP + CED. This is similar to that trend observed when steel substrates without an HDG coating were examined. This indicates that only by applying a TCP layer, or only a CED layer, on HDG-coated steel is not enough to provide the best corrosion resistance.
Another interesting obtained result concerns the porous electrode behavior. Both the HDG/CED and HDG/TCP + CED sample, which have demonstrated the best results of corrosion resistances, have no porous electrode behavior characterized. It is remembered that this behavior is revealed when at a high frequency domain range, a straight line forming 45° is constituted. This characteristic is only verified when the HDG/TCP sample and only steel coated with HDG are analyzed. This ensures that full protection is provided. This seems to be intimately associated with porous morphologies as intrinsic characteristics of these layers. With this, the water and electrolyte penetrate throughout layers and the substrate is reached and drastically attacked.
When the Nyquist plots corresponding with the HDG/CED and HDG/TCP + CED samples are analyzed, at a high frequency domain range, a quasi-ideal capacitive behavior (Bode-phase tending 90°) is verified, as was also observed by Reichinger et al. [
19], Vakili et al. [
20], Tian et al. [
39], and Zhang et al. [
45]. Comparing the HDG/TCP + CED coating system with the TCP + CED coating sample, two important assertions can be made. Firstly, it is the fact that the TCP + CED sample has a thickness (~7 ± 2 μm) that is considerably lower than the HDG/TCP + CED sample (~12 ± 3 μm). When it is verified that there are similar thicknesses between the TCP + CED and the CED samples, their corresponding resistances were very distinctive, which was attributed to the nature of the layers used and the resulting intermediate species formed, potentially protecting substrate degradation or retarding the corrosive process.
Based on these assertions and comparing the HDG/TCP + CED with the TCP + CED coating sample, i.e.,
Figure 6a with
Figure 11d, it is qualitatively verified that these samples have similar sizes of the depressed semi arcs constituted (Z
Im ~2 kΩ·cm
2 with Z
Re ~6 kΩ·cm
2). A noticeable difference is that the sample without the HDG layer on a steel substrate reveals a porous electrode behavior corroborating with planar electrode behavior to prescribe the resulting electrochemical behavior. This indicates that an additional HDG layer significantly increases the thickness (~2 times) of the coating system. Considering the same short-term immersion period (which were evaluated in the samples), the sample with a thicker coating system provides a higher time to electrolyte penetration and to the substrate to be reached than the other one. Furthermore, the nature and electrochemical contribution of the distinctive intermediate species and corrosion by-product formed should also be taken into account. For example, Amirudin and Thierry [
42] have reported that a sample with an HDG layer has Zn ions, locally modifying the pH and interacting with chloride ions, provoking a certain delamination. More recently, it has been reported [
18] that a pitting corrosion on HDG-coated steel in short exposures has important consequences for the assessment of the lifetime of the zinc coatings on steel. Reichinger et al. [
19] have reported that ion transport in HDG steel is conspicuously different from a cataphoretic coating.
With these observations, it is very important to analyze the quantitative results provided by EIS parameters. In this sense, the same equivalent circuit (EC) was utilized to obtain the EIS parameters of the samples without an HDG layer also being used.
Figure 12 shows the schematic representation of the EC corresponding with each region of the coating system established. An equivalent circuit with a Warburg component is also depicted and intermediate species corroborate to predict the electrochemical corrosion behavior. When an electrolyte reaches the HDG layer, as previously reported [
19,
41], delamination can occur and intermediate species containing Zn corrosion by-products will also participate in the corrosion mechanism, and a certain “protection” can be provided. This can reasonably be understood when EIS parameters obtained by using CNLS simulations are analyzed, as shown in
Table 5. When comparing EIS parameters among the coated HDG samples, it is evidenced that the same corrosion resistance tendency verified for those samples without an HDG layer (also containing incisions) is also verified, i.e., HDG < HDG/TCP < HDG/CED < HDG/TCP + CED.
Analyzing all parameters in
Table 5, it can be understood that there is a corrosion mechanism proposed and schematically represented in
Figure 12, that is also associated with those previously reported in the literature [
41]. For instance, when the results of the HDG/TCP sample are examined, firstly, it can be seen that capacitance Z
CPE2 is higher than Z
CPE1 and R
2 (at HDG/TCP interface) is slightly lower than R
1 (at substrate/HDG interface). It is recognized that as capacitance increases, its correlated thickness is also decreased. This physically means that hole-defects are being prevalently permitting the electrolyte penetration and reaching the substrate. This provides a low resistance—R
1—while R
w has a discreet effect upon the electrochemical behavior (the lowest value, i.e., 0.035 kΩ·cm
2). The sum of the three resistances (i.e., R
1 + R
2 + R
w) attains the lowest result when compared between the HDG/CED and the HDG/TCP + CED samples. On the other hand, the highest results of R
1 + R
2 + R
w (~27 kΩ·cm
2) is that of the HDG/TCP + CED sample. In this case, the resistance R
w has an important role in corrosion resistance. This is associated with the fact that distinct intermediate products and species corroborate in order to minimize the drastic corrosive effect. At least, the electrolyte penetration onto the steel substrate is retarded. When compared with other HDG-coated samples, both R
2 and R
w, which are representing reactions at the substrate–HDG interface and at complex corrosion by-products inside degraded regions (pites), are higher than other examined samples.
Additionally, it is in doubt that the HDG layers affect the resulting corrosion resistance. In this sense,
Table 4 and
Table 5 are compared. When the TCP sample is compared with the HDG/TCP, the R
1 (TCP) is lower than the HDG/TCP, while Z
CPE1 is increased. Using
Figure 12 without a CED layer and comparing it with
Figure 7a means that, at a similar immersion period, the TCP sample has poor protection or a higher penetration than the HDG/TCP sample. Moreover, when R
2 (TCP) is analyzed, which means reactions at the substrate–TCP and substrate–HDG interfaces, respectively, the TCP sample has higher values (~0.98 kΩ·cm
2) than HDG/TCP (~0.42 kΩ·cm
2). This means that the porous structure induces a decrease in the resistance at this interface. Furthermore, due to the decrease verified at R
2, and the intermediate species formed, the R
w of the HDG/TCP sample (~1 kΩ·cm
2) is higher than the TCP sample (~0.035 kΩ·cm
2). This represents an interaction between intermediate species, probably those resulting in the complex products, generically represented by ZnX
a(OH)
y, as reported [
18,
19,
42,
43,
44]. It is clearly observed that R
1 and R
2 and Z
CPE1 and Z
CPE2 vary according to corrosion progress. The sum of the three resistances can also be used to summarize the corrosion resistance trend. Thus, the HDG/TCP samples have an R
1 + R
2 + R
w of about 2 kΩ·cm
2, against ~1 kΩ·cm
2 observed for the TCP sample.
Analogue evaluations can also be carried out for all of the examined samples. Considering that the sum of R1 + R2 + Rw is verified and that those samples are firstly HDG-coated show that the results demonstrate a better corrosion resistance than the sample without an HDG layer application, i.e., the HDG/CED attains ~40 kΩ·cm2 and the CED ~17 kΩ·cm2; and the HDG/TCP + CED reaches ~85 kΩ·cm2, while the TCP + CED sample reaches ~30 kΩ·cm2. With these results, the previous question concerning the similar Nyquist plots between the HDG/TCP + CED and the TCP + CED coating sample is answered.
However, another question also remains concerning the light weight and relative cost associated with effective protection. Moreover, an additional question remains concerning the validations of these impedance parameters and potentiodynamic polarization values with traditional and conventionally salt spray results commonly utilized in industrial practices. Based on these questions, the next section is proposed.
3.6. Comparisons: Electrochemical, Salt Spray, Relative Cost Results and Effective Protection
Although the experimental results are indicative that a same trend in terms of the corrosion resistances of the examined samples are prevalent, indistinctively, if the HDG layers and incisions are considered, it is remarked that the short-term immersion period seems to constitute a limitation in this present investigation. This is adopted in order to verify and to compare all of the proposed samples. In the literature, there exist articles showing that same corrosion resistance tendency is kept after distinct immersion periods are adopted [
15,
20,
39,
45,
46]. It is commonly verified that kinetics are alternated. For instance, in studies developed by Vakili et al. [
20] using a modified Zn phosphate sample, and Noodeh et al. [
15] using silica as nano particles modifying the cathodic electrocoating, it is observed that the moduli of impedances in a short-term immersion period is lower than the longer period, as expected. However, similar trends are verified. Interestingly, what is also modified is the porous electrode behavior in the electrochemical process. For example, in the sample that was immersed over 7 days, only planar electrode behavior domains consisted of the electrochemical process, and after 14 days, porous electrode behaviors corroborate to predict the corrosion response. Evidently, the distinct nature of coating also modifies the participation of porous electrode behavior in corrosive processing [
10]. The chemical nature of the electrolyte also drastically modifies the porous electrode behavior in an electrochemical process [
44].
In a general way, and also based on the experimentations observed, it can be said that, at initial stages, the intermediate species should contribute with minimum effects. Firstly, this is due to the substrate not being attacked, and because no completed penetration is reached. With the immersion period increasing, these species have their roles initiating importance in corrosion evolution. With the electrolyte penetration and the substrate being reached, it is possible that a “temporally” oxide film barrier of protection is formed. Based on this, the aim in this present investigation is to evaluate the electrochemical behavior of the distinct multi-coating systems in the initial immersion period, i.e., up to 2 h of immersion. Although no other immersion periods were examined, it is believed that the corrosion tendency verified in a short-term immersion is also prevalent in long-term immersion periods, as verified in other distinct studies [
15,
20,
45,
46].
Although a comparison between EIS parameters, corrosion current densities and salt spray results is not practicable in terms of a direct quantitative parameter comparison, some investigations have reported both EIS and salt spray results, as reported by Shreepathi et al. [
46], Noodeh et al. [
15] and Tsai et al. [
44]. It can be convenient to decide or to select a certain application or to provide an analysis of optimization costs. Based on this, all samples examined were also subjected to salt spray conditions. Tsai et al. [
44] reported that salt spray results are in good consistence with both polarization and EIS results. In our results, it is confirmed that the same corrosion resistance tendency was verified using corrosion current density and EIS parameters, which is also observed when the salt spray results are analyzed.
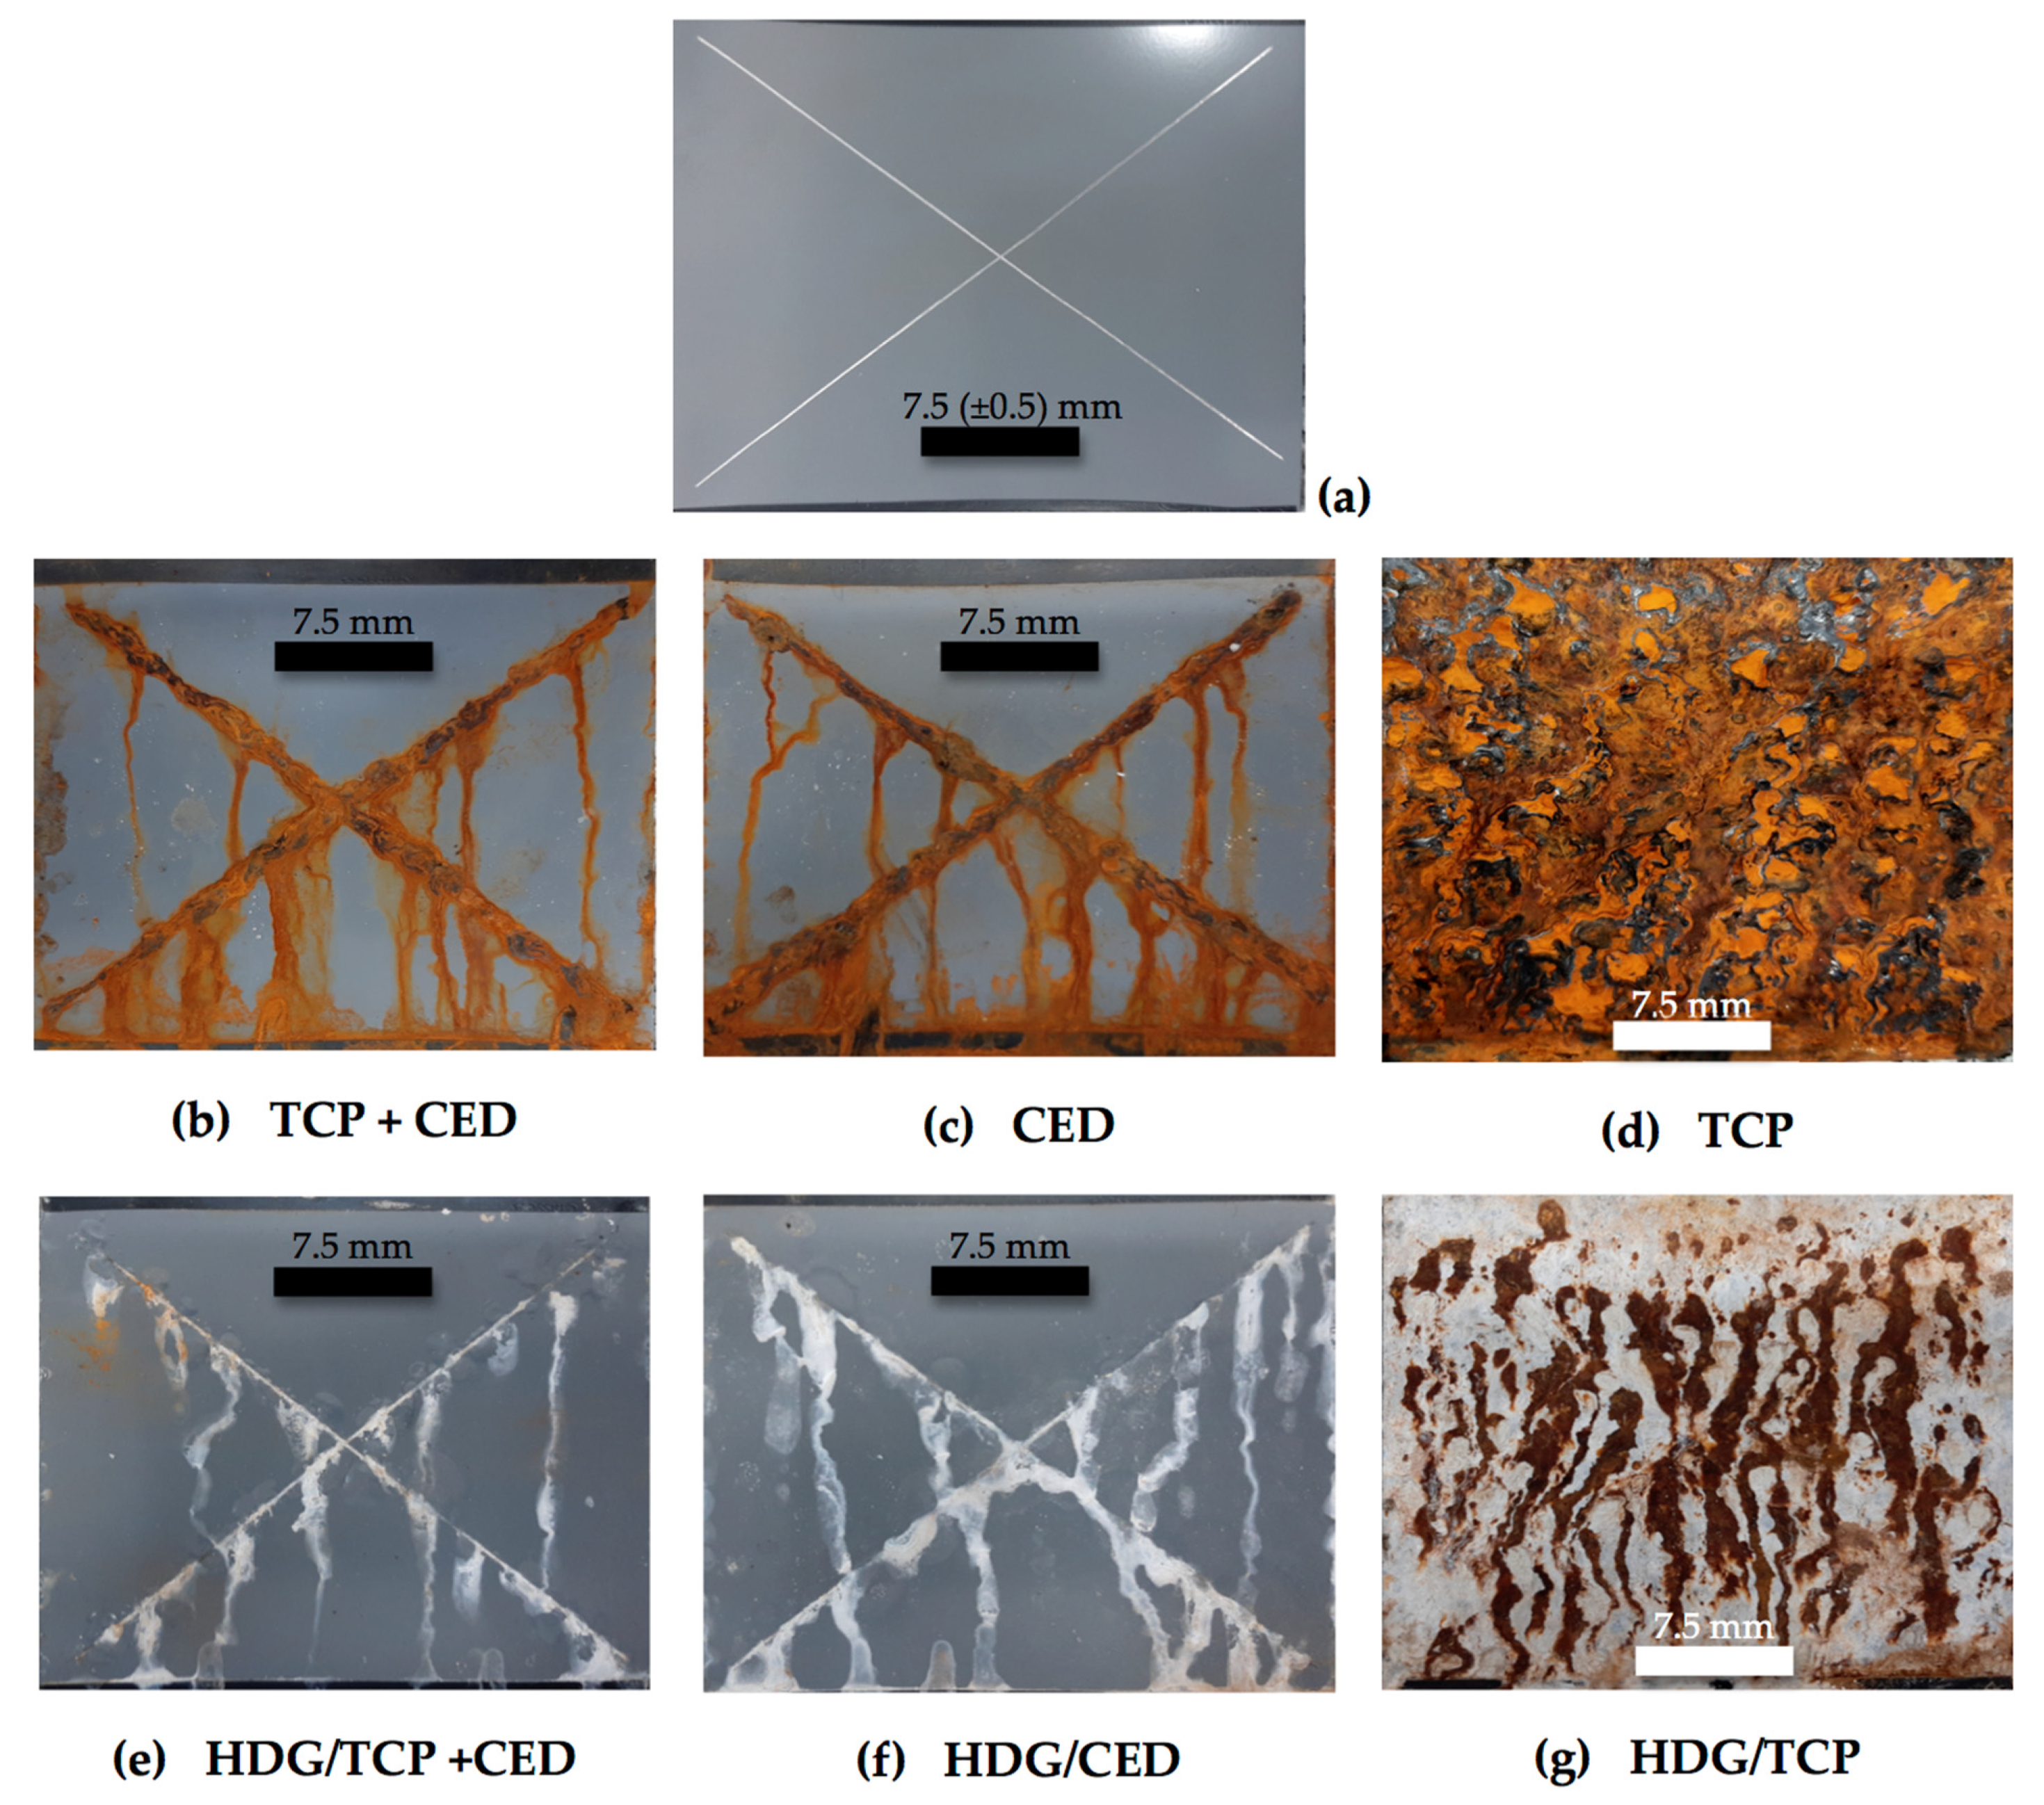
Figure 13a depicts a typical sample with scribe marks and no immersion, which is representative of the other samples to be examined during 500 h (~21 days), following description in ASTM B 117 [
44,
46].
Figure 13b–d show the three distinct coating systems with different layers being TCP + CED on the substrate (CRS), and only a CED layer and only a TCP layer deposited on the CRS substrate, respectively. Additionally, the coating system samples with their substrate priory coated with HDG layers are shown in
Figure 13e–g, which represent the sample HDG/TCP + CED, the HDG/CED and the HDG/TCP, respectively.
It is clarified that samples without an HDG layer clearly exhibit red rust formation, while only the HDG/TCP sample has no depicted white rust formation. Based on the images of a photograph corresponding with each examined coating system, it is clarified that the same corrosion resistance tendency is verified, i.e., TCP + CED > CED > TCP, and when HDG layers on CRS substrates are considered, the verified trend is HDG/TCP + CED > HDG/CED > HDG/TCP. When the corrosion current density and the EIS parameters were analyzed, the same trend was also observed. These observations indicate that EIS and polarization techniques are helpful and powerful tools to predict the corrosion resistances of distinct coatings, which makes it possible to replace the accelerated salt spray measurements.
Although the salt spray results during the 500 h indicate the same tendency of corrosion resistance to that verified by electrochemical measurements, there remains a question of concerning operational/manufacturing costs, coating weights and effective protection provided for each distinct coating system. The protection efficiency (η) can be determined by using Equations (2) and (3) [
39,
45], when values of i
corr and the sum of resistances (EIS parameters) are used, respectively:
where i
corr(Bare) and i
corr are the experimental corrosion current densities of the CRS (steel substrate) and coating systems examined, respectively. At Equation (3), ΣR
(Bare) and ΣR represent the sum of resistance R
1 +R
2 + R
w of the substrate without coating and those examined coating systems, respectively. The results of the η correlating i
corr and ΣR are η
(icorr) and η
(R) and are shown in
Table 6. The values of i
corr and R
1 + R
2 + R
w are obtained from
Figure 2 and
Figure 11, and
Table 4 and
Table 5. The ranges of cost per area deposited (
$/cm
2) are estimated based on the commercial price used to obtain a covered sample of 300 (±5) cm
2. Evidently, this
$/cm
2 can be modified from a distinct country and its economy, which is induced to determine a relative cost (RC) based on the lowest attained range cost, i.e., the TCP sample. Since the relative cost is considered, it was also determined as a relative protection efficiency based on those η
(icorr) considering the TCP sample. The η results clearly favor the HDG/TCP + CED sample, followed by the TCP + CED, indistinctively, if η
(icorr) or η
(R) are considered.
However, there also remains another question concerning the thickness and weight provided by each one of the coating systems examined. The electrochemical results provide information of corrosion resistance for each kind of substrate, i.e., only CRS without covering and a CRS with an HDG layer. From
Table 6, the attained results provide a comparison between the two different substrates. However, as has also been pointed out when analyzing EIS parameters, a sample with an increased thickness has a higher resistance than other ones with a lower thickness.
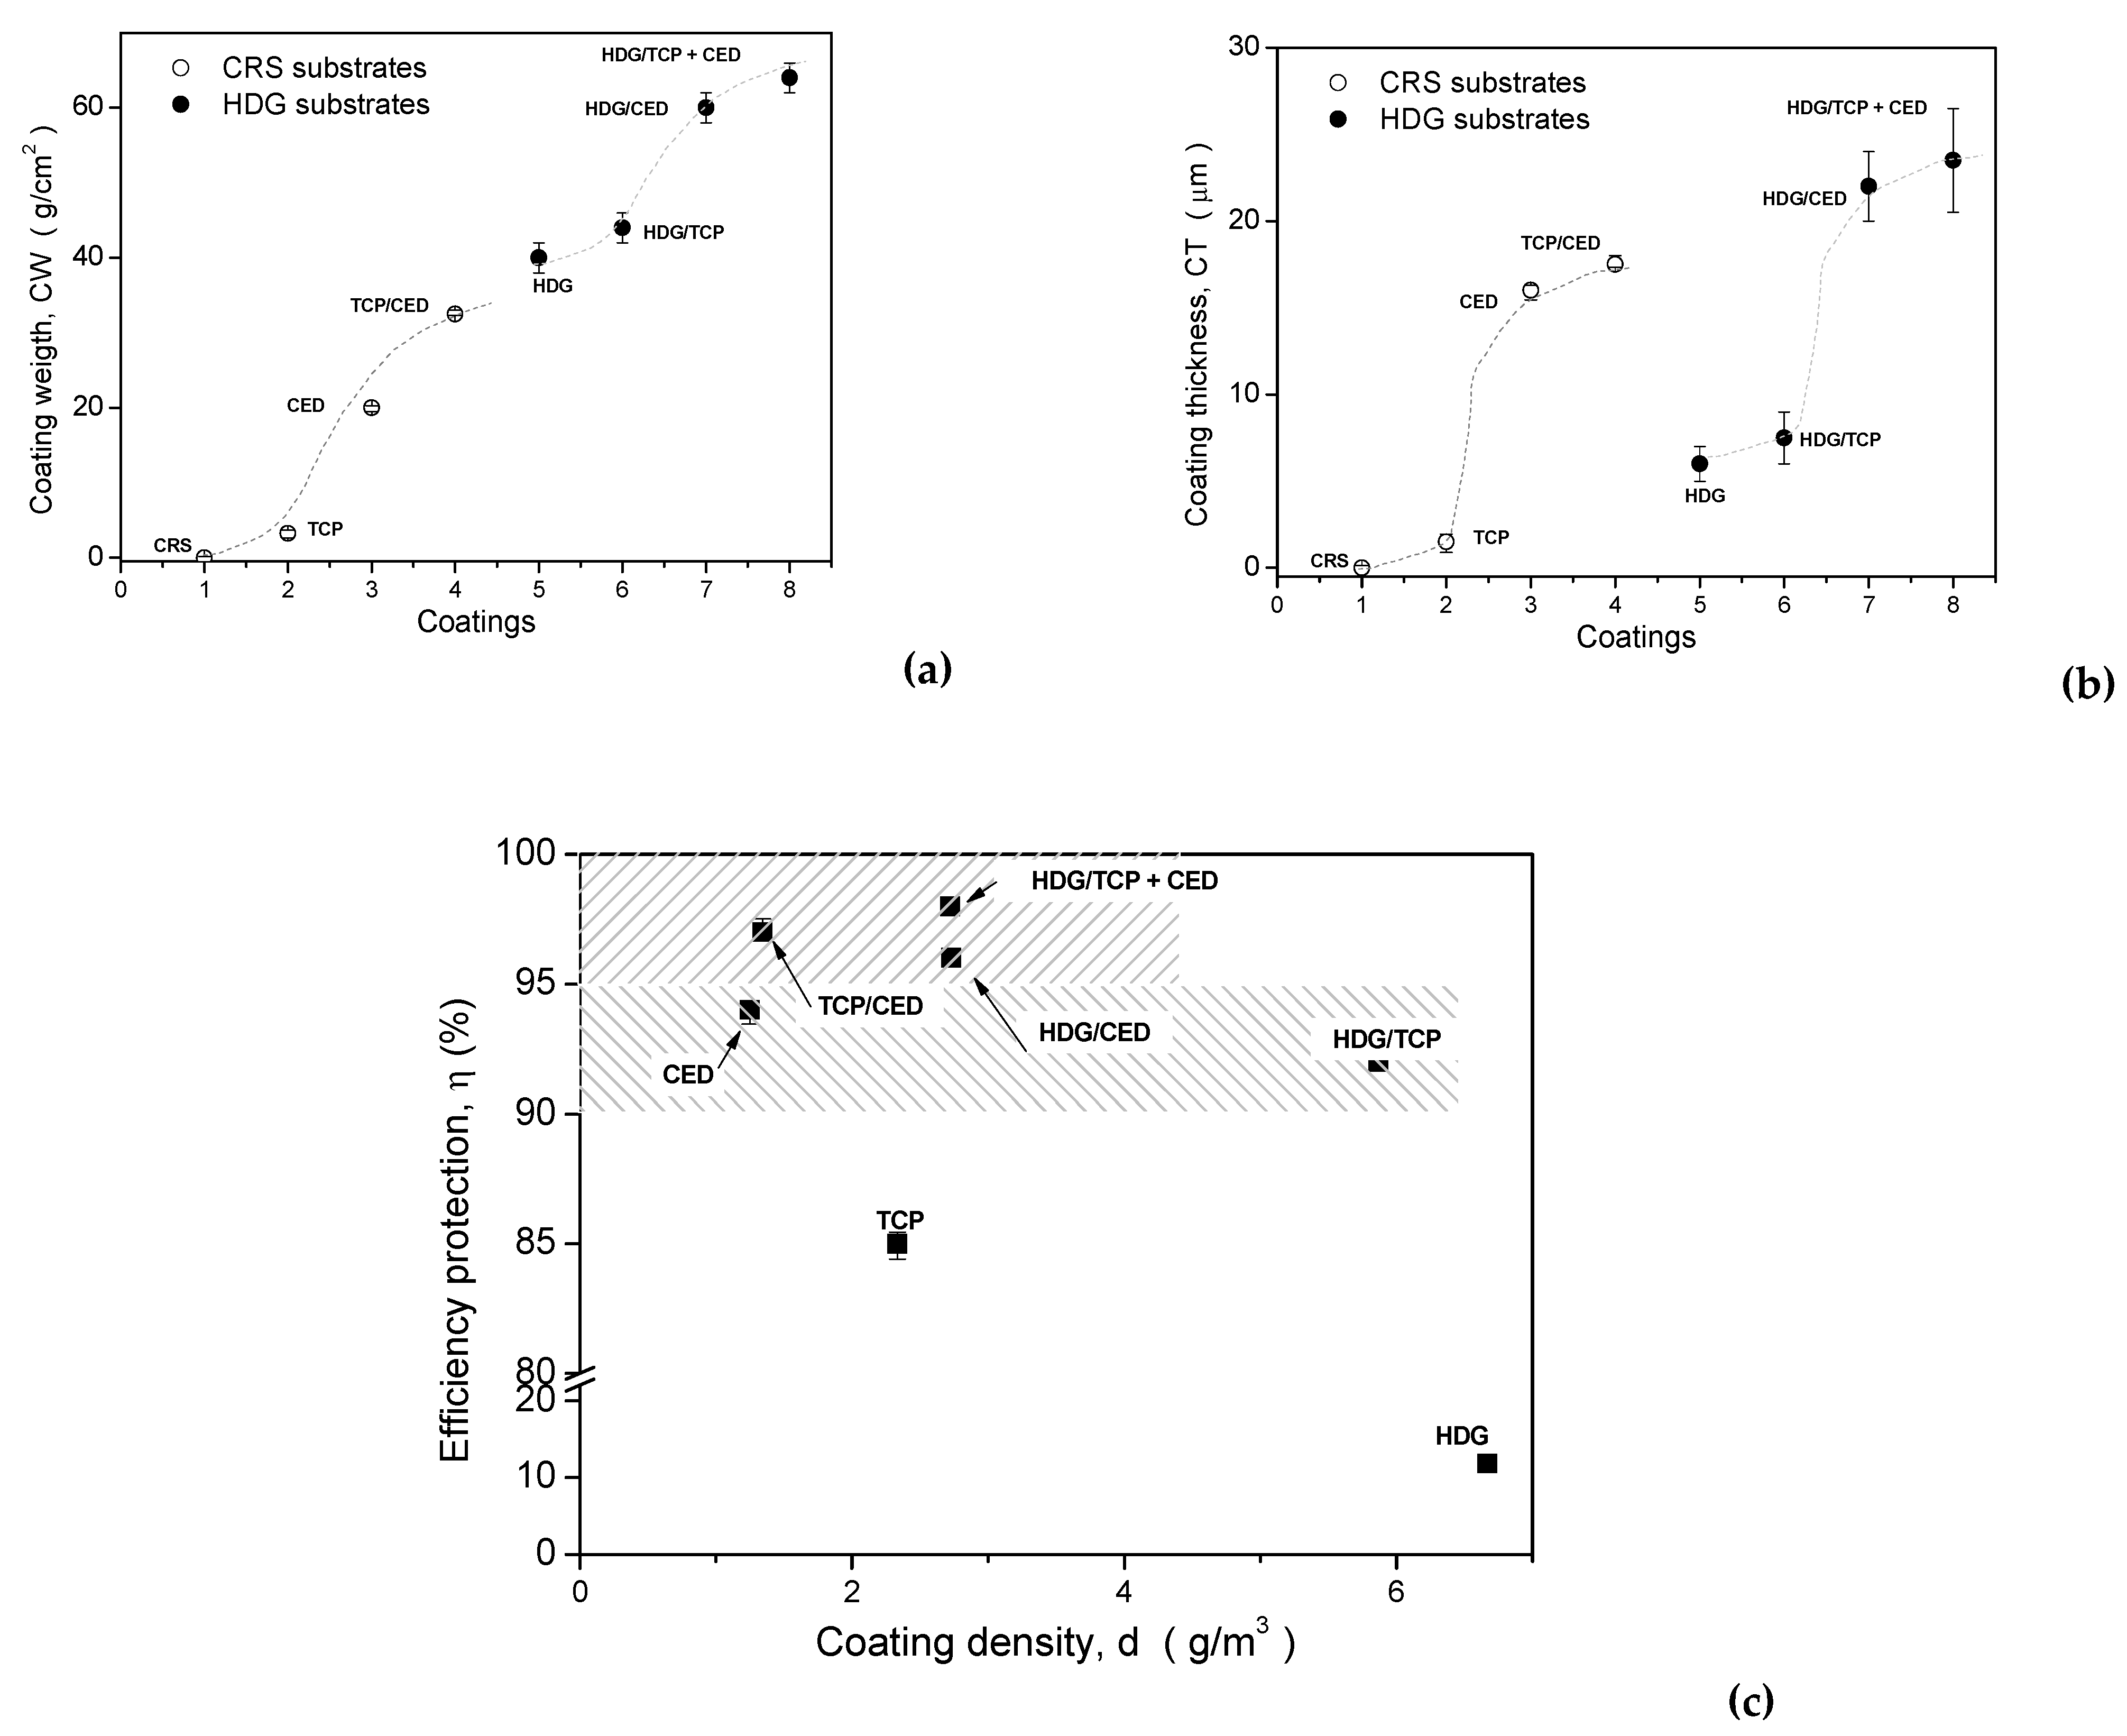
In order to compare and to understand the effect of the average values of coating weight (in g/m
2) and the coating thickness (in μm) for each different examined sample, the ratio between the coating weight (CW) and coating thickness (CT) of these values are plotted as depicted in
Figure 14a,
Figure 14b and
Figure 14c, respectively. It is clearly observed that the two distinct kinds of substrates (CRS and HDG) have different ranges of the CW. This is attributed to the fact that the highest CW is that of the HDG layer (~40 g/m
2). Additionally, S-shape type curves characterize the variations between two substrate families. However, different to the CW that exhibited a complementary trend, CT shows intermediate values of the CED and TCP/CED samples, as shown in
Figure 14a,b.
It is remarked that when a CRS sample (substrate) is covered with a TCP layer, its CW is ~2.5 g/m
2, and a CRS covered with an HDG layer has a CW of about 4 g/m
2 and the resulting CT is approximately 1 μm. Based on the aforementioned observations, there is still doubt concerning the cost, protection efficiency, and weight and thickness concatenated. With this, a relative comparison among values of the examined samples considering relative costs with respect to the TCP sample (RC
(TCP)) and its protection efficiency was also relative to the TCP sample (η
(TCP)), as shown in
Table 7. This RC
(TCP)/η
(TCP) parameter was also designated, as X reveals that the highest cost per efficiency is that of the HDG/TCP + CED sample, which has a higher operational cost and quantities of deposited layers, as expected.
Figure 14c depicts the results of efficiency protection (η) with coating density (d). This is calculated considering that (CW/CT) represents the coating density (in g/cm
3). When η is plotted as a function of d, three distinct ranges are characterized. First it is characterized with an efficiency higher than 95% and a density lower than 4 g/cm
3. With this, only three coating systems are potentially selected, i.e., the HDG/TCP + CED, HDG/CED and the TCP + CED samples. This indicates that no HDG layer ever provides a better efficiency protection with a lower density. From those examined samples, two coating systems demonstrate an efficiency between 95% and 90%, while the other two have an efficiency lower than 90%.
The X/d
(TCP) parameter is also analyzed, which refers to an analysis concerning the relative cost per efficiency protection per relative coating density, as is also shown in
Table 7. When X/d
(TCP) values are analyzed, it is revealed that the two lowest values are those of the HDG/TCP + CED and HDG/CED coating system samples. However, considering possible error ranges in all involved parameters, it is interestingly verified that the TCP + CED sample has the same order of magnitude (i.e., 0.11 and 0.13).
Based on the attained results, the roles of Zn phosphate and HDG on electrochemical behaviors of the coating systems containing these layers are confirmed. It was found that by only using the TCP layer and the HDG layer, the best protection is not reached. A similar conclusion is provided when only the CED layer is used. However, when the TCP layer is deposited on an HDG layer followed by a CED layer, from the investigated coating systems, the highest efficiency is demonstrated (i.e., HDG/TCP + CED). This efficiency is followed by that sample without HDG coating but containing TCP + CED, which also demonstrates the great importance of the CED layer. However, this unique layer or concatenated HDG layer has not provided good results. It was also found that the porous electrode behavior also has a remarked importance to predict electrochemical responses and to help an adequate selection of the coating systems. A porous electrode behavior does not mean a deleterious aspect as it is commonly associated with planar electrode behavior. It seems that the thicker deposited layer is a crucial factor to constitute only a planar electrode behavior, but it is not thick enough. The nature and morphology of the deposited layer also has an essential importance. For instance, the HDG/CED coating has higher thicknesses than the TCP + CED coating system (i.e., 22 μm against 17.9 μm), but the HDG/CED has efficiency protection in the same order of magnitude (96 and 97%, respectively). Moreover, it is concluded that only samples containing HDG associated with an CED layer provide only planar electrode behavior, which suggests that a thickness greater than 22 μm provides predominant planar behavior to predict the electrochemical behavior of the examined coating systems. Similar results have also been attained when Ramezanzadeh et al. [
24] have investigated coating systems with thicknesses reaching more than 60 μm (involving phosphate, CED and primer layers). Jegdic et al. [
47] have also reported only planar electrode behavior when coating systems higher than 50 μm are investigated.
This is independent of the immersion period examined. Only after more than 128 days of an immersed period (into NaCl solution) does the sample slightly indicate both porous and planar electrode behaviors concatenated, i.e., a straight line at 45° in the Nyquist plot in a high frequency domain is characterized [
47]. This is surely associated with the fact that polymeric coating has been considerably deteriorated. This is due to the decreased cross-link density and holes provoked on the surface that permit the substrate to be severely attacked [
24]. In these two aforementioned studies [
24,
47], the primer layer is more intimately associated with mechanical properties than the corrosion behavior, and this with the CED layer deposited on the TCP layer. Furthermore, a better adhesion of the CED layer is attained when a phosphate layer is applied [
24,
47].


