
Indoor Air Quality Measurements in Enclosed Spaces Combining Activities with Different Intensity and Environmental Conditions

 ,
,  , and
, and
Abstract
:1. Introduction
2. Materials and Methods
2.1. Measurement Definition
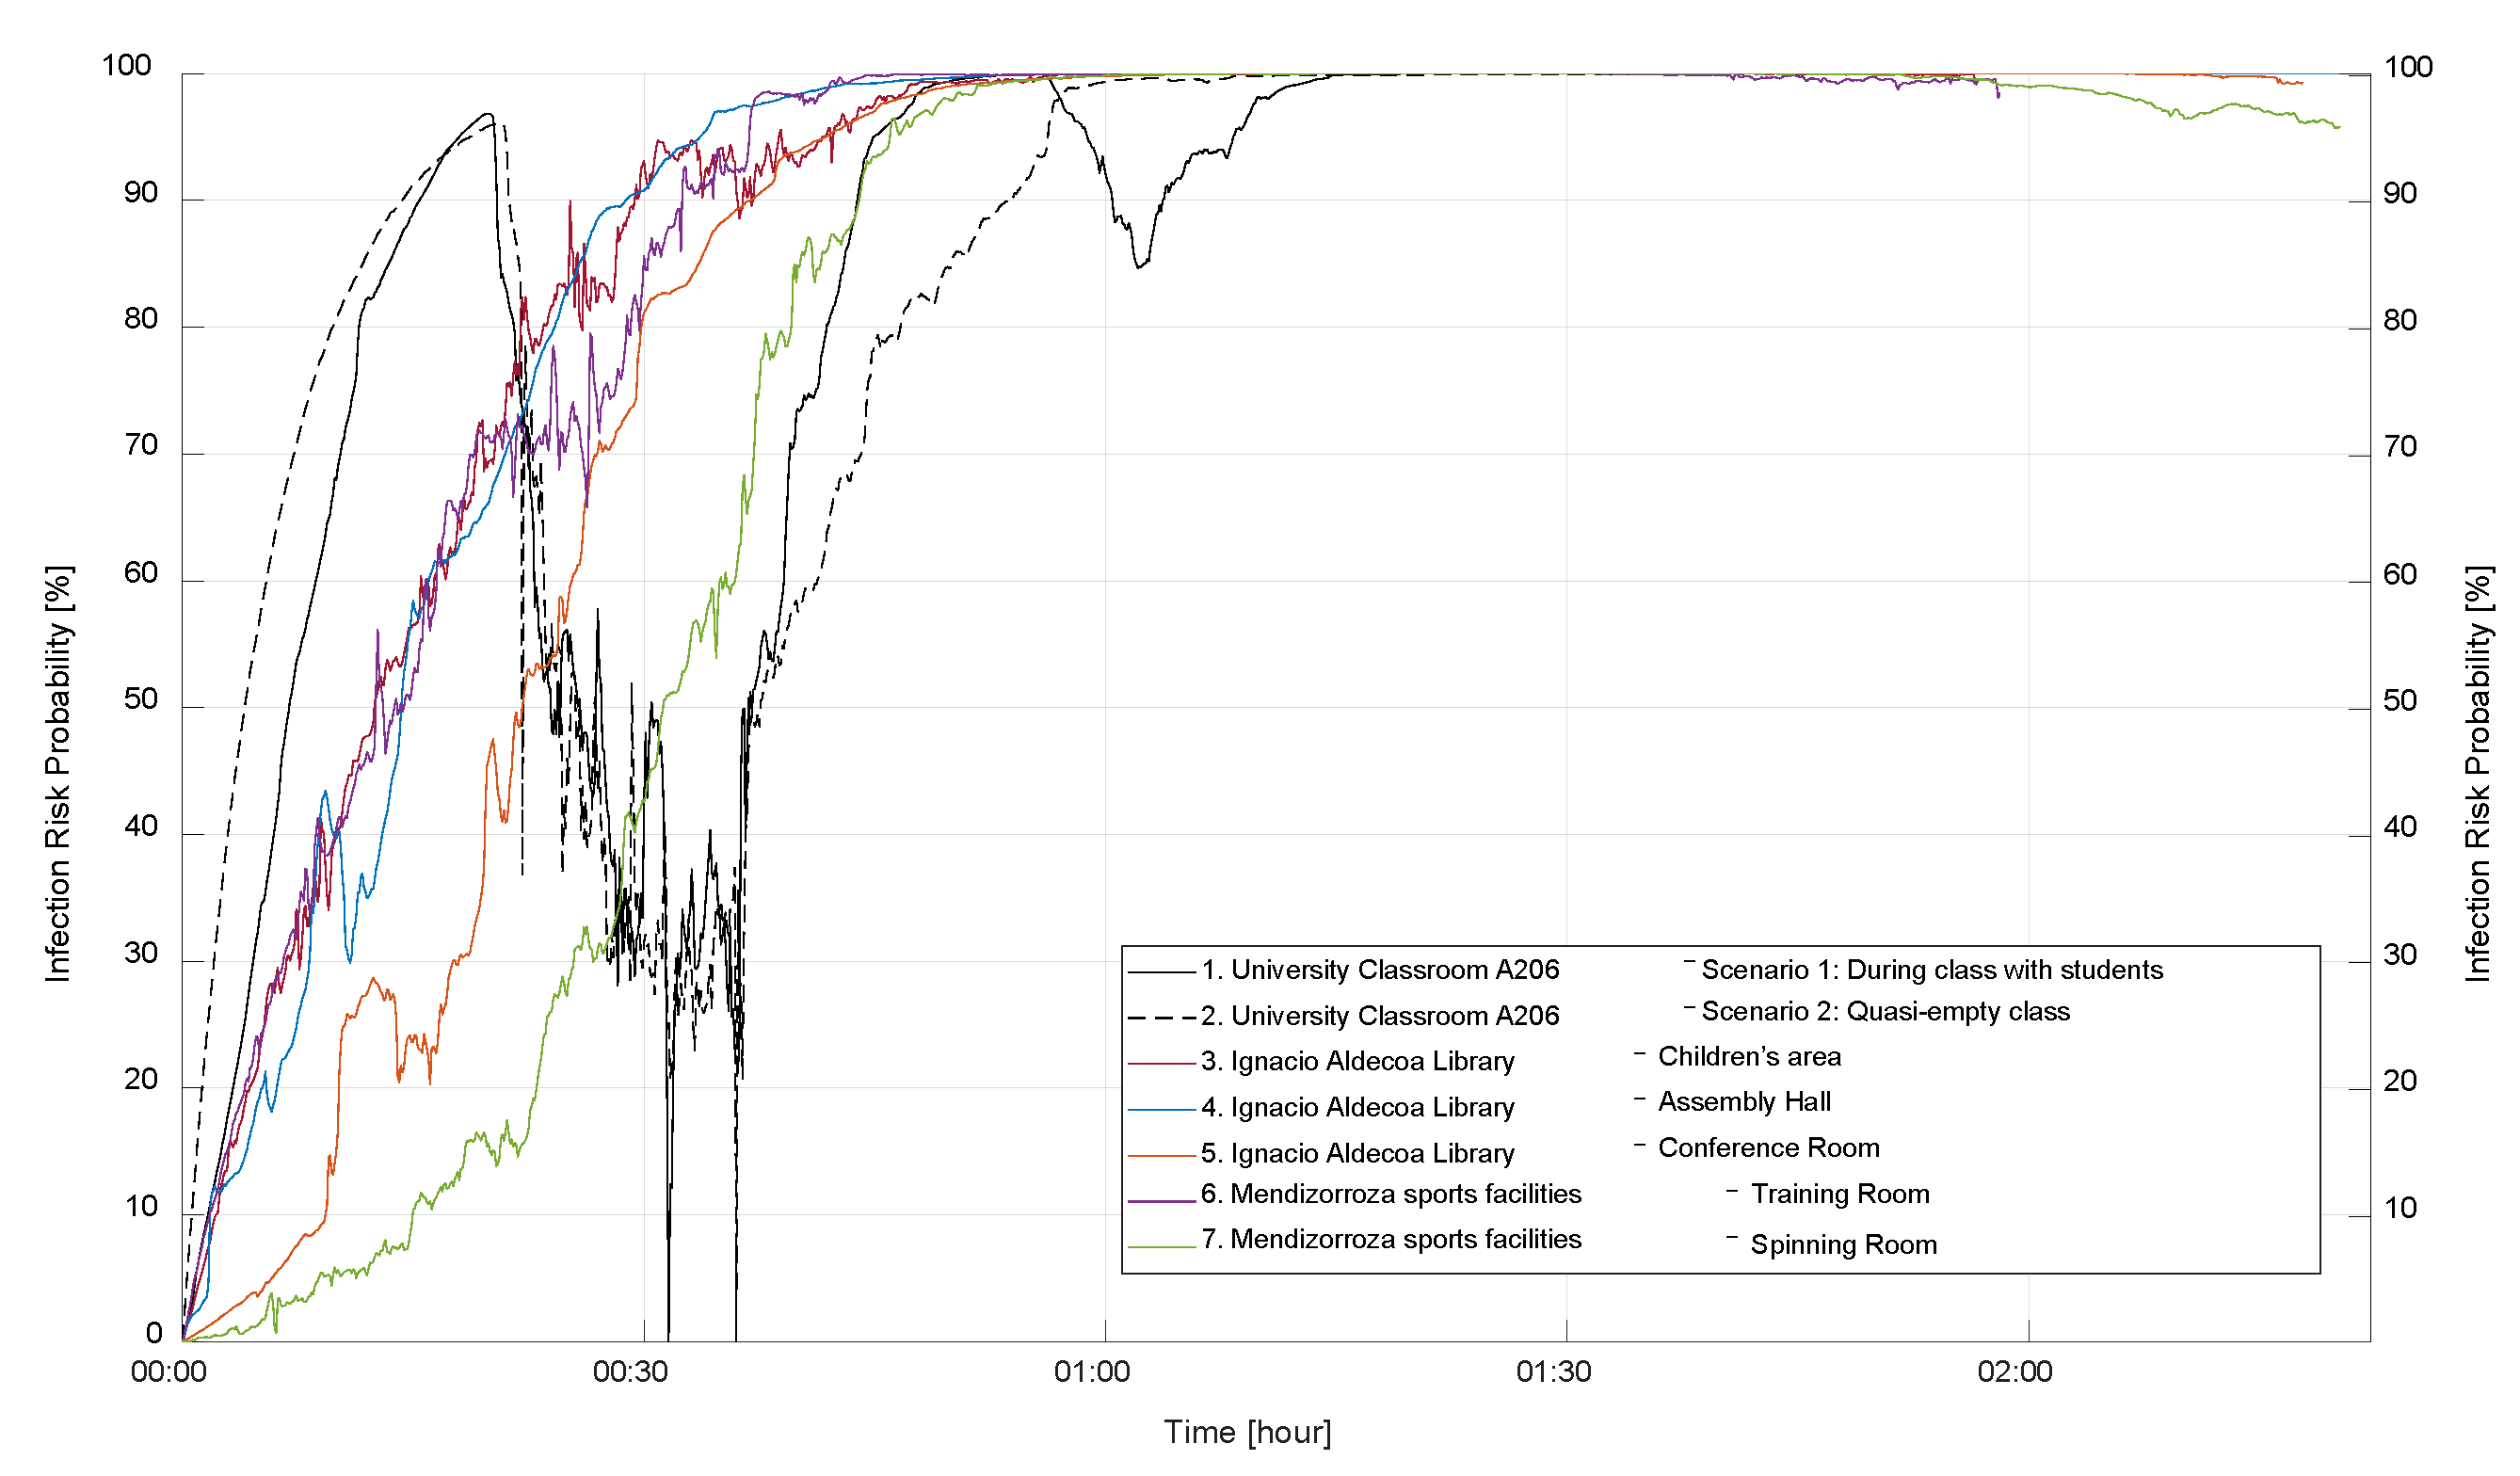
- University Classroom A206–Scenario 1: During class with students.
- University Classroom A206–Scenario 2: Quasi-empty class.
- Ignacio Aldecoa Library—Children’s area.
- Ignacio Aldecoa Library—Assembly Hall
- Ignacio Aldecoa Library—Conference Room.
- Mendizorroza sports facilities—Training Room
- Mendizorroza sports facilities—Spinning Room
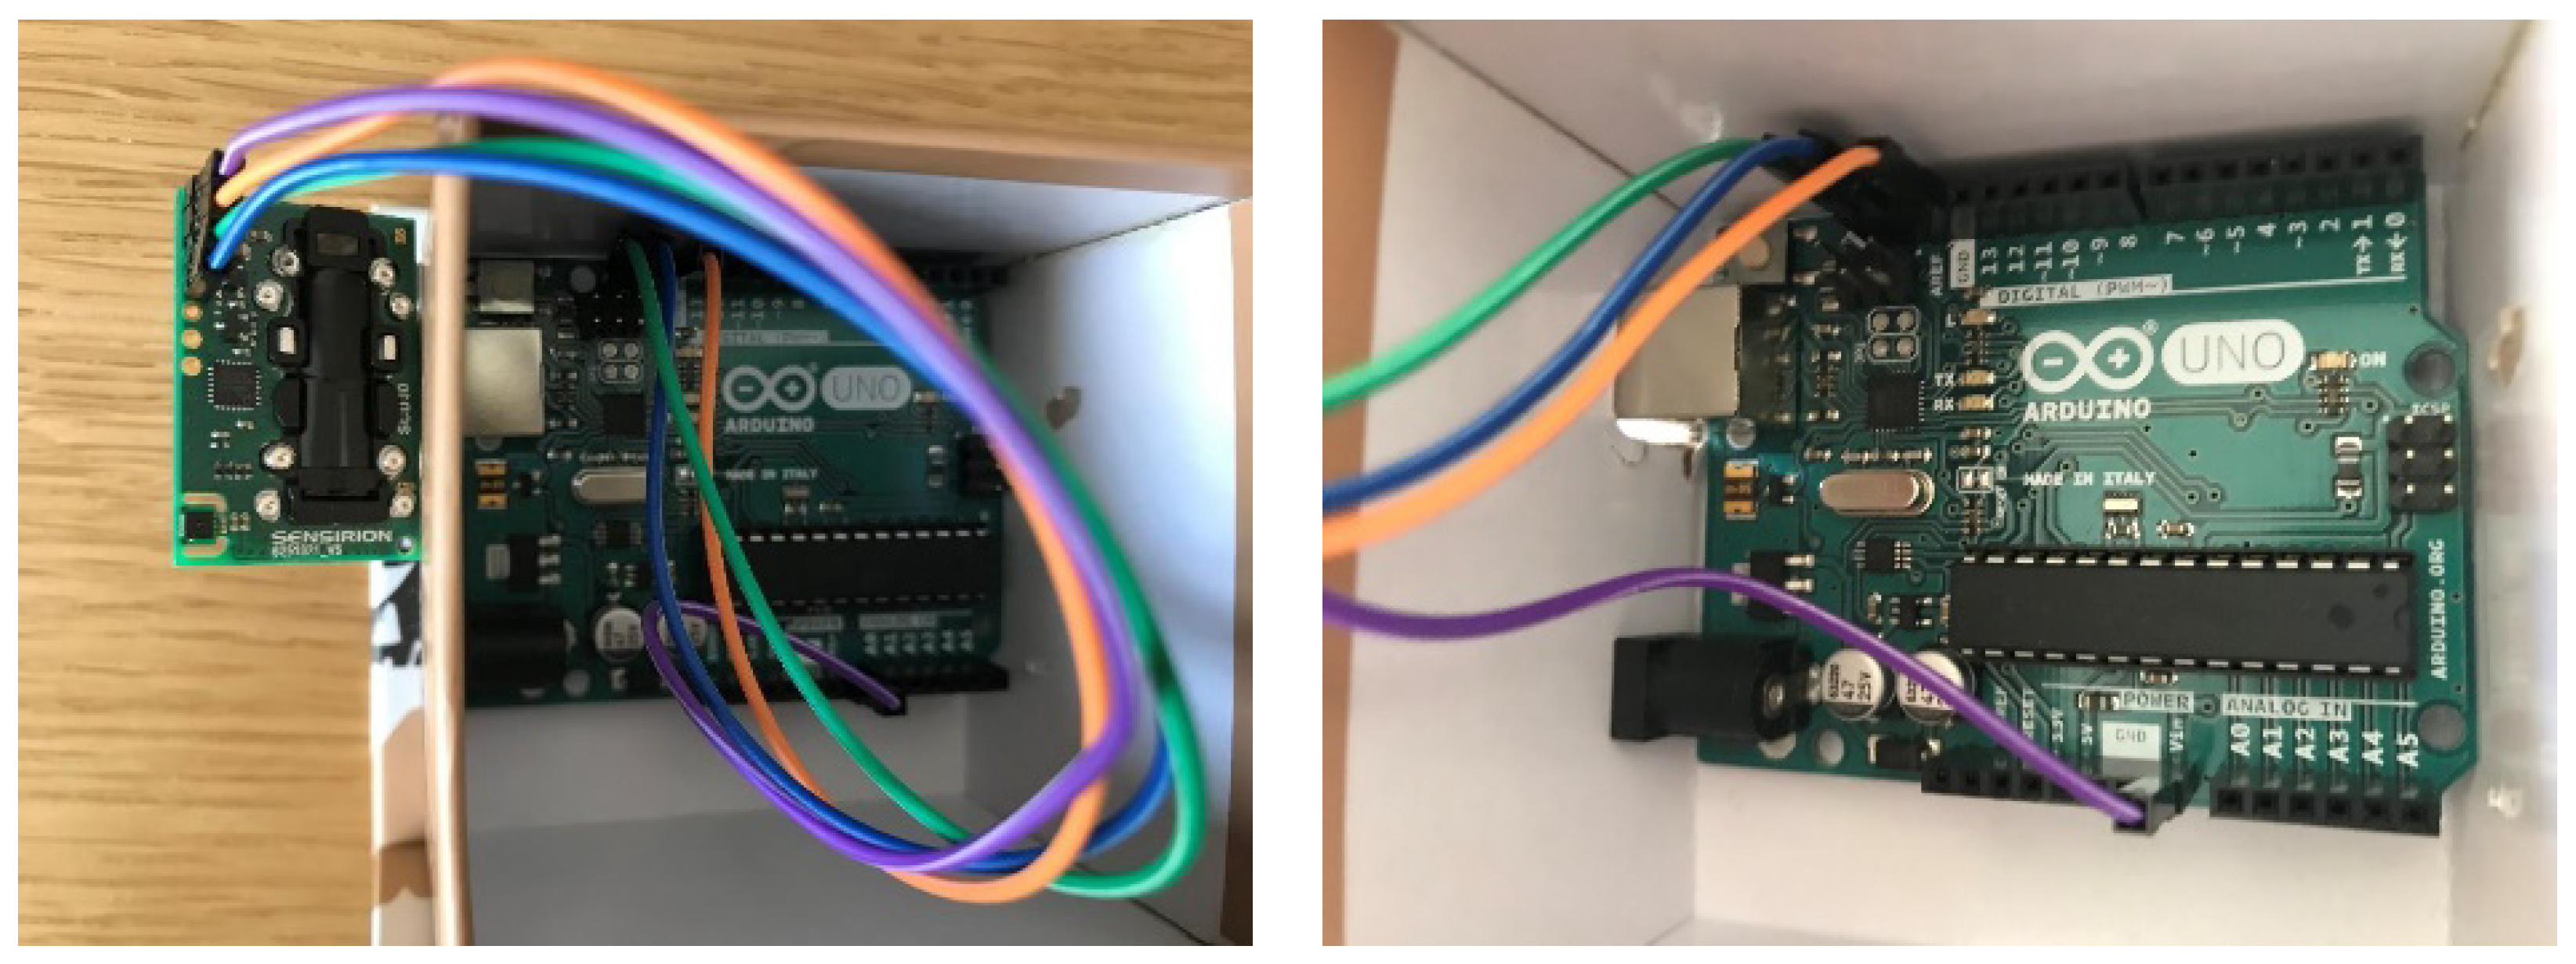
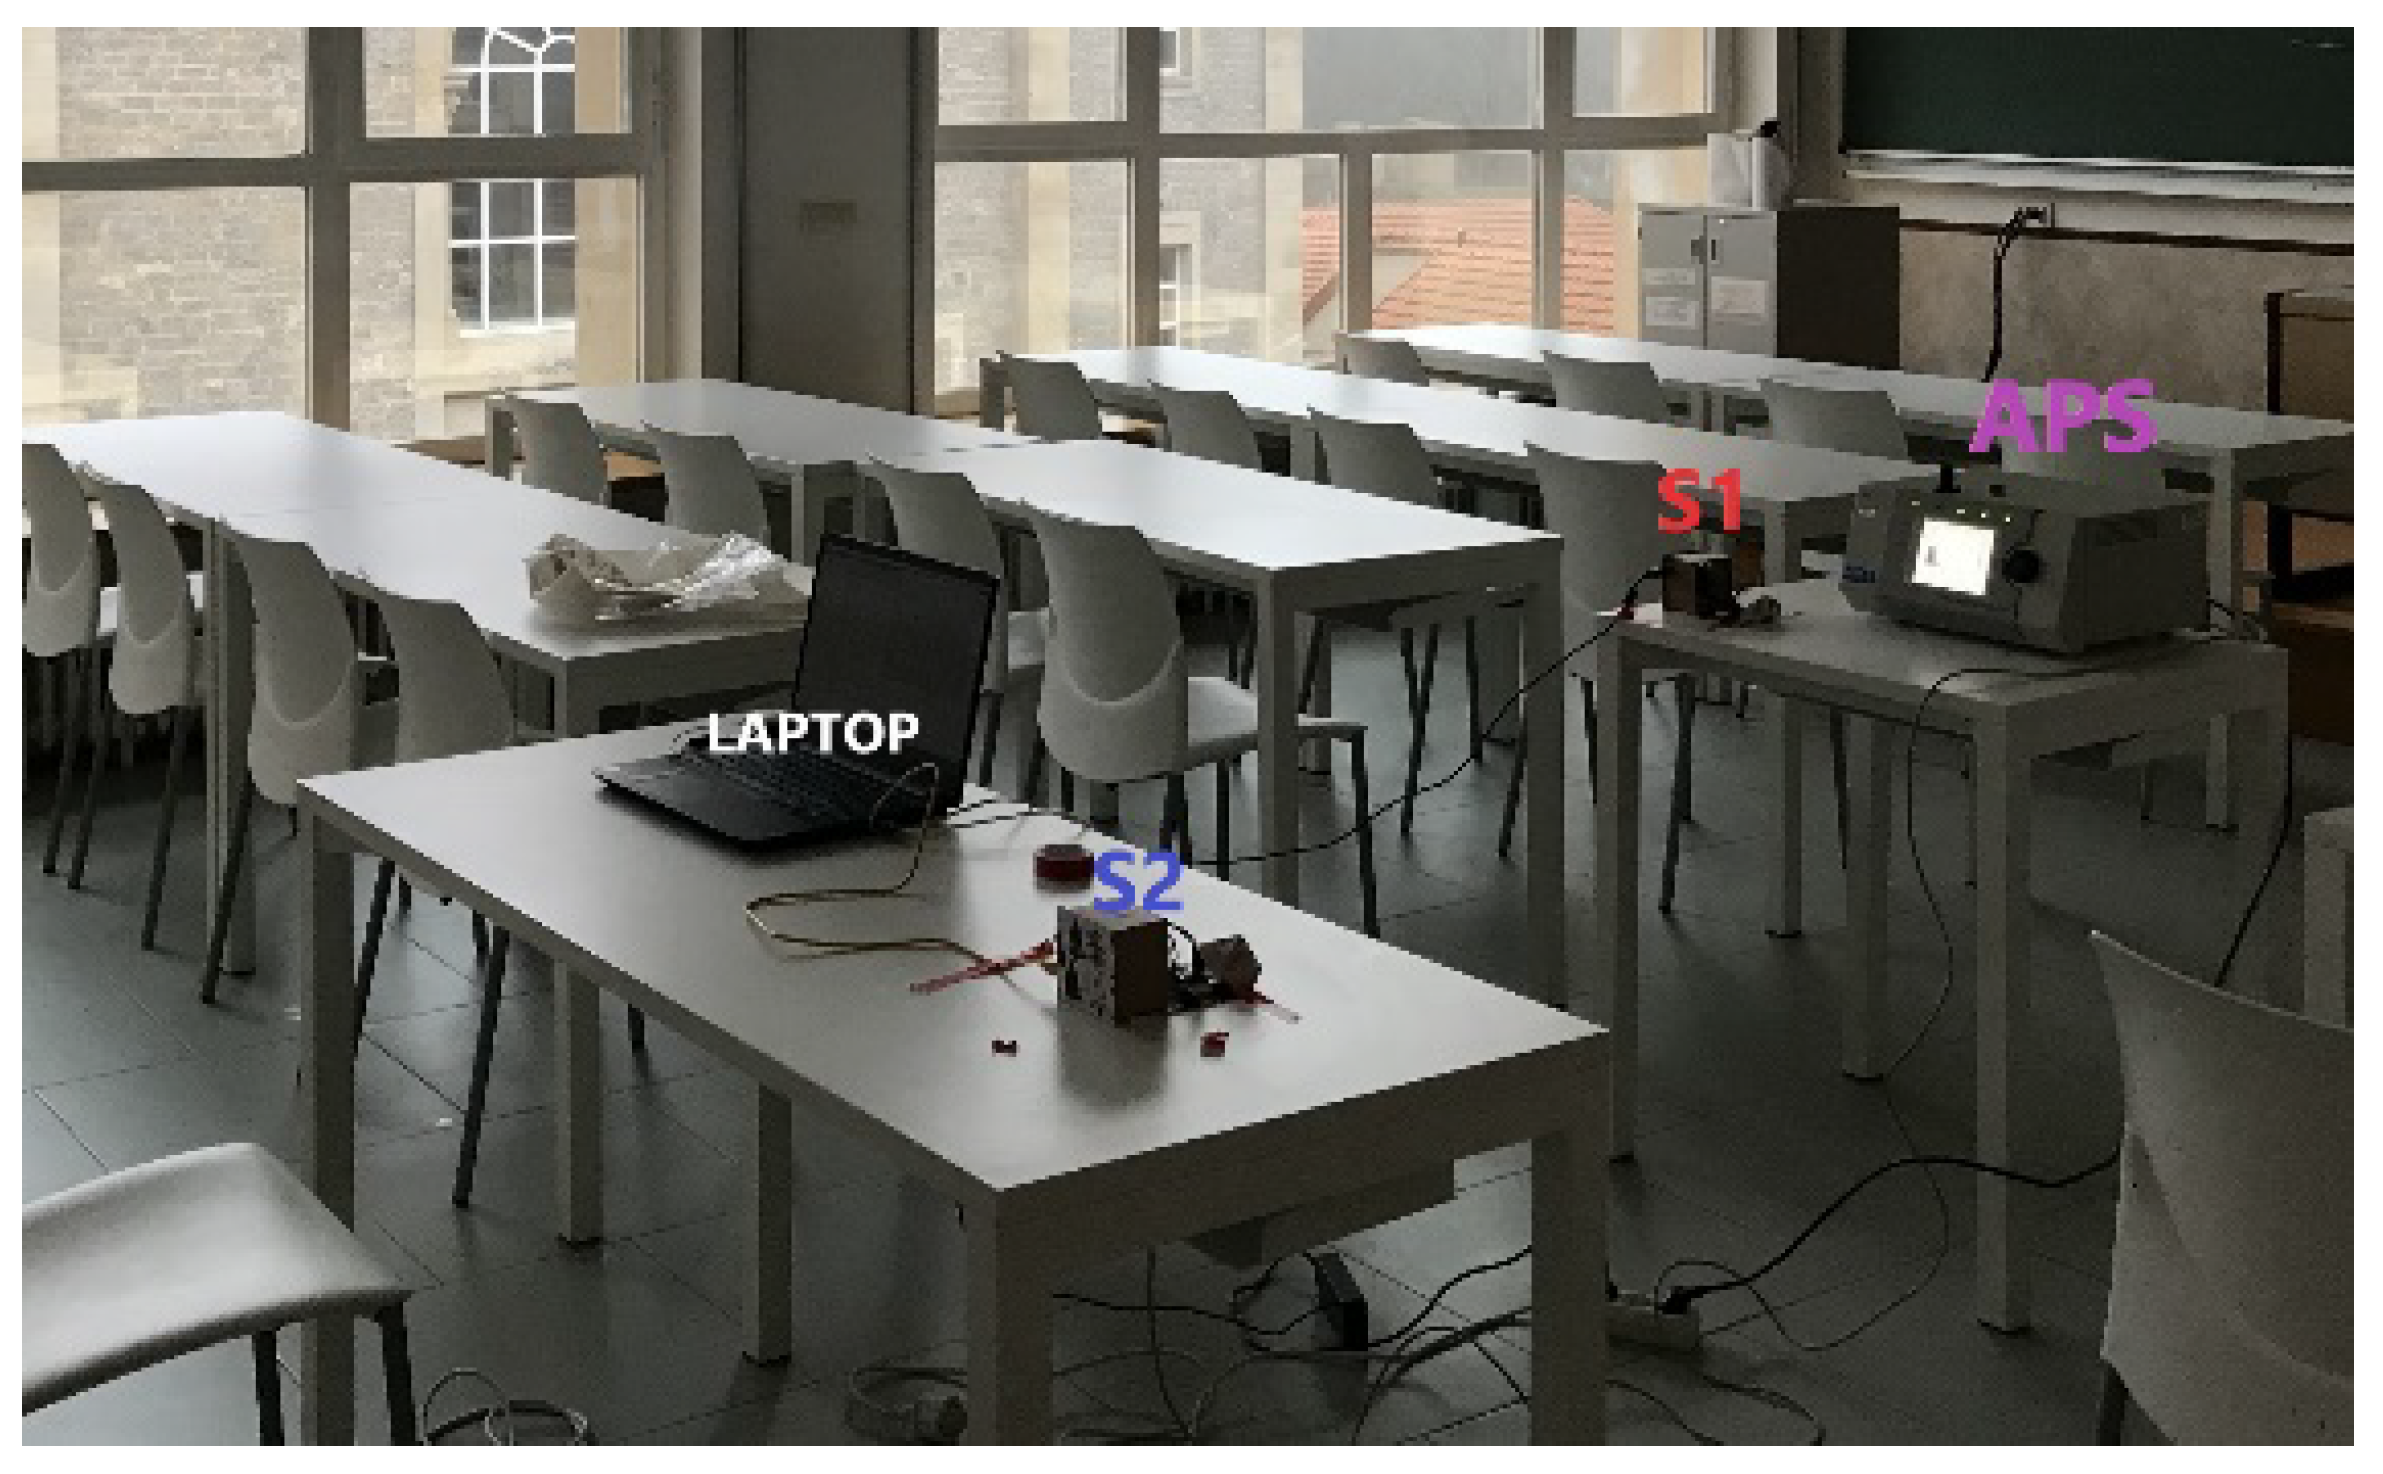
2.2. Instrumentation and Methodology
2.3. Measurement Repeateability Limitations
3. Results
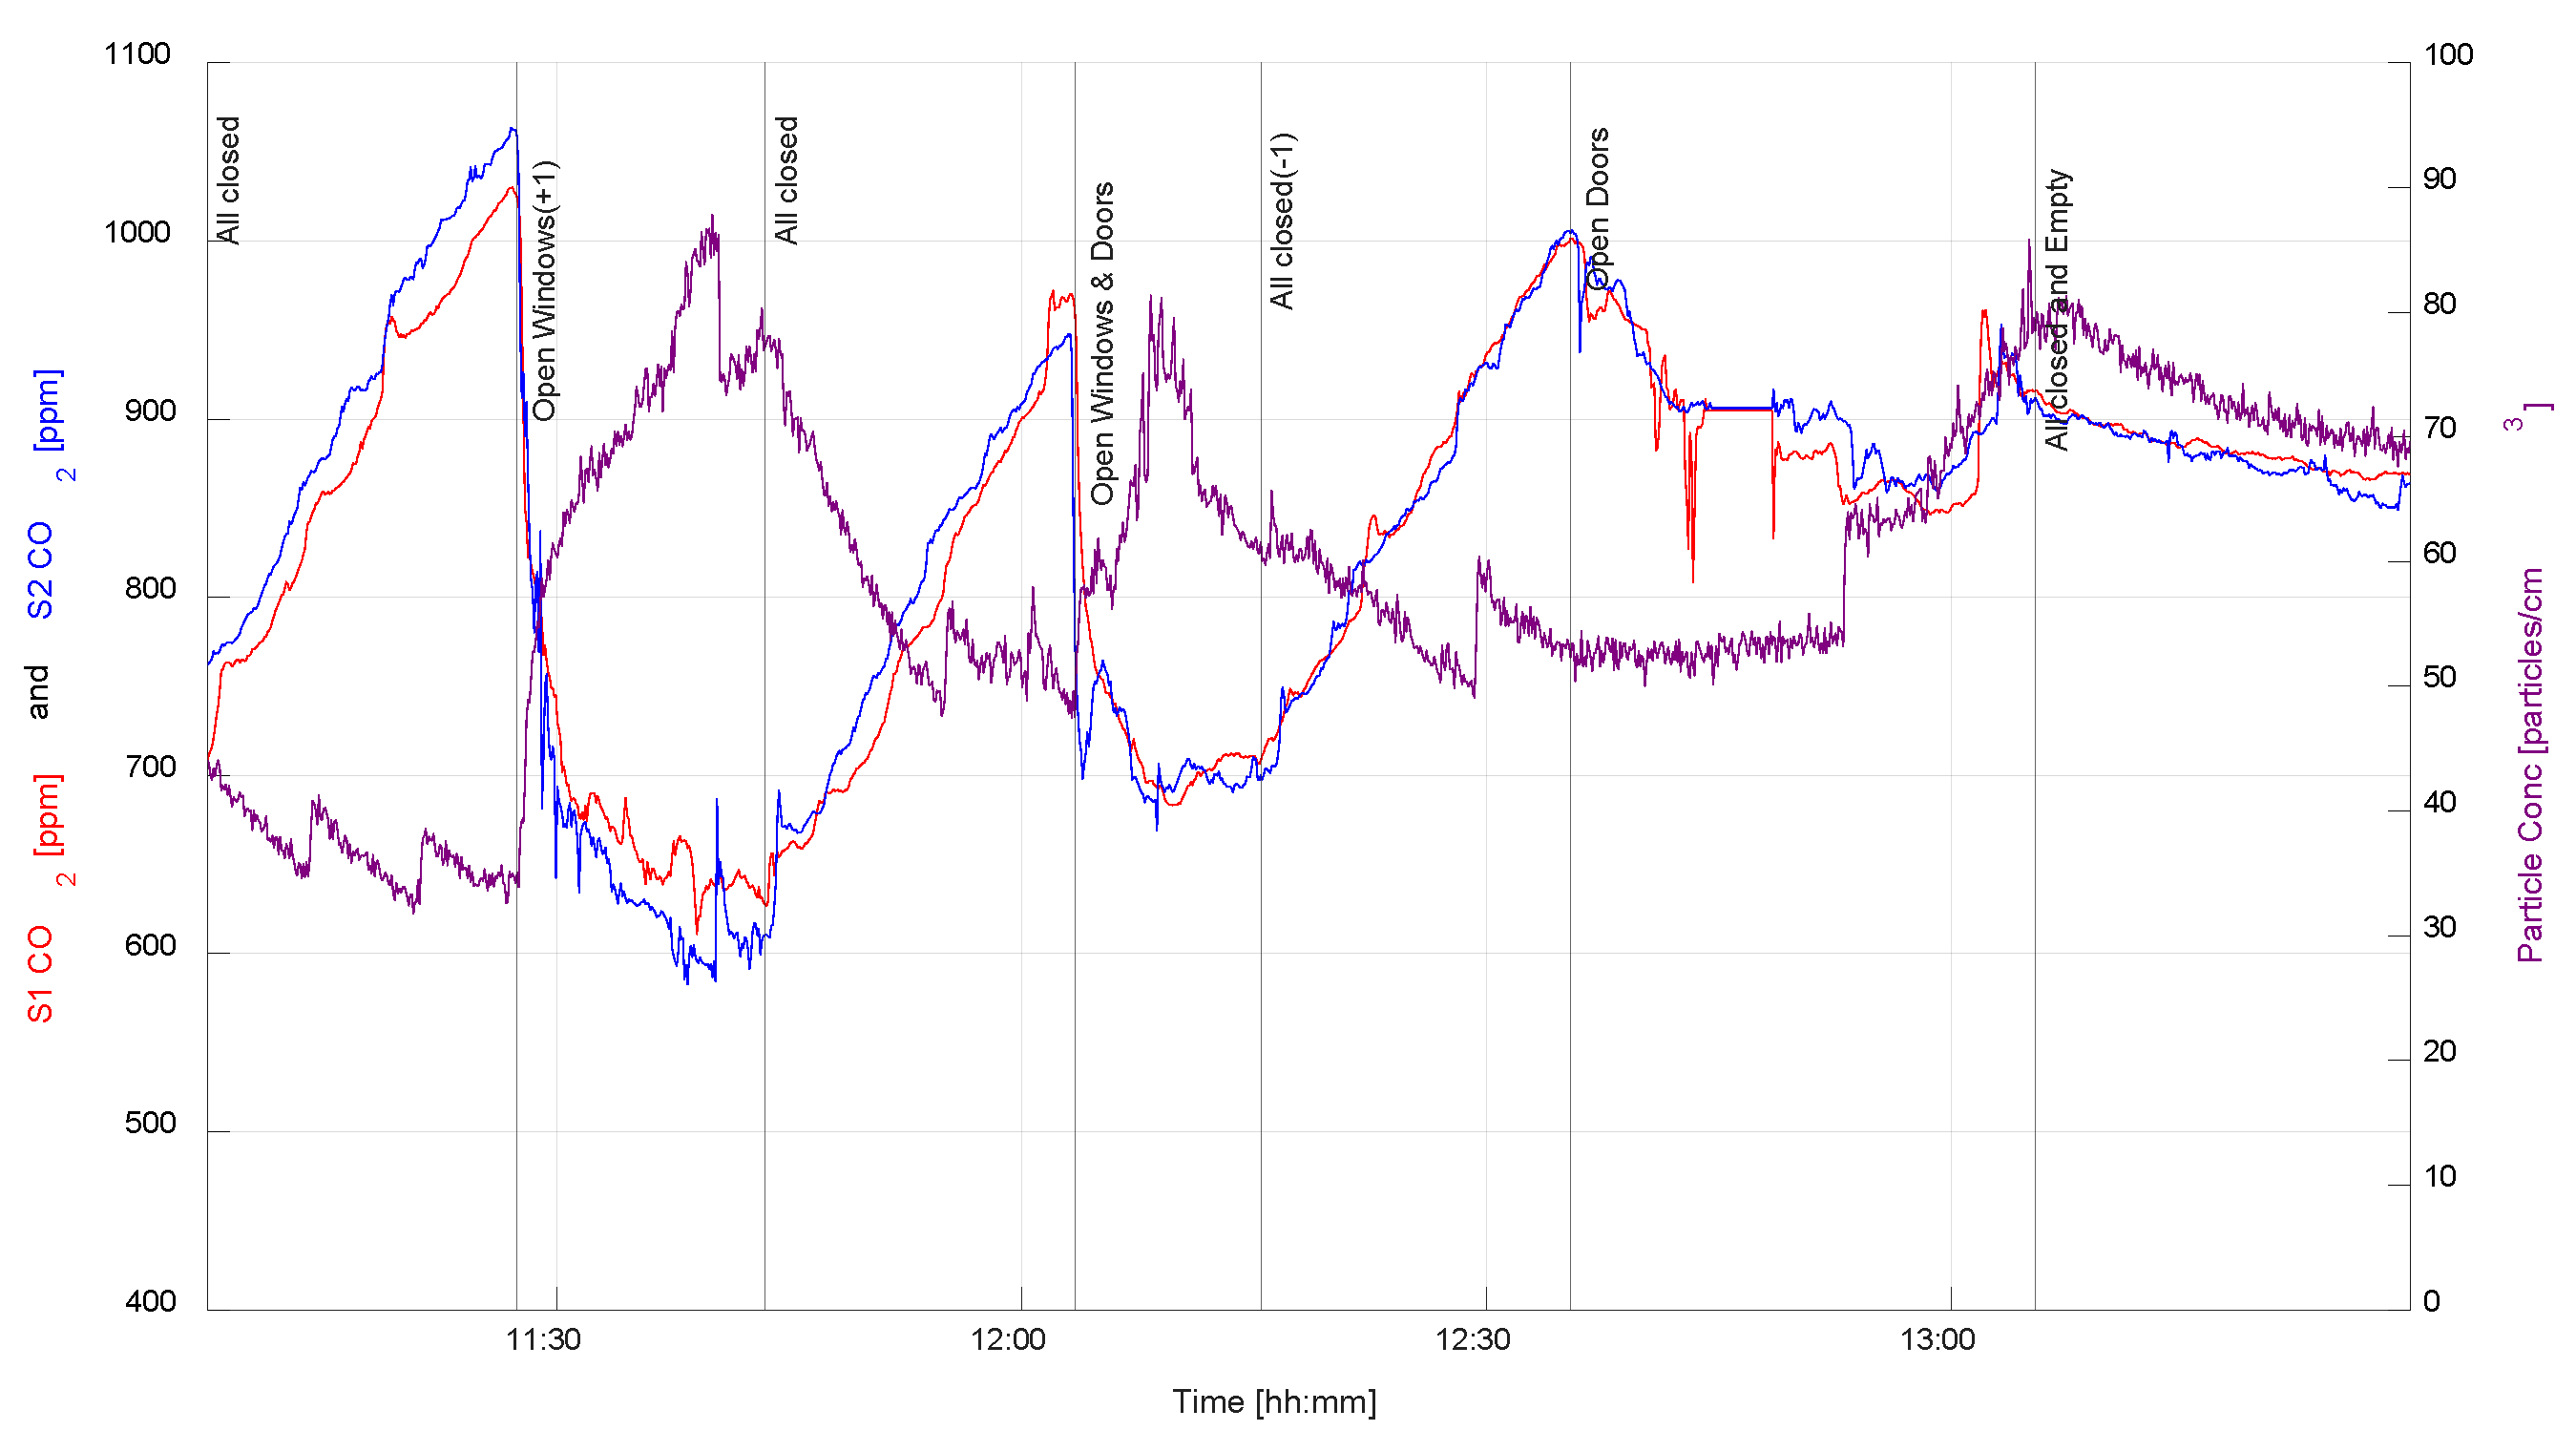
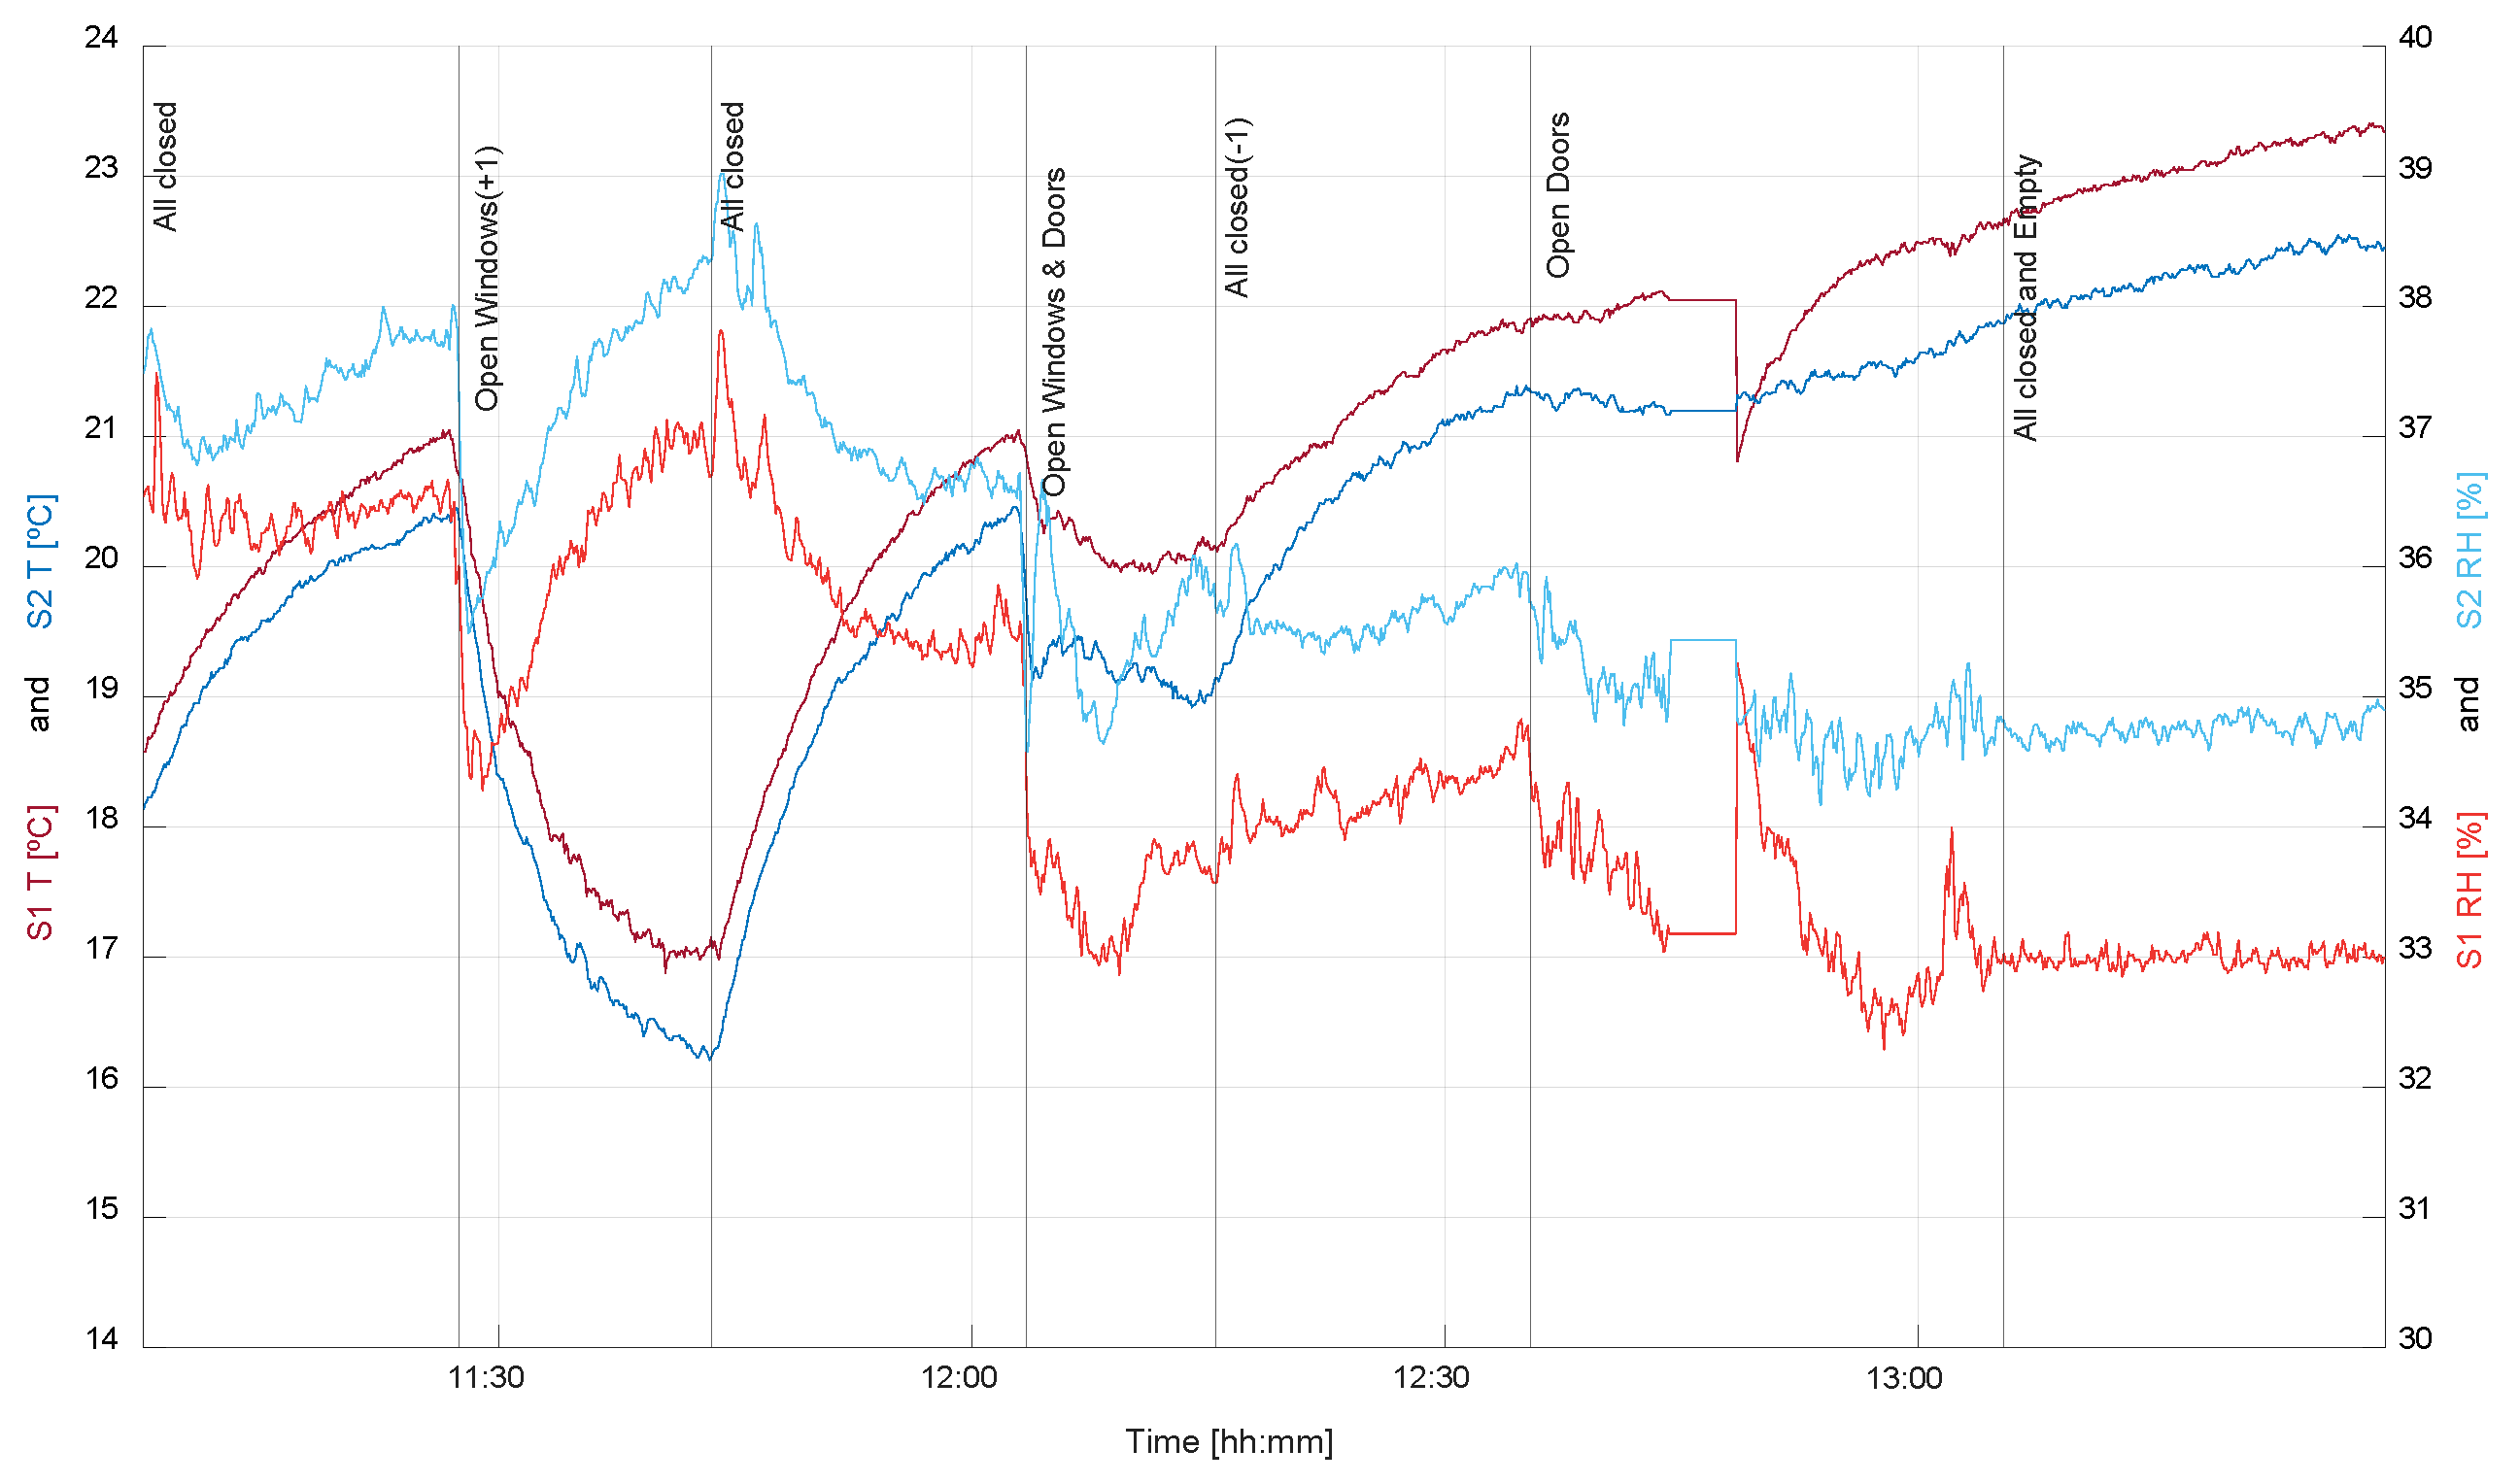
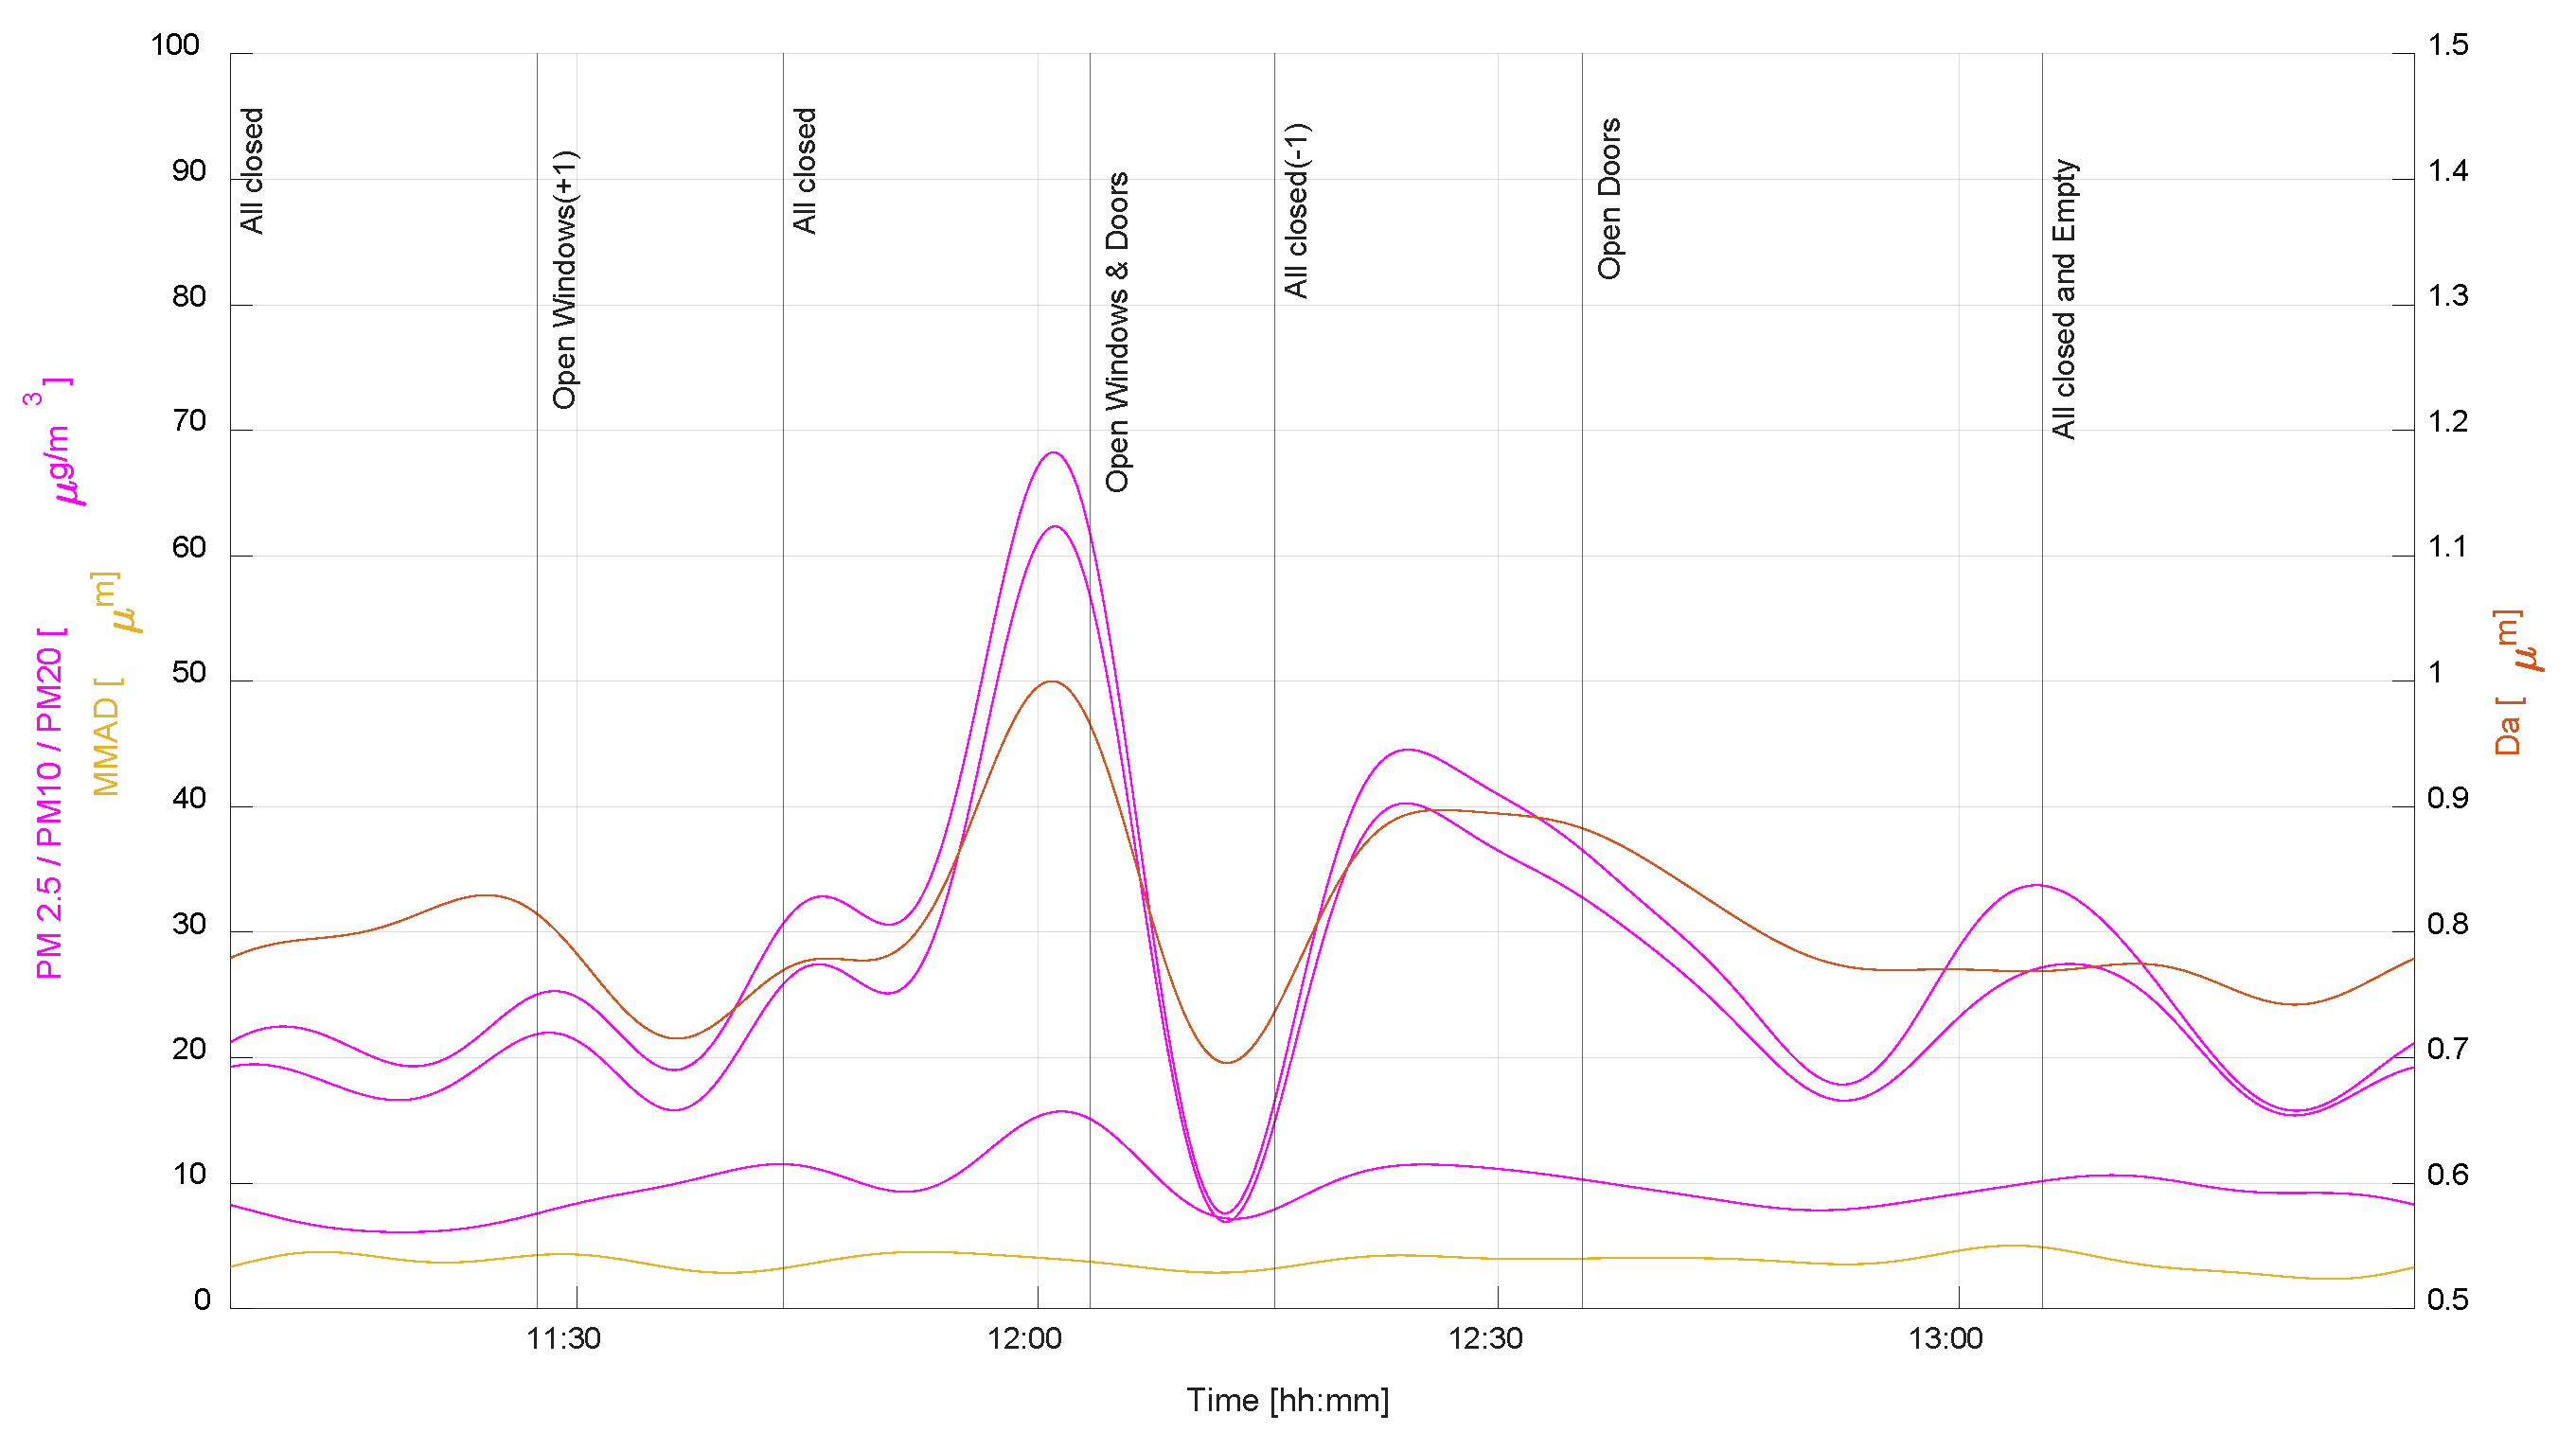
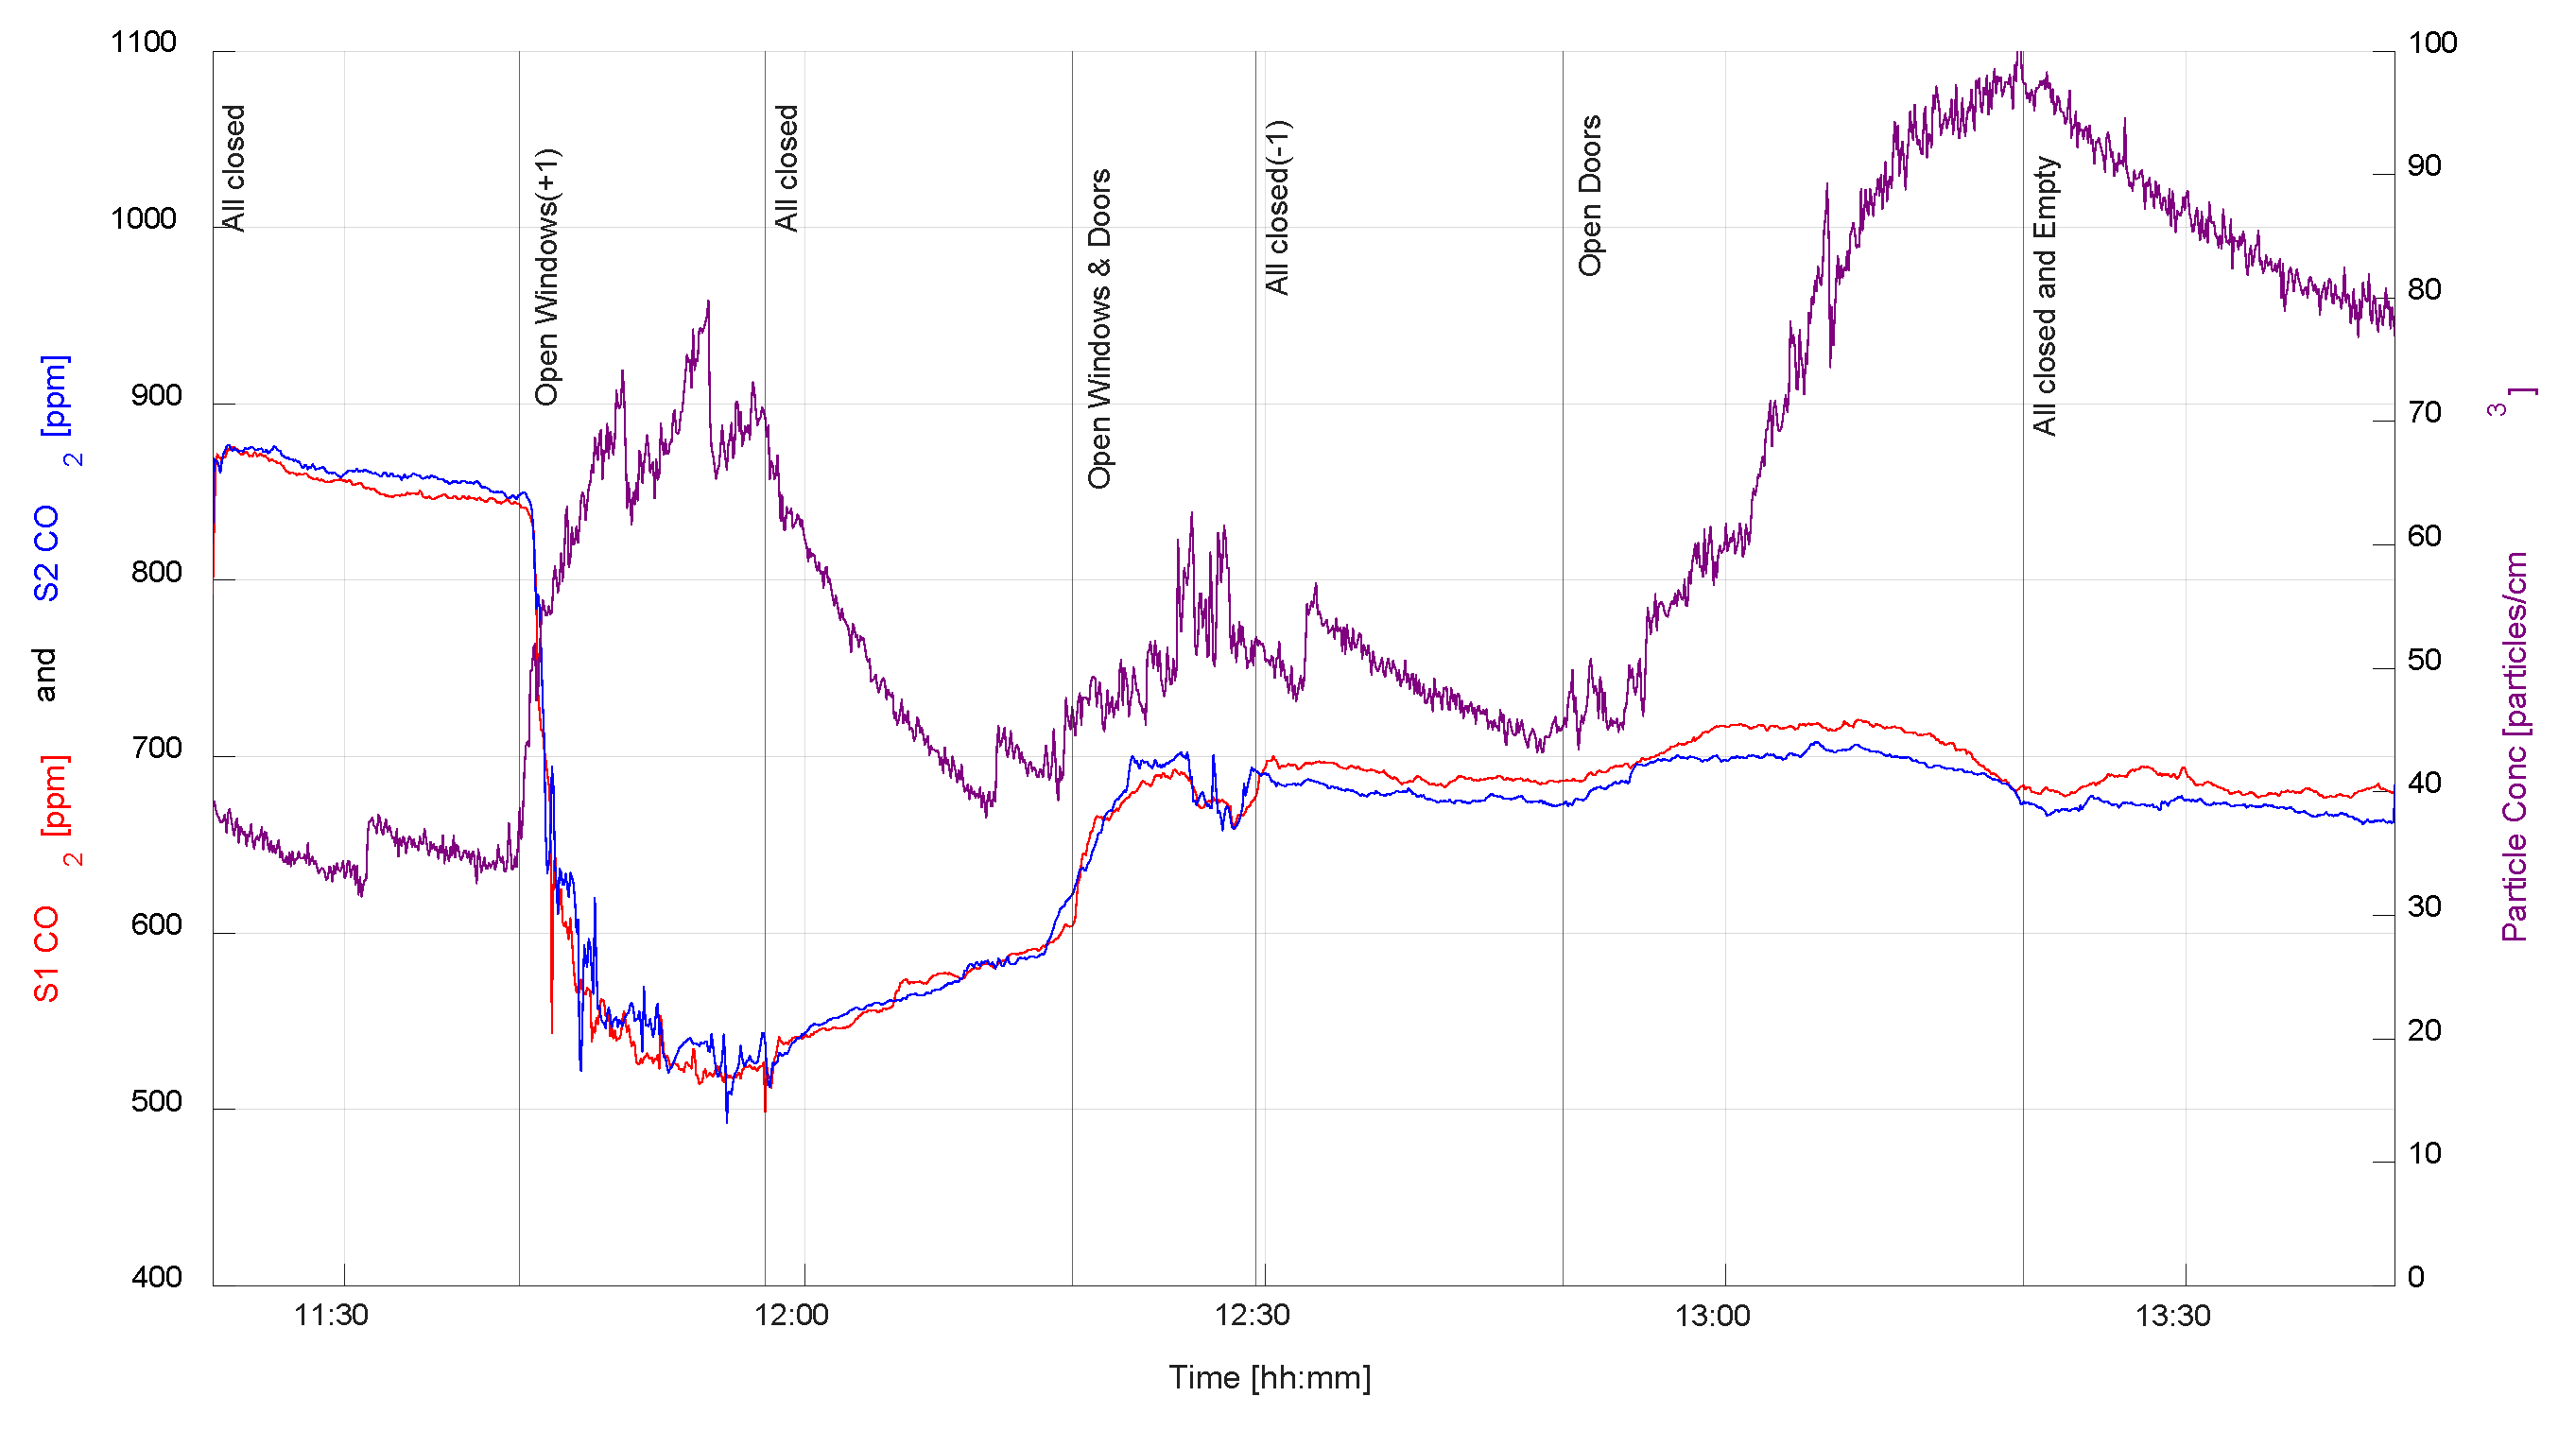
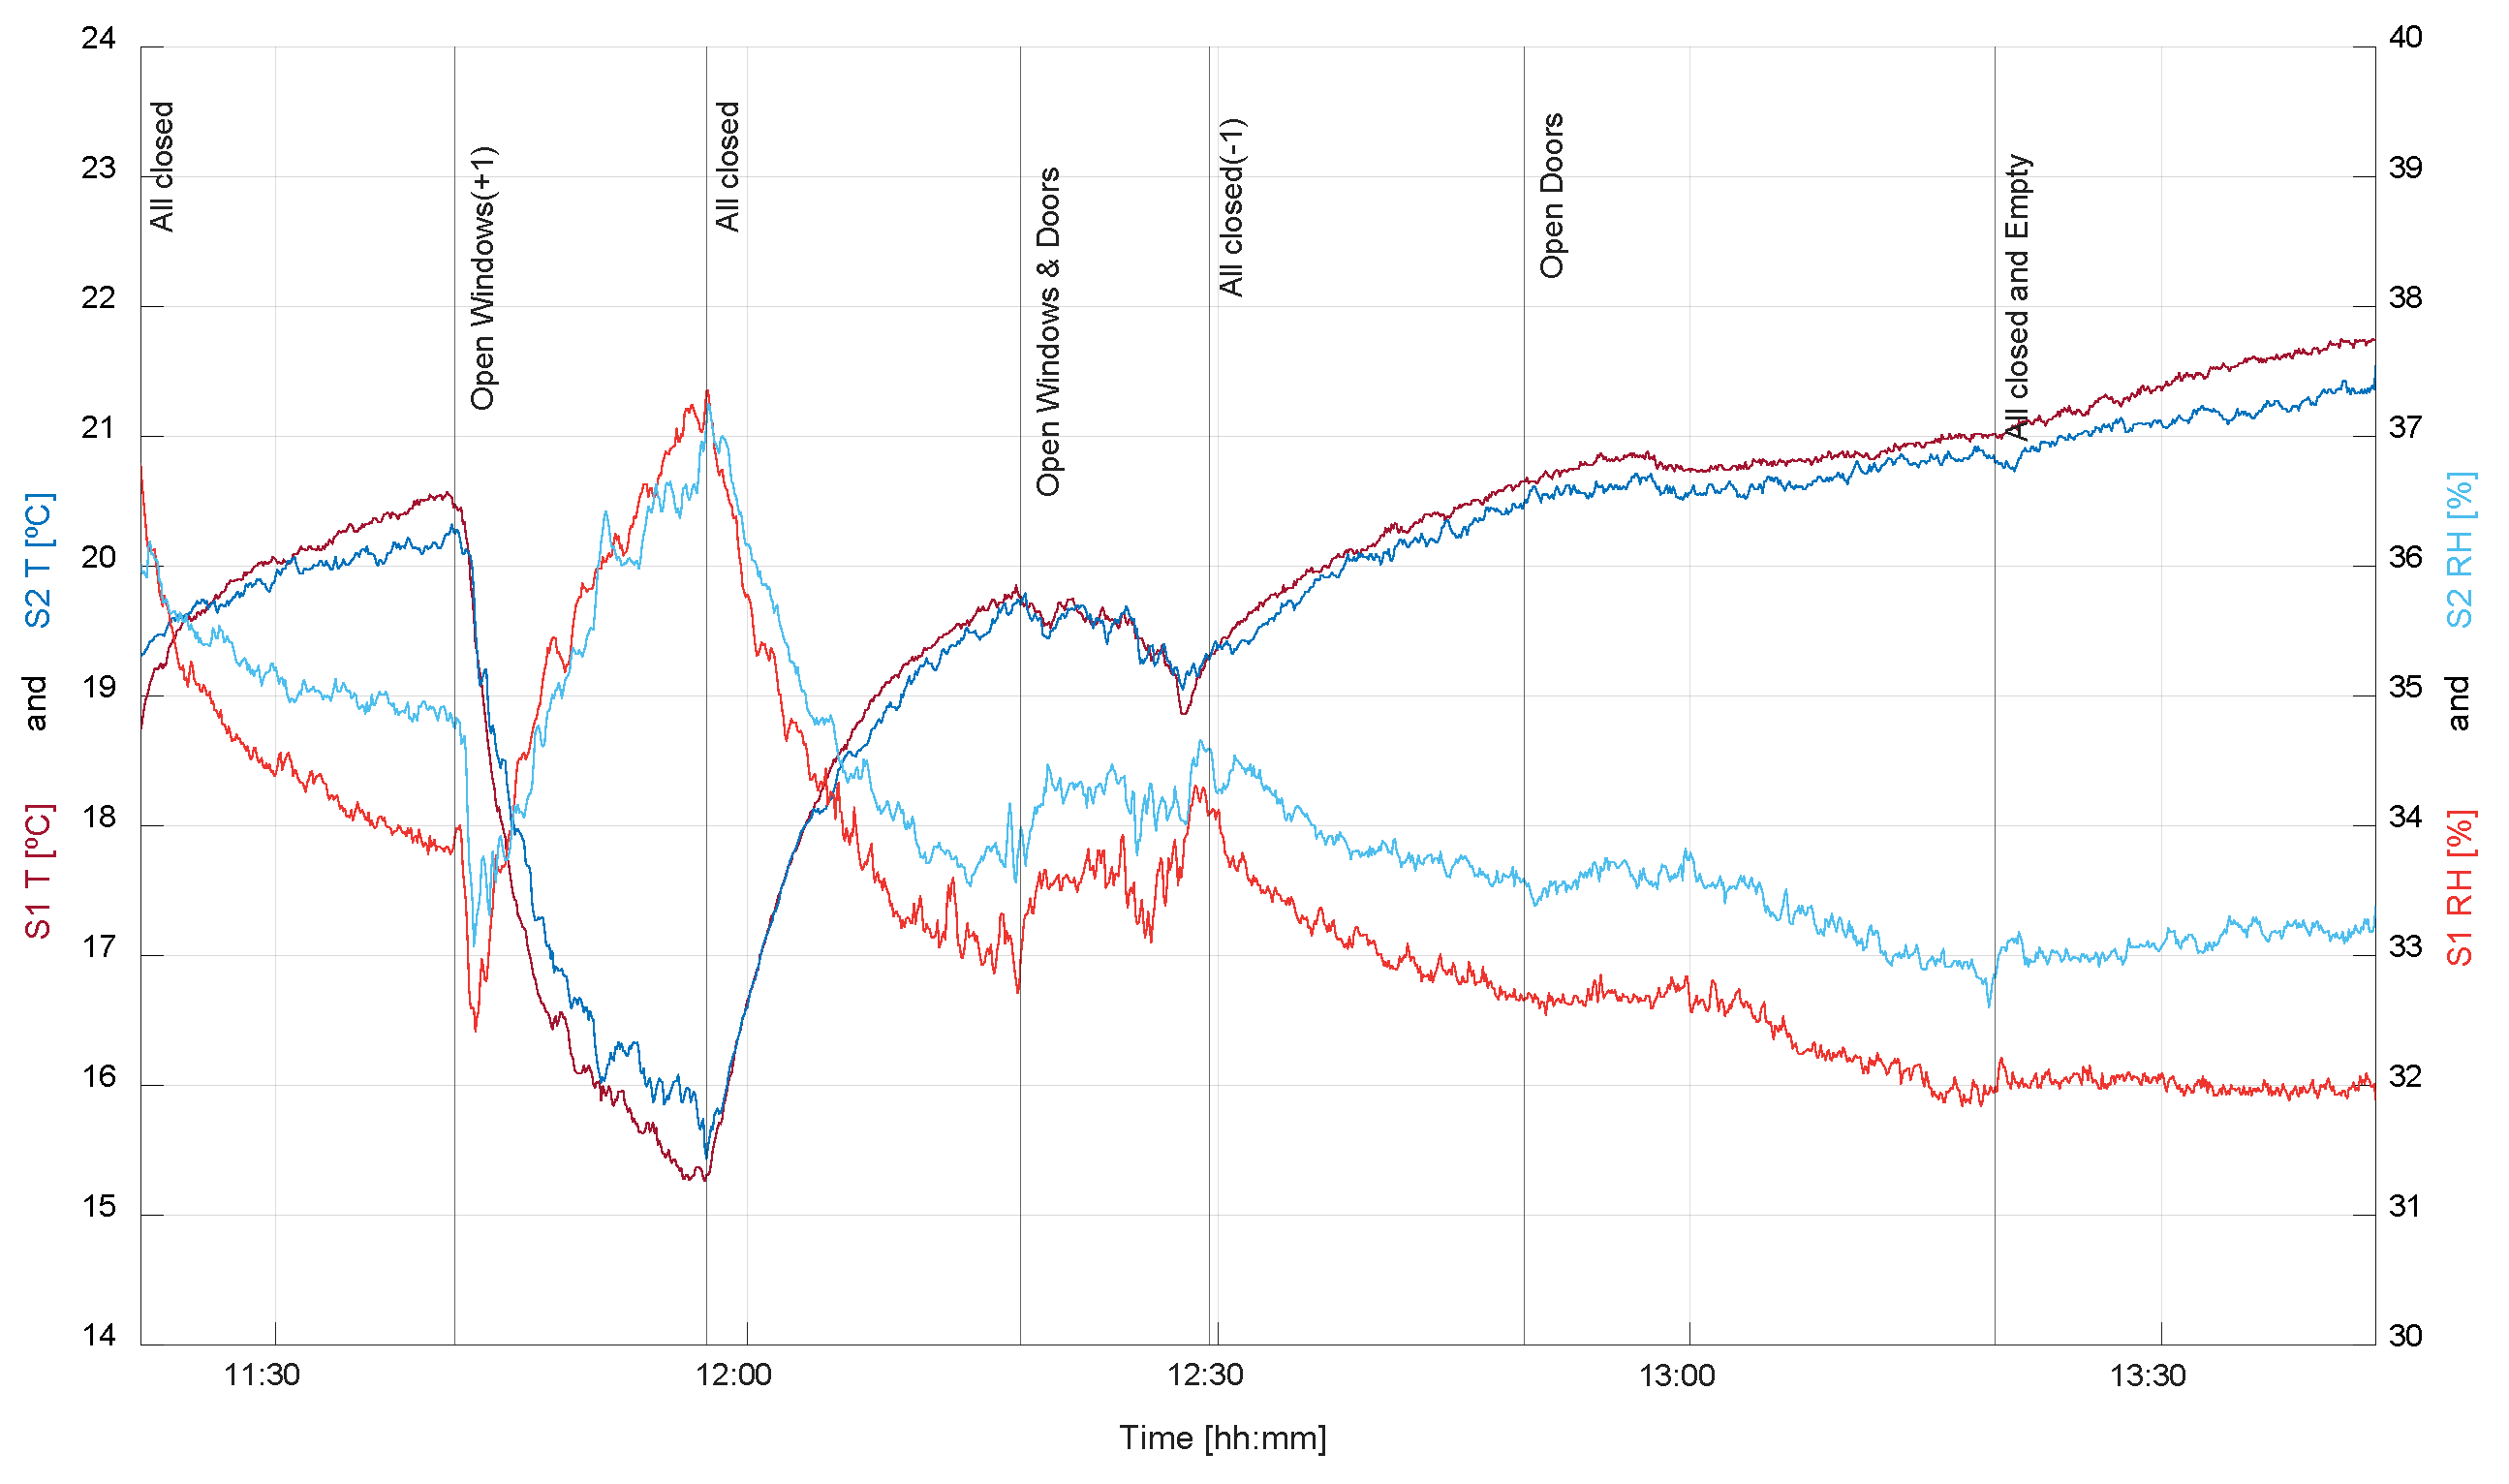
3.1. University Classroom—Scenario 1: During Class with Students
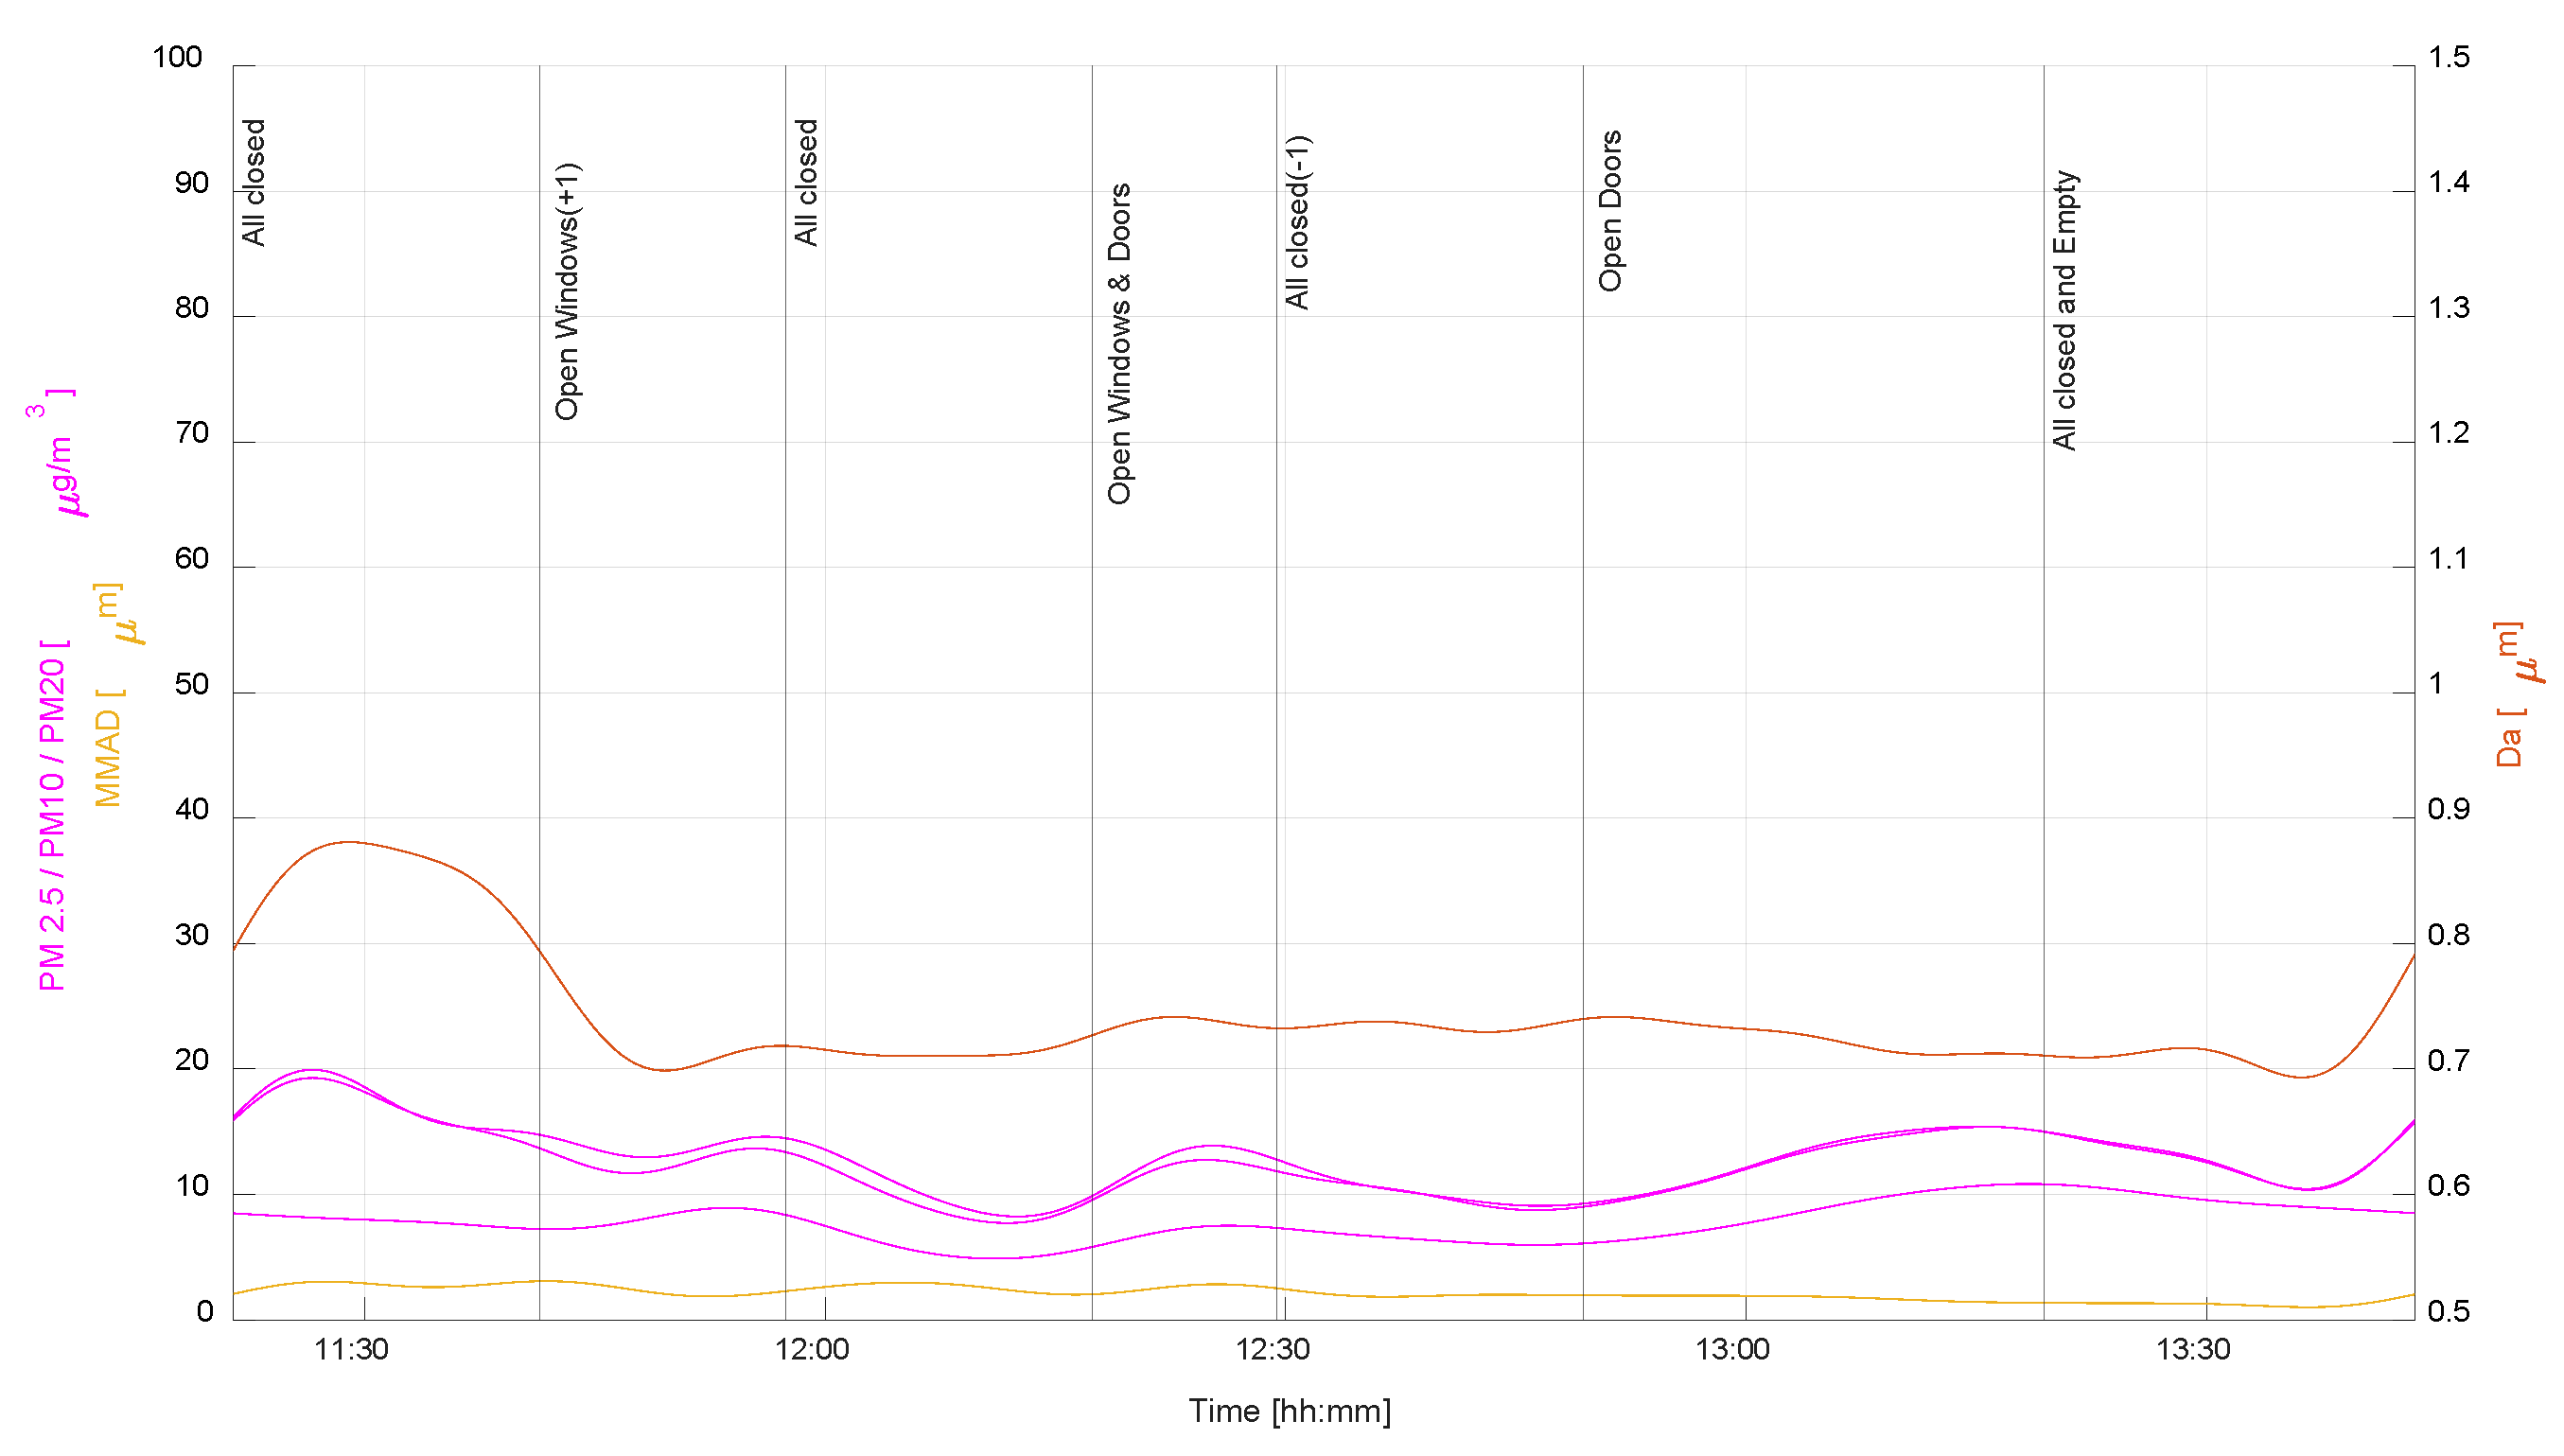
3.2. University Classroom A206–Scenario 2: Quasi-Empty Class
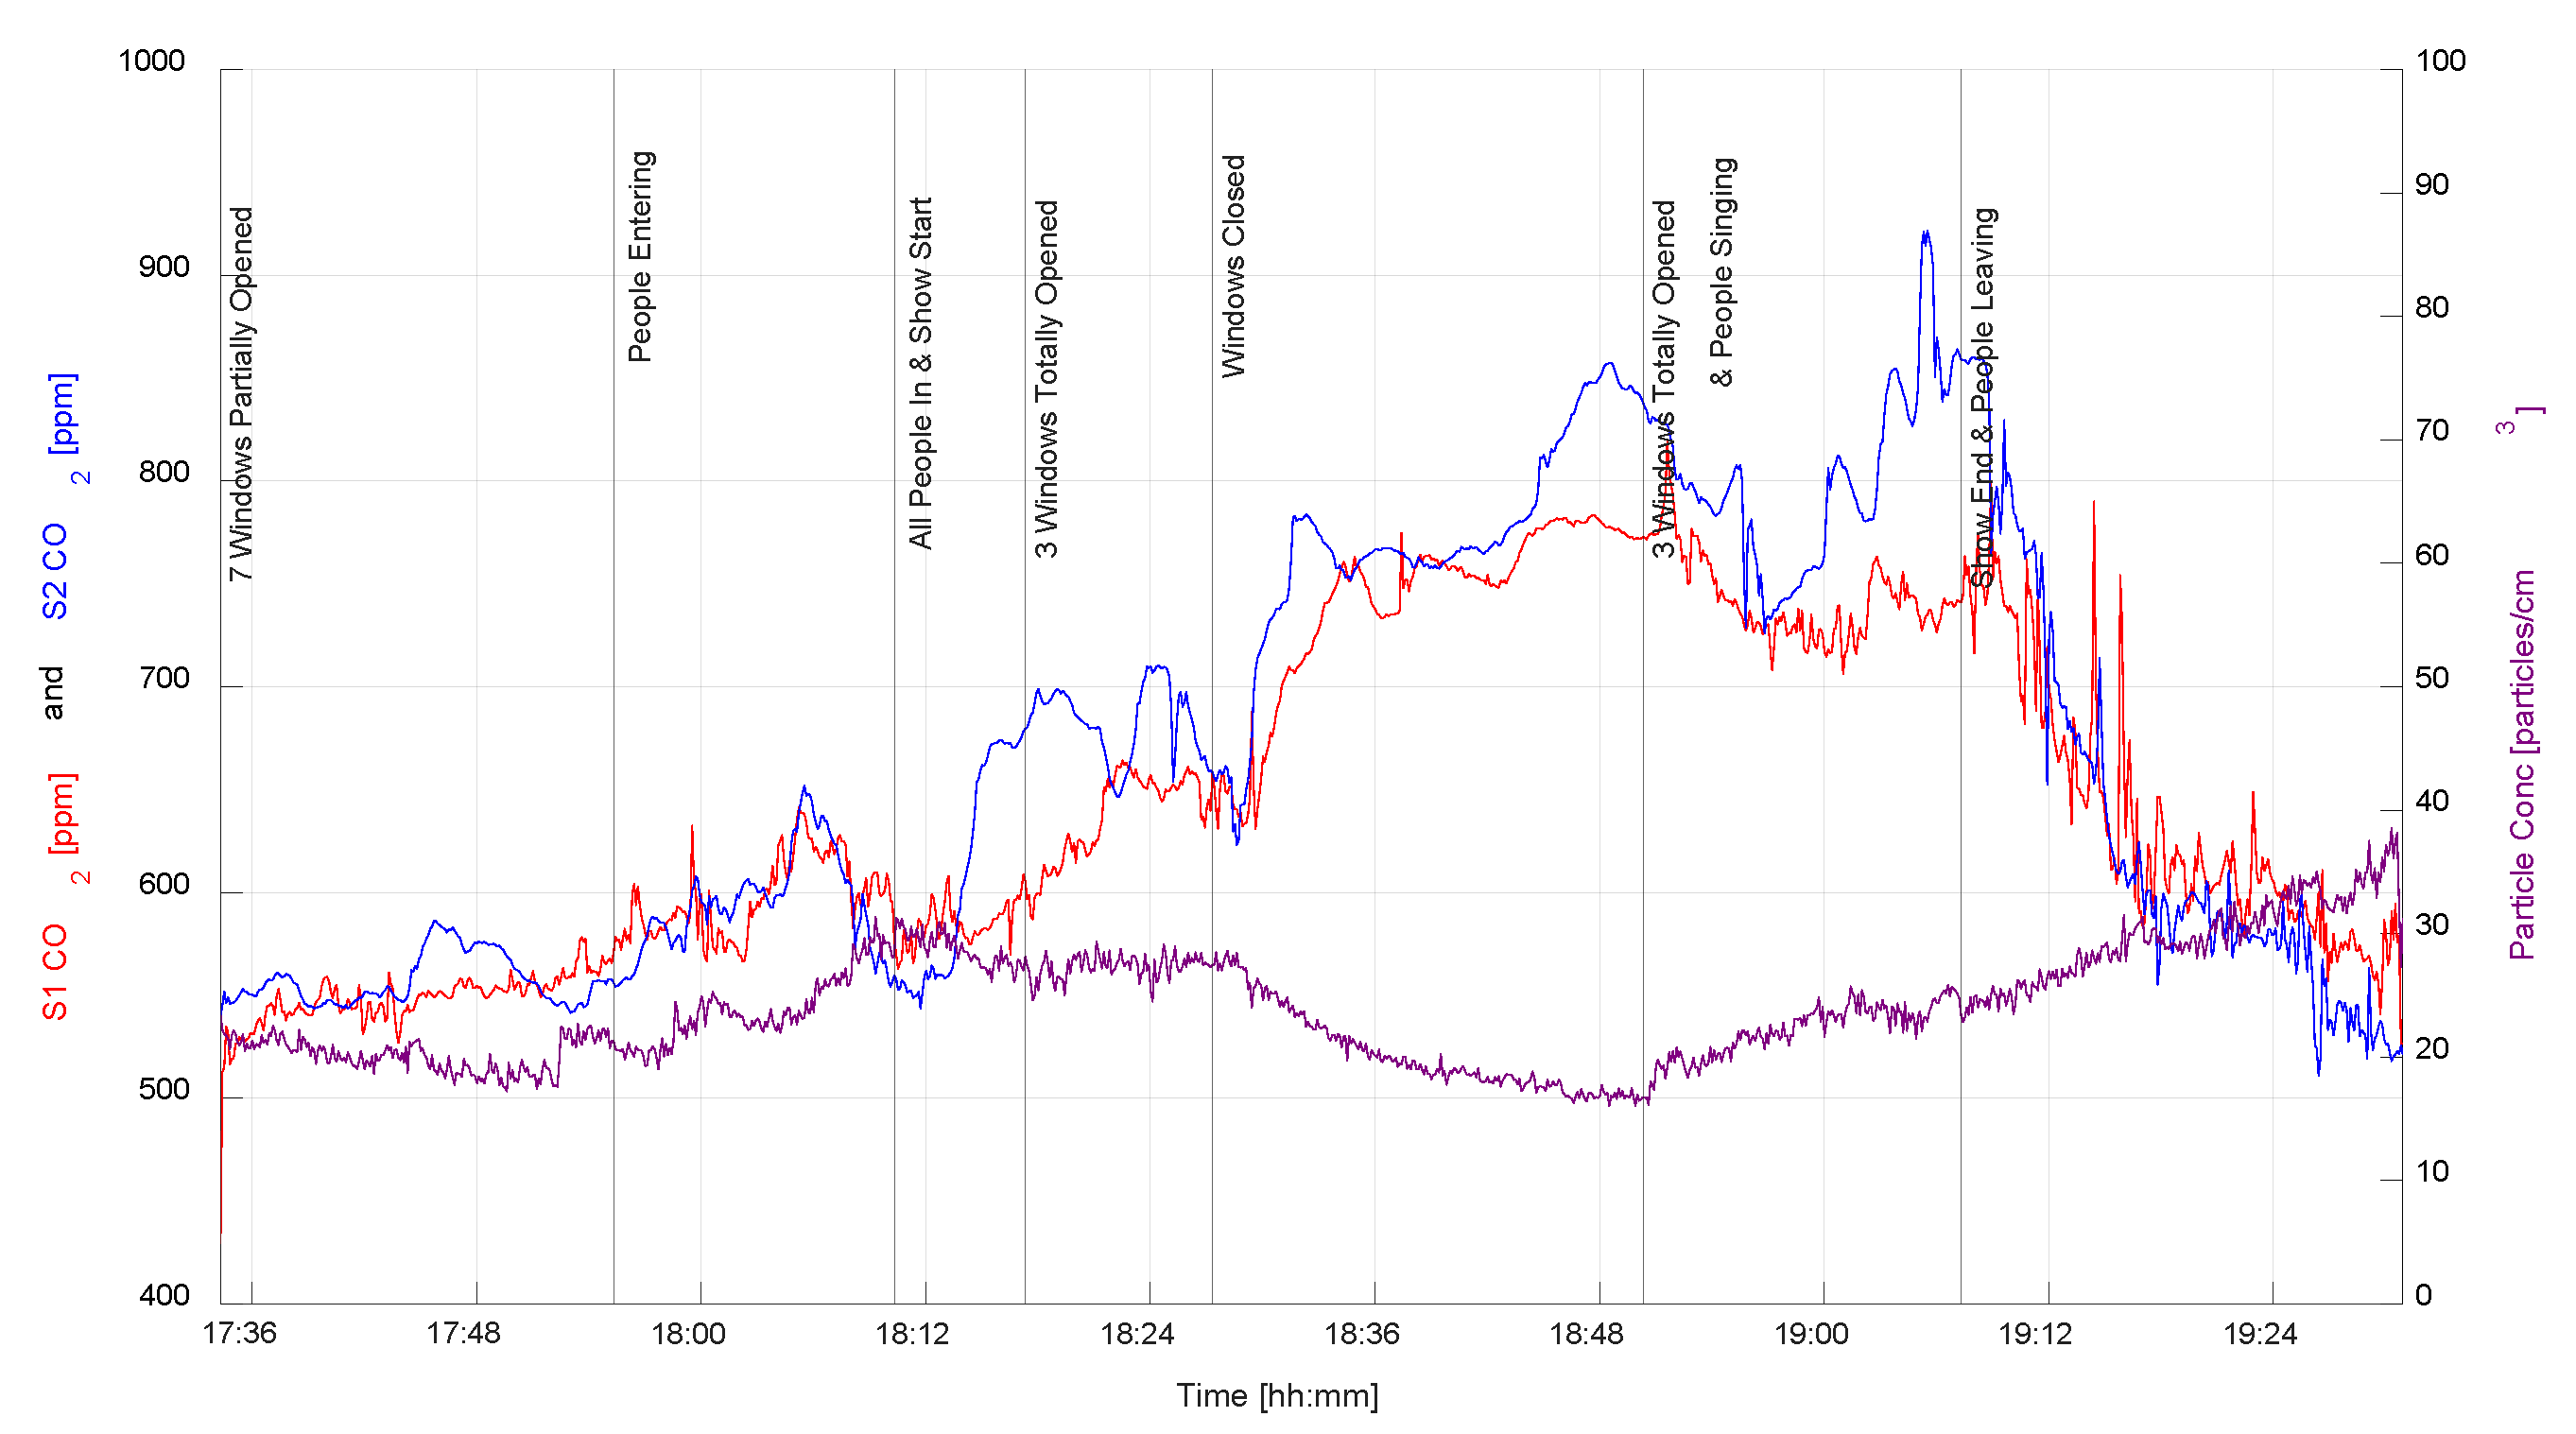
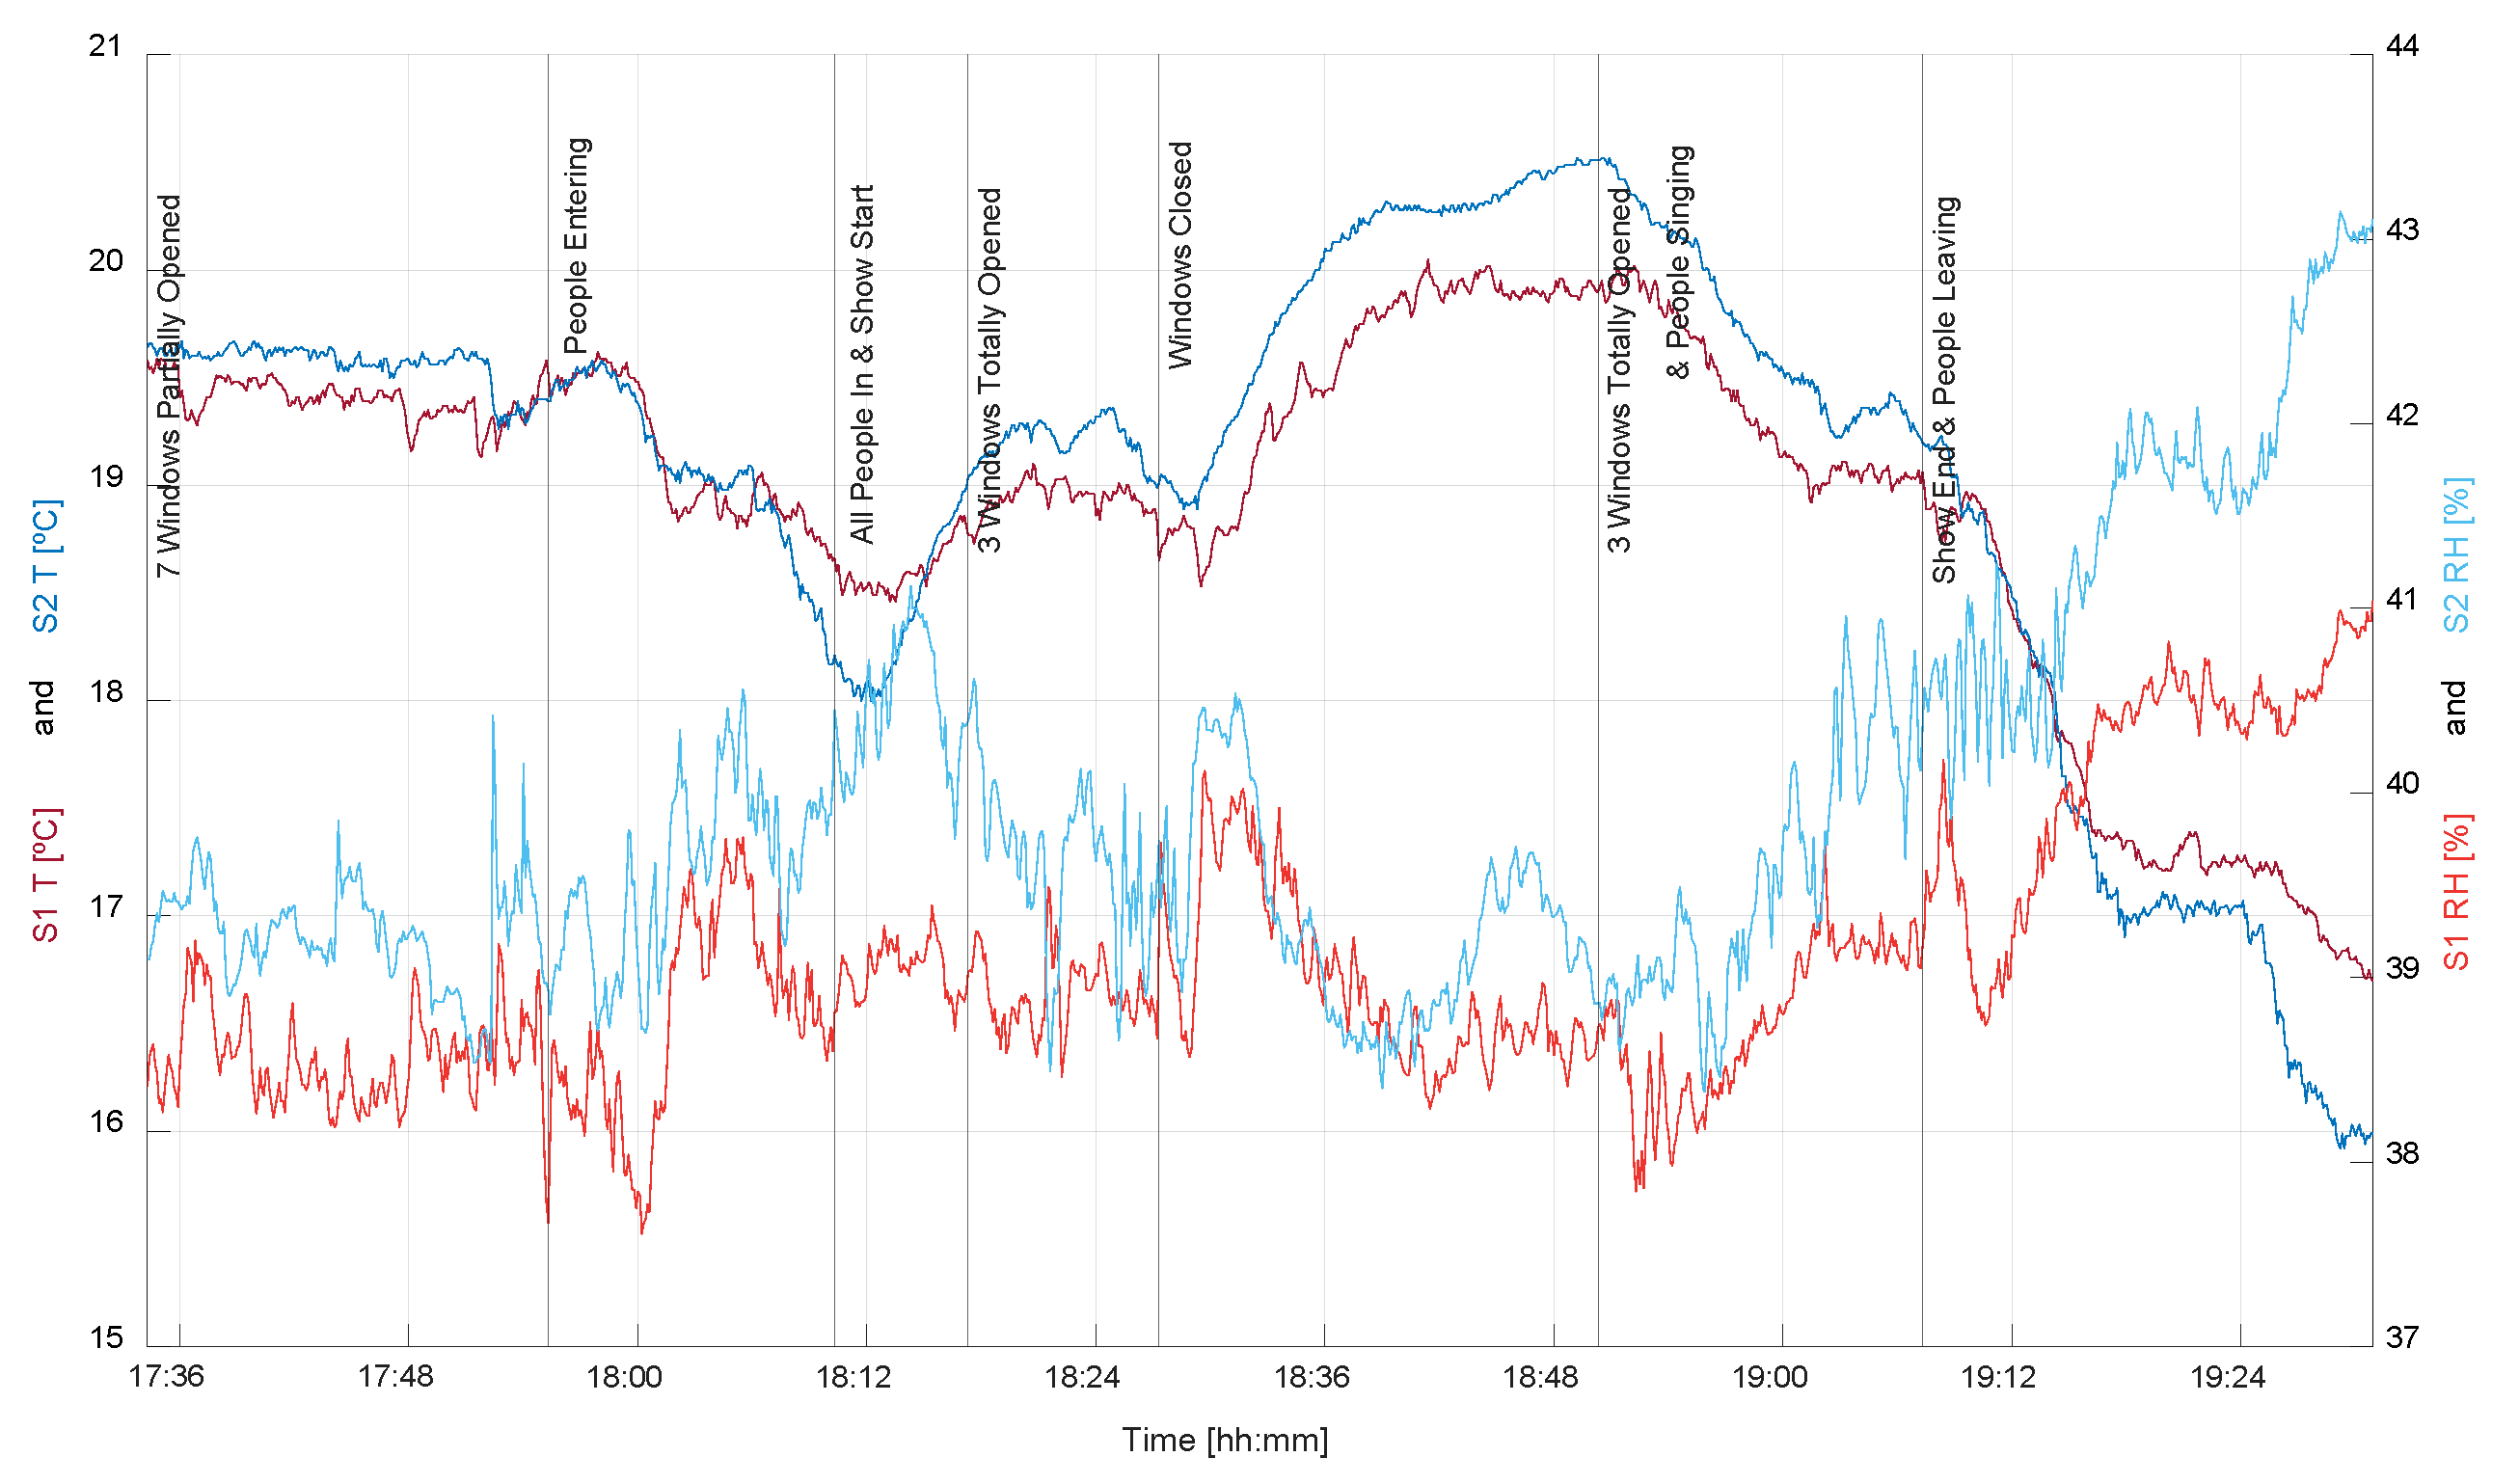
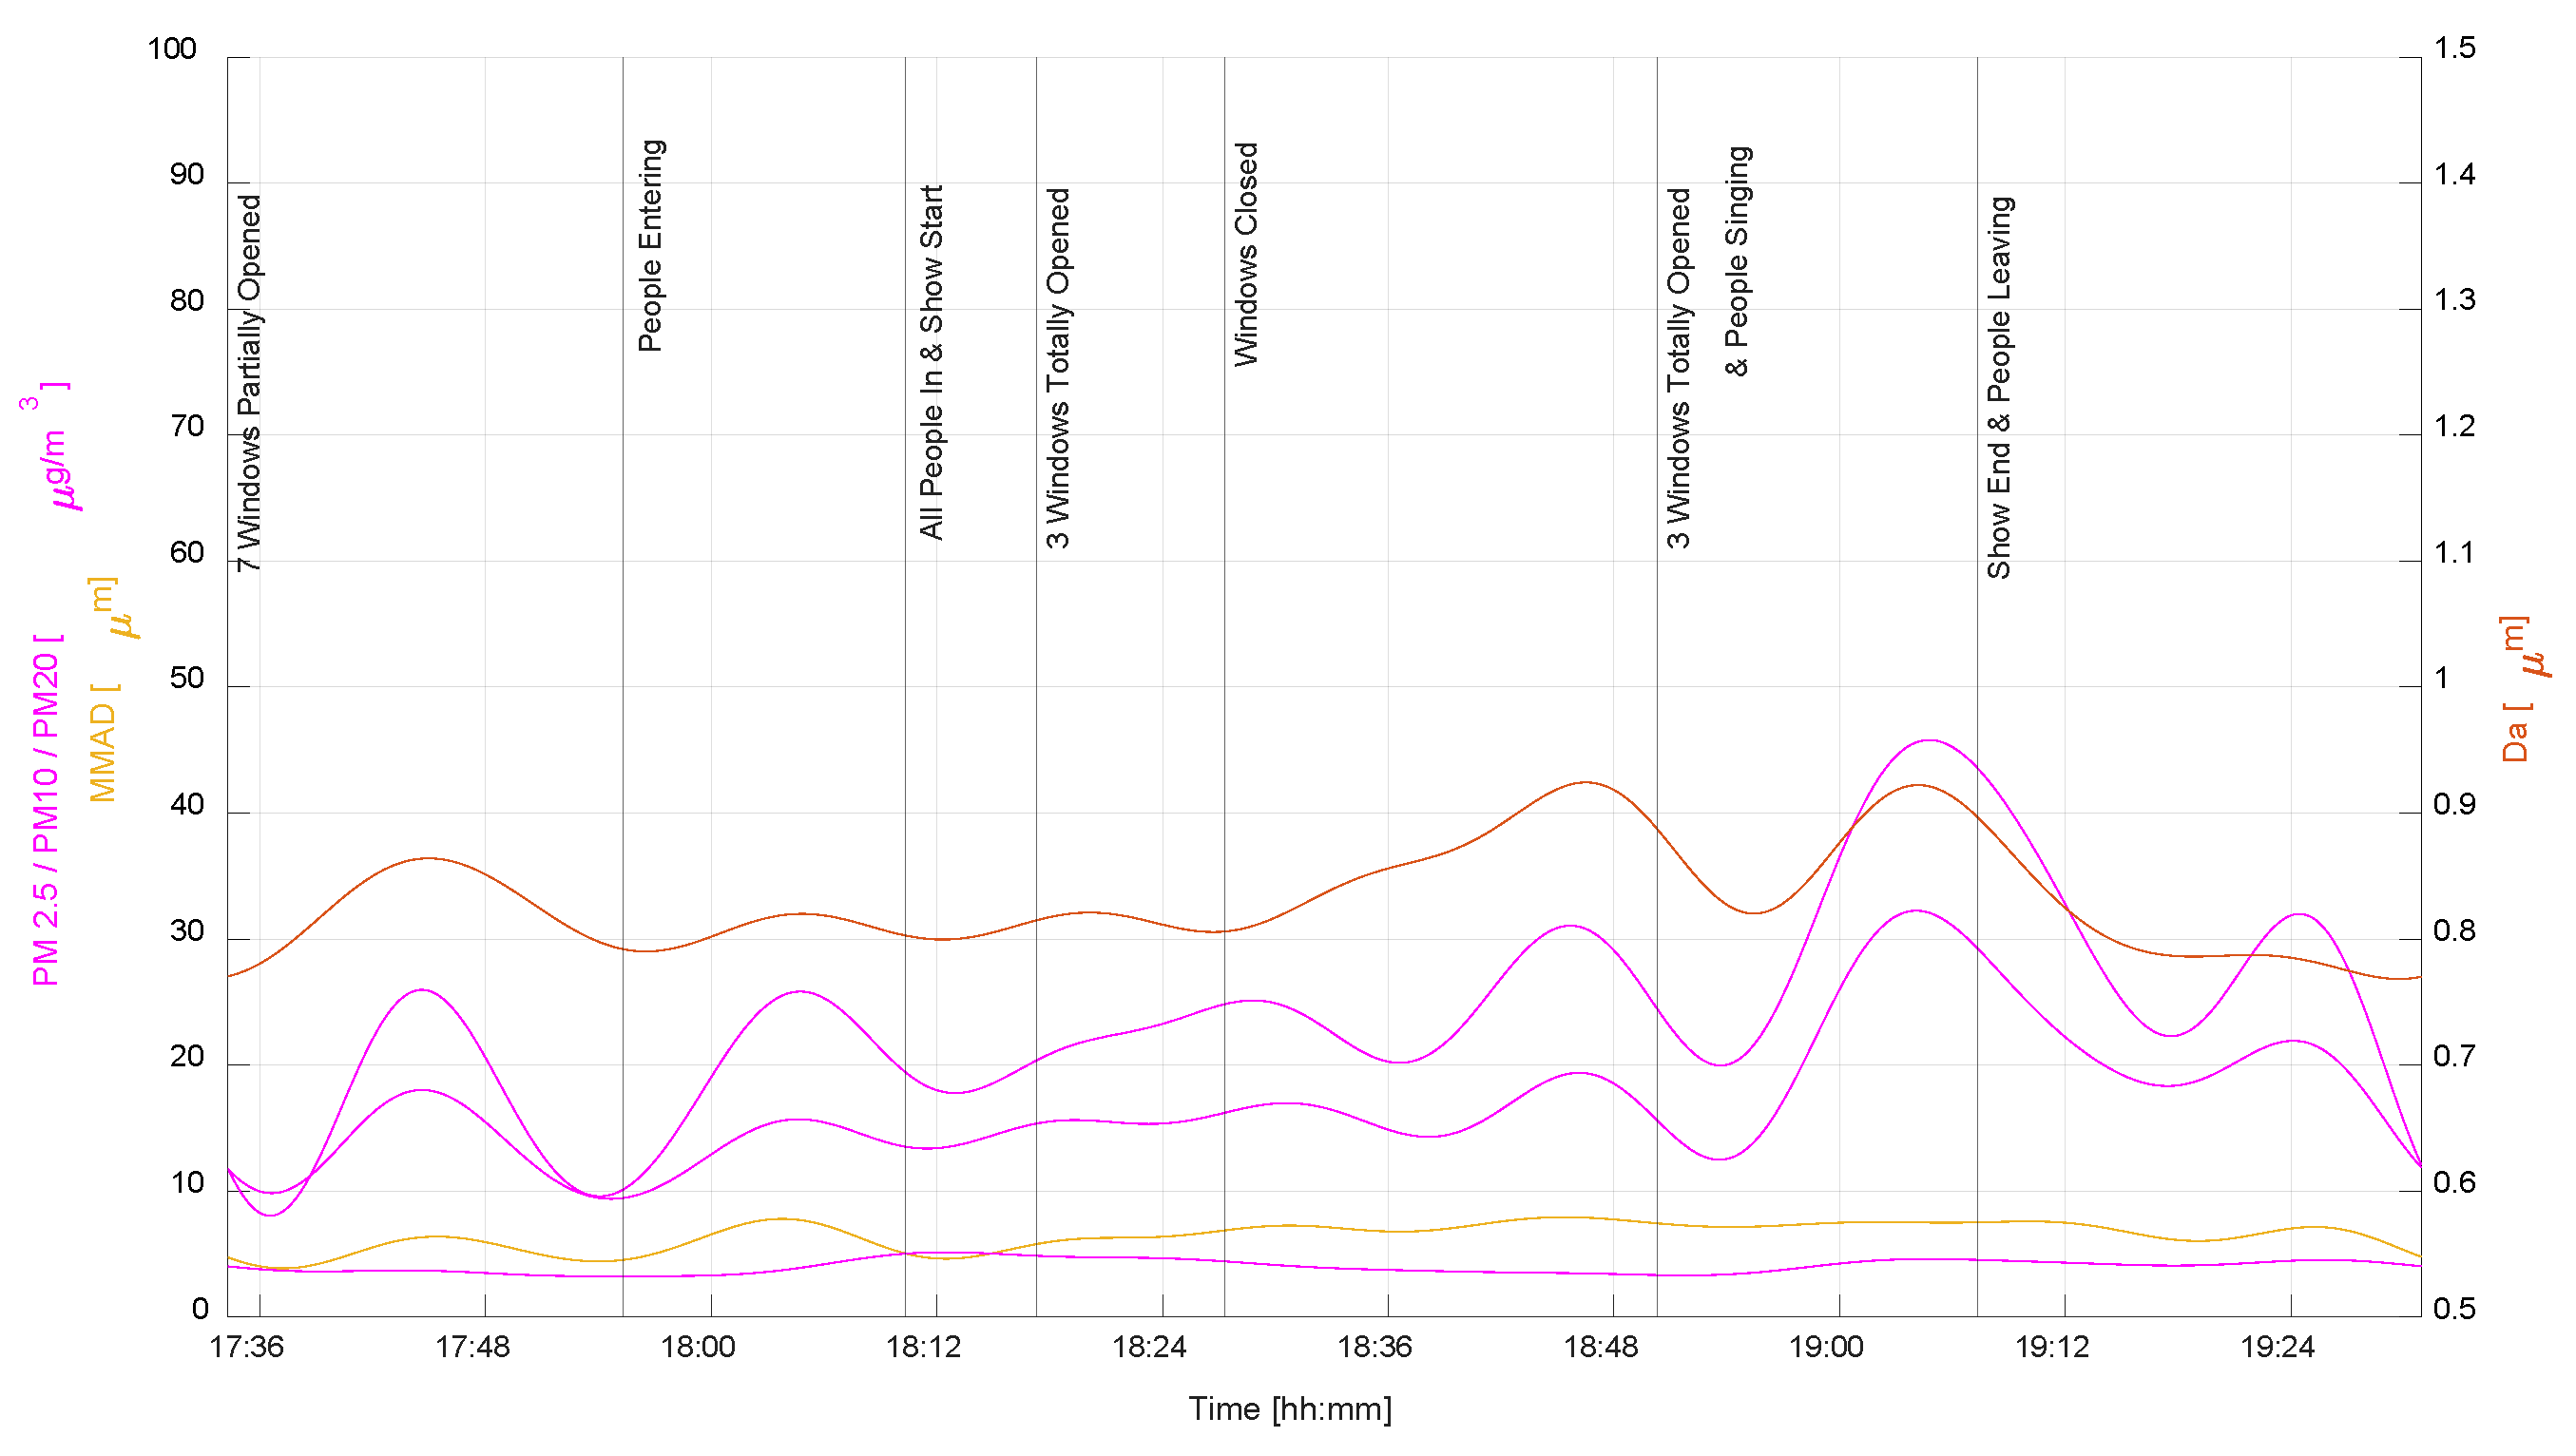
3.3. Ignacio Aldecoa Library—Children’s Area
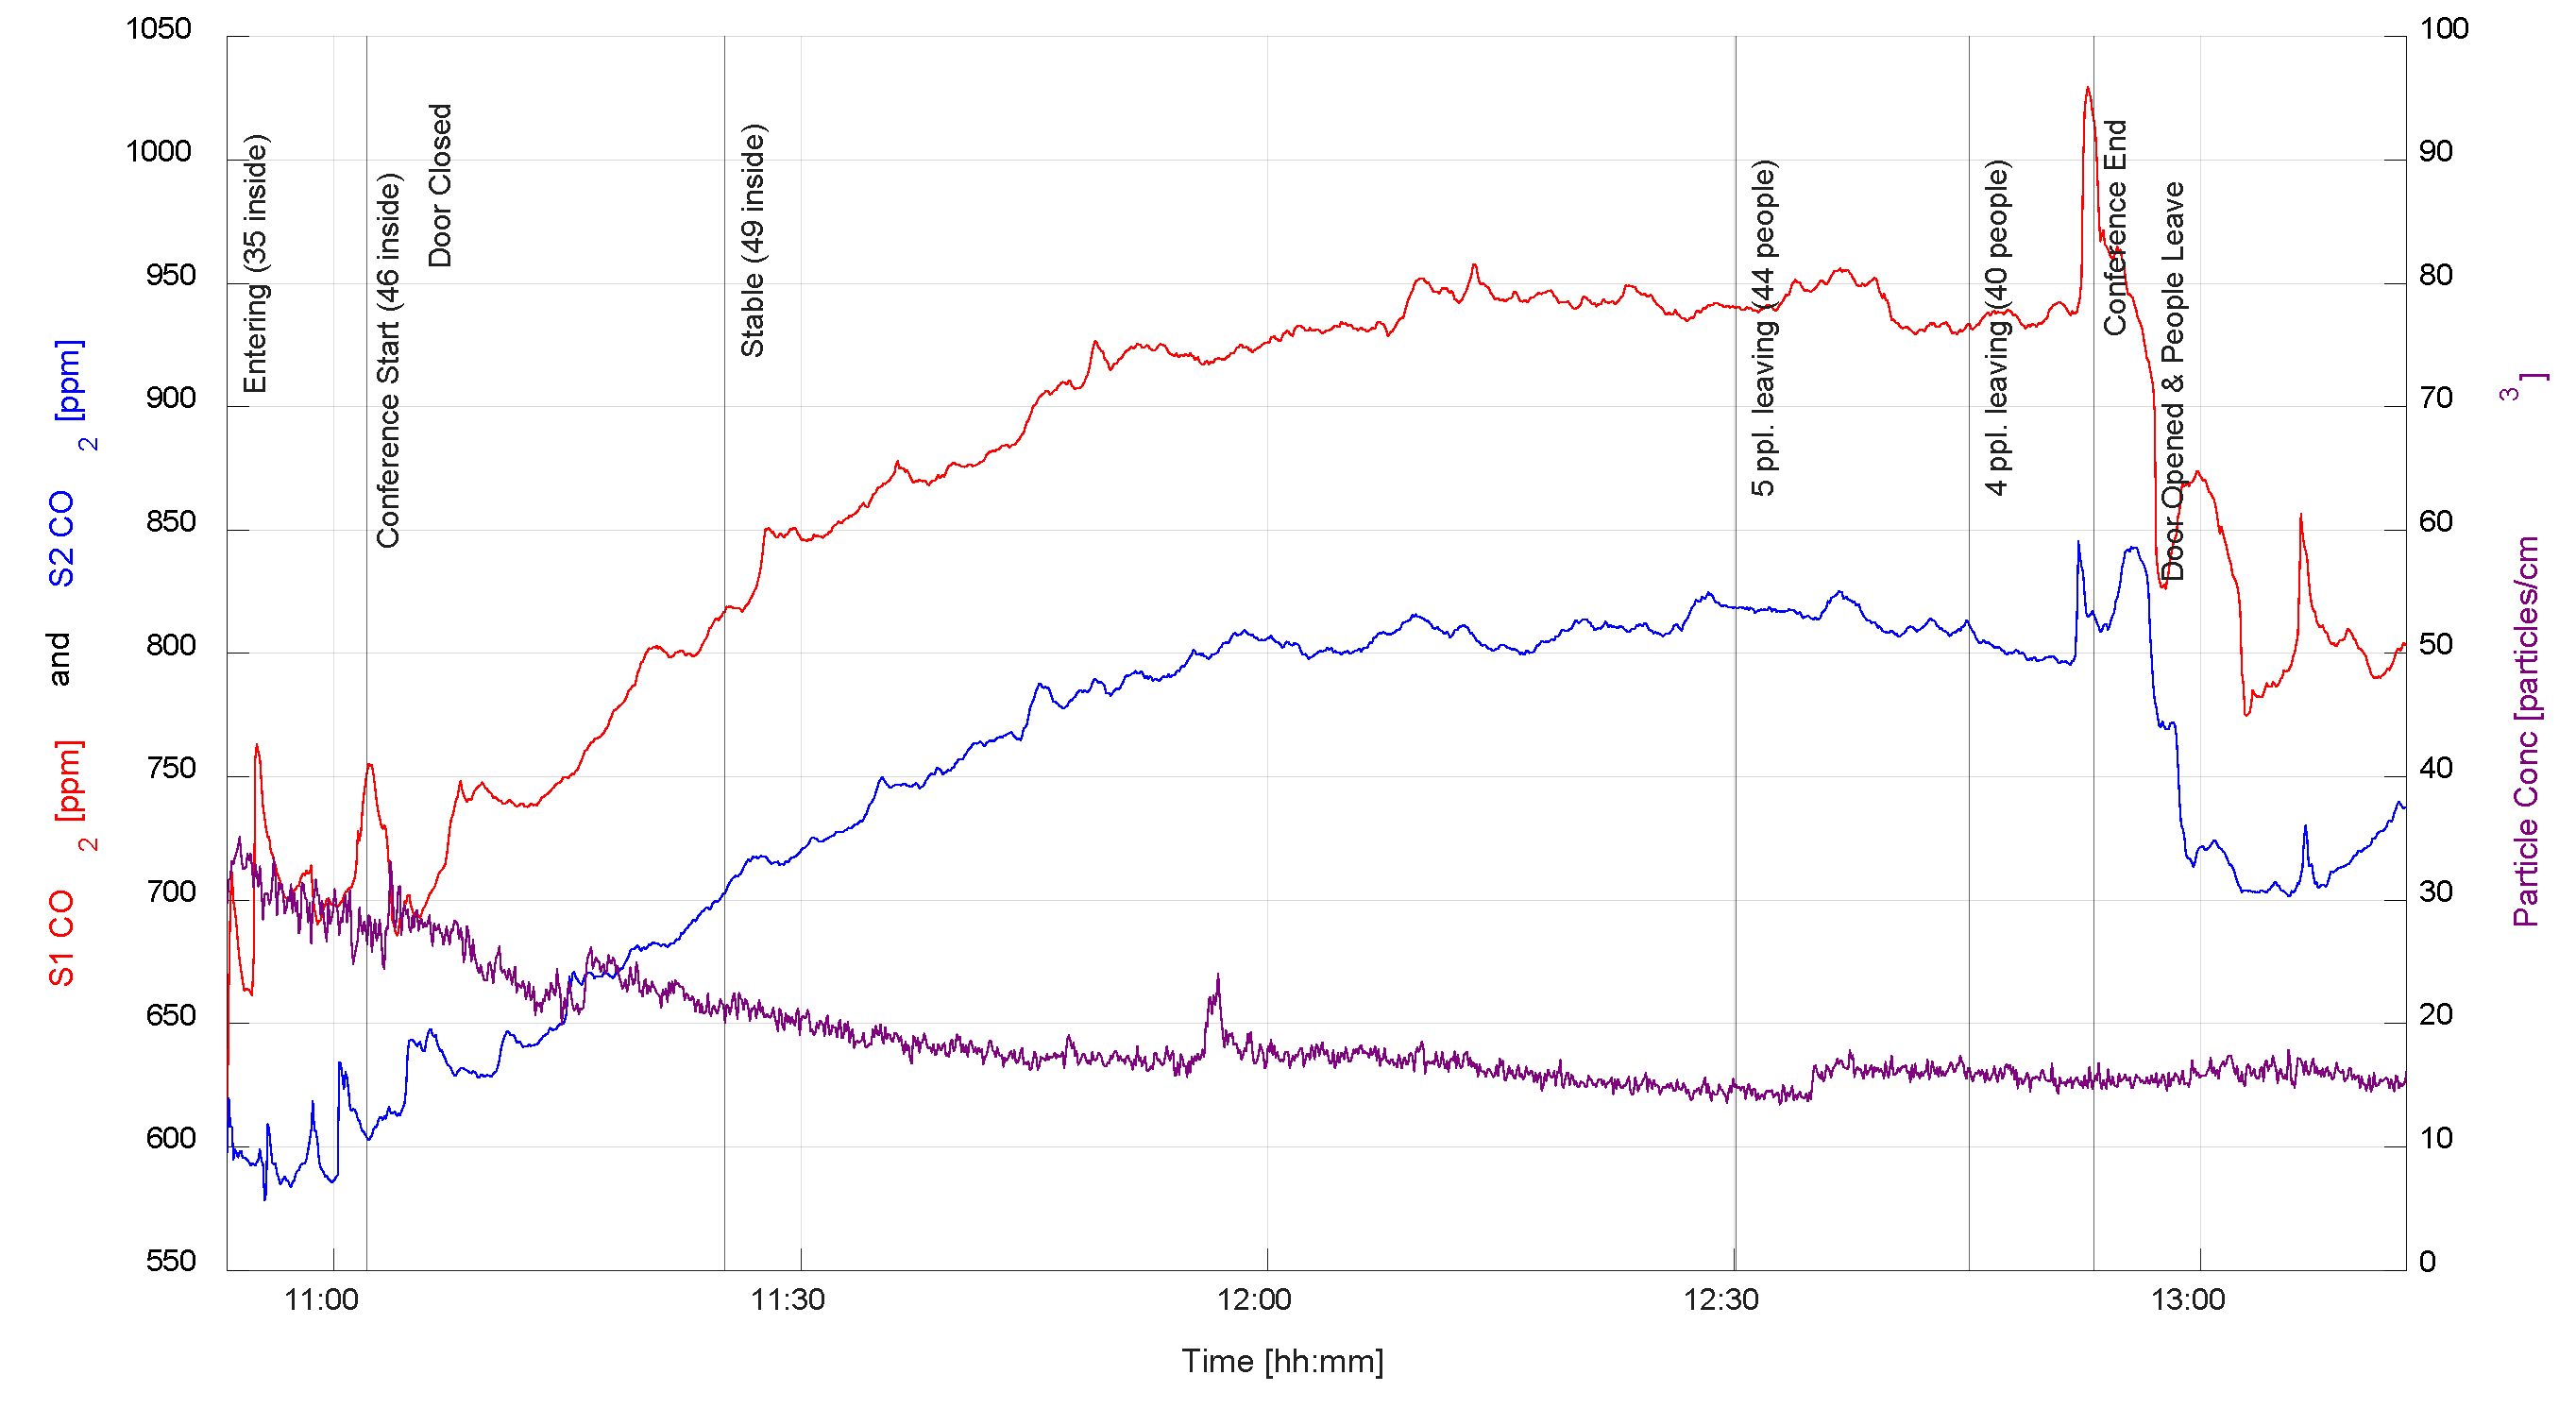
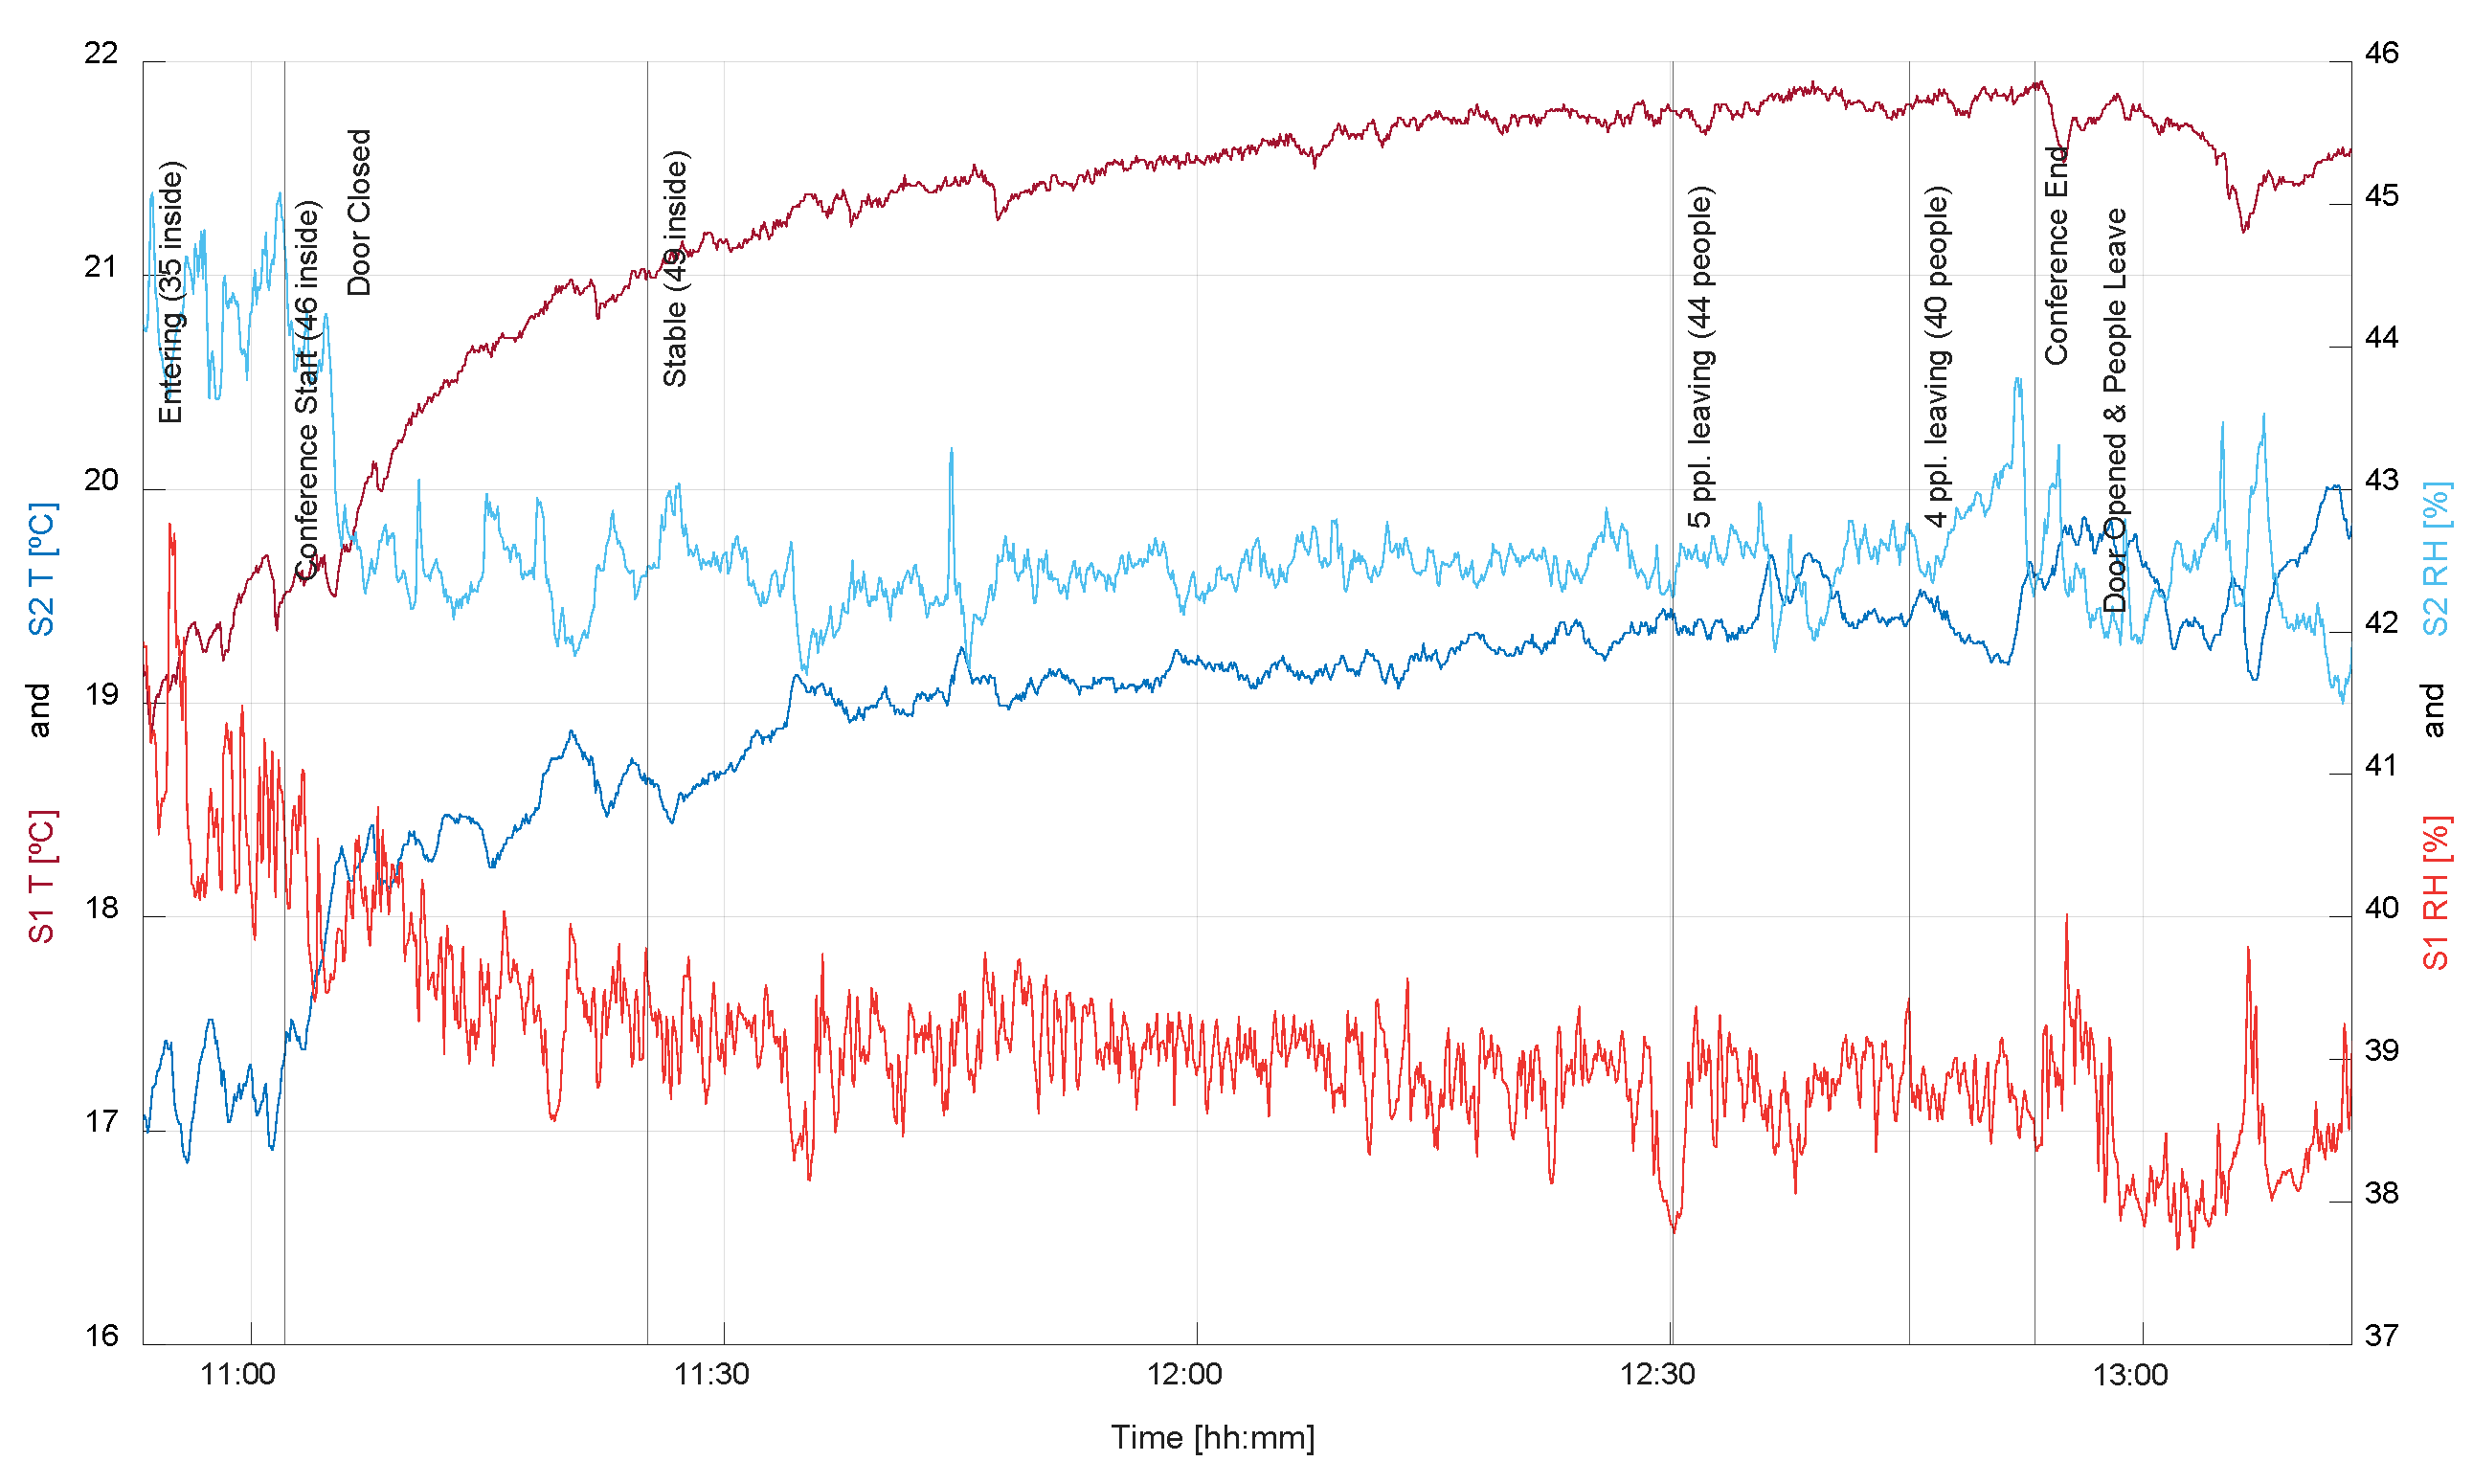
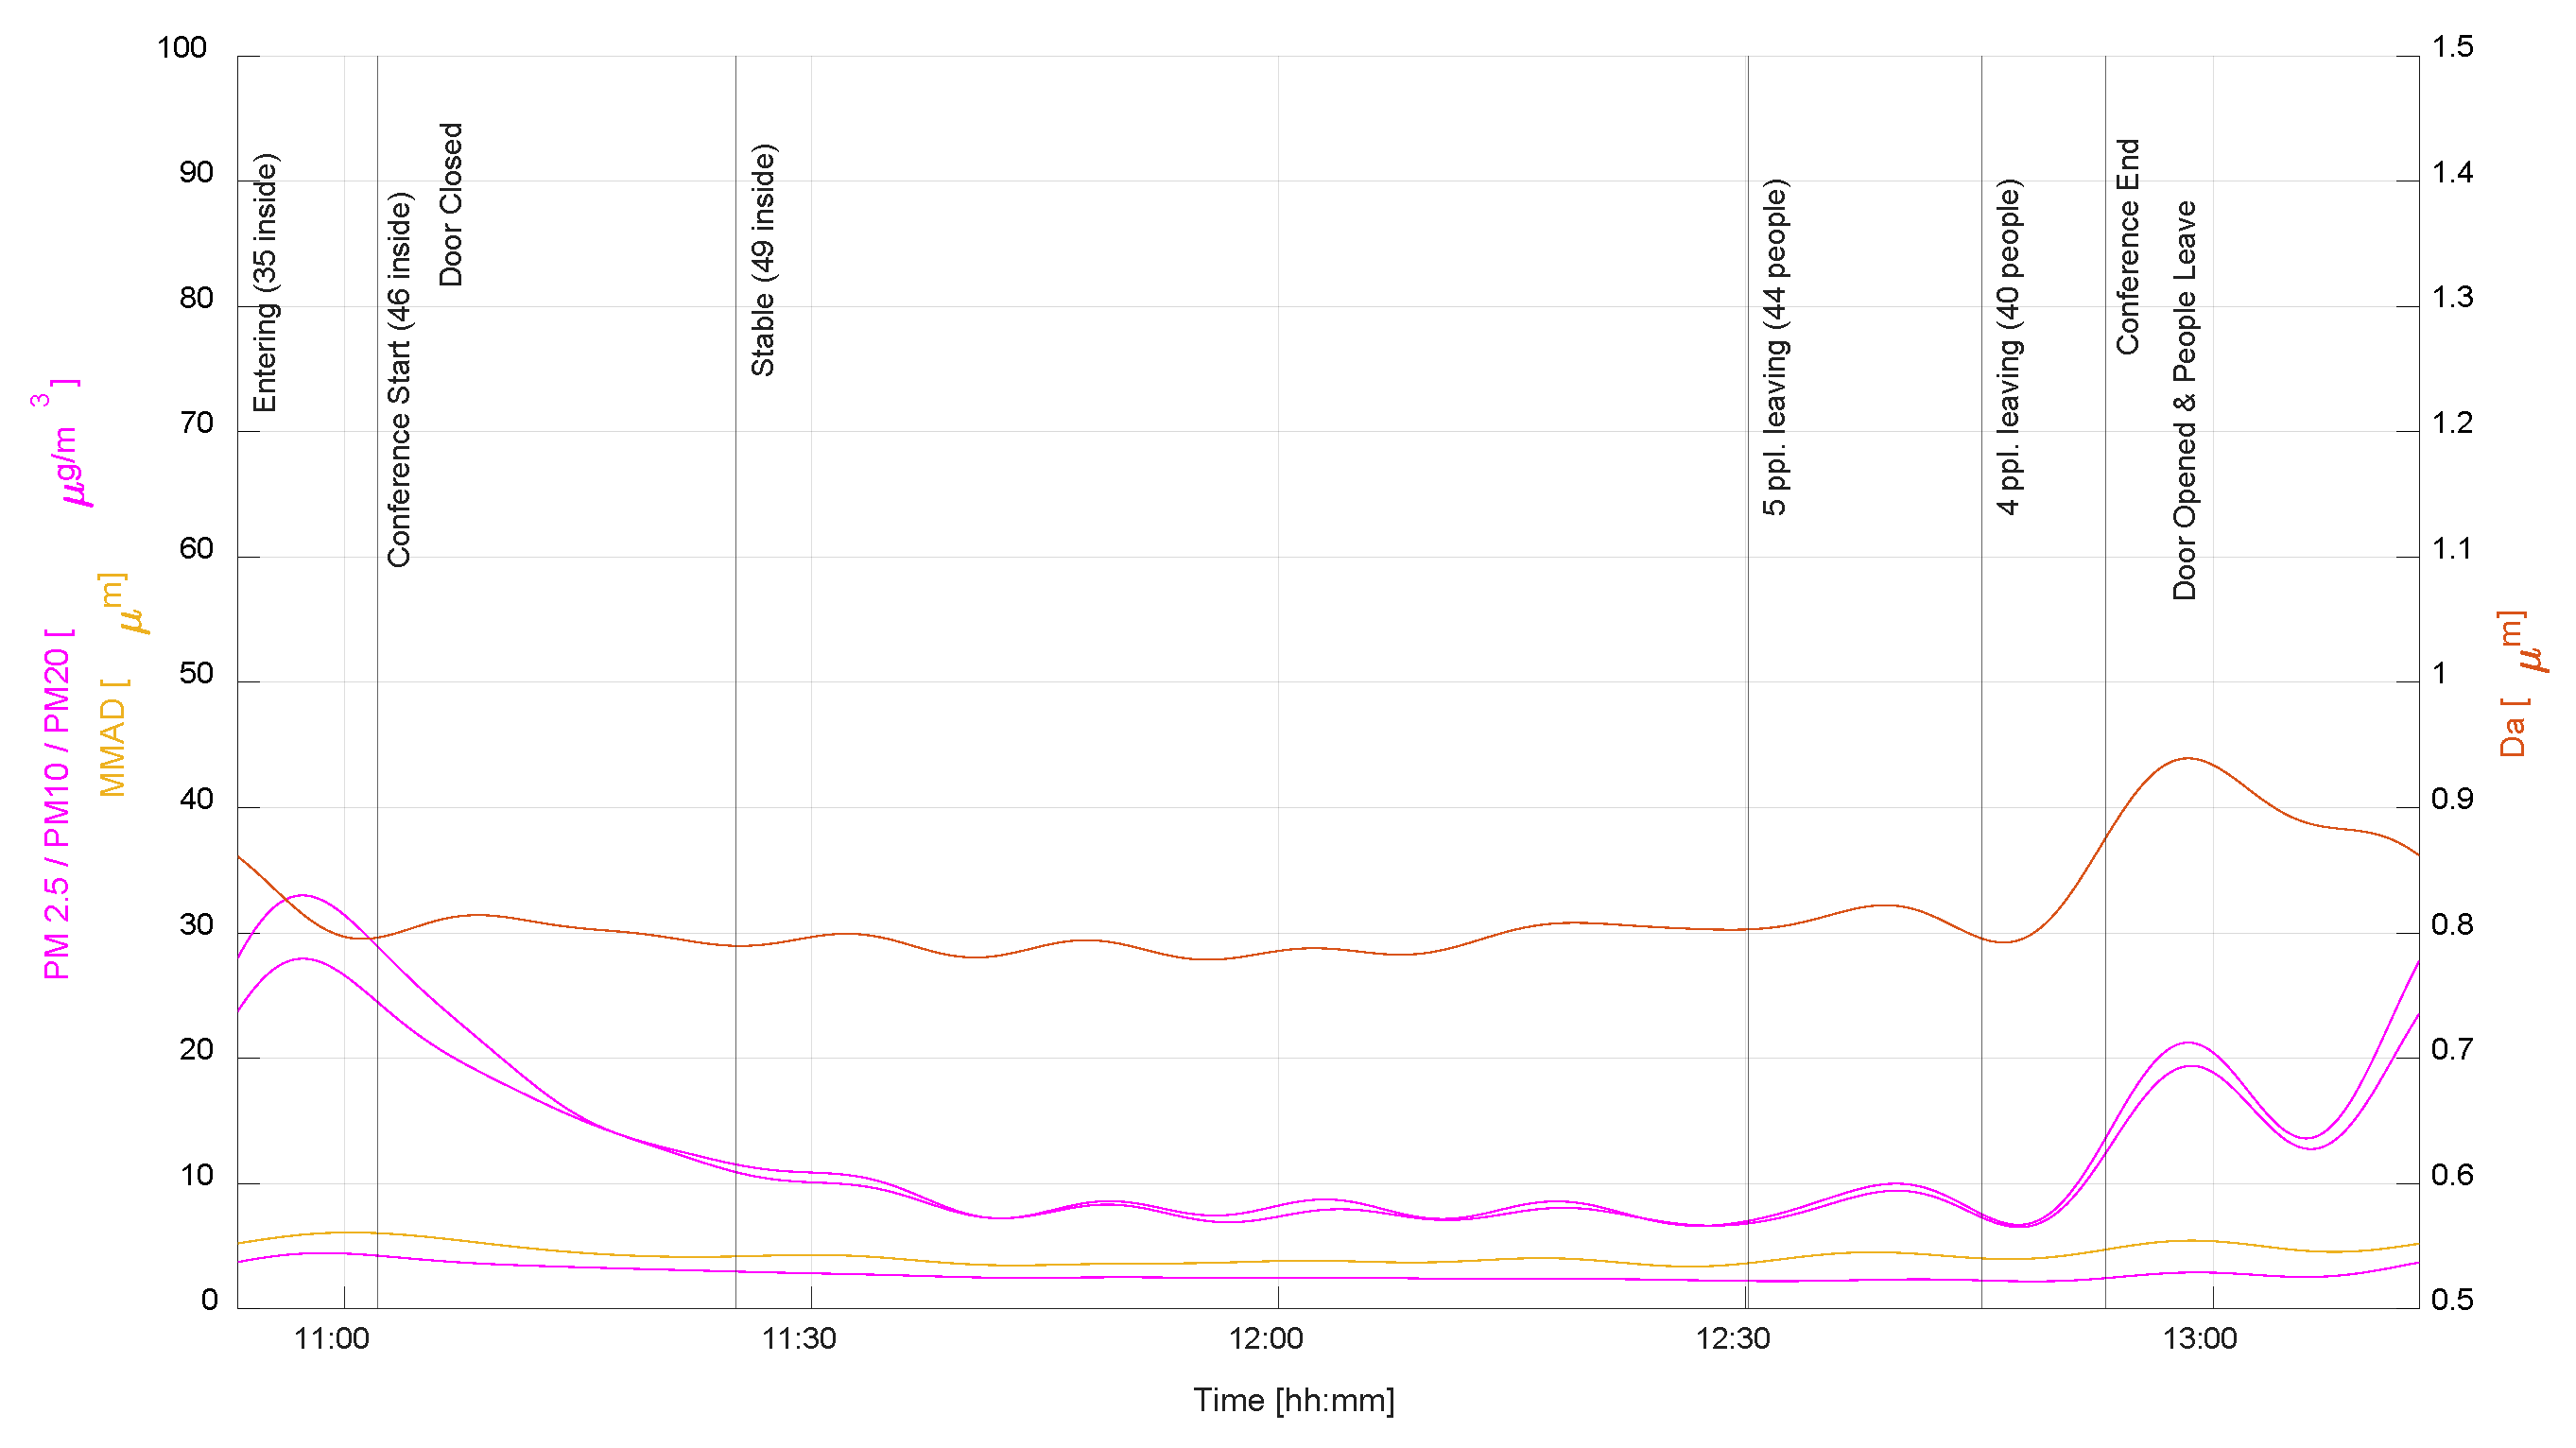
3.4. Ignacio Aldecoa Library—Assembly Hall
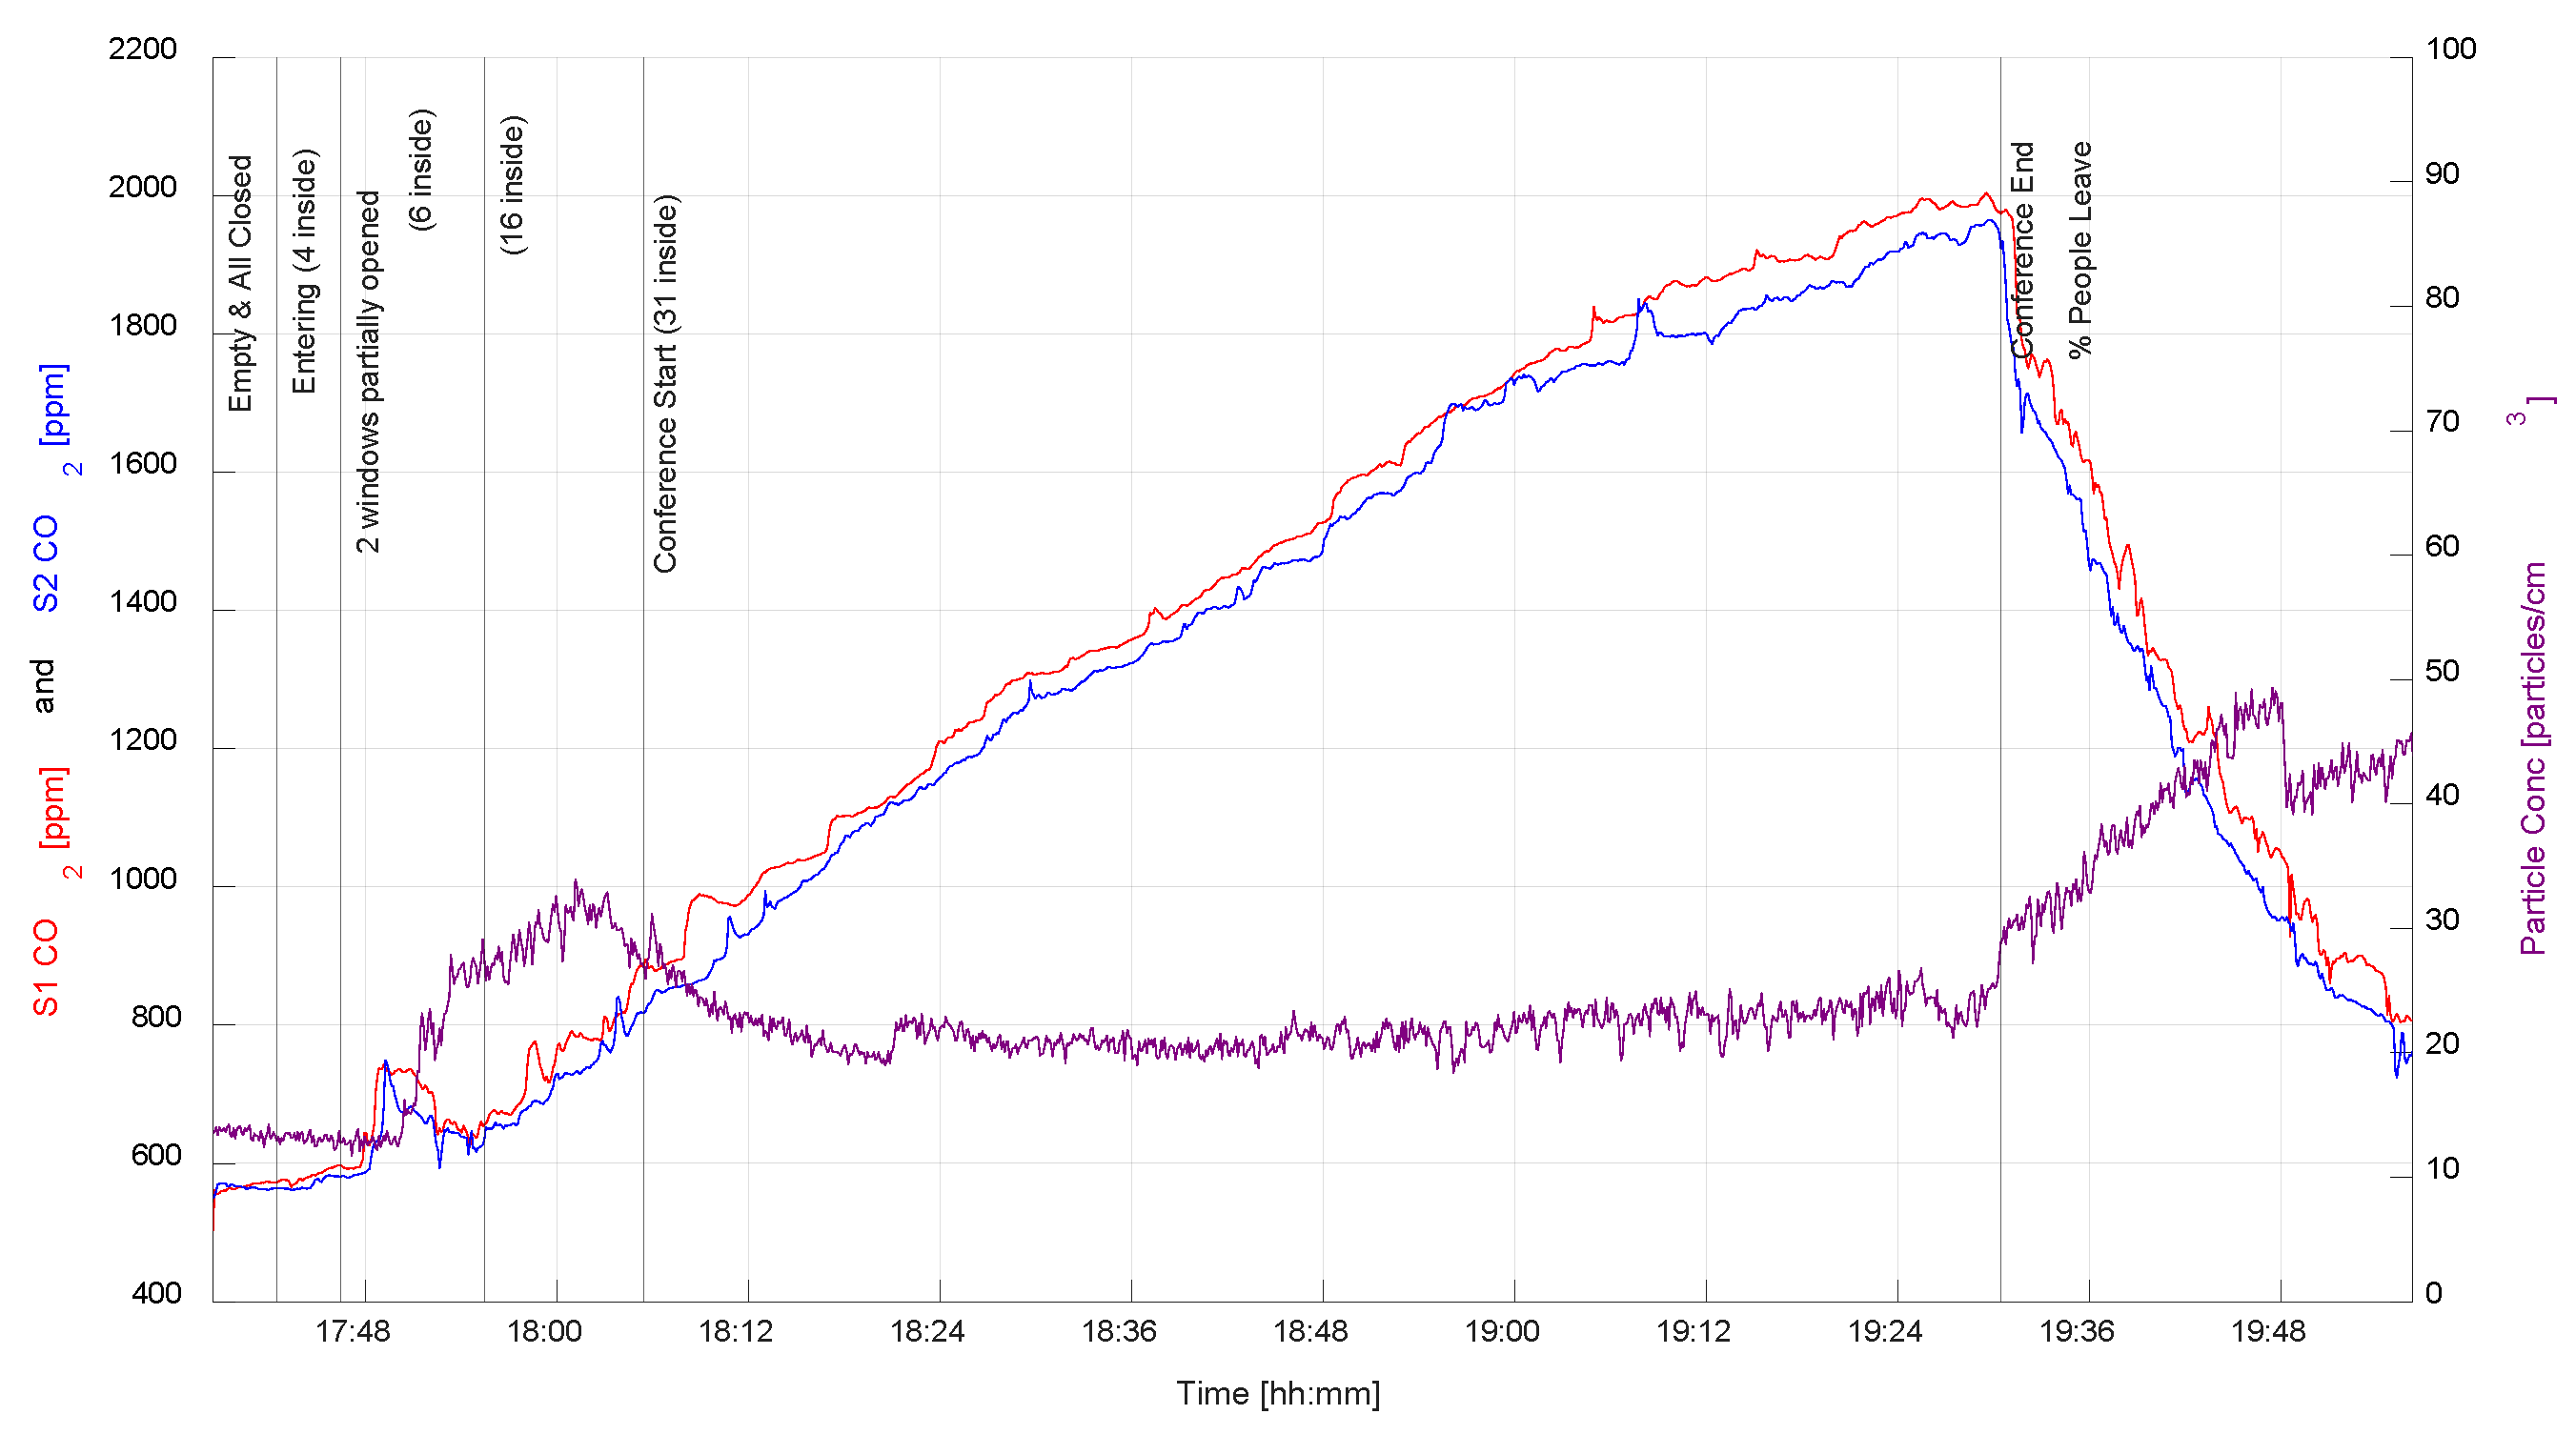
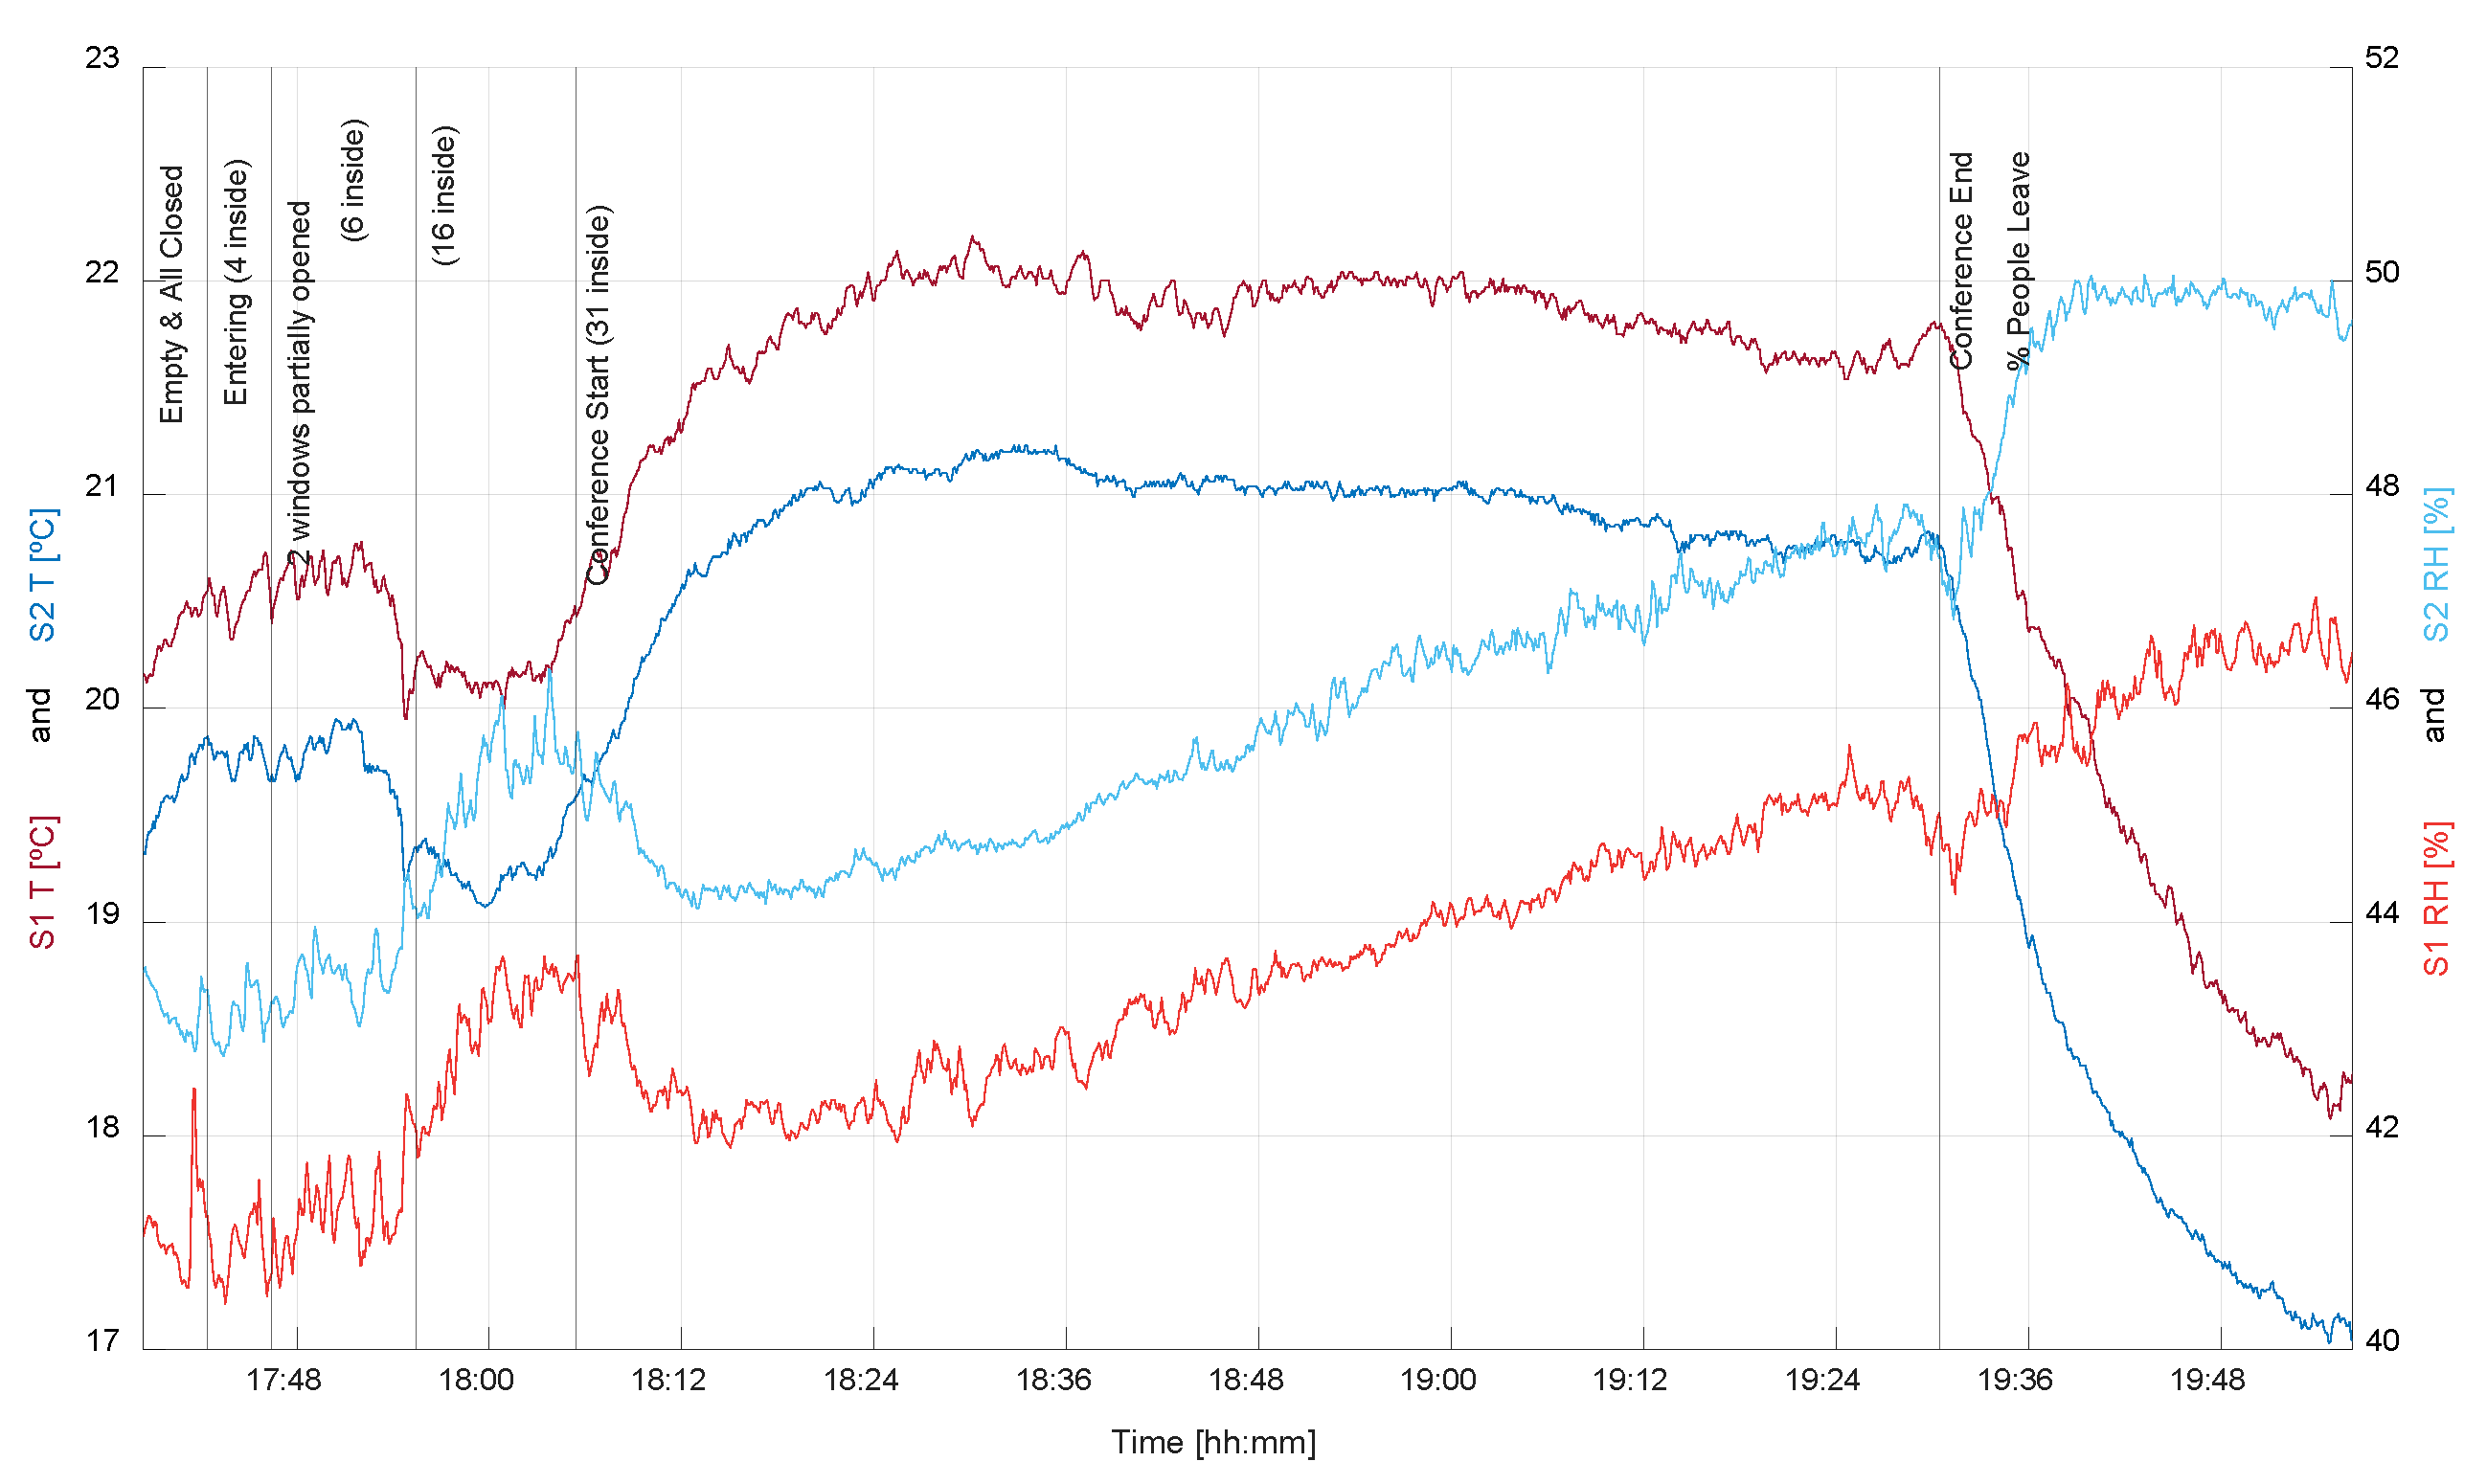
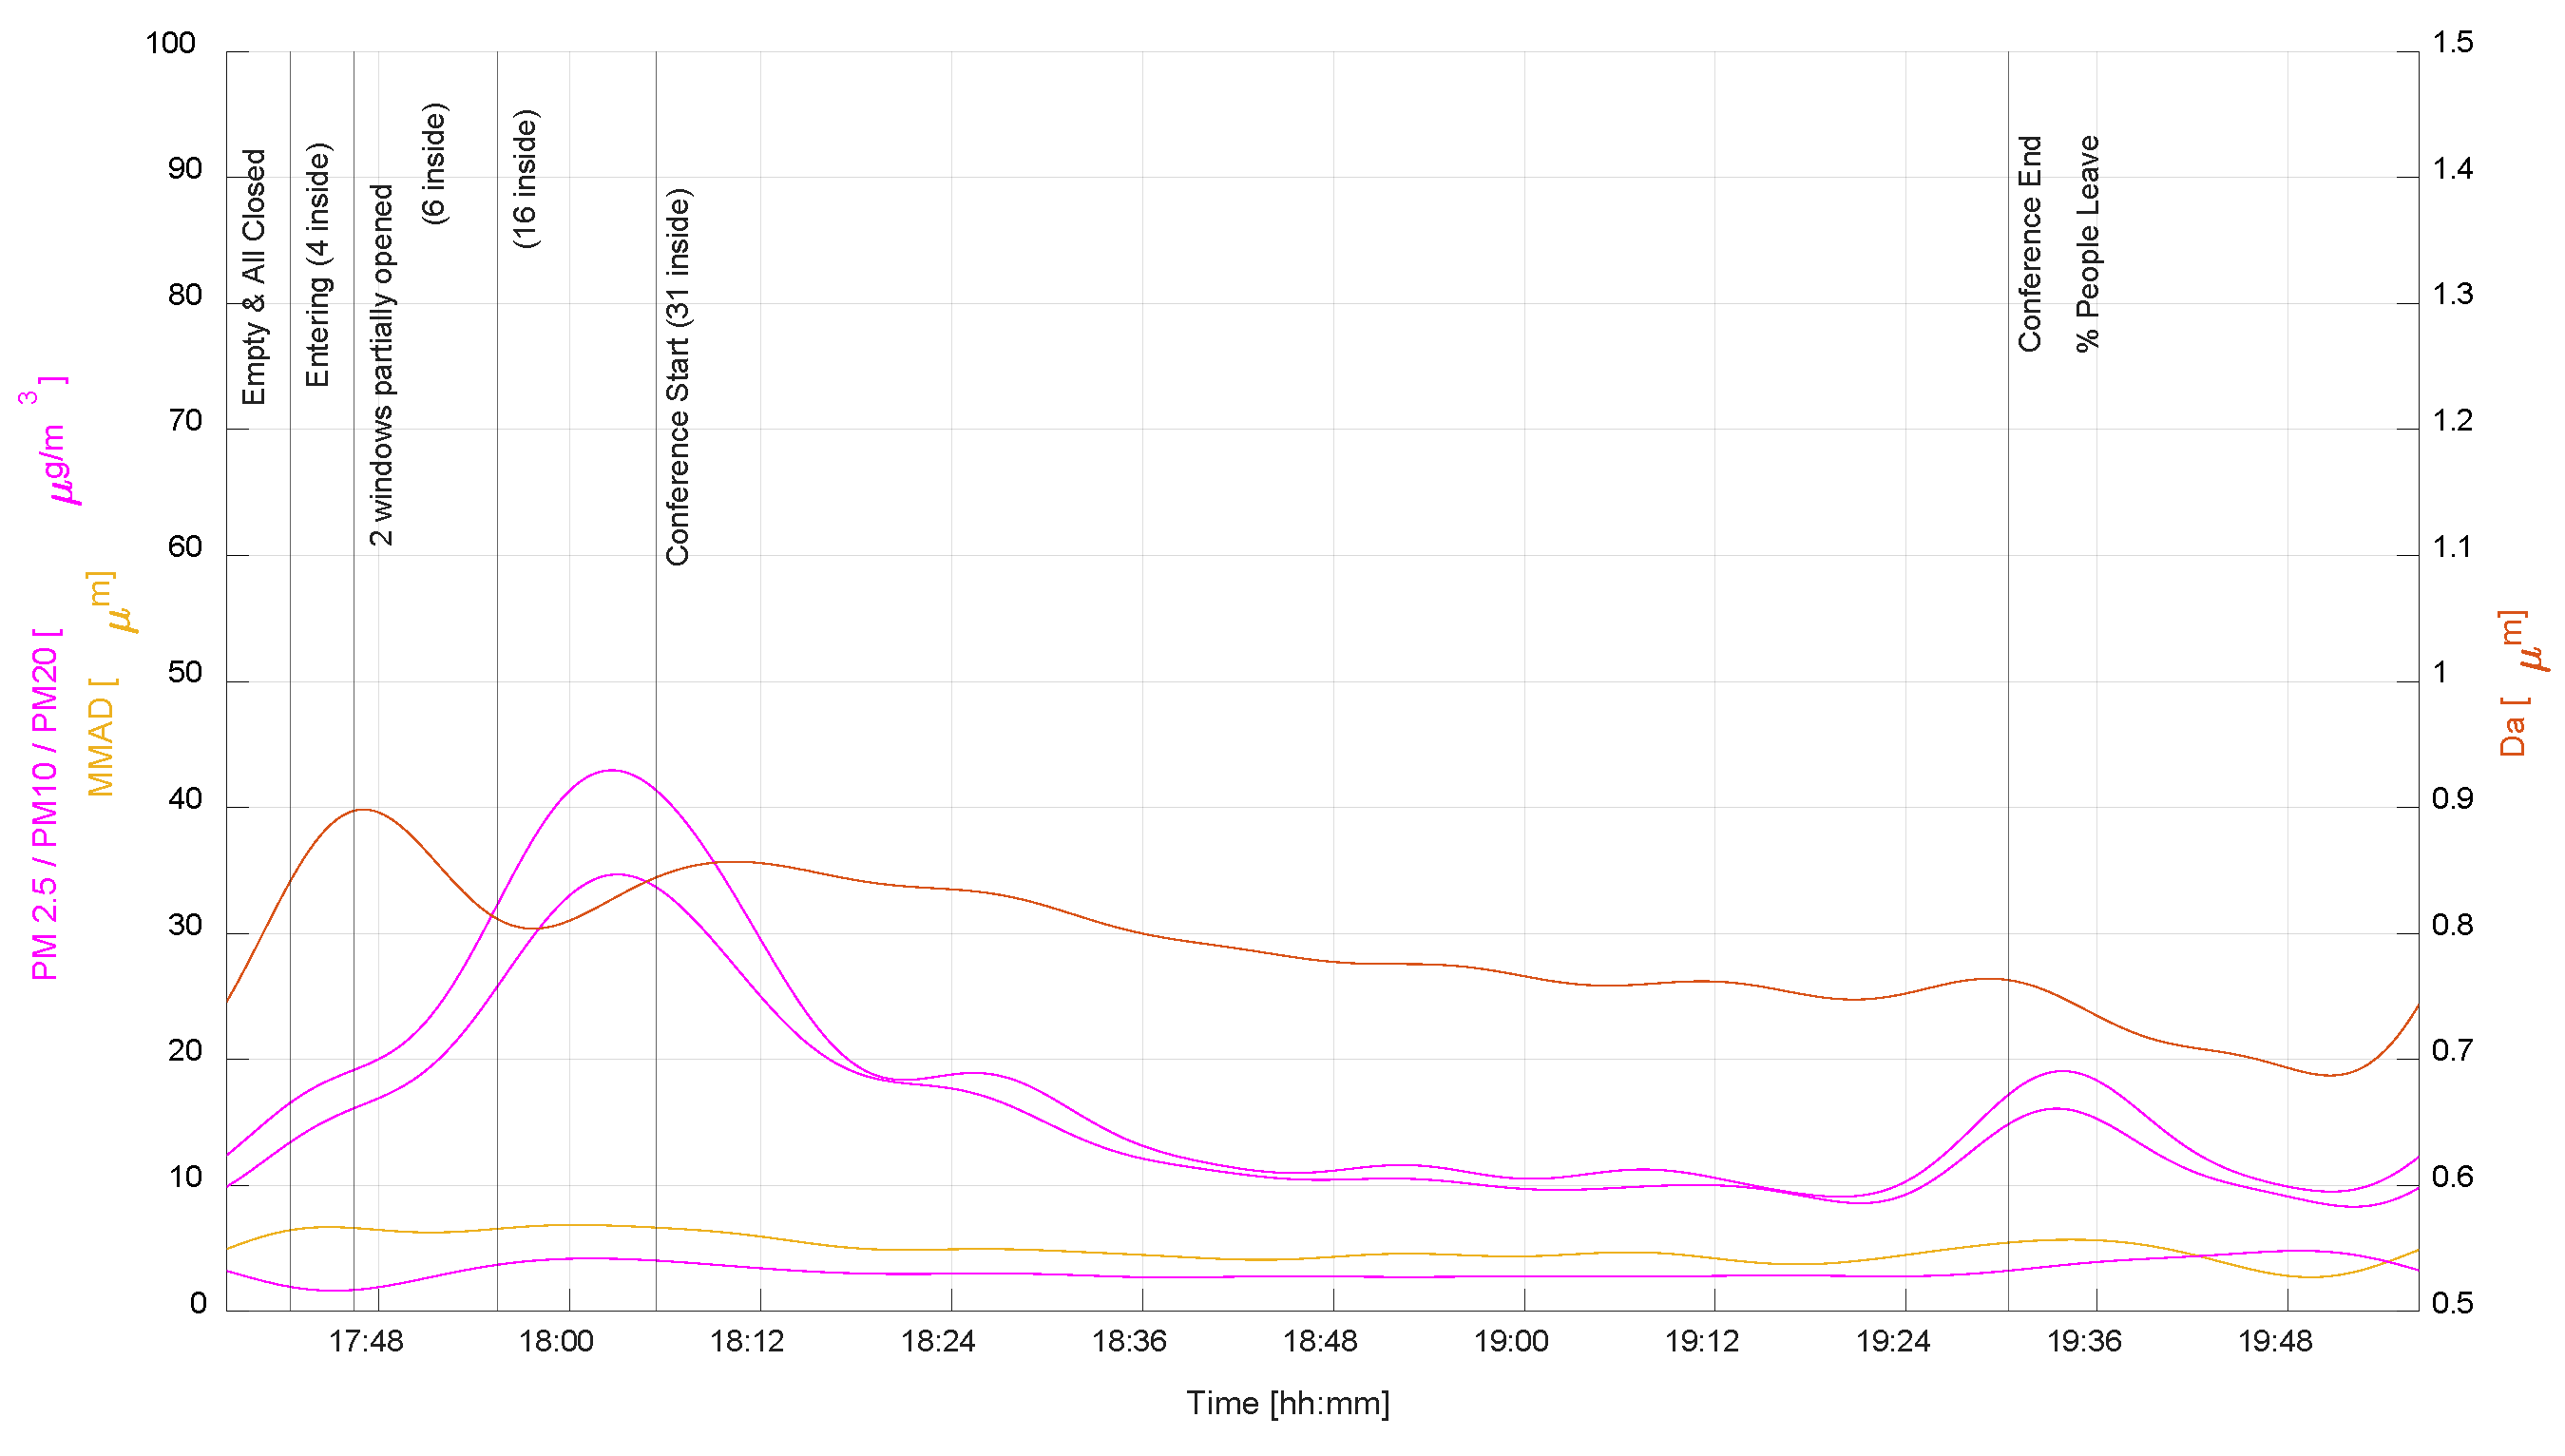
3.5. Ignacio Aldecoa Library—Conference Room
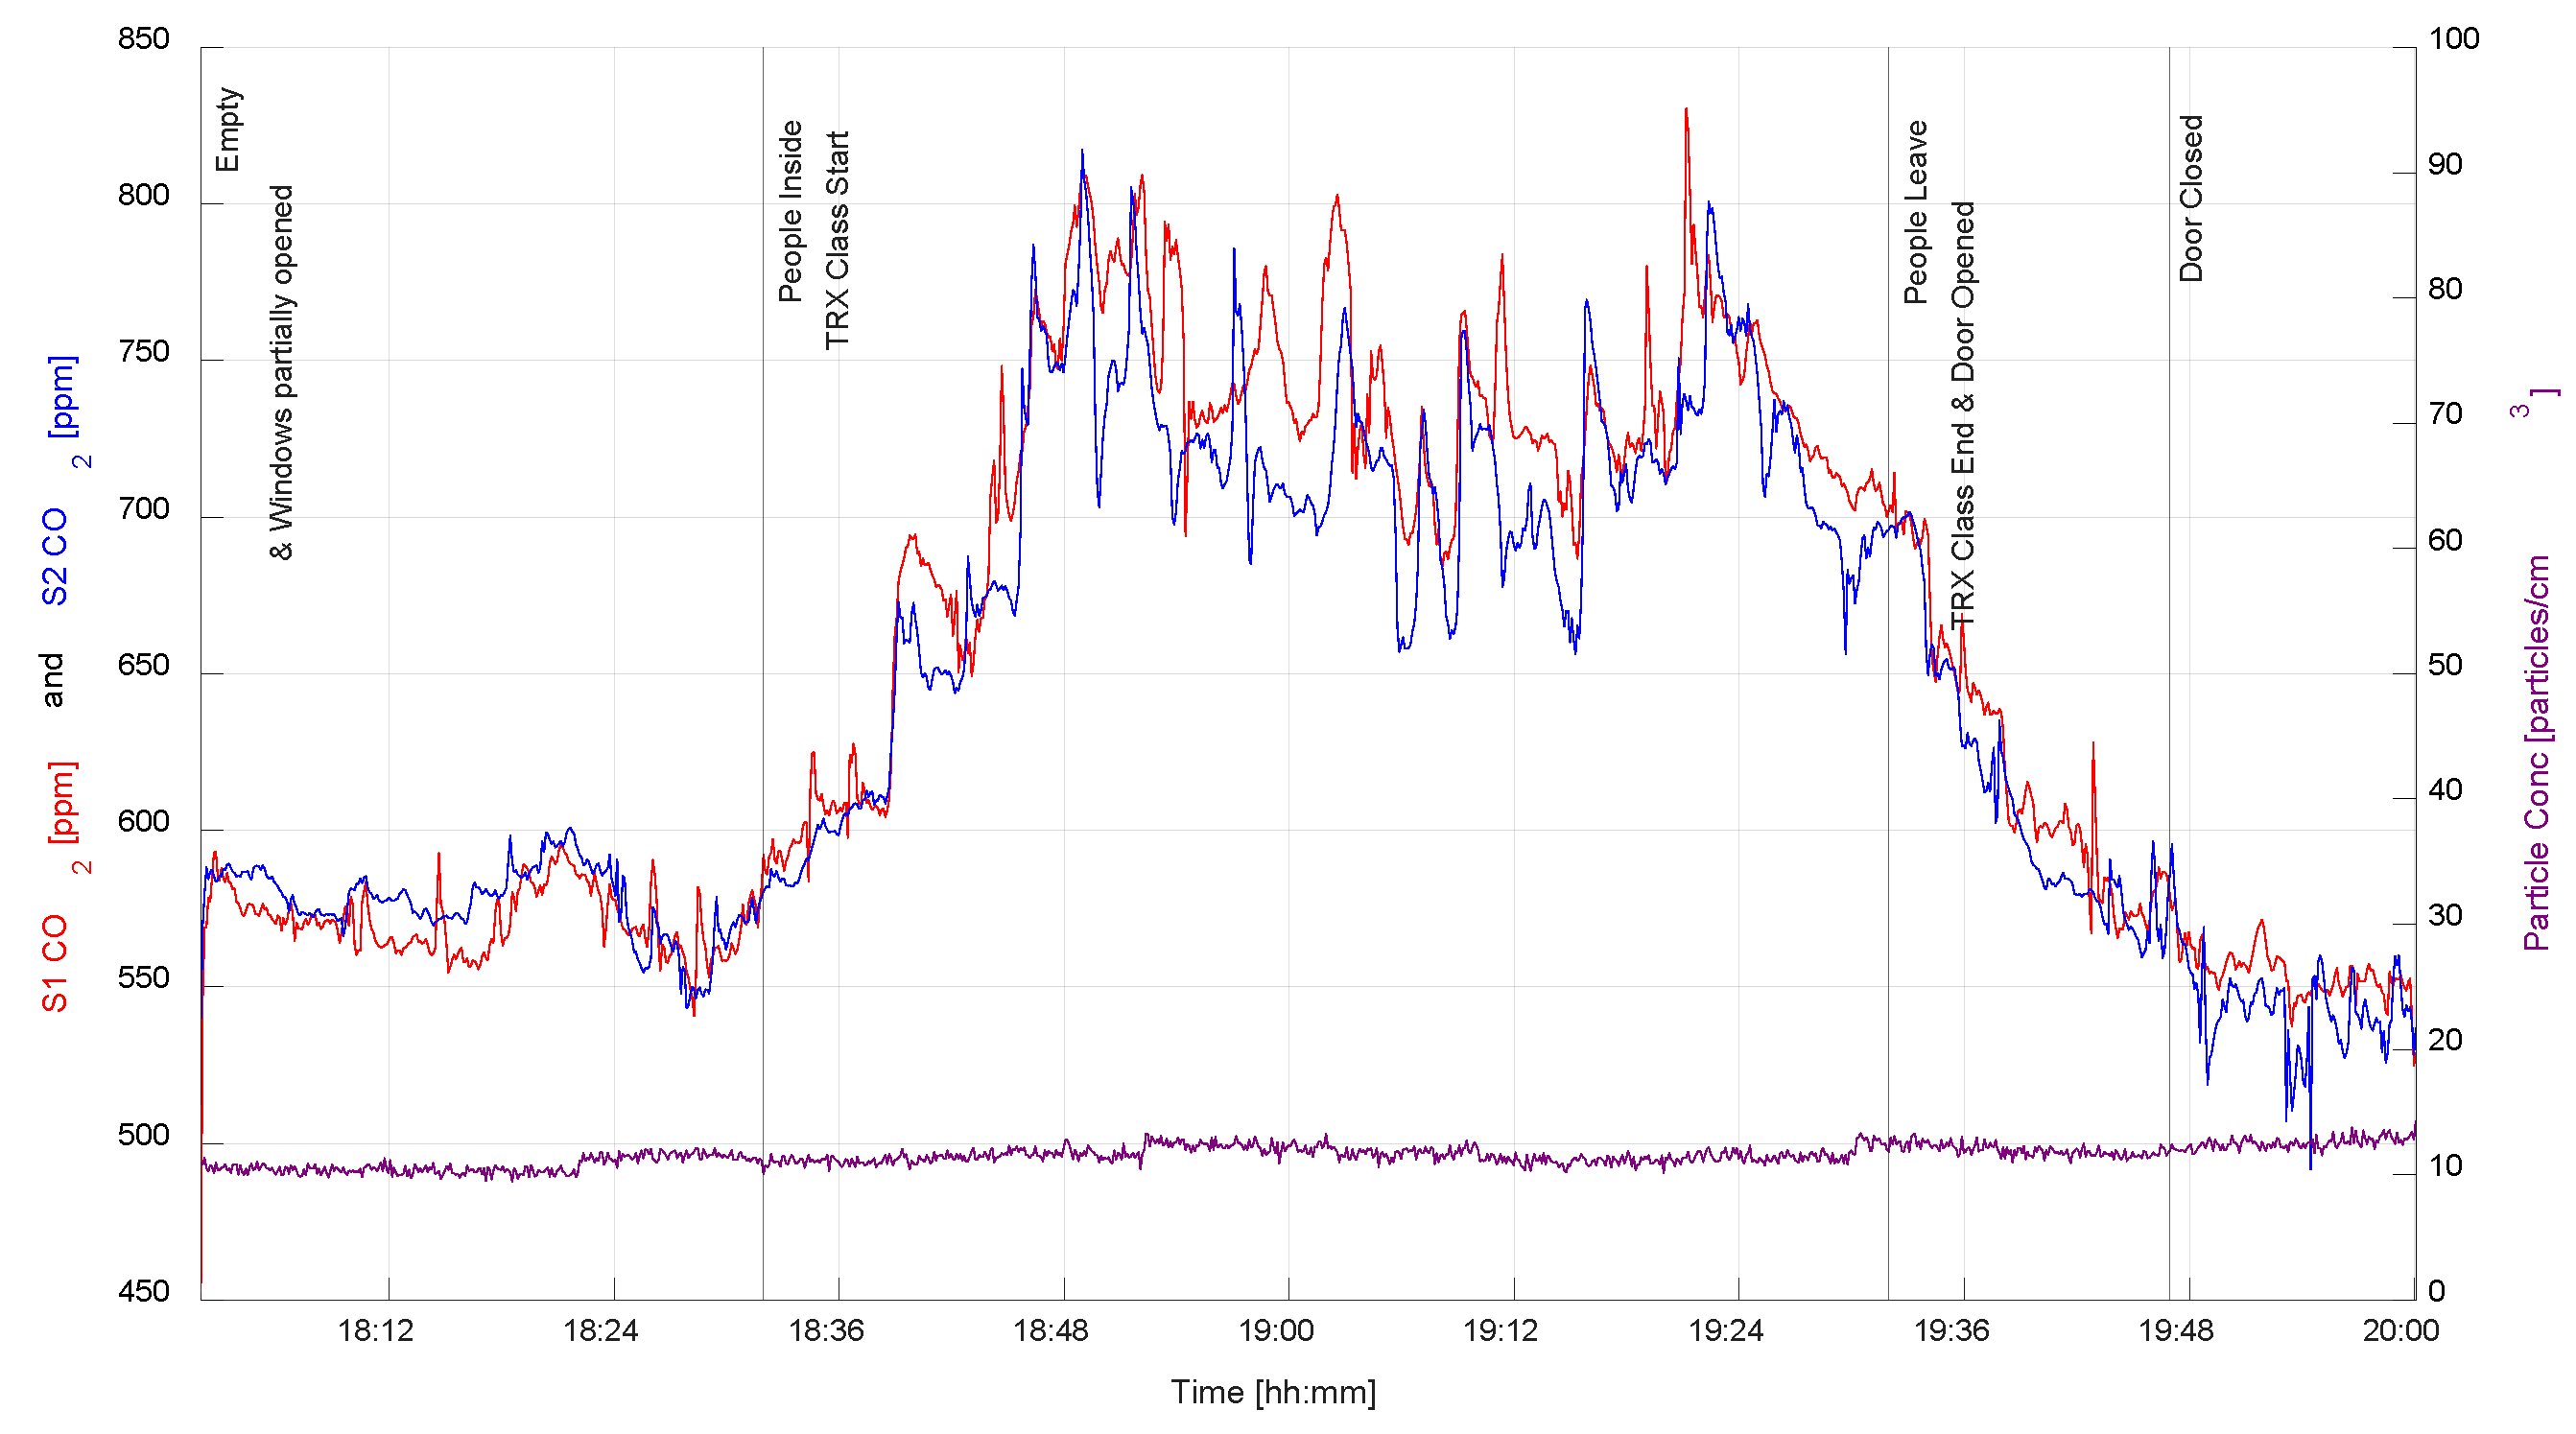
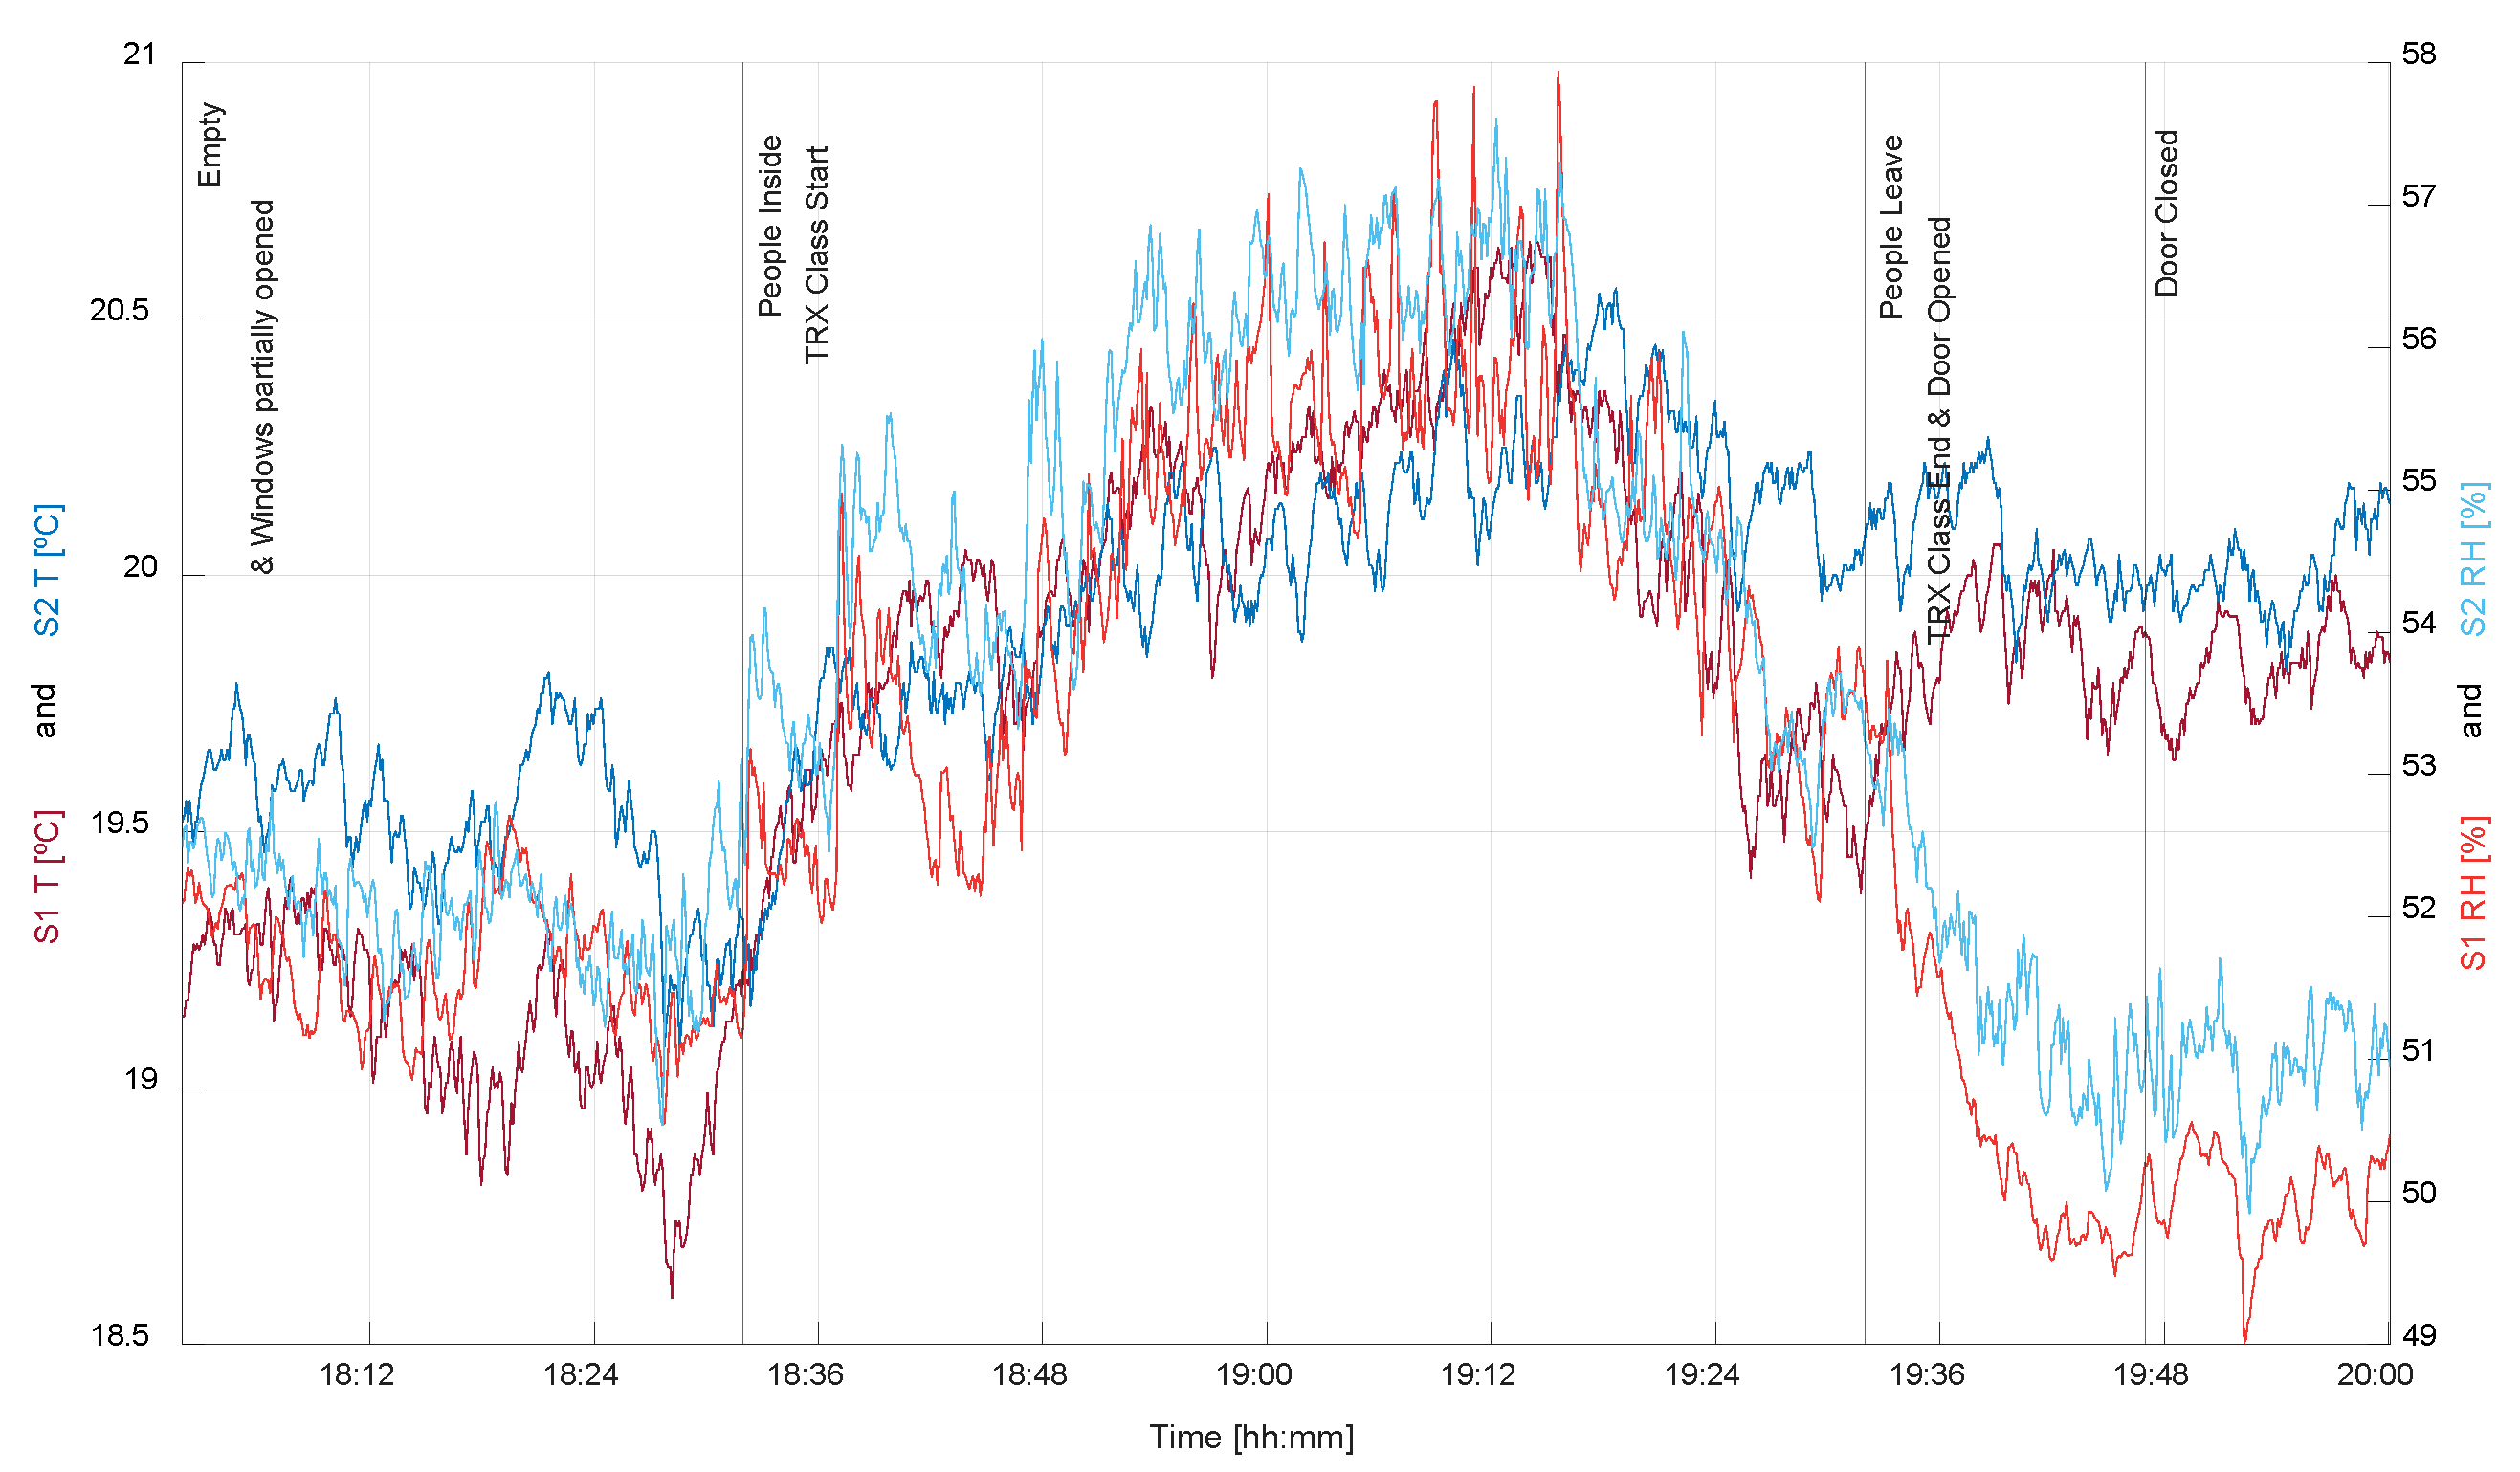
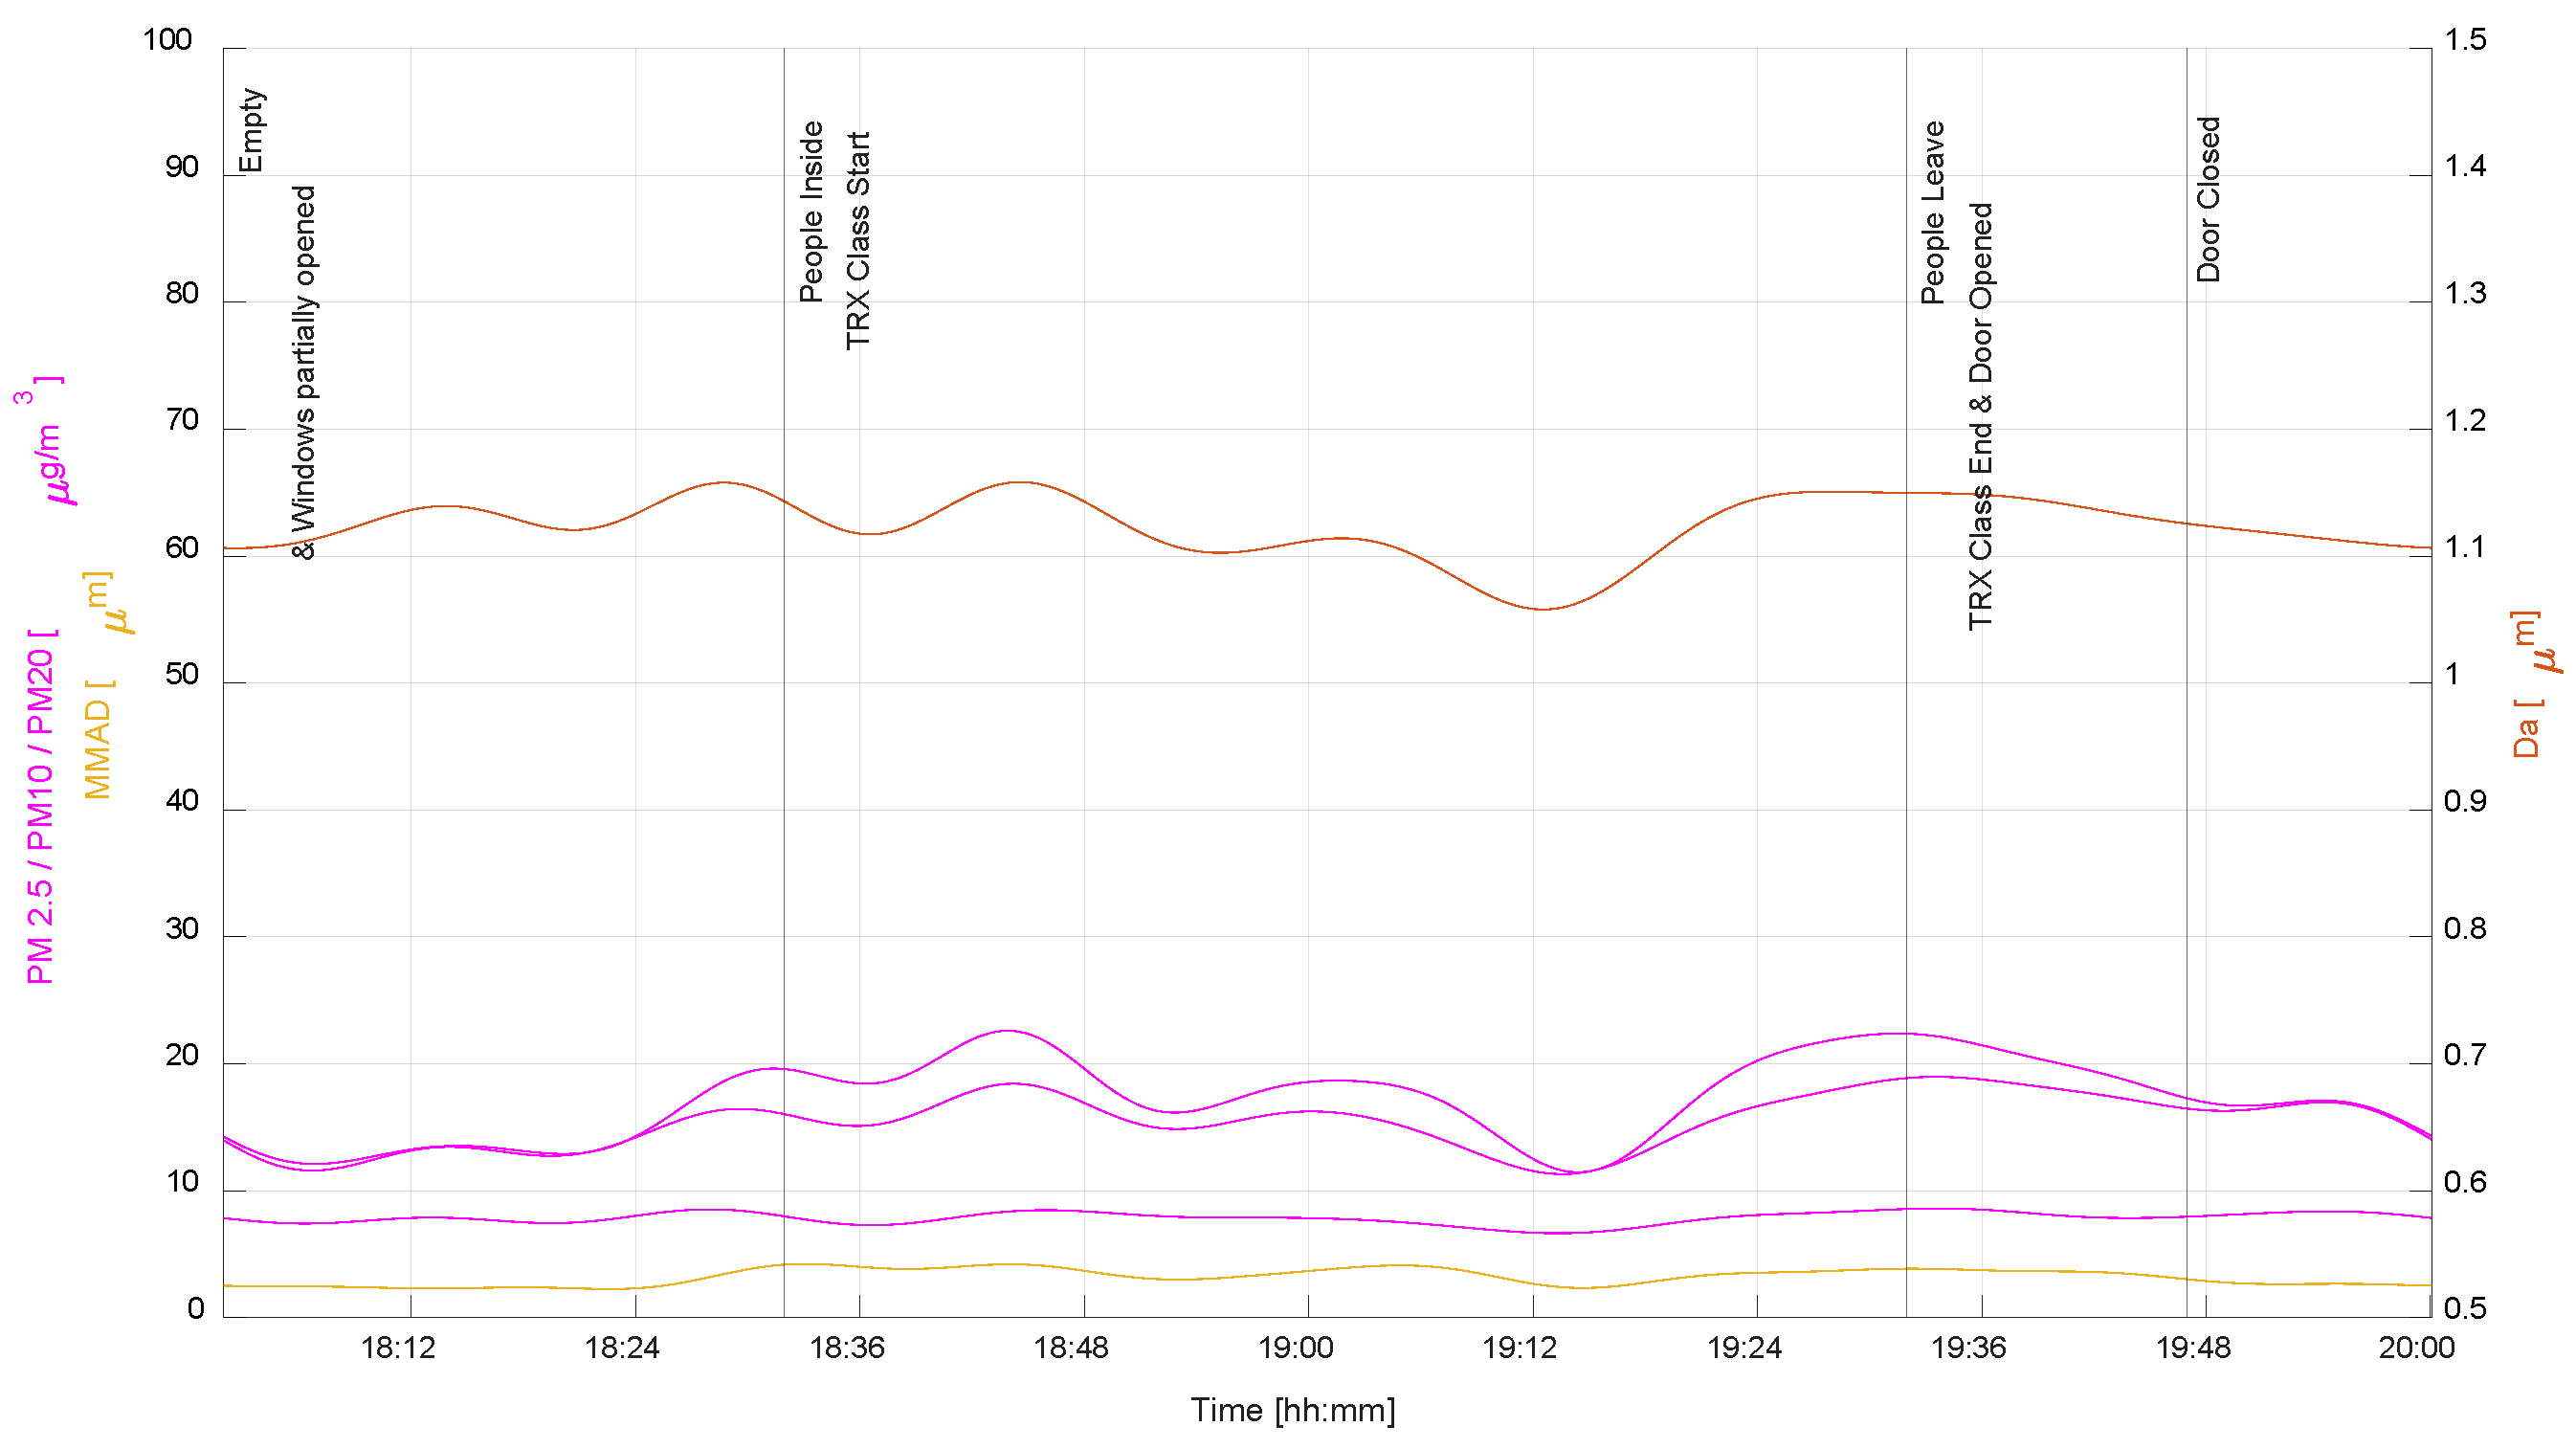
3.6. Mendizorroza Sports Facilities—Training Room
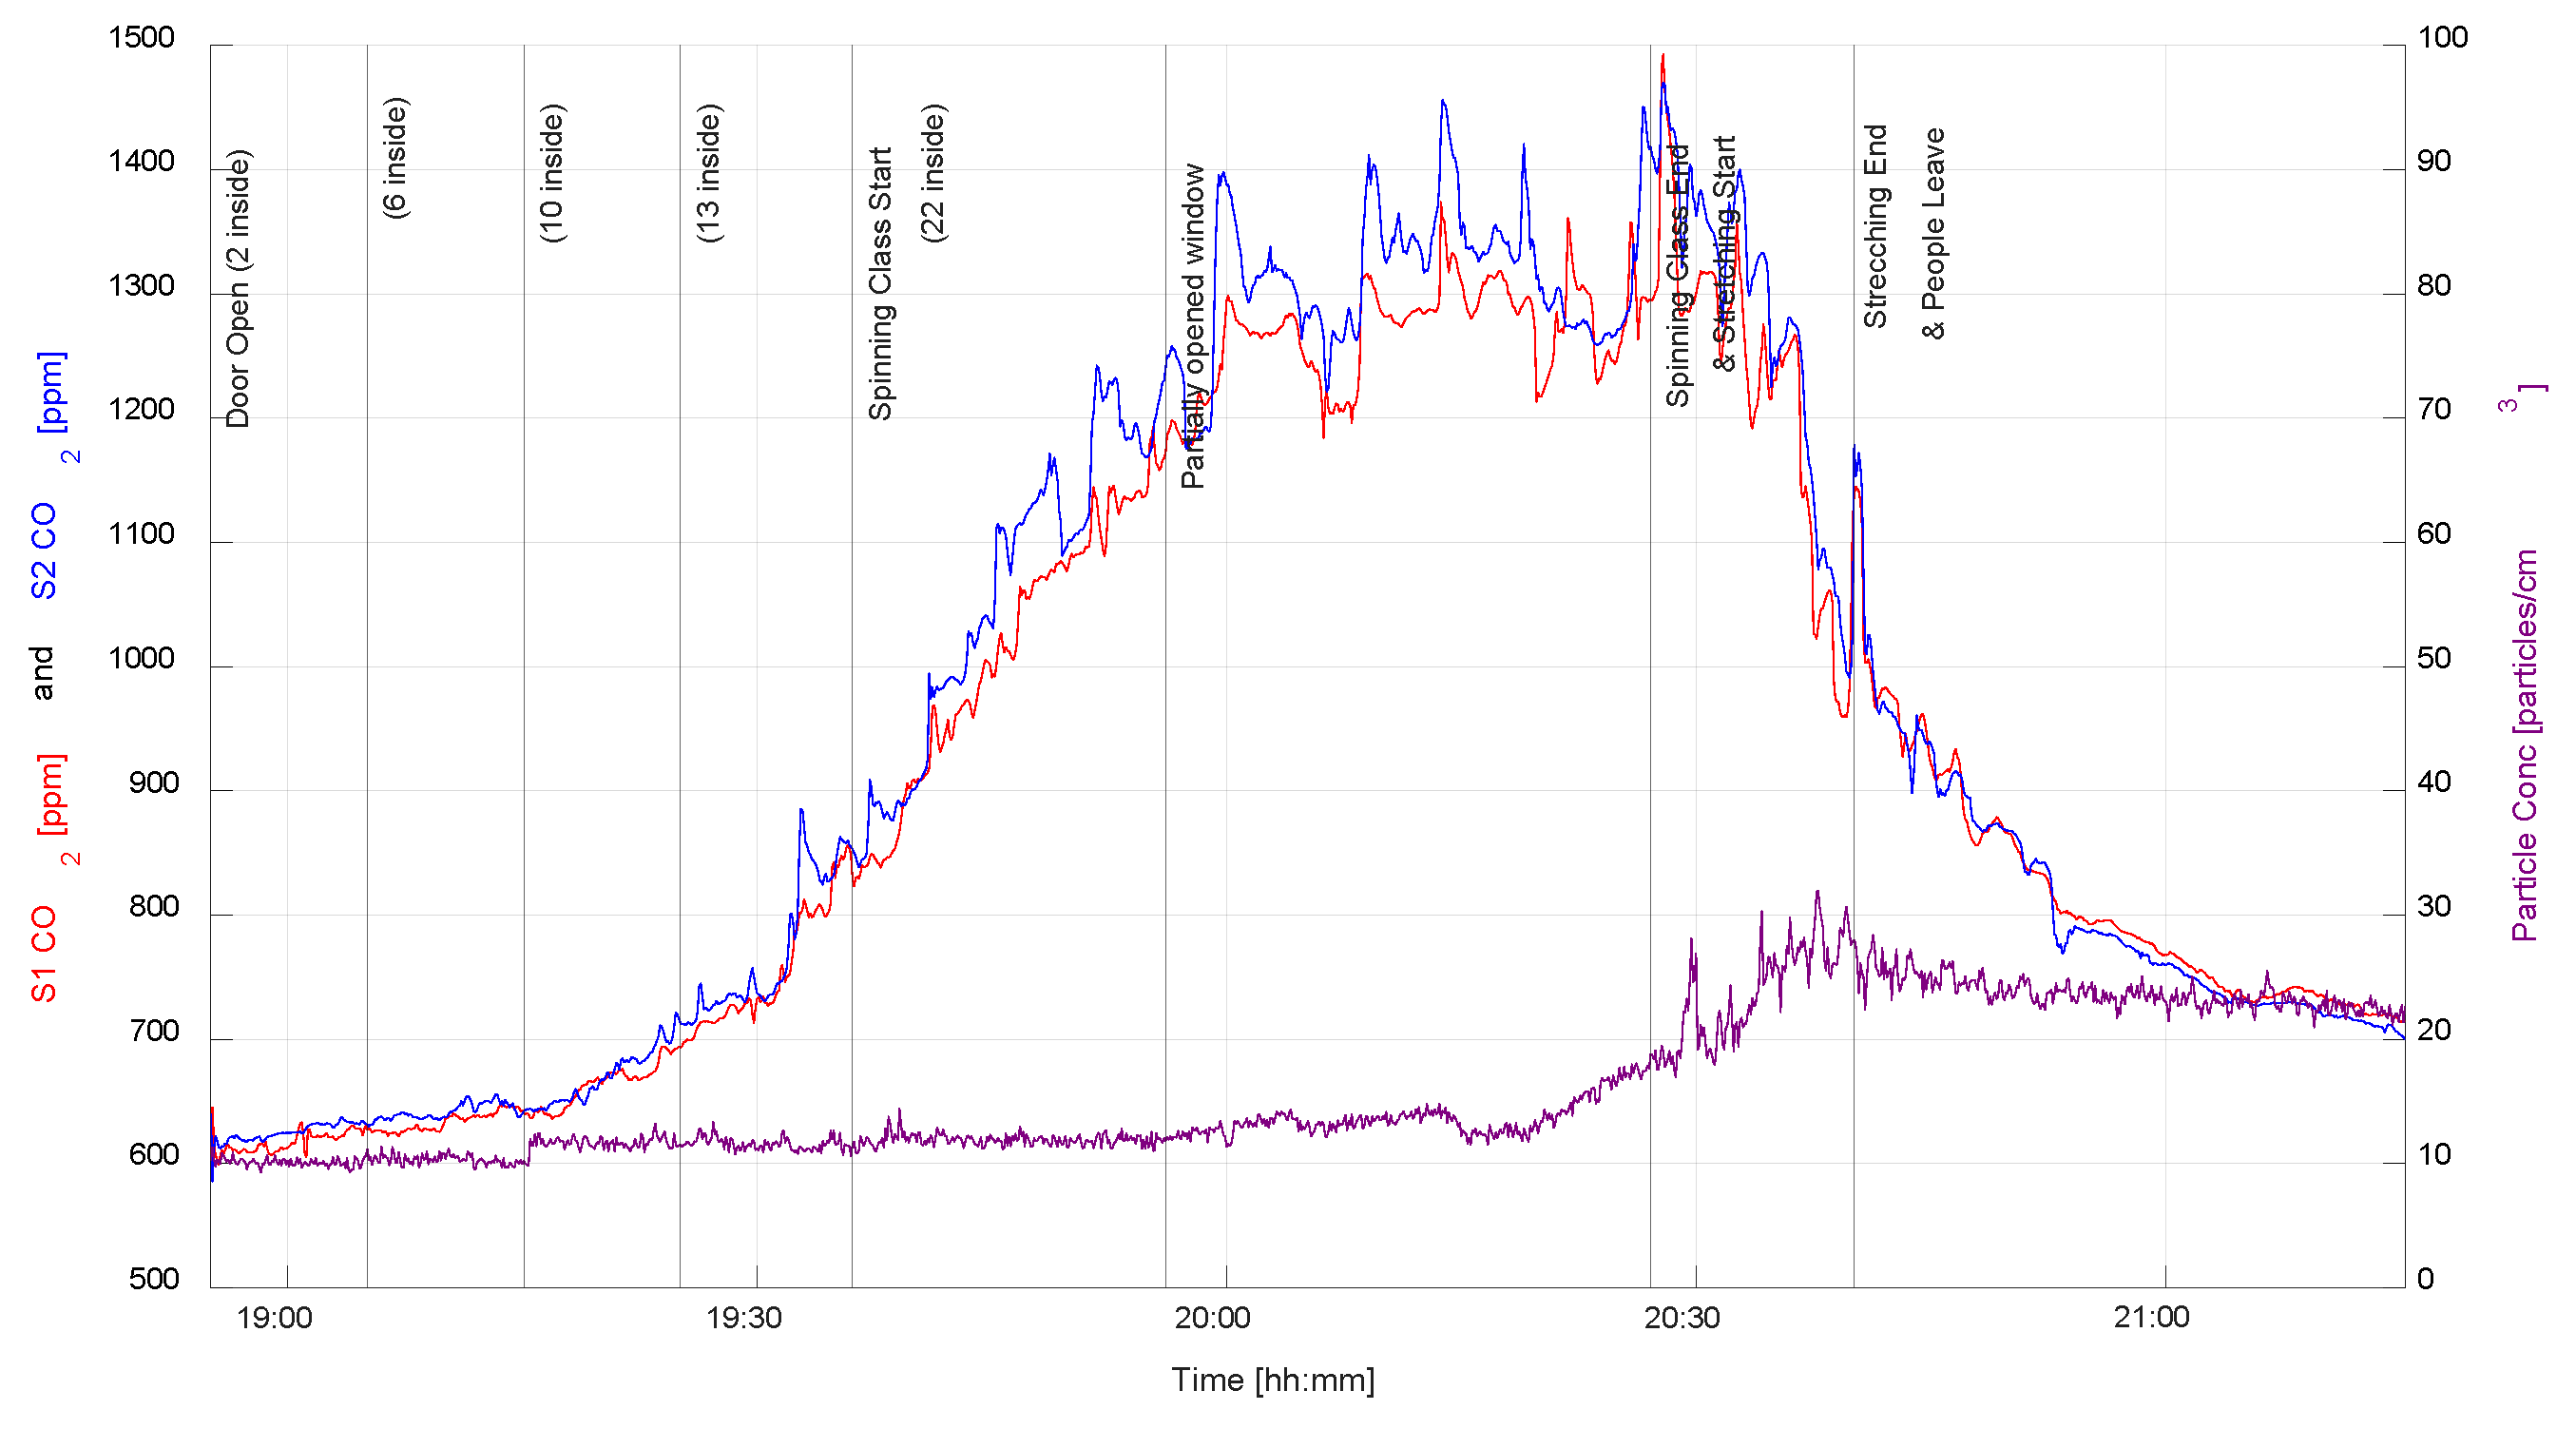
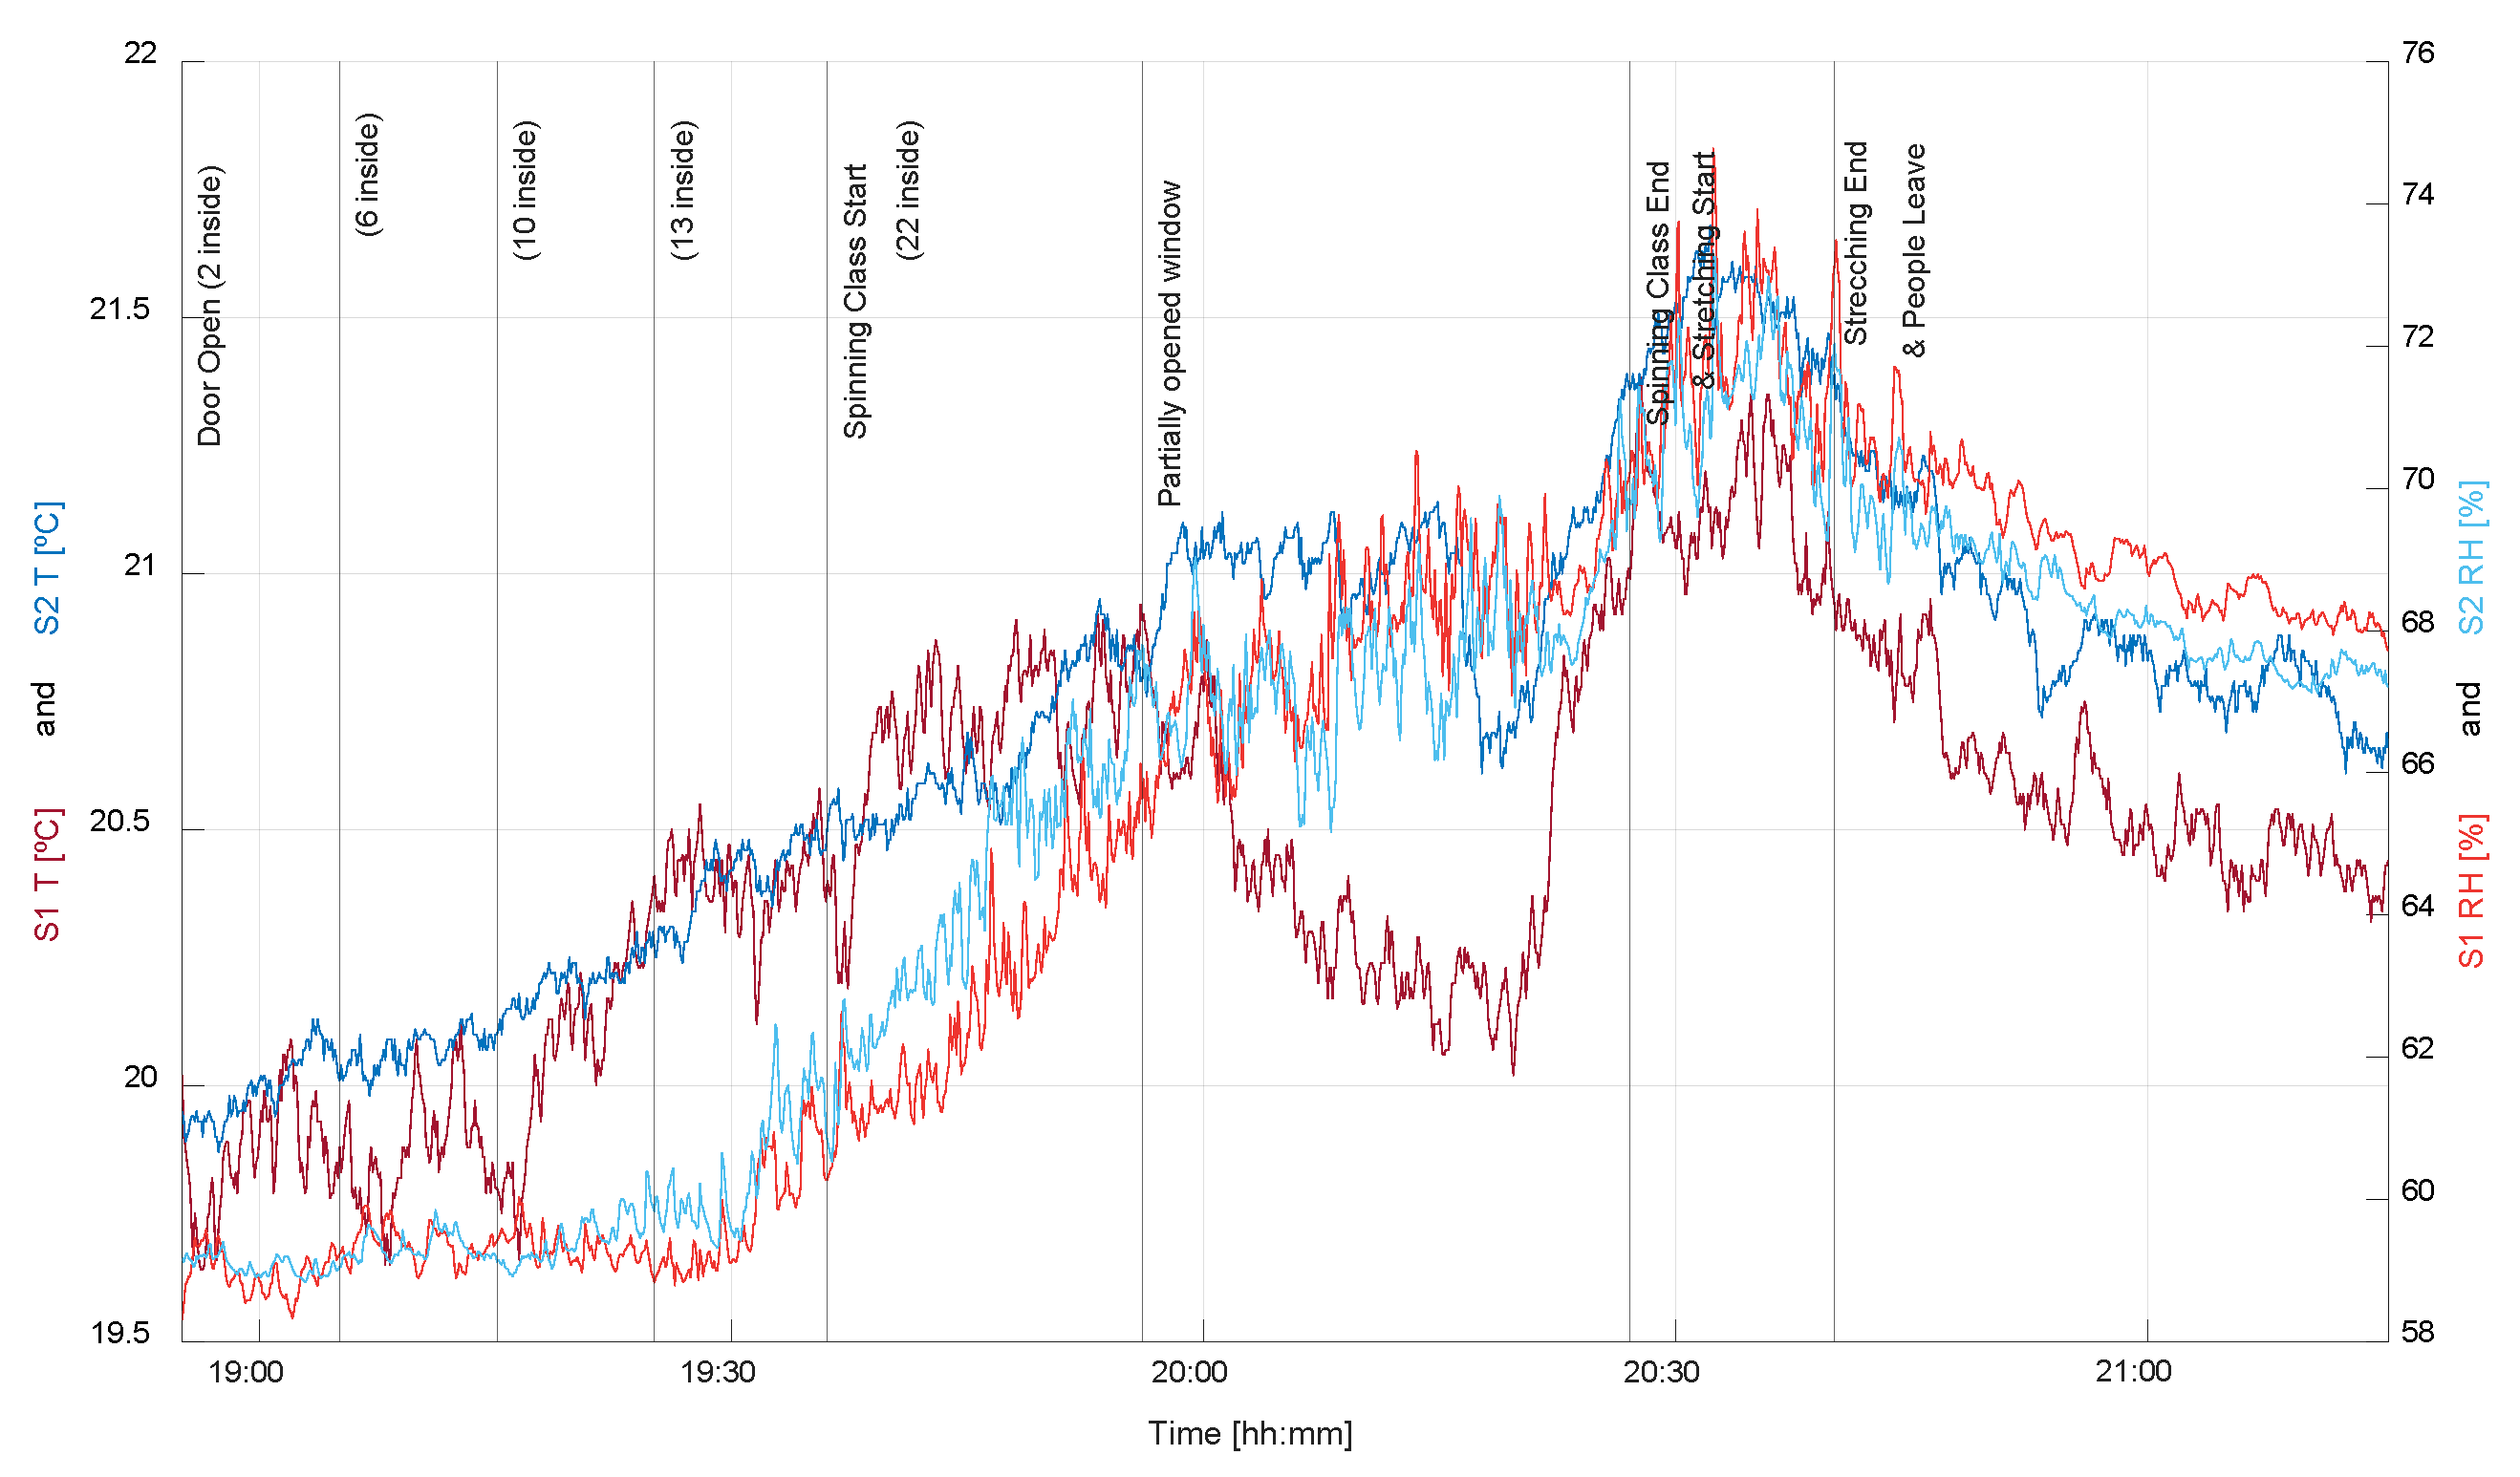
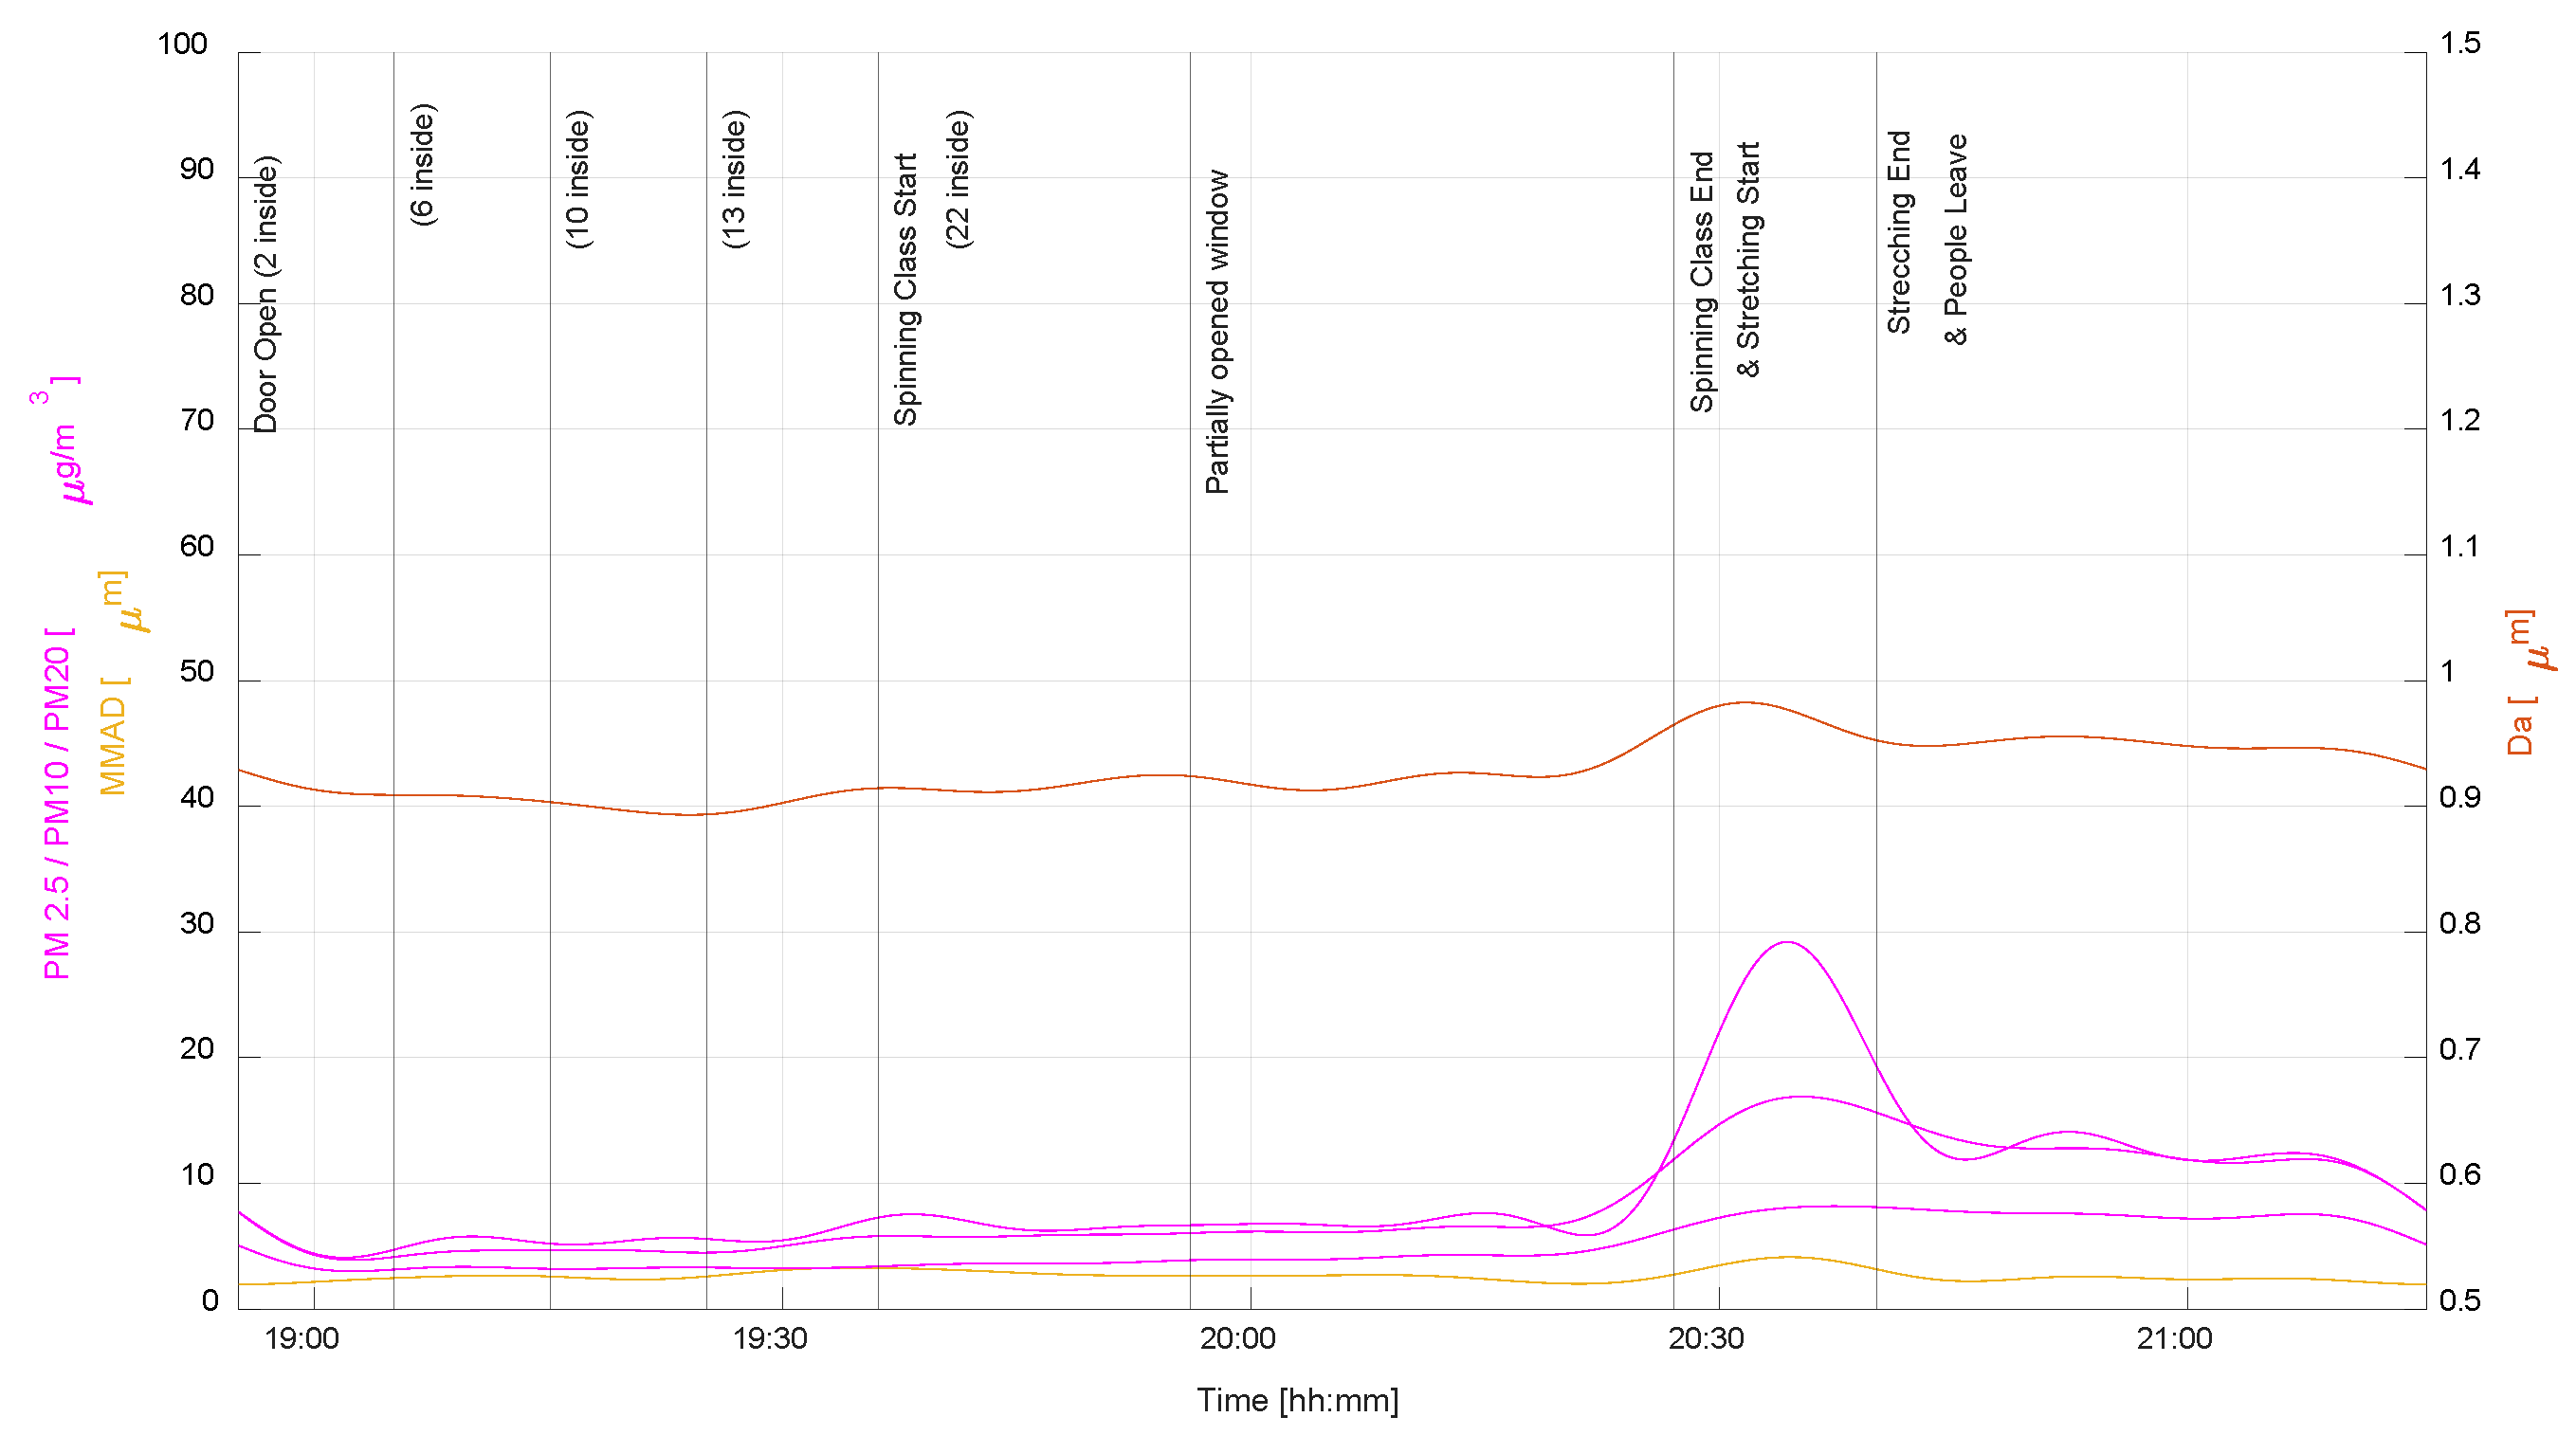
3.7. Mendizorroza Sports Facilities—Spinning Room
4. Discussion and Measurement Comparison
5. Conclusions
- Drastic decreases in the CO2 concentration are observed within a few minutes of ventilation after no-ventilation intervals. This leads to a drop in temperature that is always associated with an increase in relative humidity.
- The no-ventilation scenario with people inside the enclosed space forces the carbon dioxide concentration to linearly increase for the first 20 min.
- In the case of the interior building environment containing a lower particulate matter concentration than that in the outside environment, the natural ventilation strategy simultaneously combining windows and doors more quickly increases the particulate matter concentration in the enclosed space over the strategy involving only windows.
- When the sensors are at the same height, the measured carbon dioxide values are almost equal. The only notorious case is when the sensor located at 0.6 m measures higher concentrations of CO2 in low intensity scenarios compared to the sensor located at 1.1 m height. The rest of the measurements present higher level of concentration for the sensor being at the height of the mouth of the individuals. Therefore, sensors must be properly situated and approximately at the height where the mouths of the individuals are expected to be. Including sensors at different heights has shown to be efficient in corroborating this effect.
- Medium- and high-intensity activities do not show a notable difference due to the excessive movement of air produced by air conditioning and movement of people, as reported by Bhagat et al. [28]. Further measurements should be made in order to clarify the effects of high-intensity activities with the help of more sensors and repeating the activity, e.g., with air conditioning on and off. Moreover, other ventilation systems could be studied to compare them, even filtering, but cost of these systems cannot be afforded for typical buildings as schools, libraries or gyms.
- The less the pollutants, the shorter the time required to get rid of them. Therefore, designing a building in advance with proper location of the windows, doors and other overtures on the enclosed spaces preventing the entrance of pollutants from the outside is shown as the most effective way of reducing such pollutants.
- Measurement 6, located in the training room, indicated a difference from the rest of the enclosed-space measurements in this study. Notably, another room was present on the other side of the windows, whereas the outside environment applied among the rest of the measurement spaces. This particularity, which isolated the indoor ambient and outdoor environments, prevented particulate matter from entering the enclosed space where the activity occurred, maintaining a stable and low level even with the windows or both the windows and doors opened.
- Designing buildings with an air chamber between windows and the outdoors would be an efficient strategy to reduce PM concentrations, e.g., having an external crystal envelope around it, as presented in in results of measurement 6 and in the 2D drawing included in the Supplementary Material of the current article. It must be clarified that in this case, there is a crystal curtain in front of the windows, which is only connected to the building by structural beams at each floor and to the top roof by a hermetic metallic-crystal coverture that prevents from wind, rain and snow effects. Thus, this strategy is recommended to maintain adequate IAQ conditions.
- Natural ventilation from window to window crossing the area of the enclosed space is presented as a very efficient way of reducing CO2 concentrations in a short period of time. Therefore, it is advisable to design a building providing enclosed spaces this capability in order to also maintain adequate IAQ conditions.
- There is a relationship between high levels of carbon dioxide and the probability of infection risk. Moreover, the probability of infection risk after a long period of no ventilation or once it reaches the maximum value of 100% barely presents any reduction.
Supplementary Materials
Author Contributions
Funding
Data Availability Statement
Acknowledgments
Conflicts of Interest
References
- Hafner, C.M. The Spread of the COVID-19 Pandemic in Time and Space. Int. J. Environ. Res. Public Health 2020, 17, 3827. [Google Scholar] [CrossRef] [PubMed]
- Su, S.; Du, L.; Jiang, S. Learning from the past: Development of safe and effective COVID-19 vaccines. Nat. Rev. Microbiol. 2021, 19, 211–219. [Google Scholar] [CrossRef] [PubMed]
- Lopez Bernal, J.; Andrews, N.; Gower, C.; Gallagher, E.; Simmons, R.; Thelwall, S.; Stowe, J.; Tessier, E.; Groves, N.; Dabrera, G.; et al. Effectiveness of COVID-19 Vaccines against the B.1.617.2 (Delta) Variant. N. Engl. J. Med. 2021, 385, 585–594. [Google Scholar] [CrossRef] [PubMed]
- Kupferschmidt, K. Where did “weird” Omicron come from? Science 2021, 374, 1179. [Google Scholar] [CrossRef] [PubMed]
- Lyke, K.E.; Atmar, R.L.; Islas, C.D.; Posavad, C.M.; Szydlo, D.; PaulChourdhury, R.; Deming, M.E.; Eaton, A.; Jackson, L.A.; Branche, A.R.; et al. SARS-CoV-2 Omicron Neutralization after Heterologous Vaccine Boosting. medRxiv 2022. [Google Scholar] [CrossRef]
- Cameroni, E.; Bowen, J.E.; Rosen, L.E.; Saliba, C.; Zepeda, S.K.; Culap, K.; Pinto, D.; VanBlargan, L.A.; De Marco, A.; di Iulio, J.; et al. Broadly neutralizing antibodies overcome SARS-CoV-2 Omicron antigenic shift. Nature 2022, 602, 664–670. [Google Scholar] [CrossRef] [PubMed]
- Hasnain, M.; Pasha, M.F.; Ghani, I. Combined measures to control the COVID-19 pandemic in Wuhan, Hubei, China: A narrative review. J. Biosaf. Biosecurity 2020, 2, 51–57. [Google Scholar] [CrossRef] [PubMed]
- Schibuola, L.; Tambani, C. High energy efficiency ventilation to limit COVID-19 contagion in school environments. Energy Build. 2021, 240, 110882. [Google Scholar] [CrossRef] [PubMed]
- Shao, S.; Zhou, D.; He, R.; Li, J.; Zou, S.; Mallery, K.; Kumar, S.; Yang, S.; Hong, J. Risk assessment of airborne transmission of COVID-19 by asymptomatic individuals under different practical settings. J. Aerosol Sci. 2021, 151, 105661. [Google Scholar] [CrossRef]
- William, M.A.; Suárez-López, M.J.; Soutullo, S.; Fouad, M.; Hanafy, A.A.; El-Maghlany, W.M. Multi-objective integrated BES-CFD co-simulation approach towards pandemic proof buildings. Energy Rep. 2022, 8, 137–152. [Google Scholar] [CrossRef]
- Song, G.; Ai, Z.; Liu, Z.; Zhang, G. A systematic literature review on smart and personalized ventilation using CO2 concentration monitoring and control. Energy Rep. 2022, 8, 7523–7536. [Google Scholar] [CrossRef]
- Buonanno, G.; Stabile, L.; Morawska, L. Estimation of airborne viral emission: Quanta emission rate of SARS-CoV-2 for infection risk assessment. Environ. Int. 2020, 141, 105794. [Google Scholar] [CrossRef]
- Burgmann, S.; Janoske, U. Transmission and reduction of aerosols in classrooms using air purifier systems. Phys. Fluids 2021, 33, 033321. [Google Scholar] [CrossRef] [PubMed]
- Foster, A.; Kinzel, M. Estimating COVID-19 exposure in a classroom setting: A comparison between mathematical and numerical models. Phys. Fluids 2021, 33, 021904. [Google Scholar] [CrossRef] [PubMed]
- Wang, Z.; Galea, E.R.; Grandison, A.; Ewer, J.; Jia, F. A coupled Computational Fluid Dynamics and Wells-Riley model to predict COVID-19 infection probability for passengers on long-distance trains. Saf. Sci. 2022, 147, 105572. [Google Scholar] [CrossRef] [PubMed]
- Alcamí, A.; Val, M.D.; Hernán, M.; Latassa, P.; Jiménez, J.L.; Querol, X.; Robustillo, A.; Sánchez Moragas, G.; Valencia, A. Informe Científico Sobre vías de Transmisión SARS-CoV-2; Consejo Superior de Investigaciones Científicas (España): Madrid, Spain, 2020; p. 25. [Google Scholar]
- Zhang, R.; Li, Y.; Zhang, A.L.; Wang, Y.; Molina, M.J. Identifying airborne transmission as the dominant route for the spread of COVID-19. Proc. Natl. Acad. Sci. USA 2020, 117, 14857–14863. [Google Scholar] [CrossRef] [PubMed]
- Qian, H.; Miao, T.; Liu, L.; Zheng, X.; Luo, D.; Li, Y. Indoor transmission of SARS-CoV-2. Indoor Air 2021, 31, 639–645. [Google Scholar] [CrossRef]
- Bartyzel, J.; Zięba, D.; Nęcki, J.; Zimnoch, M. Assessment of Ventilation Efficiency in School Classrooms Based on Indoor–Outdoor Particulate Matter and Carbon Dioxide Measurements. Sustainability 2020, 12, 5600. [Google Scholar] [CrossRef]
- European Commission. SINPHONIE: Schools Indoor Pollution & Health Observatory Network in Europe: Final Report; Publications Office: Luxemburg, 2014. [Google Scholar] [CrossRef]
- Persily, A. Indoor Carbon Dioxide Concentrations in Ventilation and Indoor Air Quality Standards. In Proceedings of the 36th Air Infiltration and Ventilation Centre Conference, Madrid, Spain, 23–24 September 2015; Available online: https://tsapps.nist.gov/publication/get_pdf.cfm?pub_id=919027 (accessed on 22 December 2021).
- Hou, Y.; Liu, J.; Li, J. Investigation of Indoor Air Quality in Primary School Classrooms. Procedia Eng. 2015, 121, 830–837. [Google Scholar] [CrossRef]
- UNE-EN 16798-1:2020; Energy Performance of Buildings—Ventilation for Buildings—Part 1: Indoor Environmental Input Parameters for Design and Assessment of Energy Performance of Buildings Addressing Indoor Air Quality, Thermal Environment, Lighting and Acoustics. Asociación Española de Normalización y Certificación: Madrid, Spain, 2020.
- Morawska, L.; Tang, J.W.; Bahnfleth, W.; Bluyssen, P.M.; Boerstra, A.; Buonanno, G.; Cao, J.; Dancer, S.; Floto, A.; Franchimon, F.; et al. How can airborne transmission of COVID-19 indoors be minimised? Environ. Int. 2020, 142, 105832. [Google Scholar] [CrossRef]
- Pulimeno, M.; Piscitelli, P.; Colazzo, S.; Colao, A.; Miani, A. Indoor air quality at school and students’ performance: Recommendations of the UNESCO Chair on Health Education and Sustainable Development & the Italian Society of Environmental Medicine (SIMA). Health Promot. Perspect. 2020, 10, 169–174. [Google Scholar] [CrossRef] [PubMed]
- Dinh, T.-V.; Lee, J.-Y.; Ahn, J.-W.; Kim, J.-C. Development of a Wide-Range Non-Dispersive Infrared Analyzer for the Continuous Measurement of CO2 in Indoor Environments. Atmosphere 2020, 11, 1024. [Google Scholar] [CrossRef]
- To, G.N.S.; Chao, C.Y.H. Review and comparison between the Wells–Riley and dose-response approaches to risk assessment of infectious respiratory diseases. Indoor Air 2010, 20, 2–16. [Google Scholar] [CrossRef]
- Bhagat, R.K.; Wykes, M.S.D.; Dalziel, S.B.; Linden, P.F. Effects of ventilation on the indoor spread of COVID-19. J. Fluid Mech. 2020, 903, F1. [Google Scholar] [CrossRef] [PubMed]
- Wang, R.; Xiong, Y.; Xing, X.; Yang, R.; Li, J.; Wang, Y.; Cao, J.; Balkanski, Y.; Peñuelas, J.; Ciais, P.; et al. Daily CO2 Emission Reduction Indicates the Control of Activities to Contain COVID-19 in China. Innovation 2020, 1, 100062. [Google Scholar] [CrossRef] [PubMed]
- Li, J.; Hou, Y.; Liu, J.; Wang, Z.; Li, F. Window purifying ventilator using a cross-flow fan: Simulation and optimization. Build. Simul. 2016, 9, 481–488. [Google Scholar] [CrossRef]
- Domínguez-Amarillo, S.; Fernández-Agüera, J.; Cesteros-García, S.; González-Lezcano, R.A. Bad Air Can Also Kill: Residential Indoor Air Quality and Pollutant Exposure Risk during the COVID-19 Crisis. Int. J. Environ. Res. Public Health 2020, 17, 7183. [Google Scholar] [CrossRef] [PubMed]
- Satish, U.; Mendell, M.J.; Shekhar, K.; Hotchi, T.; Sullivan, D.; Streufert, S.; Fisk, W.J. Is CO2 an Indoor Pollutant? Direct Effects of Low-to-Moderate CO2 Concentrations on Human Decision-Making Performance. Environ. Health Perspect. 2012, 120, 1671–1677. [Google Scholar] [CrossRef] [PubMed]
- Rumchev, K.; Zhao, Y.; Spickett, J. Health Risk Assessment of Indoor Air Quality, Socioeconomic and House Characteristics on Respiratory Health among Women and Children of Tirupur, South India. Int. J. Environ. Res. Public Health 2017, 14, 429. [Google Scholar] [CrossRef]
- Aramendia, I.; Fernandez-Gamiz, U.; Lopez-Arraiza, A.; Rey-Santano, C.; Mielgo, V.; Basterretxea, F.J.; Sancho, J.; Gomez-Solaetxe, M.A. Experimental and Numerical Modeling of Aerosol Delivery for Preterm Infants. Int. J. Environ. Res. Public Health 2018, 15, 423. [Google Scholar] [CrossRef]
- Pfeifer, S.; Müller, T.; Weinhold, K.; Zikova, N.; dos Santos, S.M.; Marinoni, A.; Bischof, O.F.; Kykal, C.; Ries, L.; Meinhardt, F.; et al. Intercomparison of 15 aerodynamic particle size spectrometers (APS 3321): Uncertainties in particle sizing and number size distribution. Atmos. Meas. Tech. 2016, 9, 1545–1551. [Google Scholar] [CrossRef]
- Chen, L.; Mao, J.; Zhao, H.; Zhou, C.; Gong, X. Size distribution and concentration of aerosol particles in Yinchuan area, China. Phys. Geogr. 2019, 40, 538–553. [Google Scholar] [CrossRef]
- Chillon, S.A.; Millan, M.; Aramendia, I.; Fernandez-Gamiz, U.; Zulueta, E.; Mendaza-Sagastizabal, X. Natural Ventilation Characterization in a Classroom under Different Scenarios. Int. J. Environ. Res. Public Health 2021, 18, 5425. [Google Scholar] [CrossRef] [PubMed]
- Kalmár, T.; Szodrai, F.; Kalmár, F. Local ventilation effectiveness dependence on the airflow pattern and temperature in the case of isothermal balanced ventilation. J. Build. Eng. 2022, 61, 105309. [Google Scholar] [CrossRef]
- Azimi, P.; Stephens, B. HVAC filtration for controlling infectious airborne disease transmission in indoor environments: Predicting risk reductions and operational costs. Build. Environ. 2013, 70, 150–160. [Google Scholar] [CrossRef] [PubMed]
- Qian, H.; Li, Y.; Nielsen, P.V.; Huang, X. Spatial distribution of infection risk of SARS transmission in a hospital ward. Build. Environ. 2009, 44, 1651–1658. [Google Scholar] [CrossRef]
- Liao, C.; Chang, C.; Liang, H. A Probabilistic Transmission Dynamic Model to Assess Indoor Airborne Infection Risks. Risk Anal. 2005, 25, 1097–1107. [Google Scholar] [CrossRef]


| M. No. | Location | Day | Period | Vent. System | Occupancy * (Xi-Xm-Xe) | Activity Intensity Level | Mask |
|---|---|---|---|---|---|---|---|
| 1 | UPV/EHU A206 classroom | 15 Dec 2021 | 11:07–13:29 | natural | 0-15-0 | Low | YES |
| 2 | UPV/EHU A206 classroom | 16 December 2021 | 11:21–13:43 | natural | 0-1-0 | Low | YES |
| 3 | Library children’s area | 22 December 2021 | 17:34–19:31 | natural | 0-40-0 | Low/medium | 14 Children NO |
| 4 | Library assembly hall | 23 December 2021 | 10:53–13:13 | natural | 0-49-0 | Low | YES |
| 5 | Library conference room | 23 December 2021 | 17:38–19:56 | natural | 0-31-0 | Low | YES |
| 6 | Gym training room | 27 December 2021 | 18:01–20:00 | natural (A/C ON) | 0-14-0 | Medium | YES |
| 7 | Gym spinning room | 28 December 2021 | 18:55–21:15 | natural (A/C ON) | 0-22-0 | Medium/high | YES |
| M. No. | Ceiling Height [m] | Floor Area [m2] | Enclosed Space Volume [m3] | Window Type | Vent. Area Min. [m2] | Vent. Area Windows [m2] | Vent. Area Doors [m2] | Vent. Area Max. [m2] | Floor Area per Person [m2] |
|---|---|---|---|---|---|---|---|---|---|
| 1 | 4.0 | 57.2 | 229 | Turn | 0.0 | 4.2 | 3.4 | 7.5 | 3.8 |
| 2 | 4.0 | 57.2 | 229 | Turn | 0.0 | 4.2 | 3.4 | 7.5 | 57.2 |
| 3 | 5.0 | 315.8 | 1579 | Centre Tilt | 0.5 | 2.4 | - | 2.4 | 7.9 |
| 4 | 3.3 | 305.5 | 1008 | Centre Tilt | 0.0 | - | 1.8 | 1.8 | 6.2 |
| 5 | 3.4 | 79.7 | 271 | Centre Tilt | 0.2 | 0.2 | - | 0.2 | 2.6 |
| 6 | 3.3 | 149.0 | 492 | Bottom Tilt | 2.4 | 2.4 | 2.0 | 4.3 | 10.6 |
| 7 | 3.0 | 116.8 | 350 | Bottom Tilt | 2.4 | 0.4 | 2.4 | 2.8 | 5.3 |
| M. No. | Closest Weather Station | Station Distance [m] | Temperature [°C] | Relative Humidity [%] | Patm [mbar] | Wind Speed [km/h] | Wind Main Component |
|---|---|---|---|---|---|---|---|
| 1 | Pharmacy | 250 | 2–5 | 97–90 | 961 | 1–2 | N |
| 2 | Pharmacy | 250 | 2–4 | 94–87 | 962 | 1–3 | NE |
| 3 | Pharmacy | 500 | 5–4 | 88–94 | 952 | 2–3 | NW |
| 4 | Pharmacy | 500 | 7–9 | 82–79 | 954 | 3–2 | W |
| 5 | Pharmacy | 500 | 7.5 | 90–92 | 951 | 1–2 | NW |
| 6 | Pharmacy | 1250 | 13 | 66–63 | 945 | 25–28 | SW |
| 7 | Pharmacy | 1250 | 14–13 | 70–72 | 954 | 12–9 | SW |
| M. No. | Measurement | Min CO2 [ppm] | Max CO2 [ppm] | Closed Time [min] | CO2 Function f(t) Type | No. of Persons | Inside Volume [m3] | Inside Volume/Person [m3] | ΔCO2/Time [ppm/min] | (Inside Volume/Person) /(ΔCO2/Time) [m3·min/ppm] |
|---|---|---|---|---|---|---|---|---|---|---|
| 1 | 1 | 700 | 1027 | 20 | Linear | 15 | 229 | 15.3 | 16.4 | 0.9 |
| 2 | 2 | 522 | 605 | 20 | Linear | 1 | 229 | 229 | 4.2 | 55.1 |
| 4 | 4 | 700 | 820 | 23 | Linear | 49 | 1008 | 20.6 | 5.2 | 3.9 |
| 5 | 5 | 700 | 1200 | 25 | Linear | 31 | 271 | 8.7 | 20.0 | 0.4 |
Disclaimer/Publisher’s Note: The statements, opinions and data contained in all publications are solely those of the individual author(s) and contributor(s) and not of MDPI and/or the editor(s). MDPI and/or the editor(s) disclaim responsibility for any injury to people or property resulting from any ideas, methods, instructions or products referred to in the content. |
© 2024 by the authors. Licensee MDPI, Basel, Switzerland. This article is an open access article distributed under the terms and conditions of the Creative Commons Attribution (CC BY) license (https://creativecommons.org/licenses/by/4.0/).
Share and Cite
Urbina-Garcia, O.; Fernandez-Gamiz, U.; Zulueta, E.; Ugarte-Anero, A.; Portal-Porras, K. Indoor Air Quality Measurements in Enclosed Spaces Combining Activities with Different Intensity and Environmental Conditions. Buildings 2024, 14, 1007. https://doi.org/10.3390/buildings14041007
Urbina-Garcia O, Fernandez-Gamiz U, Zulueta E, Ugarte-Anero A, Portal-Porras K. Indoor Air Quality Measurements in Enclosed Spaces Combining Activities with Different Intensity and Environmental Conditions. Buildings. 2024; 14(4):1007. https://doi.org/10.3390/buildings14041007
Chicago/Turabian StyleUrbina-Garcia, Oskar, Unai Fernandez-Gamiz, Ekaitz Zulueta, Ainara Ugarte-Anero, and Koldo Portal-Porras. 2024. "Indoor Air Quality Measurements in Enclosed Spaces Combining Activities with Different Intensity and Environmental Conditions" Buildings 14, no. 4: 1007. https://doi.org/10.3390/buildings14041007
APA StyleUrbina-Garcia, O., Fernandez-Gamiz, U., Zulueta, E., Ugarte-Anero, A., & Portal-Porras, K. (2024). Indoor Air Quality Measurements in Enclosed Spaces Combining Activities with Different Intensity and Environmental Conditions. Buildings, 14(4), 1007. https://doi.org/10.3390/buildings14041007