1. Introduction
Alterations in immune function and reactivity in schizophrenia (SZ) and mood disorders have been found and extensively reviewed [
1,
2,
3]. Reports of immune dysfunction in transcriptomic and proteomic studies of brain tissue have been reported primarily in SZ (reviewed in [
4,
5]). The majority of studies have analyzed antibodies, cytokines, and blood cell types, and indexed these markers as either an indicator of pro- or anti-inflammatory reactions or secondary responses. These studies have shown a remarkable diversity of findings and some gains in understanding relationships between psychopathology and immune function. For example, in schizophrenia, a meta-analysis of cytokine studies showed some consensus in acute relapse and first-episode psychosis for some cytokines (IL-1β, IL-6, and TGF-β), which might be state markers for acute exacerbations, whereas others (IL-12, IFN-γ, TNF-α, and sIL-2R) may be trait markers. One overview of these findings is that perhaps a subset of patients with psychopathology can be found with alterations in immune response [
6]. Cell-type specificity was also analyzed and there were increases in markers for natural killer cells and CD4
+ lymphocytes in schizophrenia [
1]. More strikingly, some forms of autoimmune illness involve antibodies to glutamatergic receptors in brain (for review [
7]) and are associated with both encephalitis and psychiatric disorders.
Epidemiological studies implicated immune mechanisms as risk factors for developing schizophrenia in offspring (recently reviewed in [
8]). Some of the epidemiological studies have found a large odds ratio for factors such as season of birth, maternal viral infection, cytokine alterations, and antibody/viral titer for developing schizophrenia or other psychotic disorders. Other studies point to endogenous biomolecules, such as human endogenous retroviruses (HERV) products, to be possible underlying antigens that could be made in brain cells and trigger immune responses [
9,
10,
11].
1.1. Genetic Loci Related to Major Histocompatibility (MHC) Region
Multiple genome-wide association (GWAS) studies have reported significant MHC single-nucleotide polymorphisms (SNPs) associated with schizophrenia, bipolar disorder, cognition, or hippocampal volume [
12,
13,
14,
15,
16,
17,
18]. Finding highly associated SNPs within this region is a first step towards locating causative gene(s). Currently, these associations with schizophrenia do not necessarily imply immunity as the causative mechanism underlying the association, as the linkage disequilibrium is complicated across different populations. This highly replicated region encompasses hundreds of genes, some that are non-immune, in long-range linkage disequilibrium (LD), with extensive allelic heterogeneity. The GWAS studies to date have not found the gene(s) responsible or causative variants in the MHC locus, although the HLA-B and HLA-DRB1 loci were protective, and the HLA-C increased risk for schizophrenia [
12]. One recent study of the C4 gene in the MHC locus showed an association with increased brain expression and risk of schizophrenia [
19]. Thus, additional evidence of gene expression in the MHC locus needs to be pursued to directly examine some of the immune genes from persons with psychiatric disorders.
1.2. Gene Expression in Schizophrenia, Major Depression, and Bipolar Disorder
The correlated expression of genes in brain or in peripheral tissues forms a co-expression network. Gene−gene expression correlation matrices can be built into coherent network connections. An expression quantitative trait locus (eQTL) study of a developing brain series mapped the significant loci to co-expression networks that were highly enriched for significant GWAS findings in schizophrenia [
20]. The co-expression network was formed around a hub of several interconnected MHC genes, increasing interest to find the truly causative genes, and not merely candidate genes.
A second gene expression co-network of a module of genes that was differentially expressed between SZ and controls in whole blood also formed a network involving the MHC locus [
20]. This co-expression network module was independent of antipsychotic medication in SZ subjects, and included multiple members of the MHC locus: heat shock protein 90 kDa α (cytosolic), class B member 1 (HSP90AB1); ring finger protein 1 (RING1); casein kinase 2, β polypeptide (CSNK2B); tubulin, β (TUBB); and ATP-binding cassette, sub-family F, member 1 (ABCF1). These two studies show the feasibility of expression studies to inform existing GWASes of differential regulation in brain and whole blood.
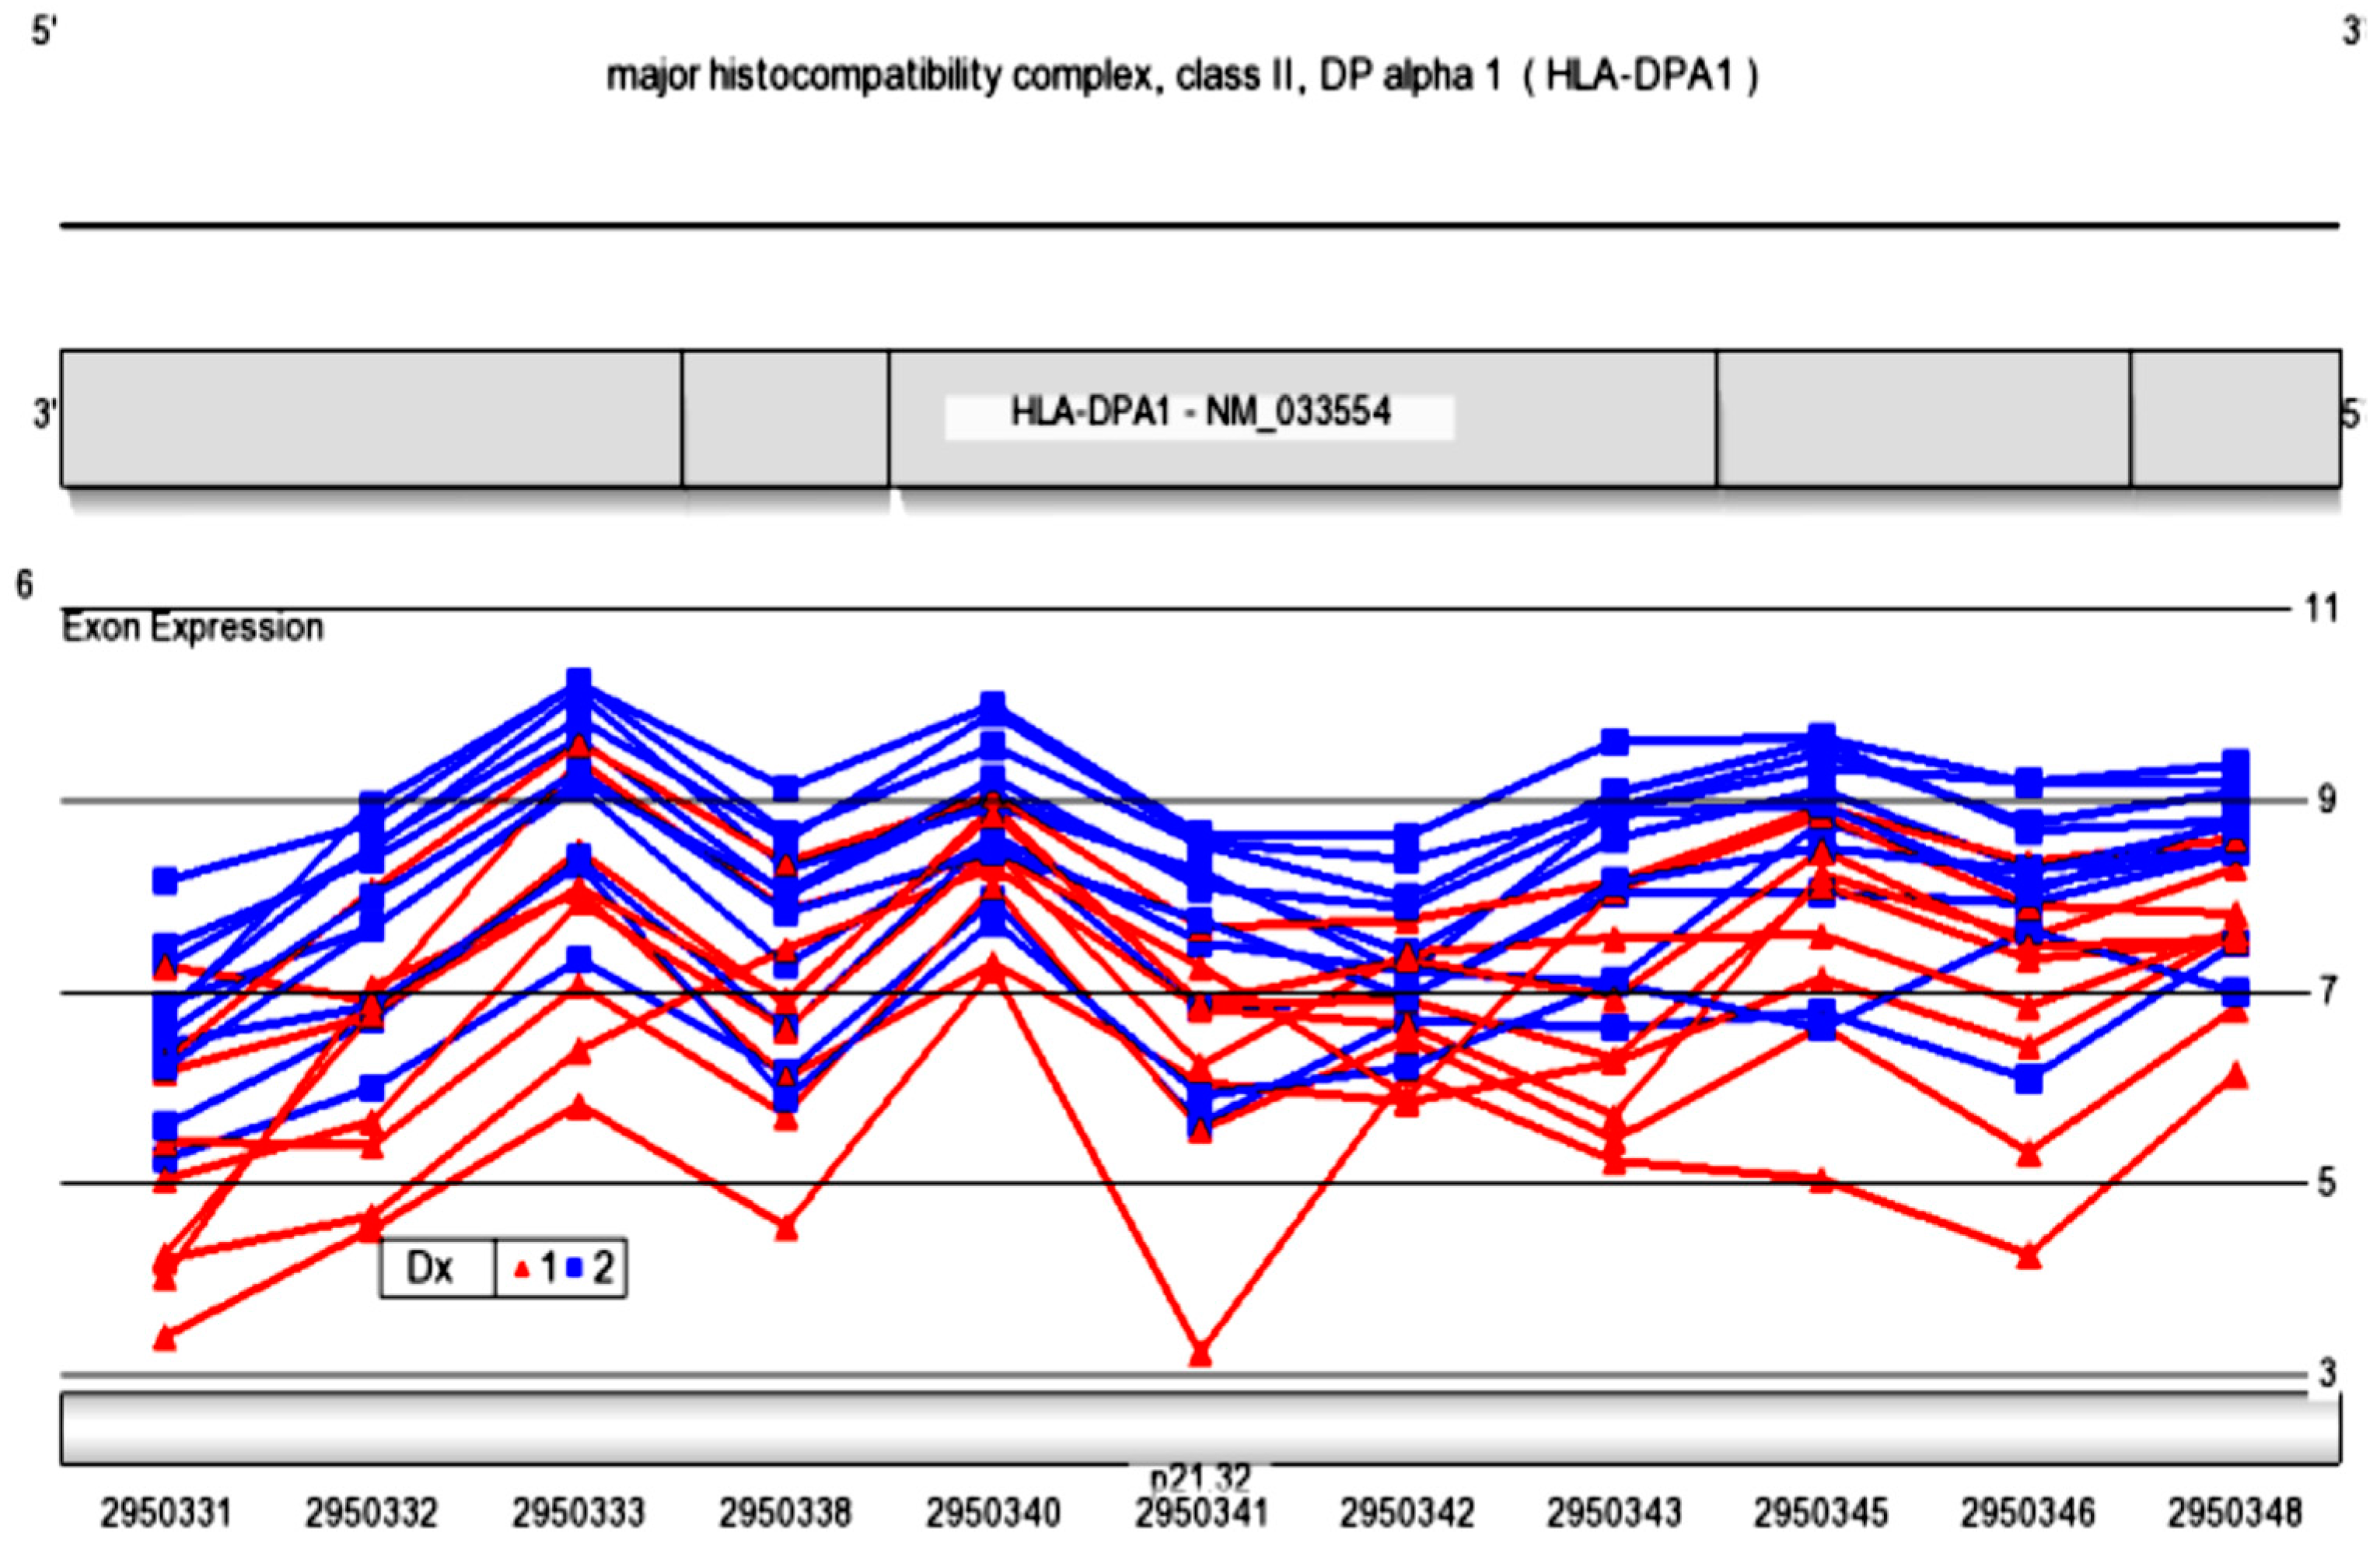
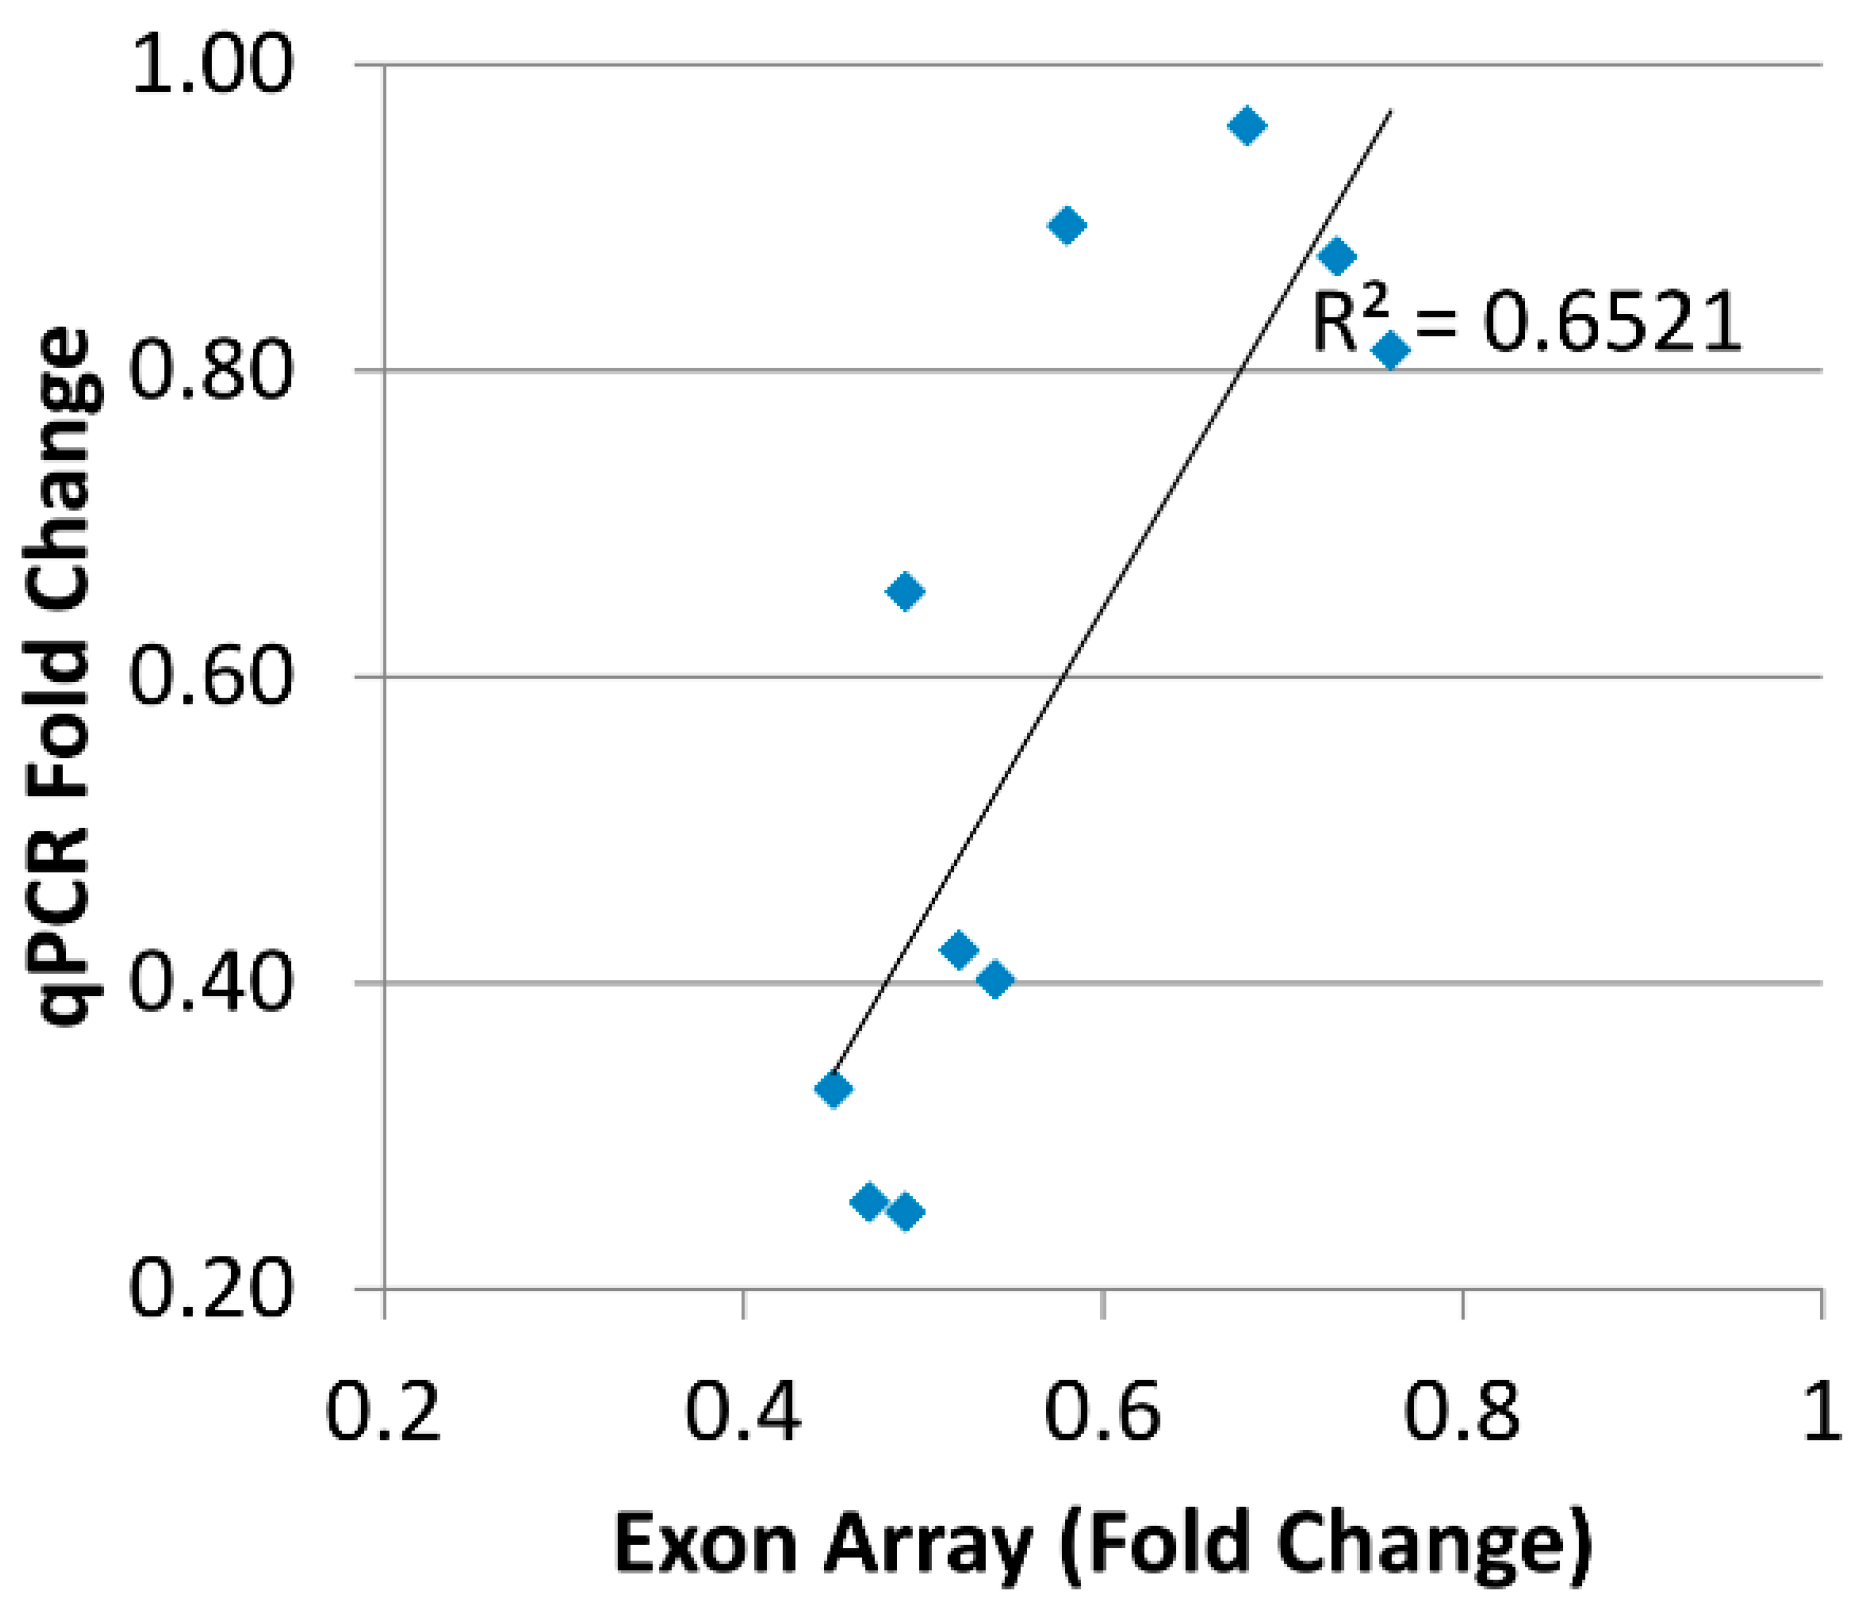
Microarray, quantitative PCR (qPCR) and RNA (cDNA) sequencing are useful techniques that examine gene expression in biological samples. The experiments that are reported begin with an inquiry into bipolar disorder using Affymetrix human exon 1.0 ST microarrays, to compare a matched cohort of bipolar type I subjects to controls using anterior cingulate cortex postmortem samples. The anterior cingulate is a region profoundly implicated in mood dysregulation. To validate the exon microarray results, qPCR experiments were performed in a larger cohort using five different brain regions, cell lines, and blood samples.
1.3. MHC Class II Genes
The purpose of the current study was to examine immune gene expression focusing on CD74, HLA-DRB1, and HLA-DPA1, which are integral components of the MHC Class II pathway (
Figure 1). Using a cohort of postmortem brain tissue, we compared three diagnoses (schizophrenia, bipolar disorder type I, and major depressive disorder) to controls.
The three MHC Class II genes of relevance for this paper share well-described molecular functions within the immune system of antigen processing and presentation (
Figure 1). CD74 has multiple roles in the immune system: it is a transmembrane protein that associates to MHC Class II α and β chains, and is a receptor of the proinflammatory cytokine macrophage migration inhibitory factor which modulates macrophage and monocyte activation. HLA-DPA1 dimers associate with CD74 trimers forming a heterononamer from NCBI RefSeq. The level of HLA-DRB1 gene expression is complex due to the multiple alleles and involvement of polymorphisms of the HLA-DRB1 promoter. Susceptibility to rheumatoid arthritis (RA) is associated with defined HLA-DRB1 alleles that are related to expression, and there is thought to be a negative correlation between incidences of RA and schizophrenia [
21,
22].
HLA-DPA1 SNPs, in particular rs3077, are associated with risk for persistent infection with the hepatitis B and C viruses, first noted in [
23] and then subsequently replicated in multiple reports. Presumably, carriers of HLA-DPA1 coding variants along with variants in HLA-DPB and HLA-DRB have different sensitivities to viral antigen binding, clearing the virus by altering the antigen-presenting capabilities, and building effective immune response.
Taken together, the MHC Class II genes have multiple alleles and tissue-specific expression patterns which have not been described, and these transcripts have been quantitatively assessed in brain. Previously, MHC Class I genes were shown to be localized to neurons [
24], while the expression of MHC Class II molecules in human brain has been found on microglia cells using OX-6 immunohistochemistry. Thus, we focused an investigation on members of the MHC Class II genes in multiple brain regions and disorders.
The MHC Class II are heterodimers composed of α and β transmembrane chains, such as HLA-DPA1 and HLA-DPB1, the latter a dimer that associates with the invariant chain of CD74 which forms a trimer in the endoplasmic reticulum. The trimer traffics to the Golgi compartment and then is transported to the late endosomic compartments, thereby loading the antigen peptide [
25]. CD74 acts as a chaperone that regulates antigen presentation. Invariant chain of CD74 involves binding to the HLA-DPA1 and HLA-DPB1 dimers. After trafficking and targeting antigen, the invariant chain is released from MHC-II and then the antigen peptide binds [
26,
27]. The antigen-bound MHC-II complex moves to the plasma membrane. The plasma membrane-bound antigen-MHC II (pMHCII) interacts with T-cell receptor (TCR). TCR recognizes the antigen only when presented by foreign MHC molecules. TCR activates the pMHCII complex, and facilitate CD4 T-cell stimulation on the cell surface [
28]. Crystal structure shows the ternary model of CD4-pMHCII-TCR that appears V-shaped with pMHC II at apex, but CD4 and TCR do not have direct contact. The signaling of CD4 and TCR is coordinated around the pMHCII [
29]. Therefore, MHCII genes play an essential role in immune responses.
2. Methods
2.1. Exon Array (Experiment 1)
Anterior cingulate cortex (ACC) samples were used in an exon array (Affymetrix HuEx 1.0 ST, Santa Clara, CA, USA. ACC samples from 9 bipolar disorder patients and 11 healthy controls were used in this study for initial microarray analysis. The demographics are shown in
Table 1. Approximately 100 mg of dissected frozen tissue was homogenized using Trizol Reagent (Invitrogen, Carlsbad, CA, USA) following the standard RNA Trizol isolation procedure: 1 mL Trizol was added to frozen brain, then Trizol mixture was homogenized for 30 s twice at 7500 rpm using Tissue Tearor (Biospec Products, Inc., Bartlesville, OK, USA) in ice. The mixture was subsequently incubated at room temperature for 5 min, 200 µL of chloroform added, the tube shaken by hand for 30 s and the mixture then incubated for 2–3 min at reverse transcription (RT), before being centrifuged at 12,000
g for 15 min at 4 °C with the Eppendorf Centrifuge 5417R (Eppendorf, Hauppauge, NY, USA). The supernatant containing the upper aqueous phase was transferred to a new tube, mixed with 500 µL of isopropyl alcohol and incubated for 15 min at RT and centrifuged at 12,000
g for 10 min at 4 °C. The supernatant was removed, and the pellet was washed with 1 mL of iced 75% ethanol, by brief vortex, then centrifuged at 7500
g for 10 min at 4 °C. Ethanol was decanted, and RNA pellet was dried at RT for 5–10 min in a laboratory hood by opening tube lid; RNA was then dissolved in 50 µL DEPC-treated water by gently mixing on ice. RNA was stored in a −80 °C freezer. The resulting total RNA was cleaned of low molecular weight fragments by passing through a Qiagen column, and checked on an Agilent 2100 Bioanalyzer (Agilent Technologies, Santa Clara, CA, USA) for quality control using RNA integrity number. The concentrations measured on a spectrophotometer (Molecular Devices, Sunnyvale, CA, USA) were adjusted to 1 µg/µL.
GeneChip Whole Transcript Sense Assay Protocol:
The Affymetrix Human GeneChip Exon 1.0 ST arrays were run following the manufacturer’s protocol (Affymetrix, Santa Clara, CA, USA). Briefly, 2 μg of purified total RNA underwent ribosomal RNA removal using the RiboMinus Human/Mouse Transcriptome Isolation Kit (Invitrogen). The reduced RNA was then reverse transcribed to cDNA using random hexamers tagged with a T7 promoter sequence followed by a second strand cDNA synthesis using DNA polymerase (GeneChip WT cDNA Synthesis and Amplification Kit, Affymetrix). The resulting double-stranded cDNA was then used for amplification of antisense cRNA using the Gene Chip Sample Cleanup Module (Affymetrix). A second cycle cDNA synthesis was performed using random primers to reverse transcribe the cRNA into sense single-stranded DNA. The DNA was then enzymatically fragmented and labeled using the GeneChip WT Terminal Labeling Kit (Affymetrix). The hybridization cocktail consisting of the labeled sample, Control Oligonucleotide B2, and 20× Eukaryotic Hybridization Controls were heated for 5 min at 99 °C and cooled for 5 min at 45 °C, then centrifuged 1 min. A volume of 200 µL was loaded onto the Affymetrix Human Gene Chip Exon 1.0 ST Arrays and the arrays were placed in a 45 °C hybridization oven, at 60 rpm, to incubate for 17 h. The GeneChip Hybridization, Wash and Stain Kit (Affymetrix) was used with the Fluidics Station 450_0001 protocol. Arrays were then scanned on the GeneChip Scanner 3000 7G (Affymetrix). All exon array samples were processed in the same batch by one person.
Each CEL file from the Affymetrix HuEx 1.0 ST was imported into Partek Genomics Suite 6.6 using background subtraction and elimination of probes with common SNPs from analysis of exon array data following the method of Gamazon
et al. 2010 [
30]. The initial count of probesets on the array is 1.1 million (see
Supplementary Methods), elimination of common SNPs in probes reduced the probeset count by ~350,000 probesets. Each CEL file was analyzed together using robust multiarray analysis (RMA) [
31]. Resulting expression values of probes were averaged in each probeset. Each probeset was aligned to a unique RefSeq gene, and we report only findings that are associated with full-length mRNA and have coverage by at least two probesets. This reduced the total probesets analysis to 230,659 probesets representing 11,807 full-length RefSeq genes. The diagnosis by probeset interaction was calculated in Partek (
Supplementary Methods), and the interaction
p-values cut-off were determined after Bonferroni correction.
2.2. qPCR (Experiment 2)
These same subjects in Experiment 1 were used for qPCR, plus ~90 additional subjects for Experiment 2 (shown in
Supplementary Table 1). Total RNA was extracted from five brain regions (dorsolateral prefrontal cortex (DLPFC), amygdala, hippocampus, nucleus accumbens, and cerebellum) for each subject using the method outlined in
Section 2.1. Total RNA from the DLPFC, amygdala, hippocampus, nucleus accumbens, and cerebellum were used for making complementary DNA (cDNA) (
Table 2). cDNA was generated using TaqMan reverse-transcription (RT) reagents according to the manufacturer’s protocol (Applied Biosystems, Foster City, CA, USA), and cDNAs were aliquoted and stored at −20 °C. In brief, the cDNA synthesis contained 5 µL of 10× Taqman RT buffer; 11 µL of 25 mM MgCl
2; 10 µL of deoxy NTPs; 2.5 µL of Oligo d(T)
16 primer; 1 µL of RNase inhibitor; 1.25 µL of Multiscribe reverse transcriptase, and 1 µL of RNA (1 µg/µL). Two separate 50 µL reactions for each RNA were performed and combined together. Each cDNA batch reaction had a maximum of 24 tubes to ensure the best sample quality. The primers were designed using Primer Express software (Applied Biosystems) and purchased from Bioneer, Inc. Factors including melting temperature and guanine-cytosine (GC) content were considered. The HLA-DPA1 forward and reverse primers were designed to hybridize to sequences located in exon 3, near the site of hybridization for the probe (Probe Set 2950343; Affymetrix, Inc.). The primer set was BLAST searched against the entire human genomic sequence database for specificity, and primers used are shown in
Supplementary Methods, Part 3 for all genes. The HLA-DPA1 primers were tested by using a set of cDNAs from cerebellum), genomic DNA, no template control (NTC), and RT minus (two individual DLPFC RNAs without cDNA). The primer test results showed that all cDNA amplified with a single band, while the NTC and gDNA amplified greater than 40. The RT minus showed greater than six cycles difference from the cDNA samples. This detection ensured that the HLA-DPA1 primers were specific to HLA-DPA1. Similar procedures were used for HLA-DRB1 and CD74 qPCR analyses.
Quantitative PCR (qPCR) was performed on an ABI 7900HT Sequence Detection System (Applied Biosystems) in 384-well plates. The samples were aliquoted by the Biomek3000 Robot (Beckman Coulter, Brea, CA, USA) and run in triplicate using one plate per gene. The reaction was performed in a 12.5 µL total volume with 6.25 µL of 2× SYBR Green Master Mix (Applied Biosystems); 0.25 µL of 10 µM forward primer; 0.25 µL of 10 µM reverse primer; 2 µL of a 1:10 dilution of cDNA template (corresponding to approximately 4 ng RNA), and water to a total volume of 12.5 µL. The thermal cycle conditions were: 50 °C for 2 min (incubation), 95 °C for 10 min (activation), 45 cycles at 95 °C for 15 s (denaturation), and 60 °C for 1 min (annealing/extension), and a final dissociation step at 95 °C for 15 s, 60 °C for 15 s, and 95 °C for 15 s. The qPCR cycle threshold (Ct) was set in the middle of the exponential phase of the amplification. In each experiment, the individual sample was run in triplicate and the Ct of each well was recorded at the end of the reaction. The mean and standard deviation (SD) of the three Cts were calculated and the average value was accepted if the triplicate Ct values were within ±1 Ct. Two representative qPCR runs of HLA-DPA1 robotically pipetted in 384-well assay plates were examined for two brain regions, and three wells were eliminated. The average coefficient of variation was ~0.8% for each plate. The relative quantification was used to measure gene expression. Glyceraldehyde-3-phosphate dehydrogenase (GAPDH) and succinate dehydrogenase complex subunit A (SDHA) were selected as the housekeeping genes. After correction with the mean of the two housekeeping genes (Ct target − Ct mean of housekeeping), an ANCOVA was used for the average delta Ct values for each subject. A repeated-subjects ANCOVA was used with factorial blocks of diagnosis, region, and SNP rs9277341, and also included age, RIN, and pH covariates. The fold change in gene expression was calculated to elucidate the direction of differences in mRNA levels between diagnosis and control samples in each brain region.
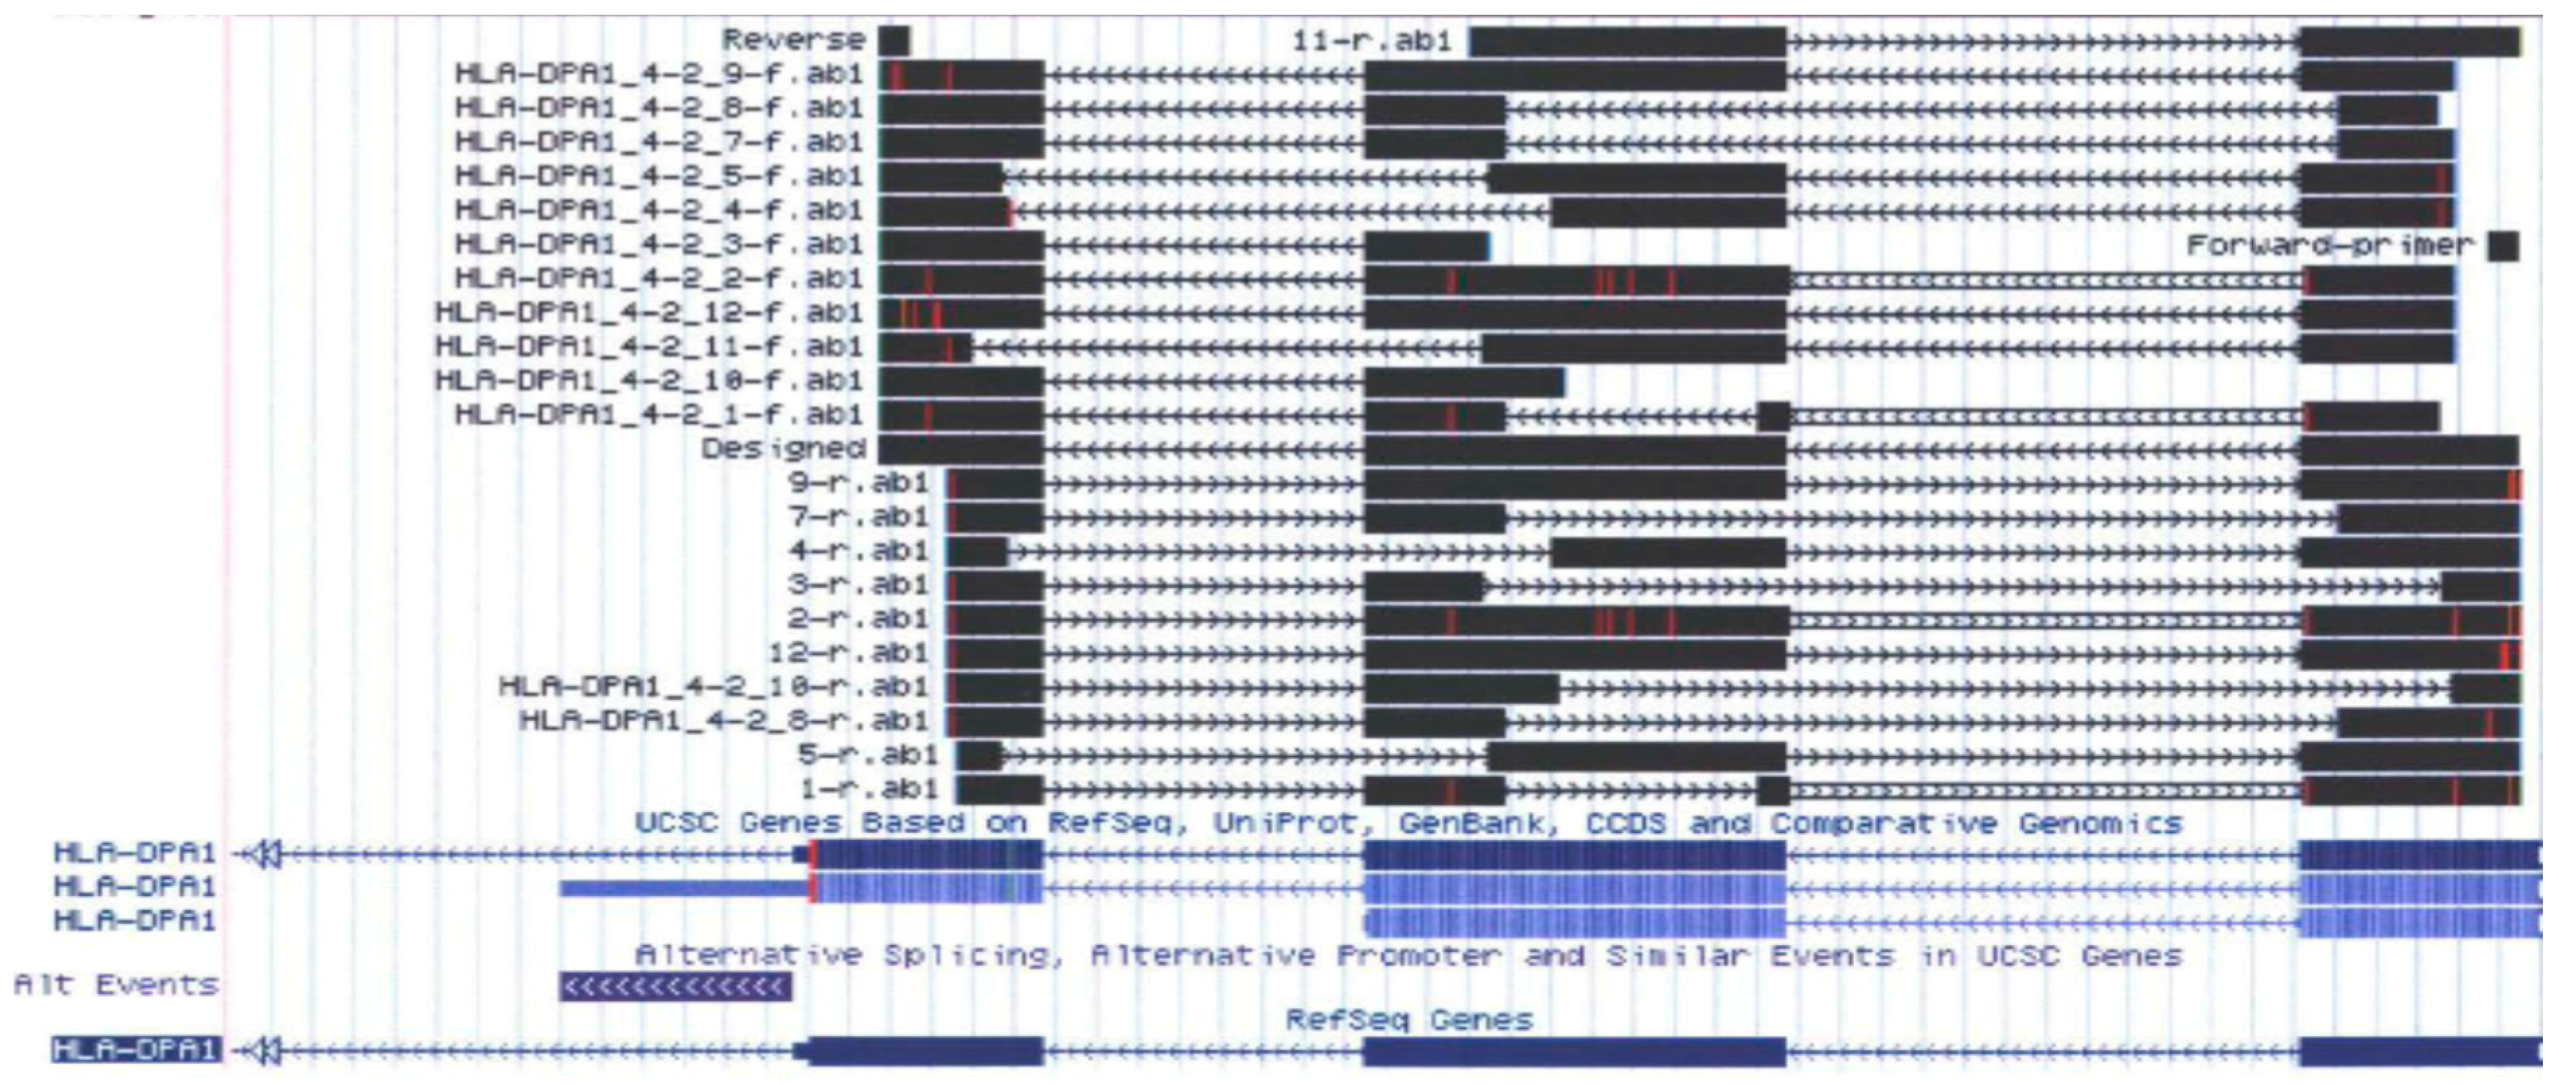
2.3. Alternative Splicing of HLA-DPA1 (Experiment 3)
By exon array, a variable expression pattern was observed across exons 2, 3, and 4 in HLA-DPA1 for multiple subjects. This gene was therefore chosen for analysis of alternative splicing by direct sequencing of gel-purified cDNA amplicons to evaluate potential variants.
Representative cDNA samples from subjects in Experiment 2 were PCR amplified and run on agarose gels for separation of bands. cDNA amplification was conducted from exons 2 through 4, to screen for alternative splicing. Gel bands smaller than full length were visualized on gels, and sent for Sanger sequencing. The subjects screened are shown in
Supplementary Table 1.
2.4. Lymphoblast Cell Line (LCL) qPCR Biomarker (Experiment 4)
In addition to testing brain samples by qPCR (Experiment 2), 87 EBV-transformed lymphoblast cell lines (LCLs) from Costa Rica were tested for expression levels of the three MHC Class II genes via qPCR. Previously transformed cell lines were grown to confluency and harvested for RNA using Trizol. cDNA was synthesized as described above (
Table 3, demographics).
4. Discussion
This paper is the first report showing that alternative splicing processes HLA-DPA1 mRNA into multiple isoforms. The functional significance of these different isoforms of HLA-DPA1 in brain is not clear, but undoubtedly would alter the function of this gene since the IgG domain and transmembrane domain are both substantially altered, and both of these domains are highly conserved across vertebrates. Further work is required to functionally elaborate alterations of mRNA of 30–100 amino acids in the translated products.
Since HLA-DPA1 is part of a heteromeric complex, the alternatively spliced isoforms may act to inhibit complex formation and the presentation of antigens on the cell surface. Major histocompatibility complex class II molecules are expressed by immune antigen-presenting cells like B cells, dendritic cells, and monocytes/macrophages, and designed to stably bind and present fragments from exogenous proteins to the immune system. There are disorders involving MHC class II deficiency (MIM209920). Typically, patients with these types of disorders fail to fight off infections, have increased infections following viral, bacterial, and fungal exposures, and lack expression of different MHC Class II genes. Variations in the density of MHC class II molecules on antigen-presenting cells influence the intensity and the nature of T-cell response. Taken together, a lack of MHC Class II response results in less T-cell activation.
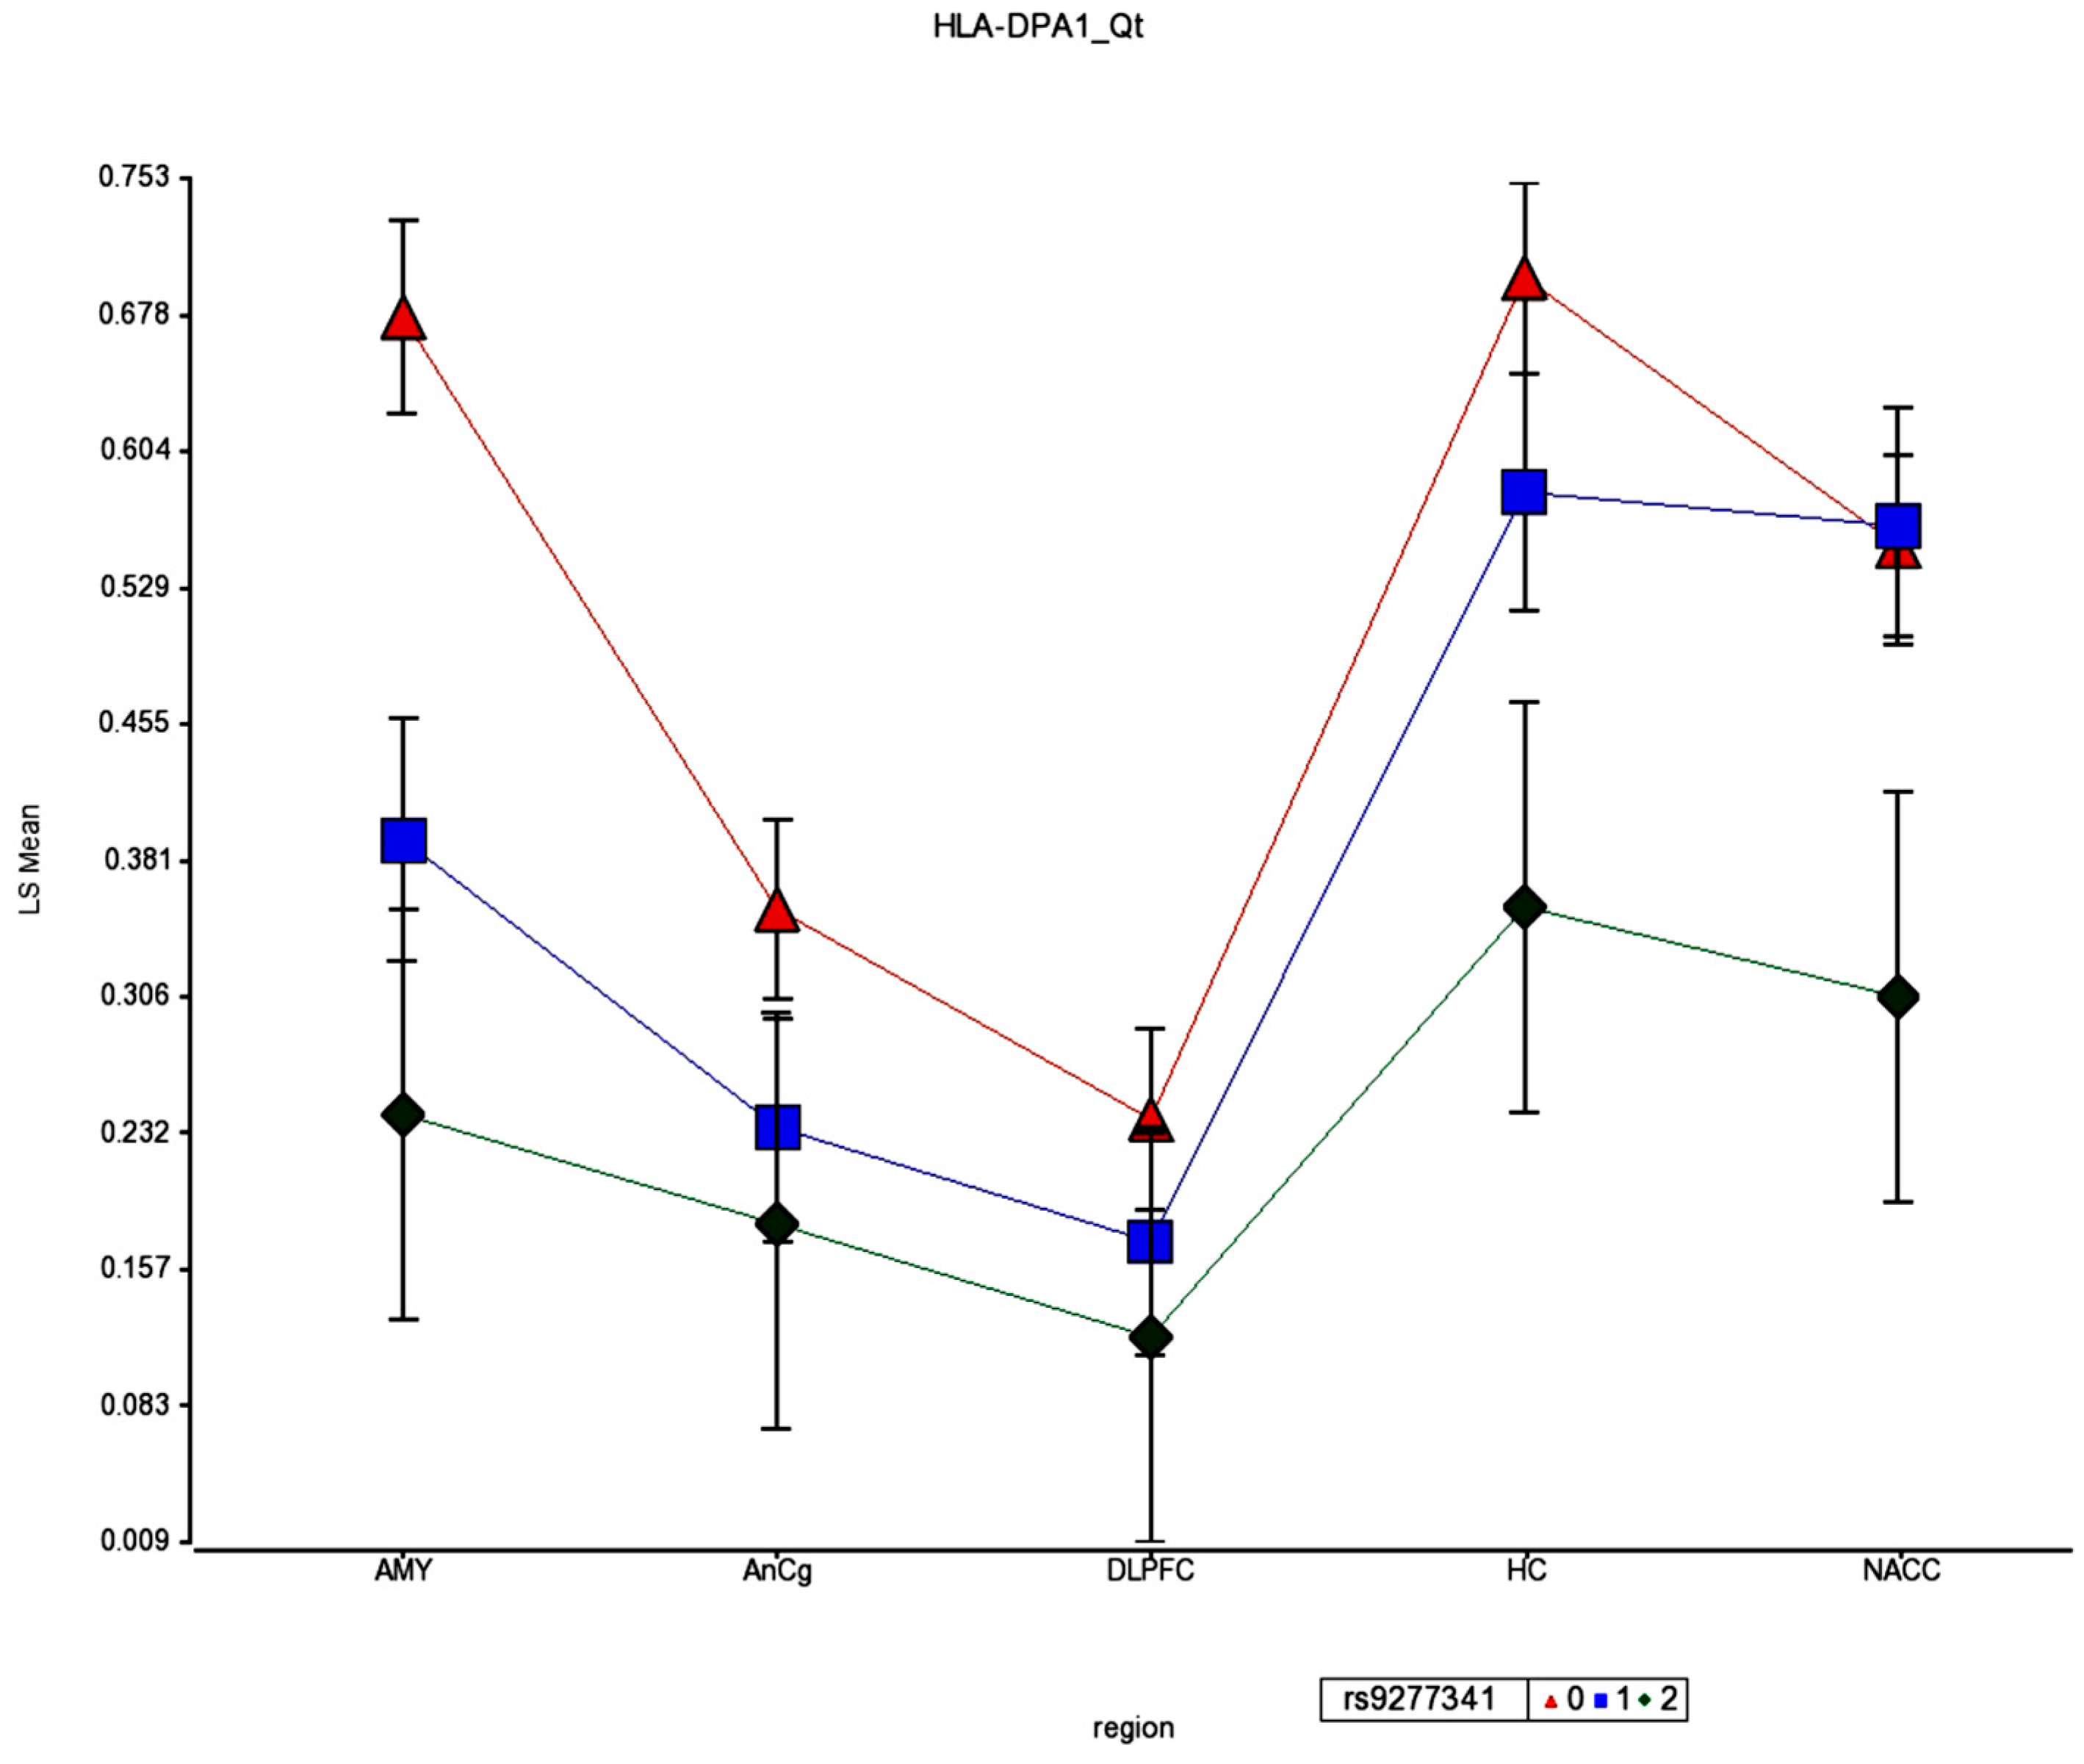
Patients failing to produce proper MHC II–peptide complexes do not mount efficient antibody responses to infection, and this is probably the underlying factor in differential hepatitis B viral resistance shown in association studies of HLA-DPA1 [
23]. It was also shown that the same SNP (rs3077) was a strong eQTL for HLA-DPA1 expression in human liver samples (
p = 10
−48) [
35], and LCLs [
36]. This finding suggests that the expression of HLA-DPA1 is related to resistance to hepatitis B virus (HBV). However, we did not test association of HBV in our brain or blood samples in this experiment, but are suggesting that the rs3077 cis eQTL allele that increased expression of HLA-DPA1 was also associated with decreased HBV infection rates, thus indicating that decreased expression of the HLA-DPA1 gene could result in increased infection rates. The SNP used in our study (rs9277341) is in the same LD block (r2 > 0.8) as rs3077, and rs9277341 SNP is an eQTL across multiple brain regions for HLA-DPA1 expression as well shown in the present results. Further, shown in
Figure 10 are the HLA-DPA1 SNP values for association with schizophrenia, demonstrating an individual SNP in this region with highly significant association (association
p = 2.46 × 10
−10). OR = 1.1956). Taken together, these genetic results and a strong eQTL in brain support a general susceptibility for SZ association with decreased HLA-DPA1 expression in multiple brain regions. In a survey of developmental cortical trajectory of gene expression, during fetal and infant brain development there is an absence of HLA-DPA1 expression in fetal brain, and very low levels in infant brain, contrasted to child, teen, adult, and elderly brains [
34].
Besides this very strong eQTL at rs9277341 that we confirmed in brain and LCLs, there is an environmental factor that could perhaps also account for the findings of decreased expression, at least in LCLs of the MHC Class II molecules. This possibility is shown in the intriguing report that morphine and opioid agonists can reduce MHC II levels in circulating B-cells by 88% [
36]. The underlying mechanism is the immunosuppressive effect of high cortisol levels induced by morphine. Circulating levels of cortisol are abnormally high in neuropsychiatric disorders [
37,
38], and could possibly account for the decreased expression of MHC Class II in the present LCL study. Although the cell lines were passaged and presumably independent of cortisol stimulation in the present study, there might be epigenetic changes associated near the HLA-DPA1 locus or in transcription factors that enhance HLA-DPA1 expression. A next logical step would be to study the interaction of cortisol suppression of HLA-DPA1 molecules by genotype interaction with the eQTL SNPs, and to determine the epigenetic landscape involved in the
cis eQTL effects observed in this study. Finally, we would need to determine more precisely the brain localization of HLA-DPA1 protein in brain. Previously, MHC Class I genes were shown to be localized to neurons and are essential for development and plasticity of neurons [
24,
39,
40,
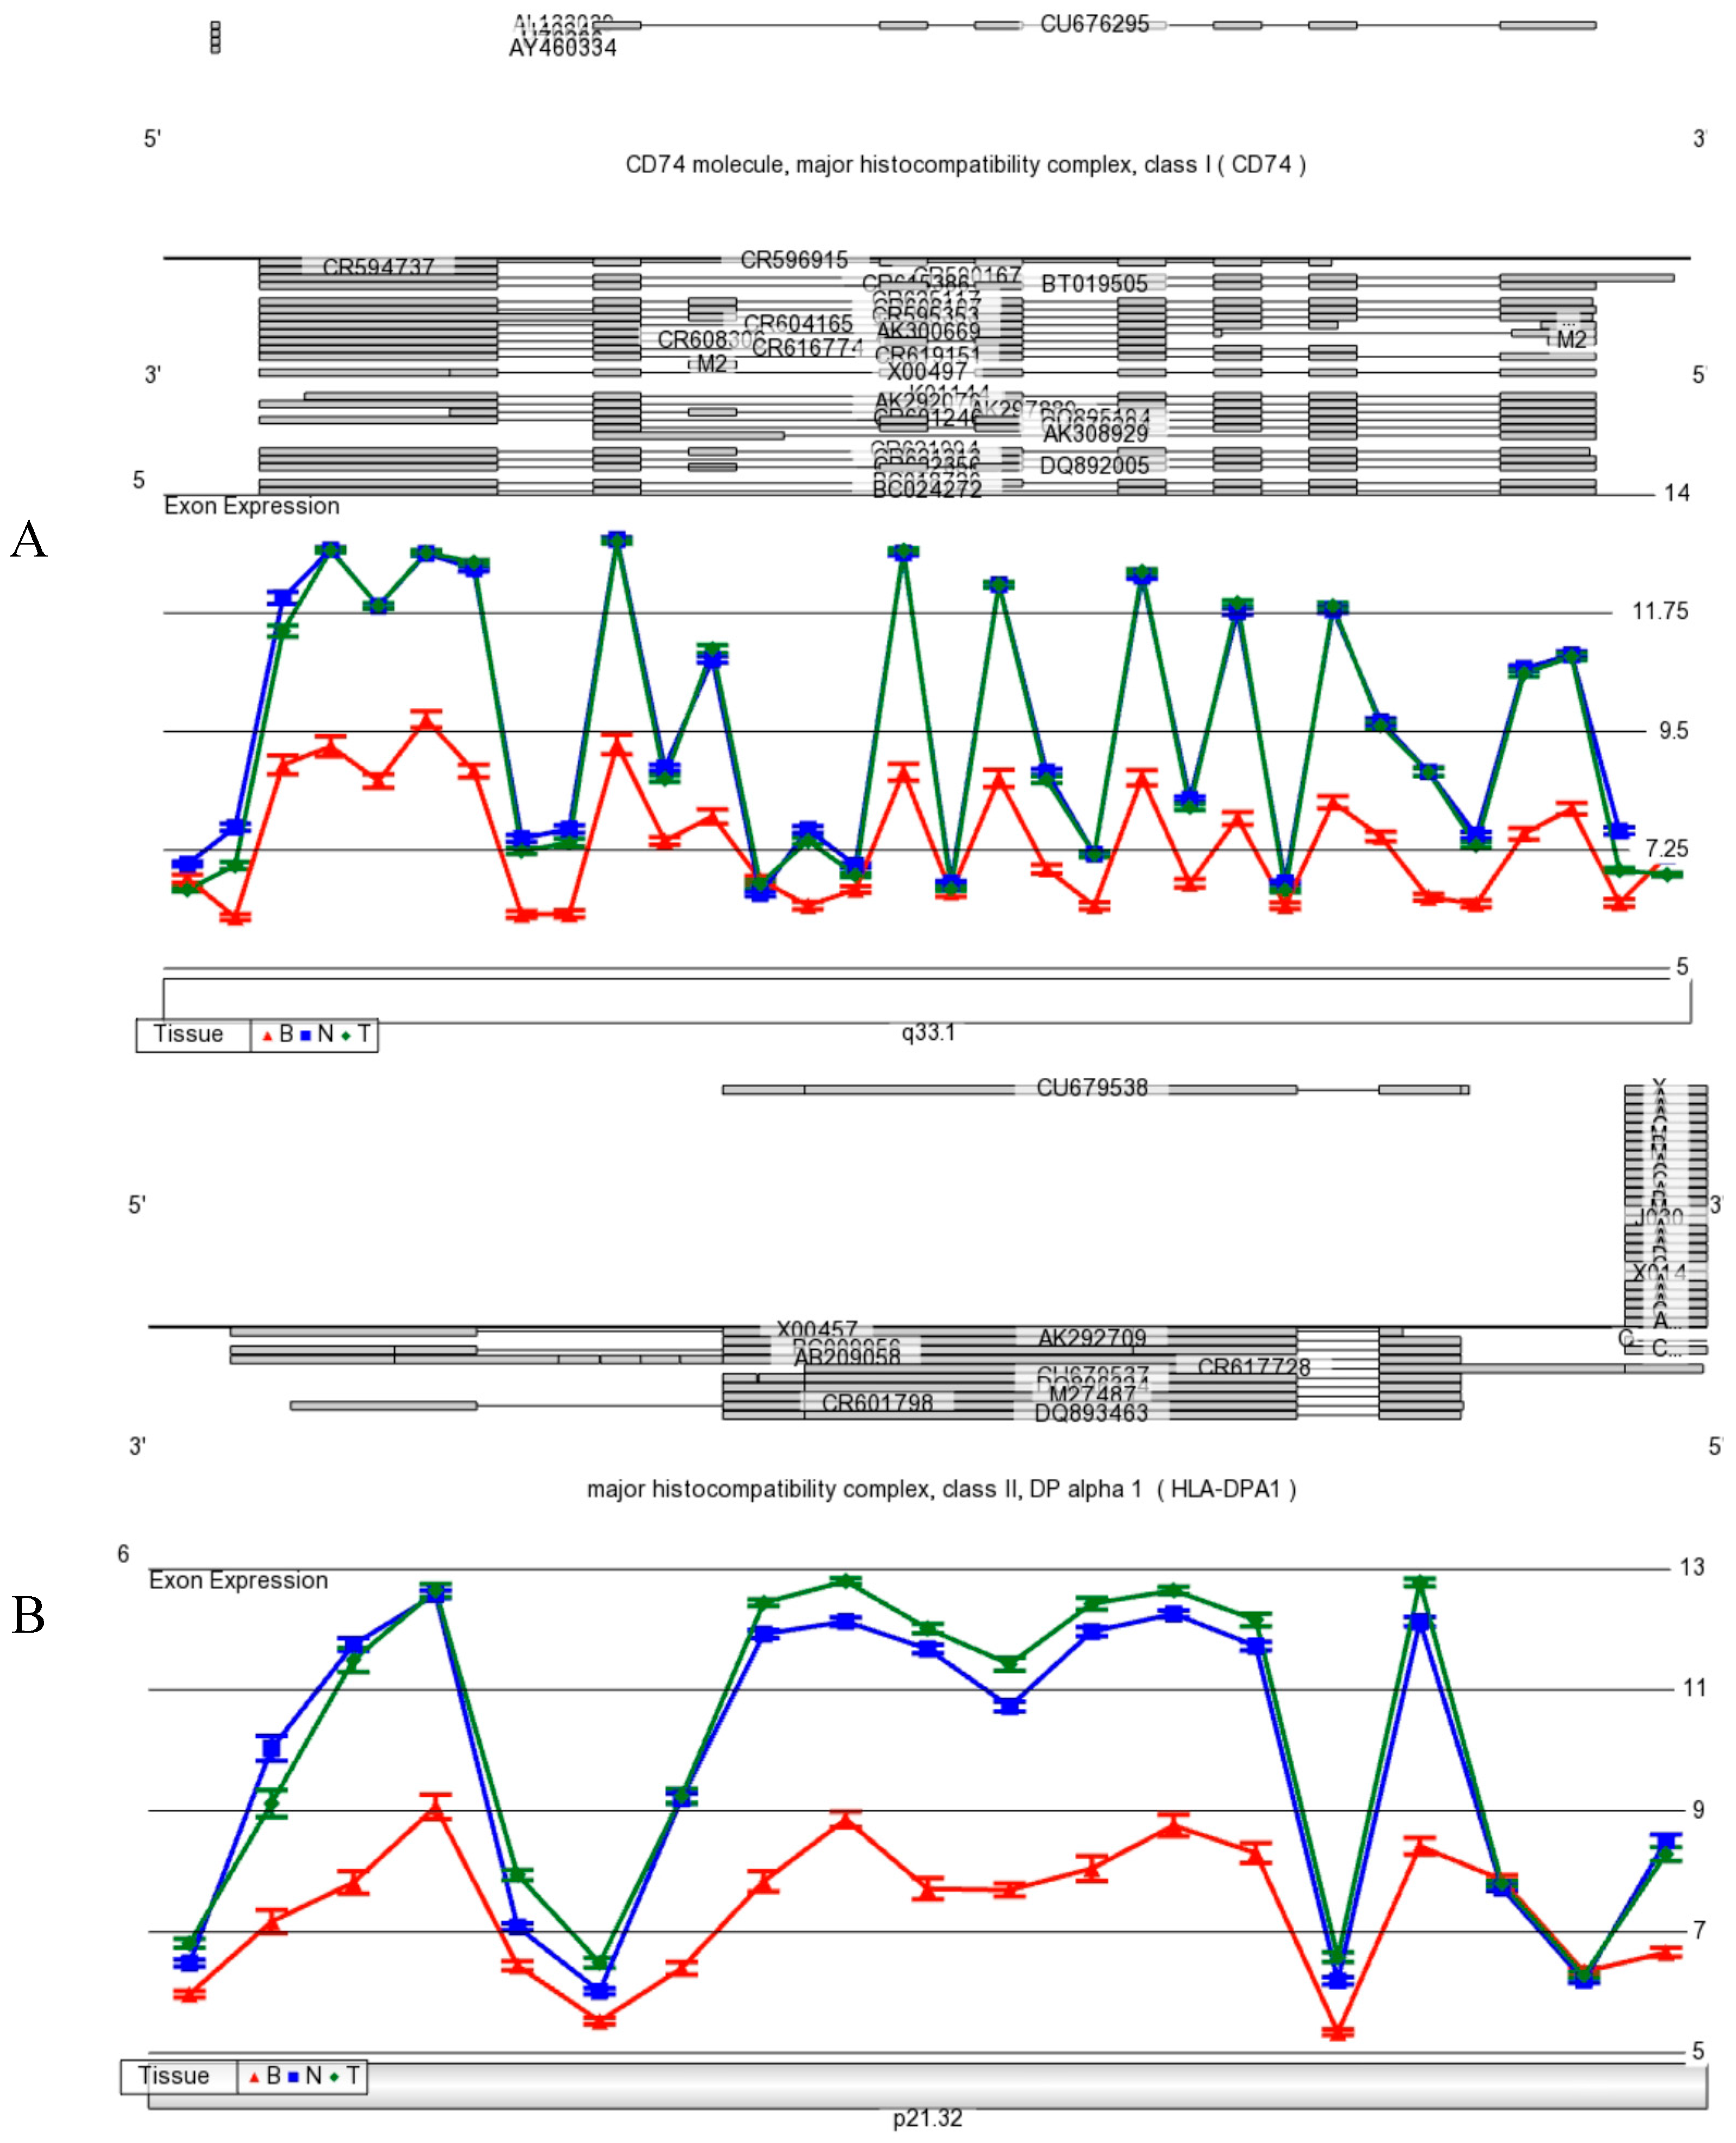
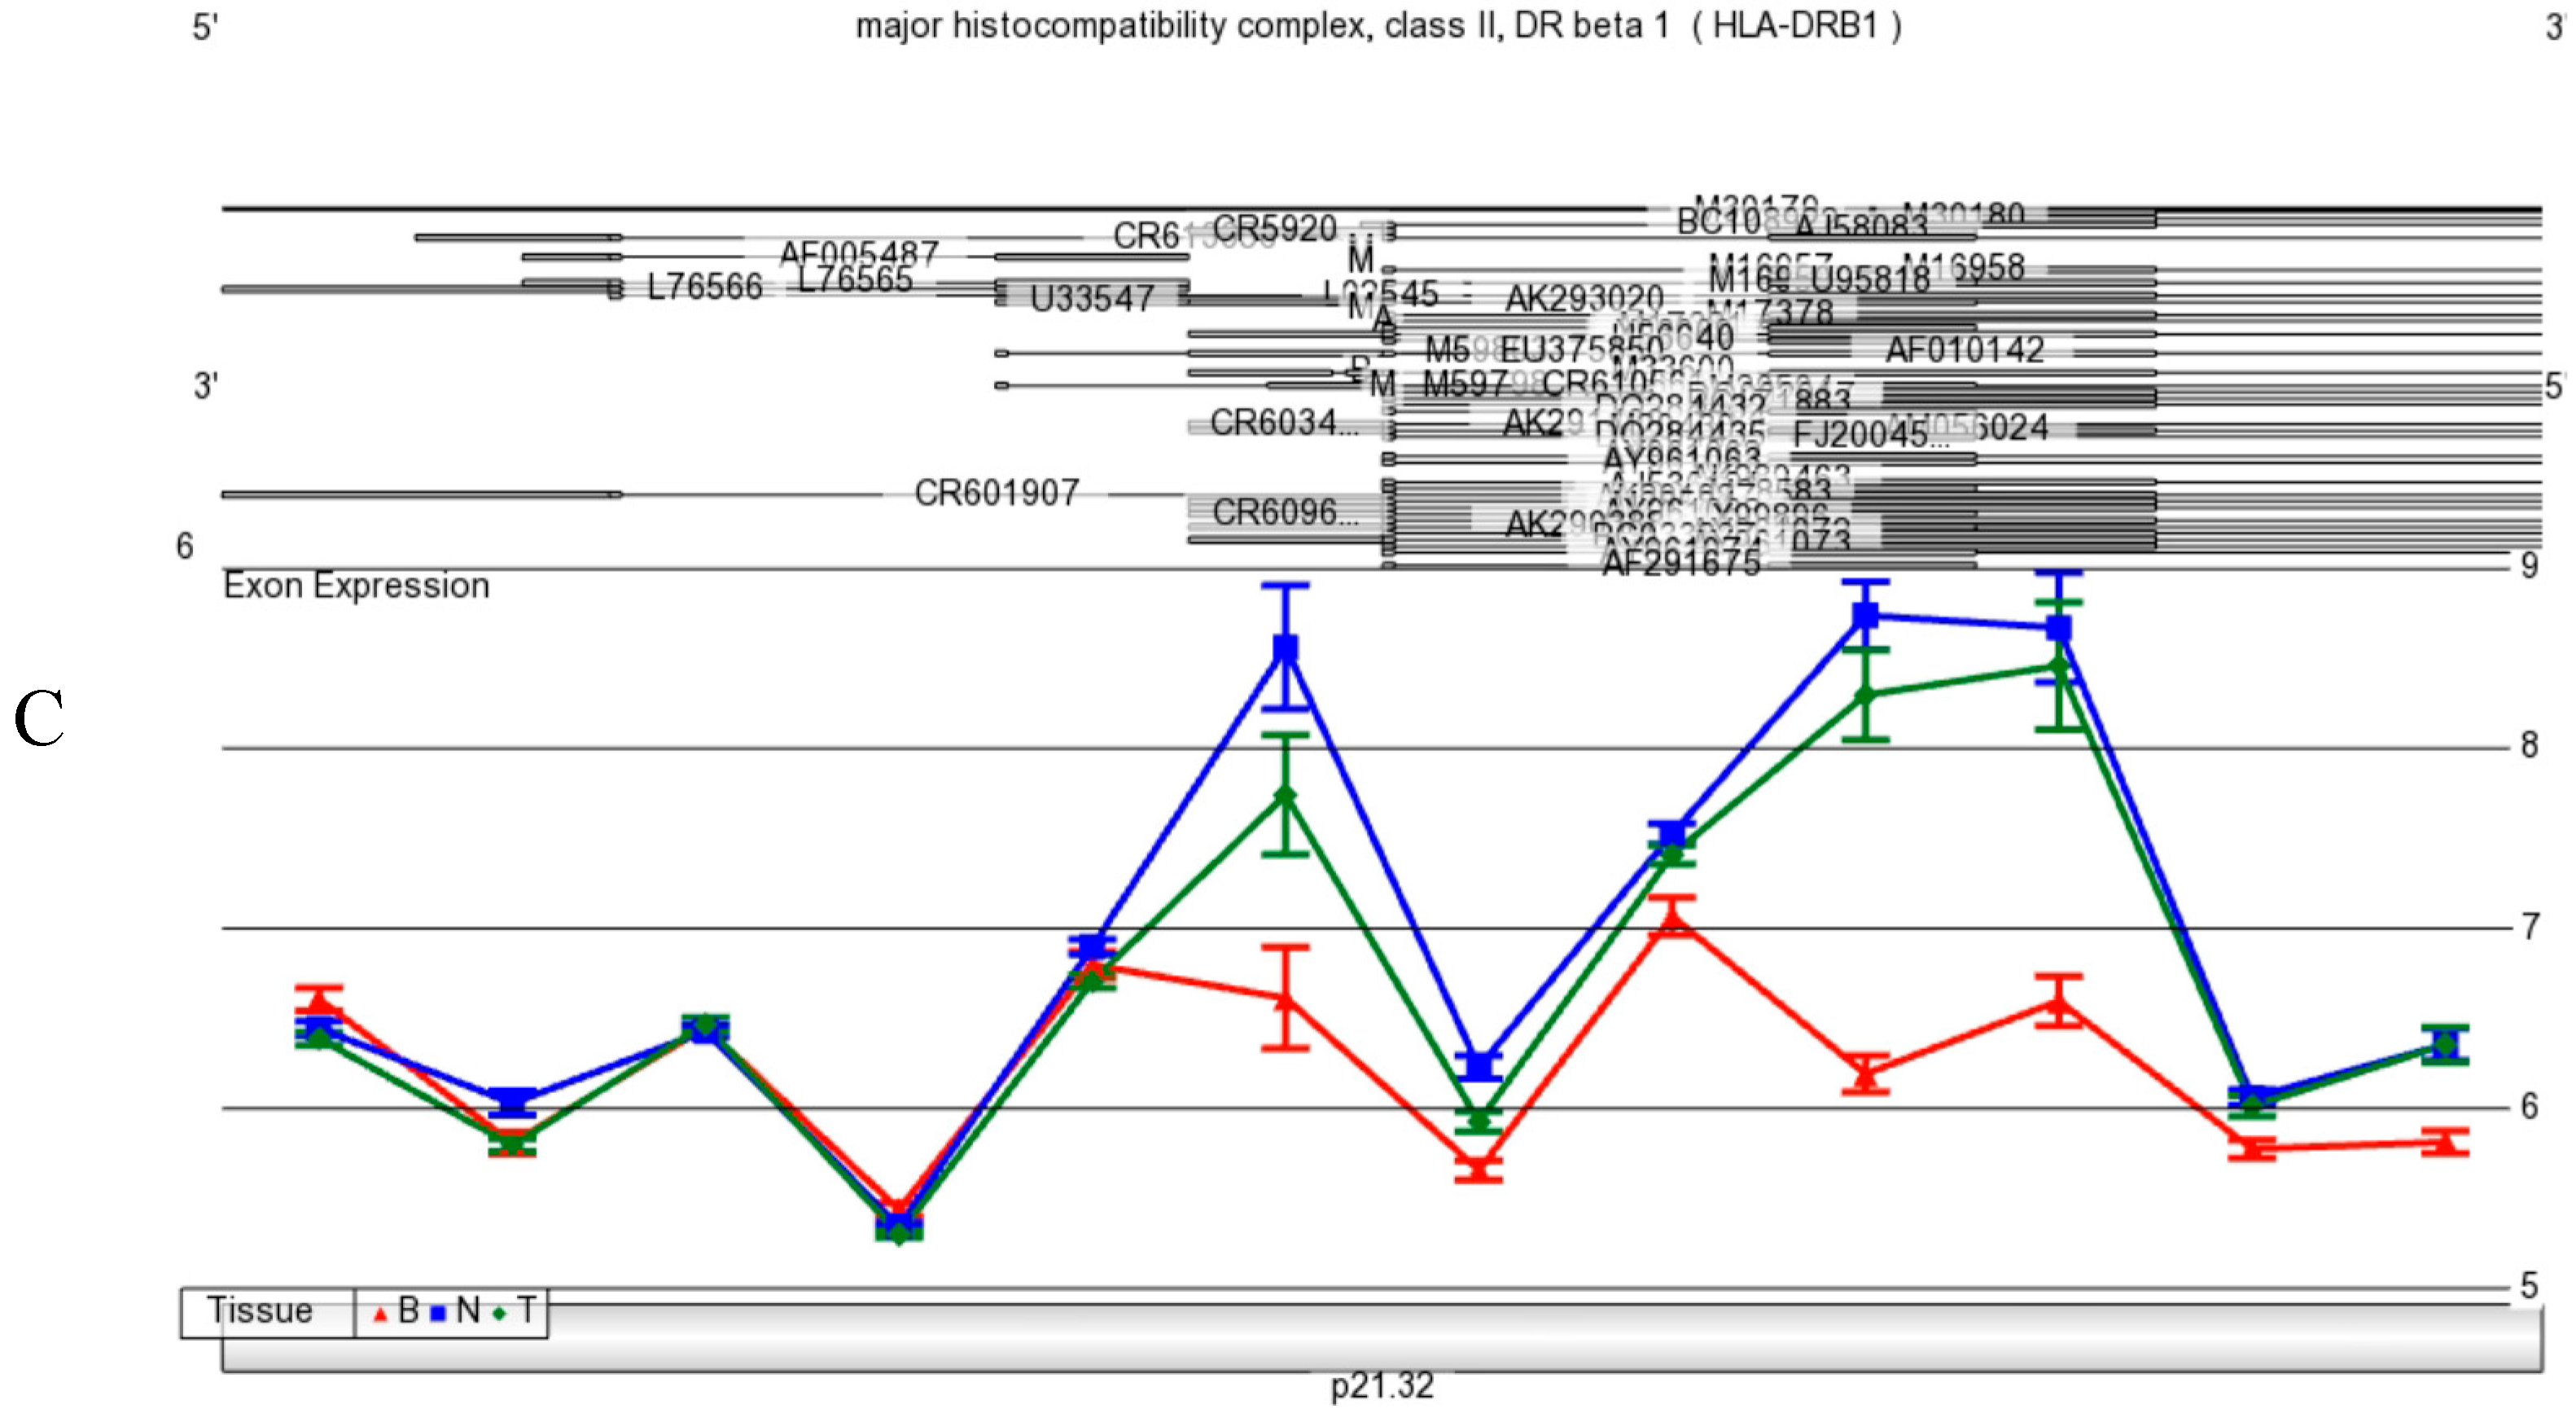
41]. Little is known about expression of MHC Class II genes in brain, although we show that it is much lower in brain compared with PBMCs, transformed lymphocytes (EBV), and whole blood levels (
Figure 9 A,B,C). Although it is not clear presently if neurons produce MHC Class II mRNA in human brain, MHC Class I and II are found on differential subpopulations of activated microglia in brain [
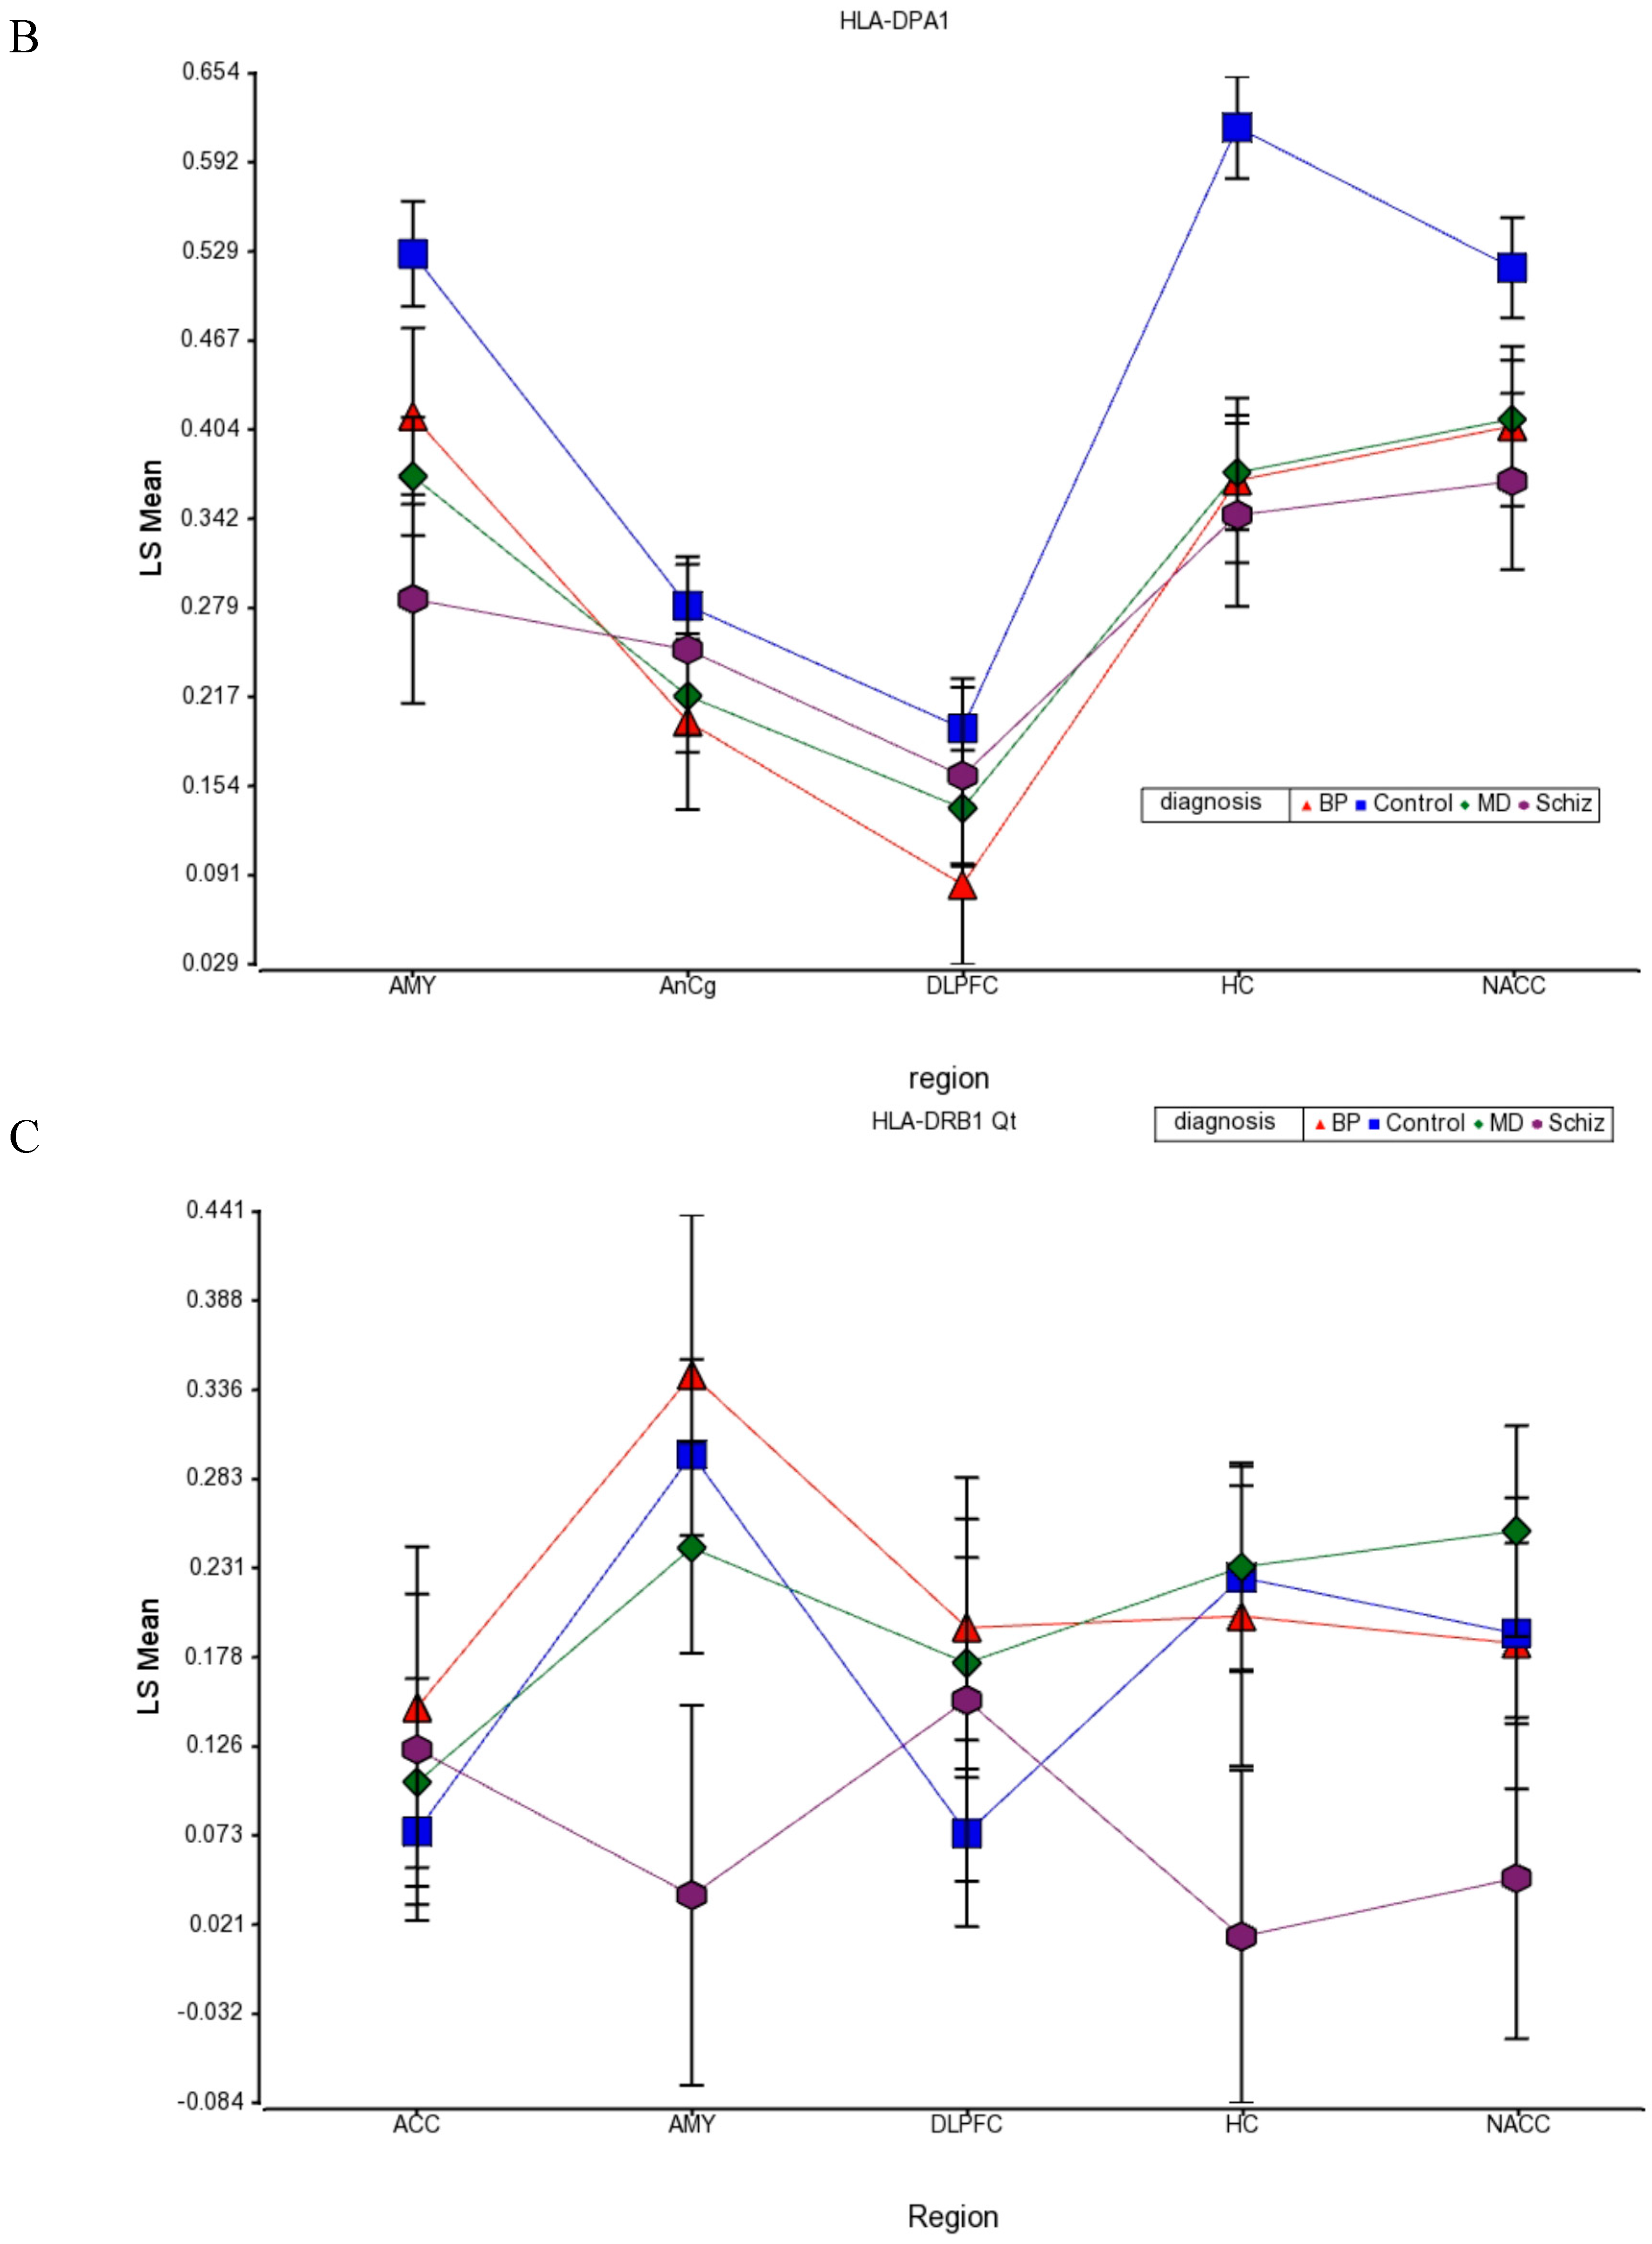
42]. Expression of MHC Class II molecules are found in microglia using a general OX-6 antibody. To date, there is no specific study by immunohistochemistry with a specific monoclonal HLA-DPA1 antibody that has been conducted.
Since expression of MHC Class II appears to be reduced in brain and periphery, this might suggest an increased infection rate in patients with neuropsychiatric disorders. Although a higher rate of HIV in schizophrenia is reported, it is thought that the use of drugs and duration of untreated illness contributes to this increase [
43]. Since there are literally thousands of immune-related genes, a follow-up paper is being planned to expand these current findings into the broader immune landscape using an independent array expression platform and analysis of immune-relevant upstream and downstream genes, as well as additional subjects, which also supports the present results for MHC Class II molecules [
44].
In this study, we chose to use microarrays over next-generation sequencing (NGS). Both microarray and NGS technologies have their advantages and disadvantages; the selection depends upon the experimental goal. NGS has a wide range of applications and is particularly useful to investigate
de novo mutations, new splice variants and non-coding RNA. NGS offers high sensitivity, high accuracy, and a broad dynamic range with no cross-hybridization. However, there are some limitations to NGS that make the use of microarrays a good alternative strategy. NGS has a higher cost with short reads that do not always allow the study of large splicing variants, chromosomal rearrangements or gene fusions like tiling arrays [
45]. The analysis pipelines required for the NGS can be quite expensive and usually requires dedicated bioinformatics support to develop meaningful results.
On the other hand, microarrays have been used and accepted for the past three decades and have established analysis tools to speed the normalization and interpretation. Microarrays are powerful for analysis of known alternative splicing events [
46]. Microarray technology is fast and a fairly reliable tool for applications involving gene expression, genotyping, and detection of known splicing variants. It requires, however, prior knowledge of the genome to design reliable probes with no cross hybridization in order to identify differences in transcript levels. In addition to gene and exon level expression, microarrays can also be used to investigate coding SNPs [
47], but the detection ranges are limited and they require exceptionally high-quality mRNA. In the context of our experiments, microarrays produced reliable and replicable results concerning gene expression levels and led to the discovery of alternative splicing events of HLA-DPA1 transcripts.


