3.1. Simulation of the Polymer Membrane Reactor Model
The operating conditions for this study are taken from Reference [
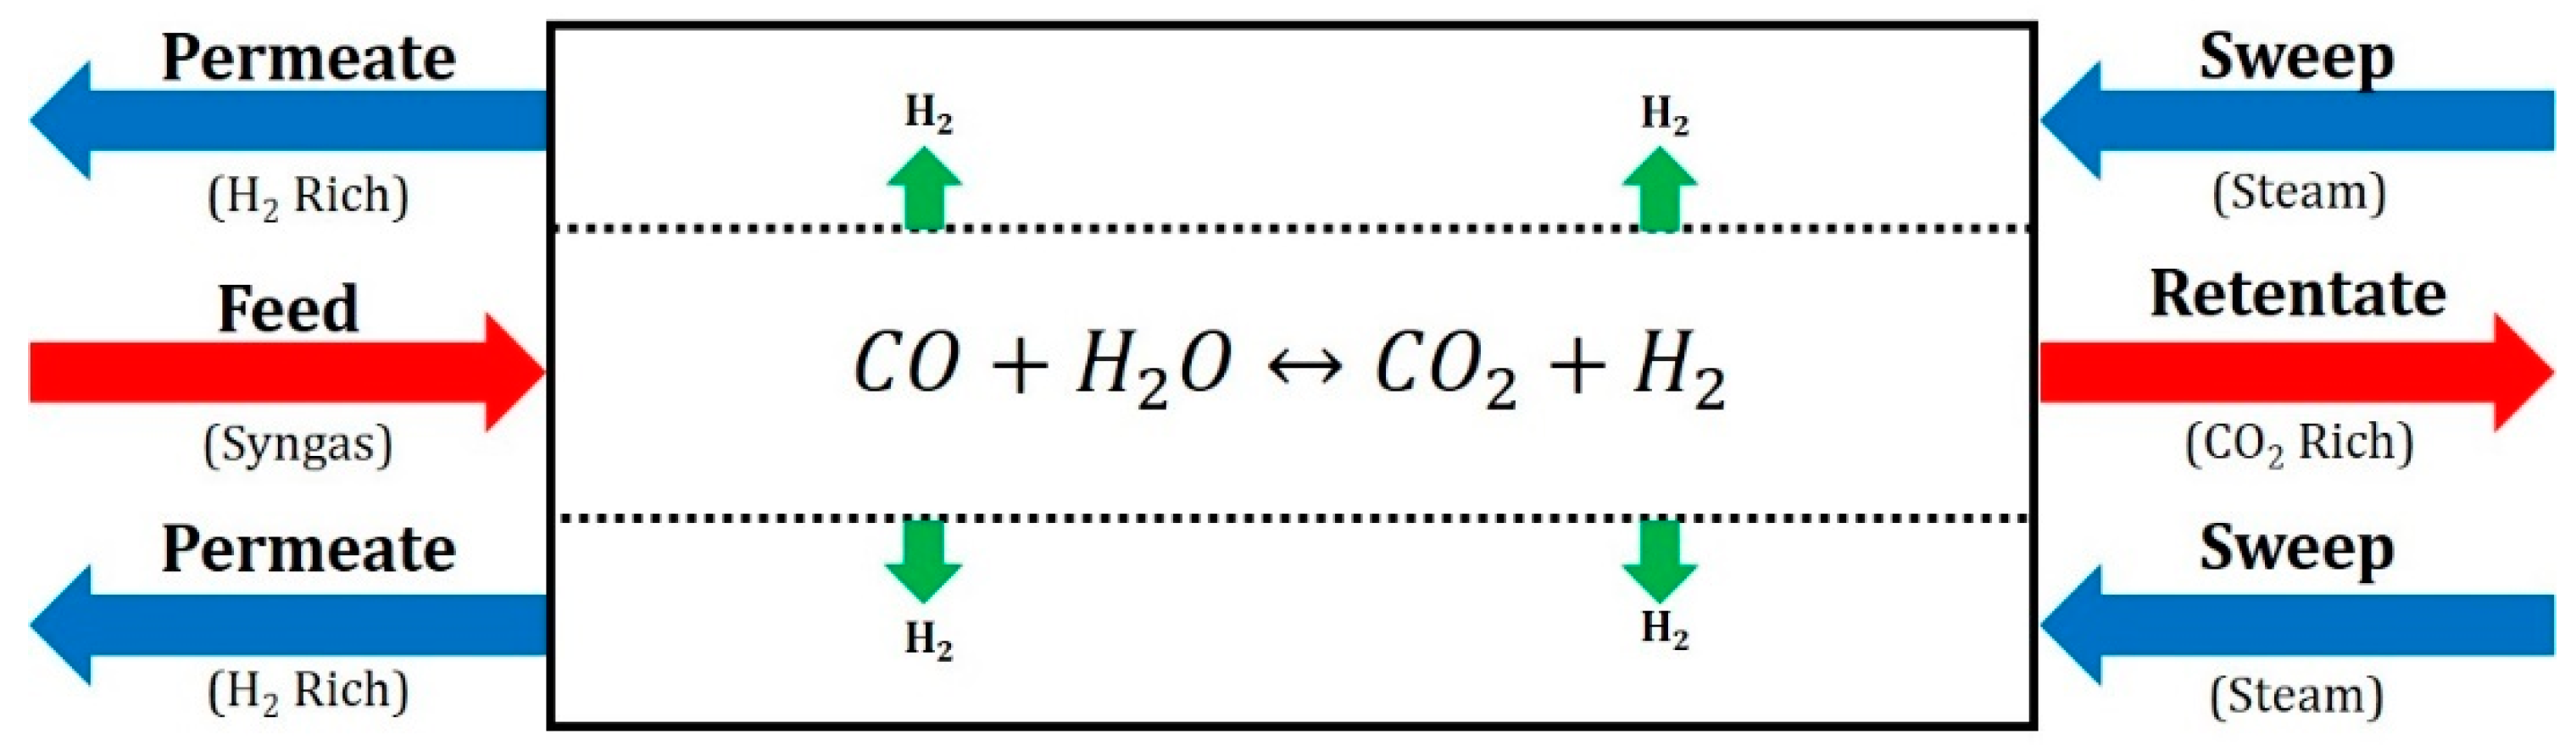
8]. The reactor utilizes as process stream a syngas feed that has undergone the necessary removal of impurities, while the chosen sweep gas is steam. The inlet composition of these streams can be found in
Table 2.
The syngas feed enters the tube side of the reactor at 300 °C, 47.63 atm, and with a volumetric flow rate of 400 cm
3/min. The sweep gas enters the shell as pure, saturated steam at 25.86 atm and a volumetric flowrate of 400 cm
3/min. The reactor consists of a single tube (1.02 cm diameter) and shell (6.12 cm diameter) arrangement with a total reactor length of 300 cm. A membrane thickness of 100 nm is selected to reflect an industrially relevant thickness [
9,
10,
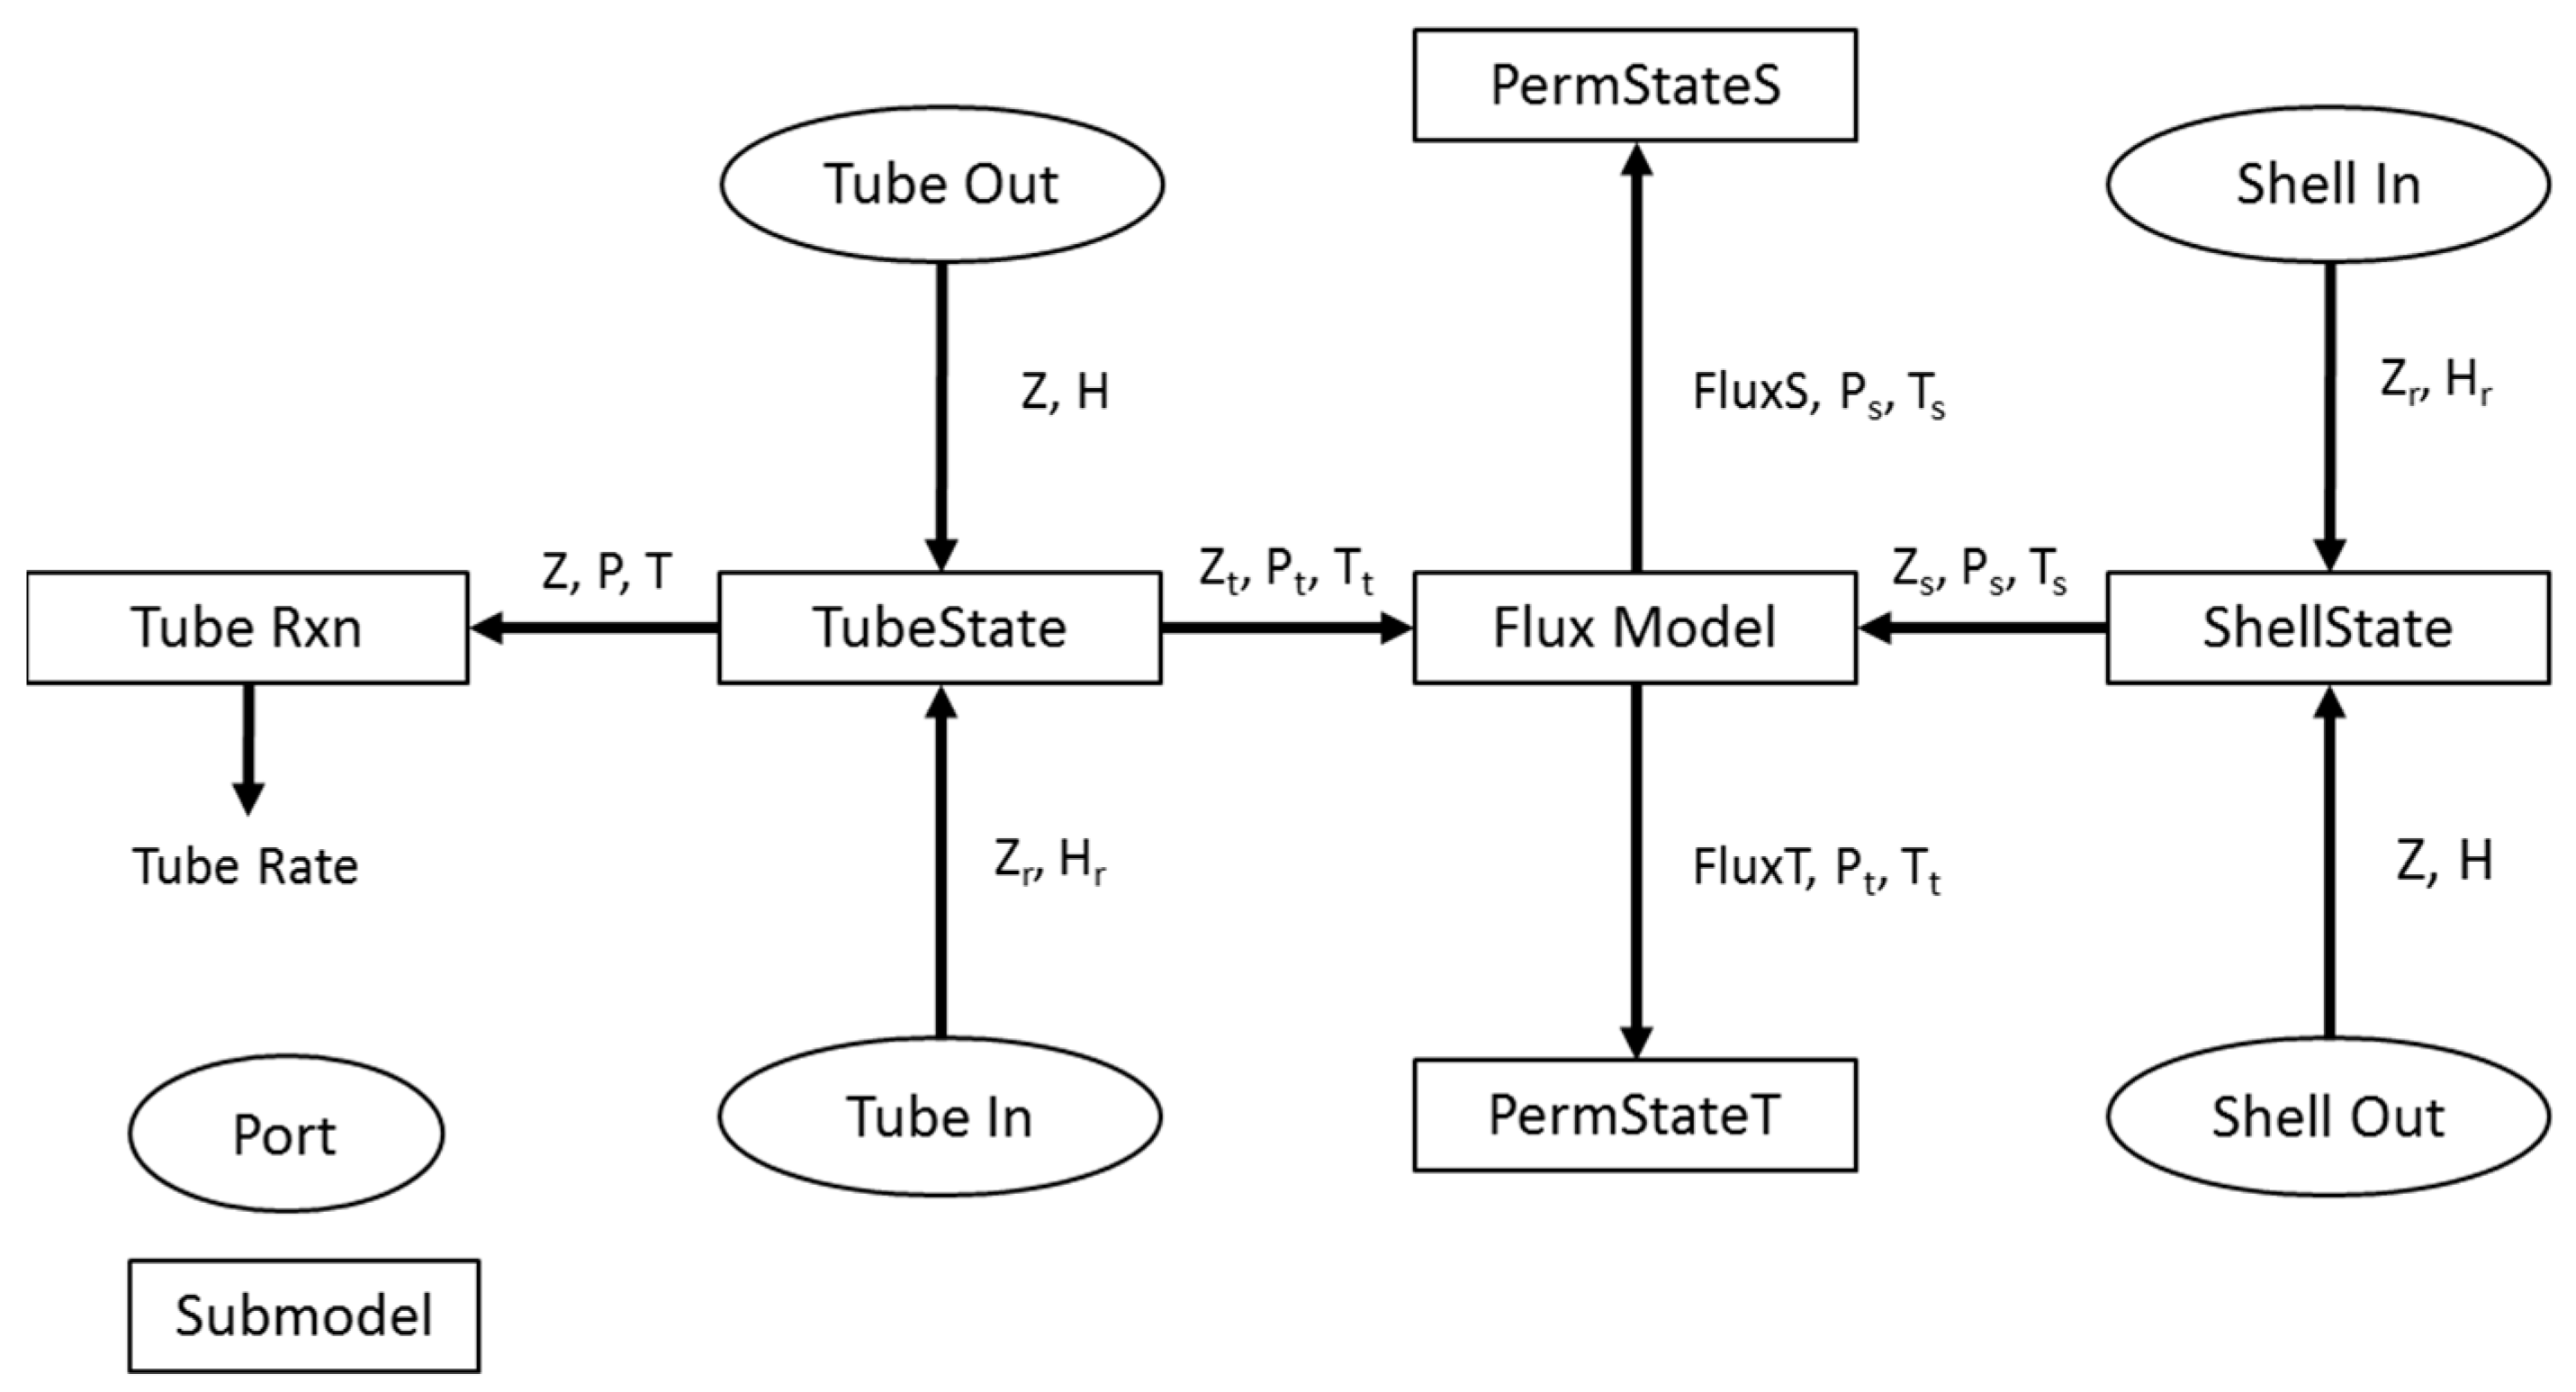
11]. Under these conditions, a simulation was run using the block-based phenomena modeling approach and compared to the simulation data from Radcliffe et al. [
8] for validation. The results of such comparison are shown in
Table 3. In future work, the authors will pursue the additional validation of the model with experimental data.
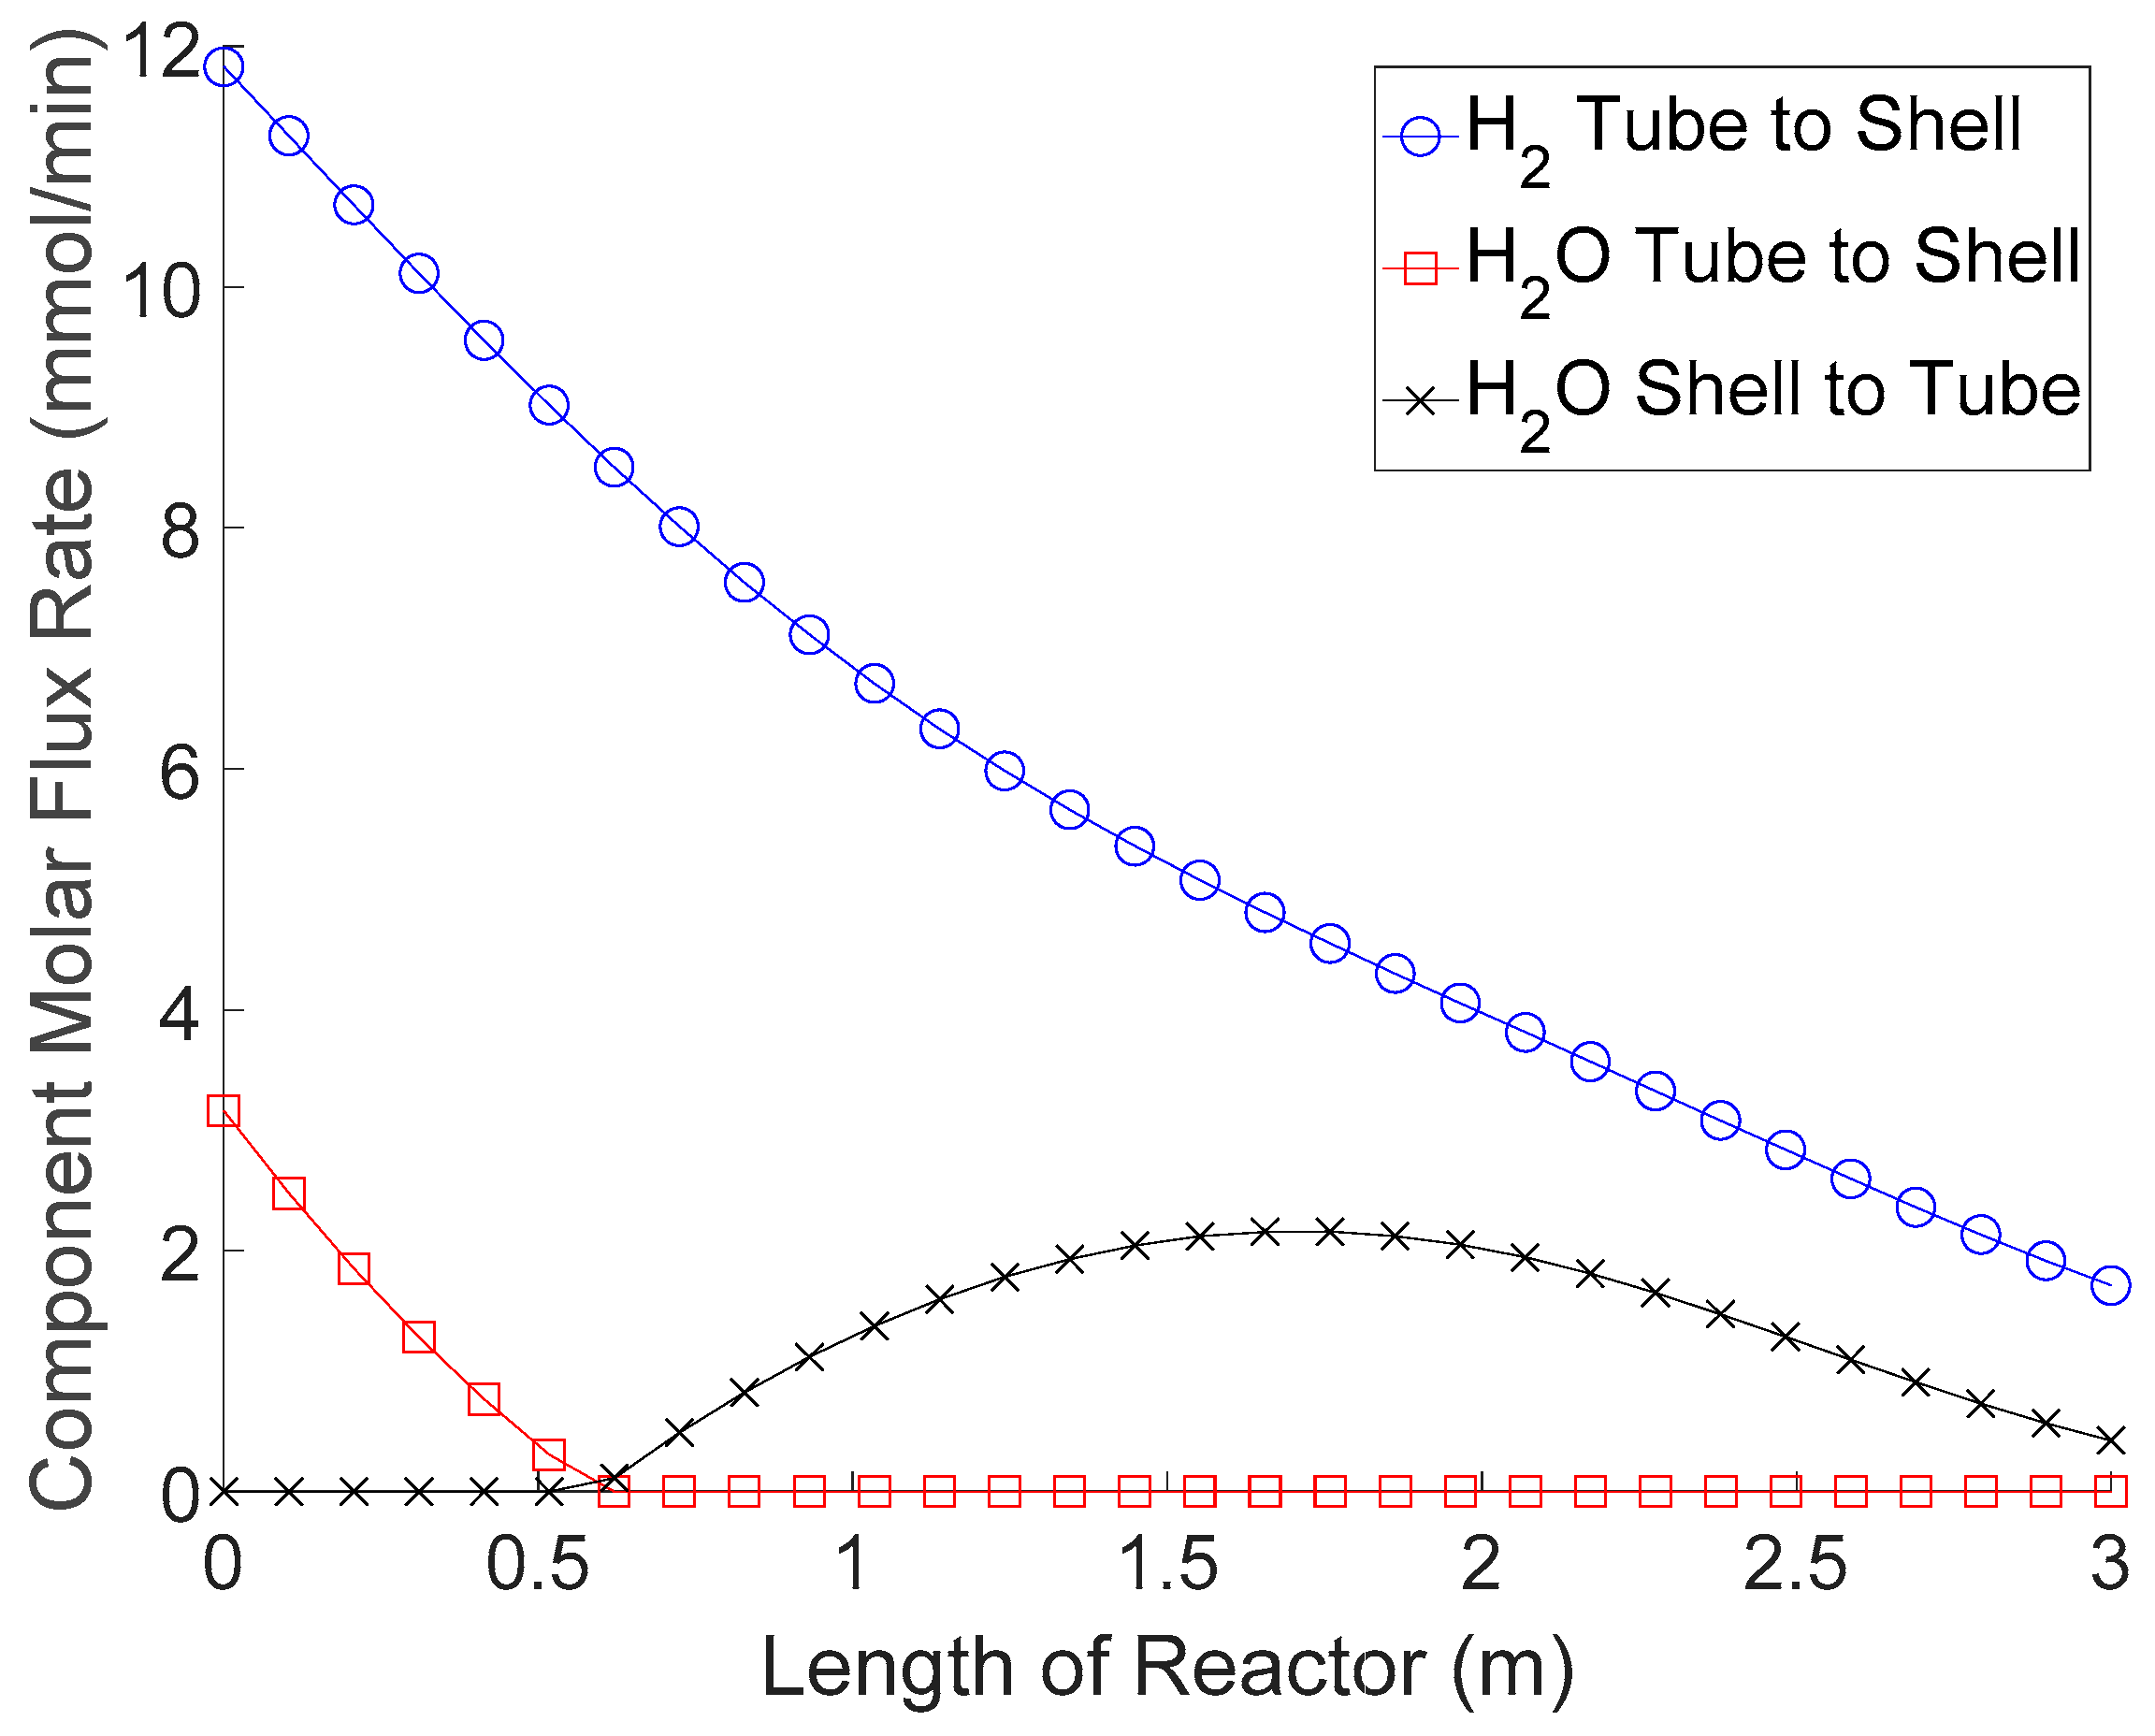
Using the nominal conditions described above, profiles for the permeation rates of hydrogen and steam are produced as shown in
Figure 6.
Although the other components, CO
2, CO, and N
2, are also permeating through the membrane, they are permeating at a much lower rate than H
2 and H
2O, depicted in
Figure 6. This result shows an interesting characteristic of the polymer membrane. For about the first sixth of the reactor, H
2O (steam) is being removed from the tube side along with the H
2 product. However, for the remainder of the reactor, steam is being injected into the tube side of the reactor. During this time, the sweep gas enters the catalytic tube side, reacts to become hydrogen, and then permeates back to the shell side as a product. This is a nice property for an equilibrium-limited reaction such as WGS, because not only is the membrane removing a main product, but it is also providing steam injection for enhanced conversion. This would be a useful property for cases where the CO/H
2O ratio of the feed becomes greater than one and there is insufficient steam to convert all the CO to CO
2.
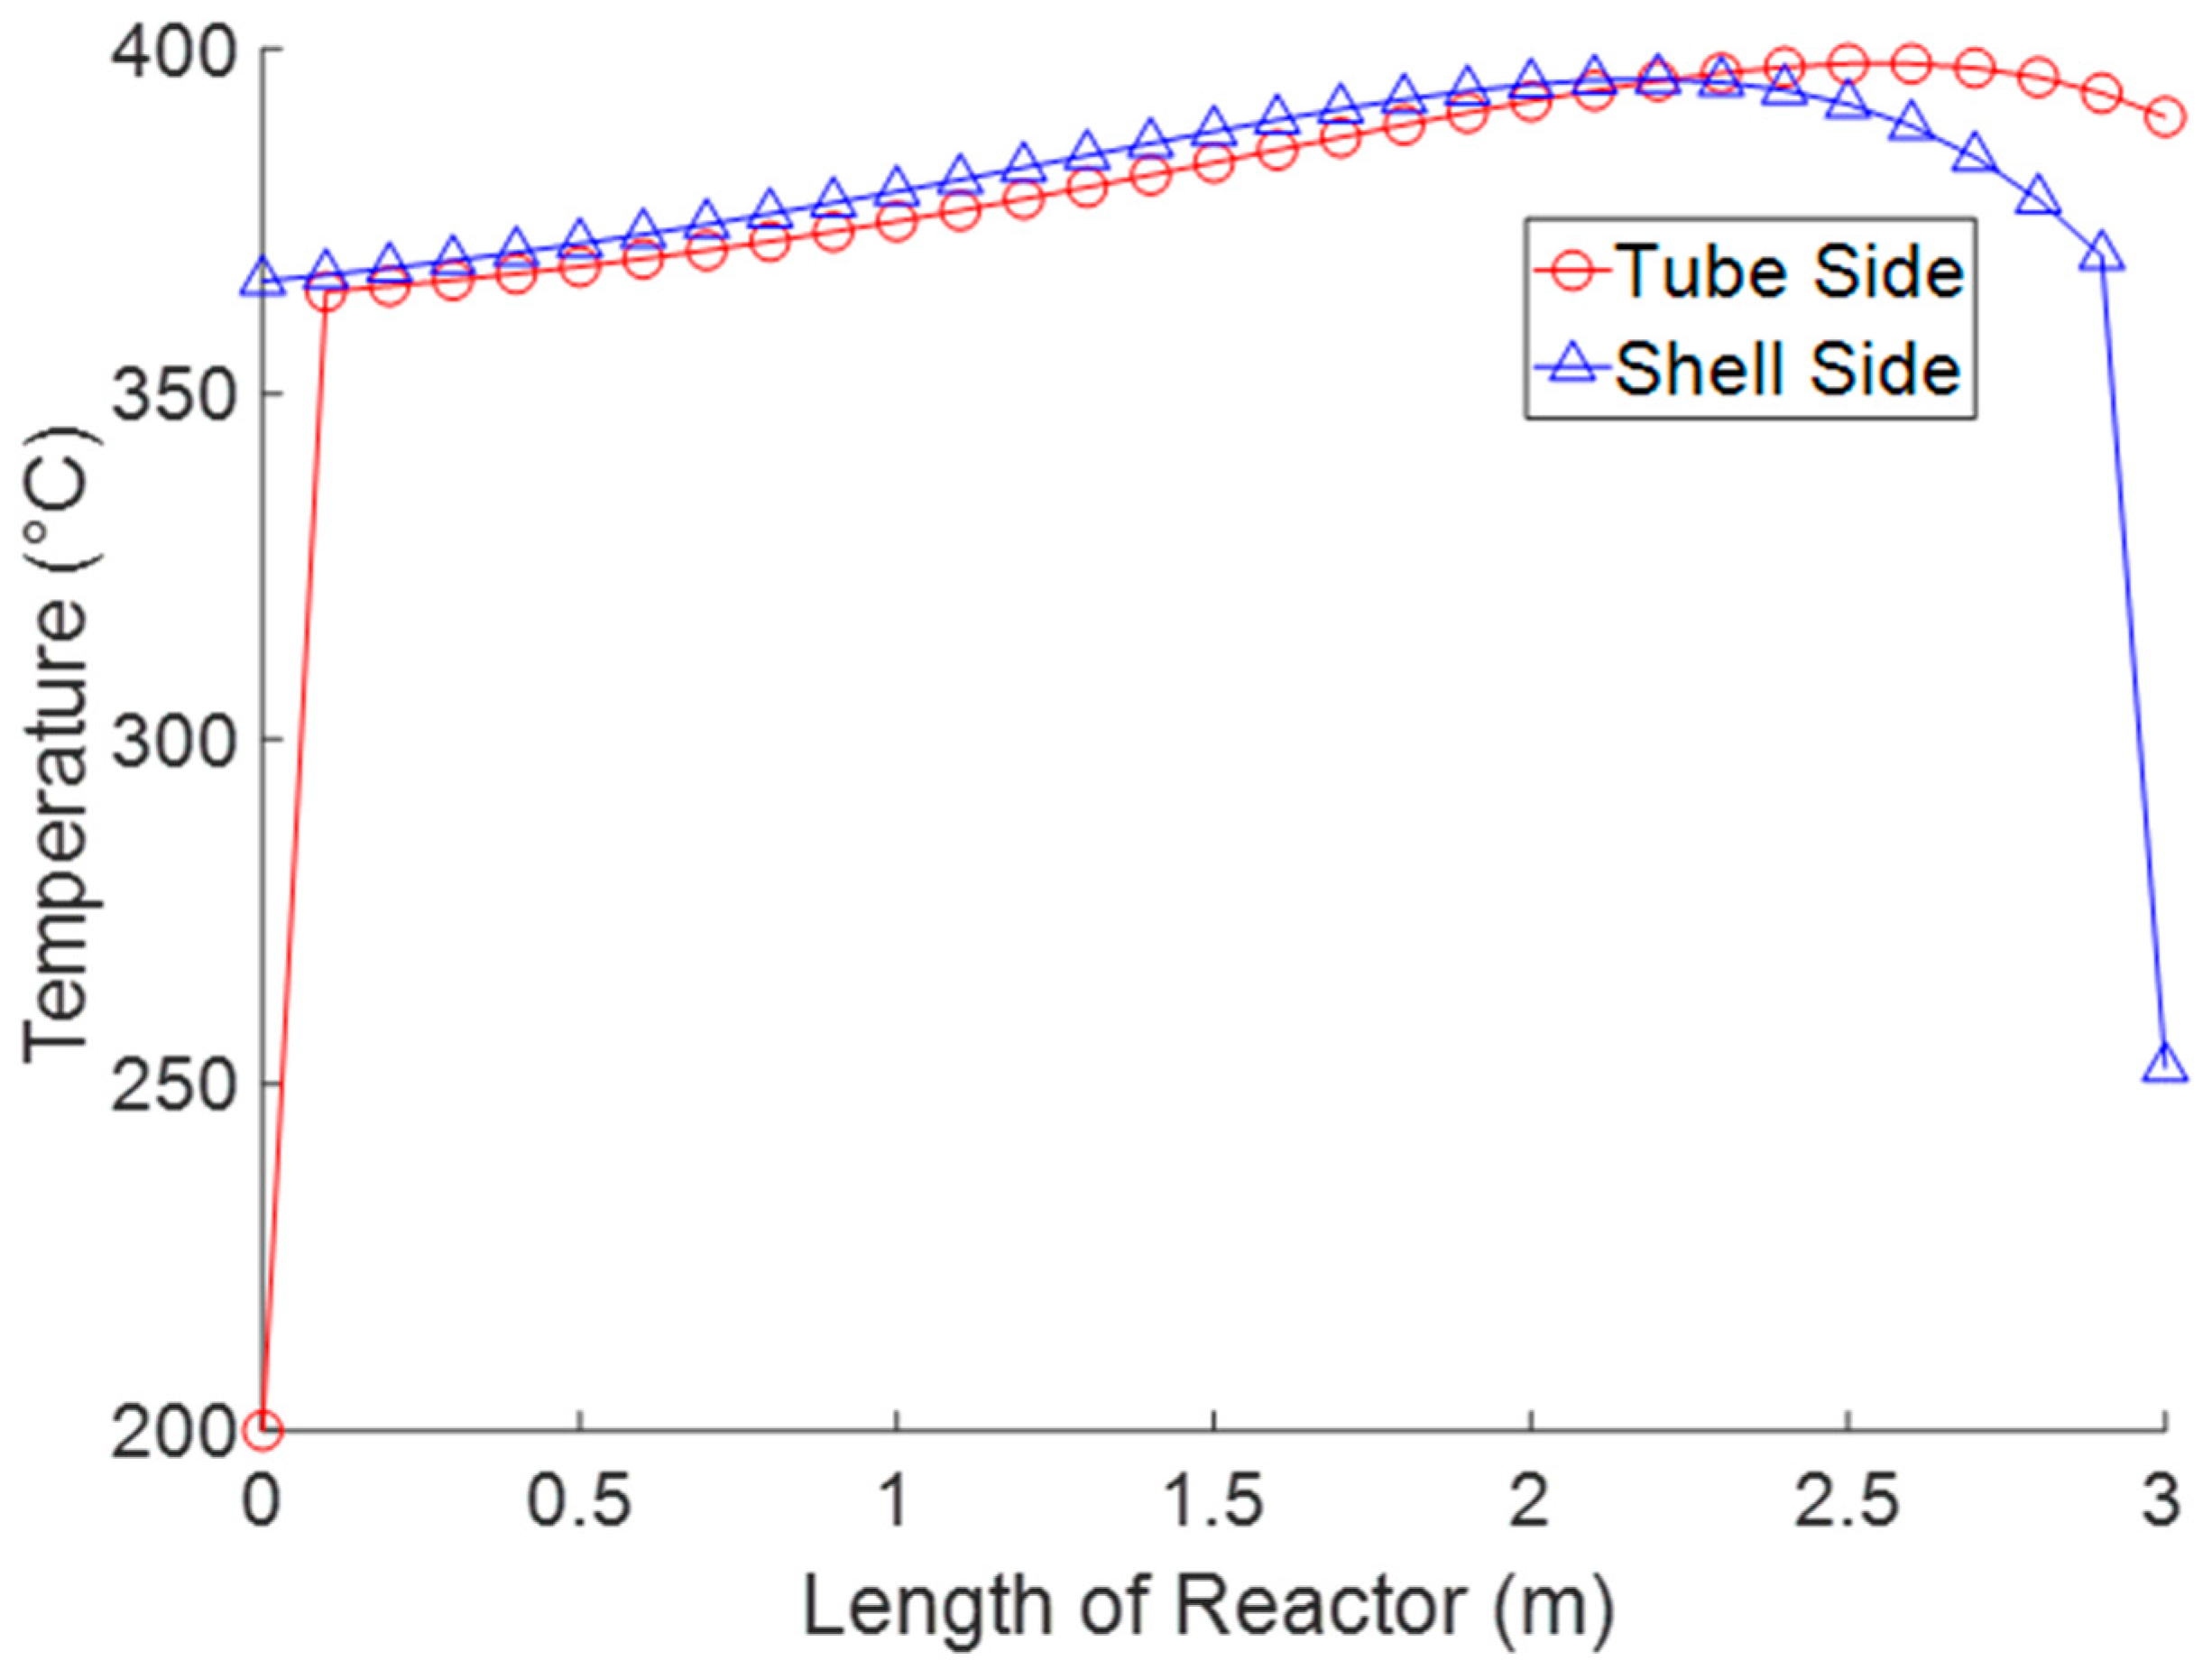
Temperature is also an important factor to consider as WGS is known to produce a significant amount of heat and becomes equilibrium limited as the temperature increases. The temperature profiles for the tube and shell sides at the nominal operating condition and for a syngas feed at 200 °C can be seen in
Figure 7.
It is important to note in
Figure 7 the temperature spike at the beginning of the reactor. The conditions at the inlet of the reactor lie very far to the left of equilibrium. This is evidenced by the fact that steam is permeating out of the tube side at the beginning of the process. The reaction rates are much greater than in a normal WGS reactor because H
2 product is being removed, thus, also removing a major equilibrium limitation, but also introducing a large temperature spike. This problem of excess heat in polymer membrane reactors was reported by Singh et al. [
11] who stated that “syngas operating temperatures in the vicinity of the water-gas shift (WGS) reactors ranges from 200 to 500 °C, depending on the WGS stage and catalyst used.” This illustrates the importance of including the nonisothermal reactor operation in the modeling approach, as the reactor inlet temperature for our past study [
8] leads to reactor temperatures that exceed the glass transition temperature (T
g = 450 °C) and would eventually cause degradation of the polymer membrane material.
These simulation results indicate many research pathways for the design of membrane reactors. Most membrane reactor models require simplifications to the problem in order to produce results in a tractable manner, especially when performing an operability analysis (or online optimization) that requires many simulations to be run to produce the output space for further analysis. However, these simplifications are harder to justify in the design and simulation of intensified processes. The purpose of combining phenomena such as mass transfer and kinetics is to see how the performance of the unit can be improved by having them work in tandem. However, as shown earlier with the temperature profile in
Figure 7, there are also difficult challenges that arise when combining them. As more phenomena are combined in these process units, the more interdependent they become, and the more difficult it is to design the equipment to meet the desired output specifications [
2,
15,
16].
Isothermal operation is often assumed for a few reasons. The reaction rate, equilibrium, and the membrane permeance are all affected by the temperature in the reactor. When this is coupled with the interdependence that the phenomena have with each other, it creates a very complex behavior and difficult calculation before even considering how the tube side of the membrane reactor might interact with the shell side for heat transfer calculations.
The difficulty in solving for the state of the tube or shell side of the membrane reactor is a reason the Joule-Thomson is normally not considered. In most cases, the Joule-Thomson effect has a minor impact on the accuracy of the temperature and requires accurate knowledge of the temperature at a given point in the reactor to calculate accurately. Many membranes, such as palladium-based membranes, are highly selective to only H2, and therefore, do not need to consider this effect. Because of this, it is normally not worthwhile from a modeling perspective unless other nonisothermal factors are being considered in the model. However, in the case of polymer membranes with a high selectivity for H2O permeation and nearly a 22 atm difference in pressure across the membrane wall, the Joules-Thomson effect may be more important to include.
The stated complexities are also the reason for avoiding countercurrent operation in membrane reactor simulation. The significant dependency on the states of each side of the reactor creates a very difficult boundary-value problem, where even slight changes to the conditions of one side of the reactor can lead to dramatically different solutions overall. In most traditional unit operations such as heat exchangers and reactors, the profiles will still have similar shapes, but will shift, compress, or contract as unit operations are varied. However, with the membrane reactor model, different operating points lead to dramatically different behaviors, and because of this, countercurrent operation is generally avoided.
Lastly, membranes such as the polybenzimidazole are able to have multiple components permeating in both directions simultaneously. This only becomes difficult when combined with countercurrent operation as this allows for a circulation effect to occur in the membrane reactor. For example, steam flows countercurrently to the tube side, permeates to the tube side, reacts to become hydrogen, flows cocurrently within the tube, and then permeates back to the shell side before leaving the reactor. Given all these aforementioned challenges, the proposed model of the comprehensive nonisothermal, countercurrent membrane reactor with bidirectional permeation is thus one of the significant contributions of this work.
3.2. Operability Analysis of Polymer Membrane Reactors
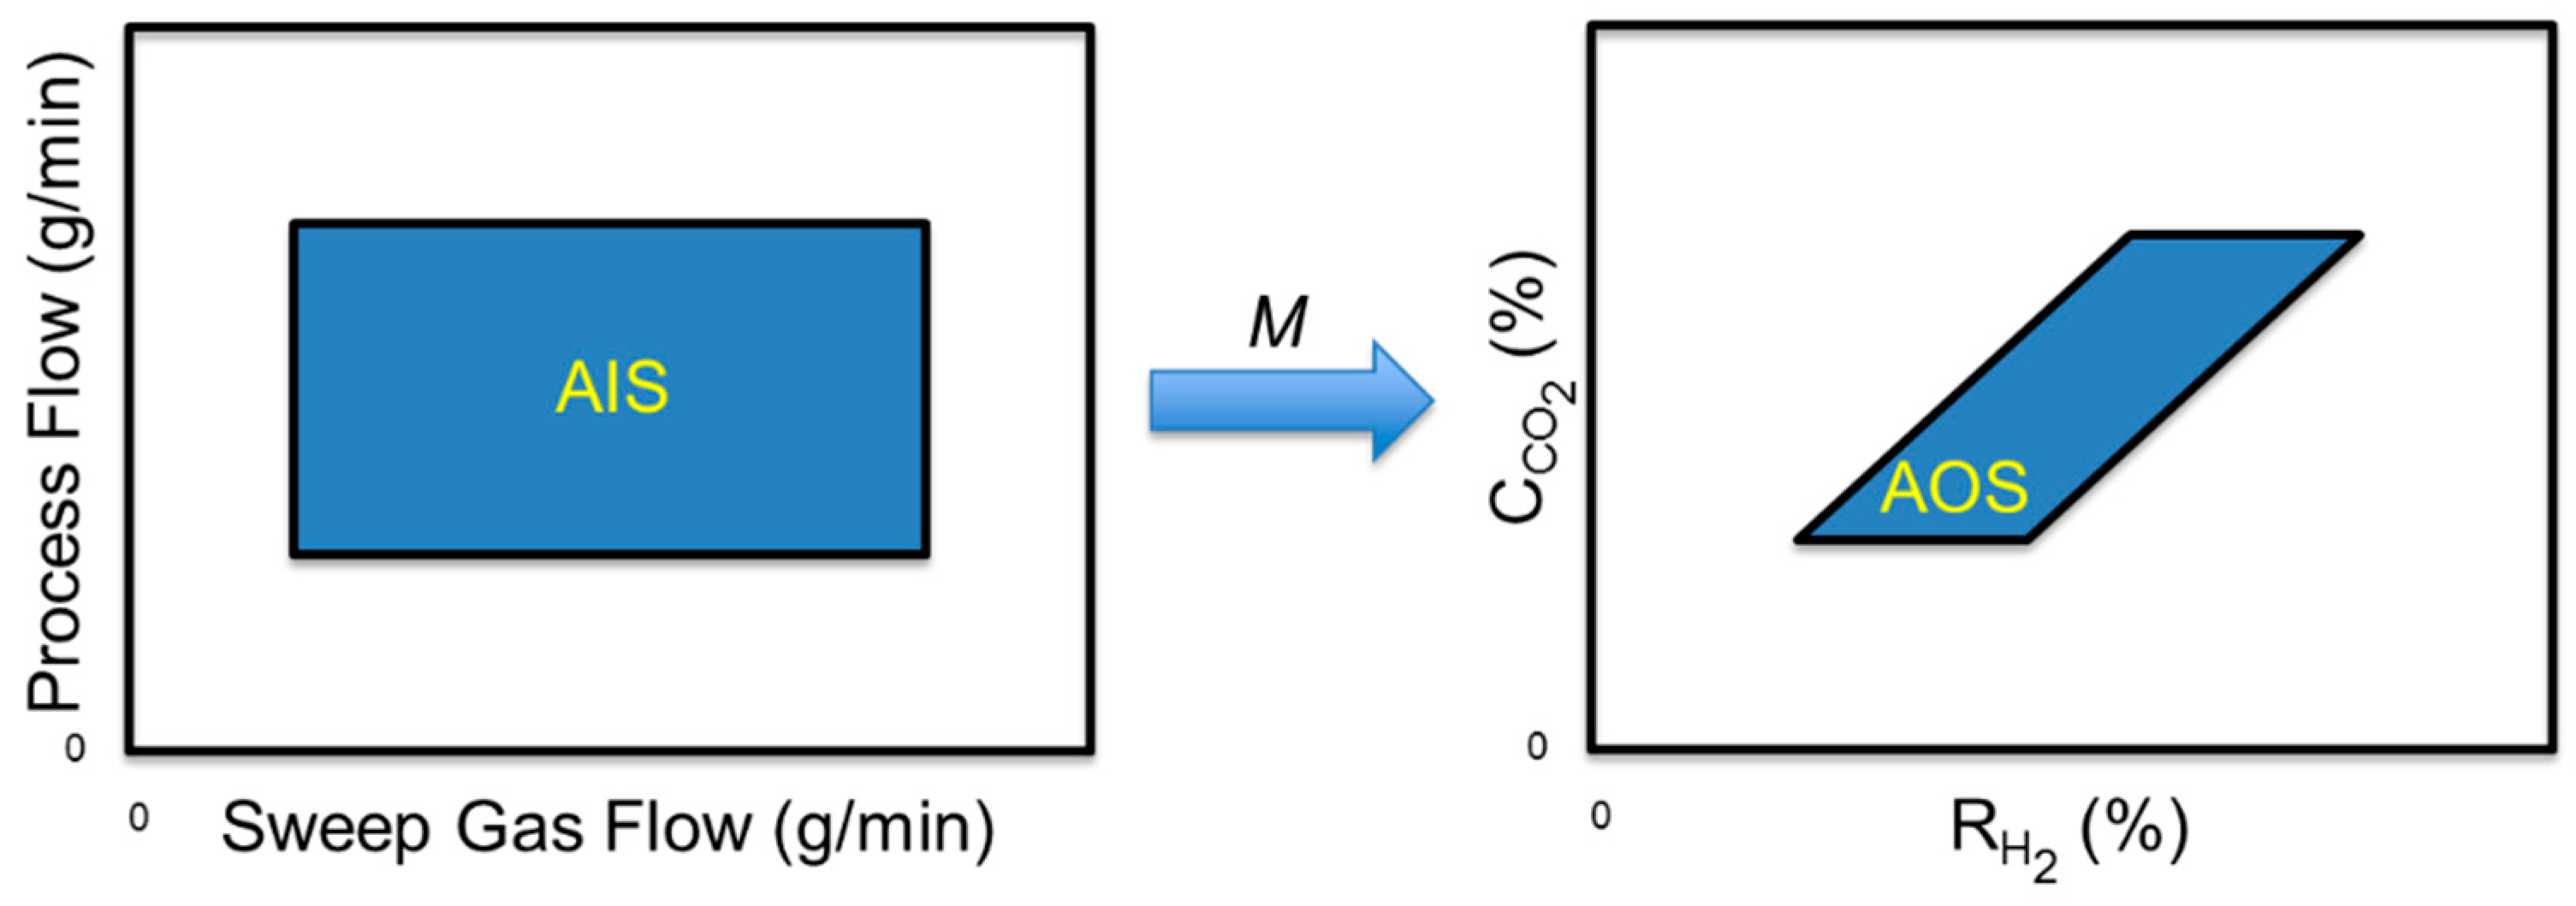
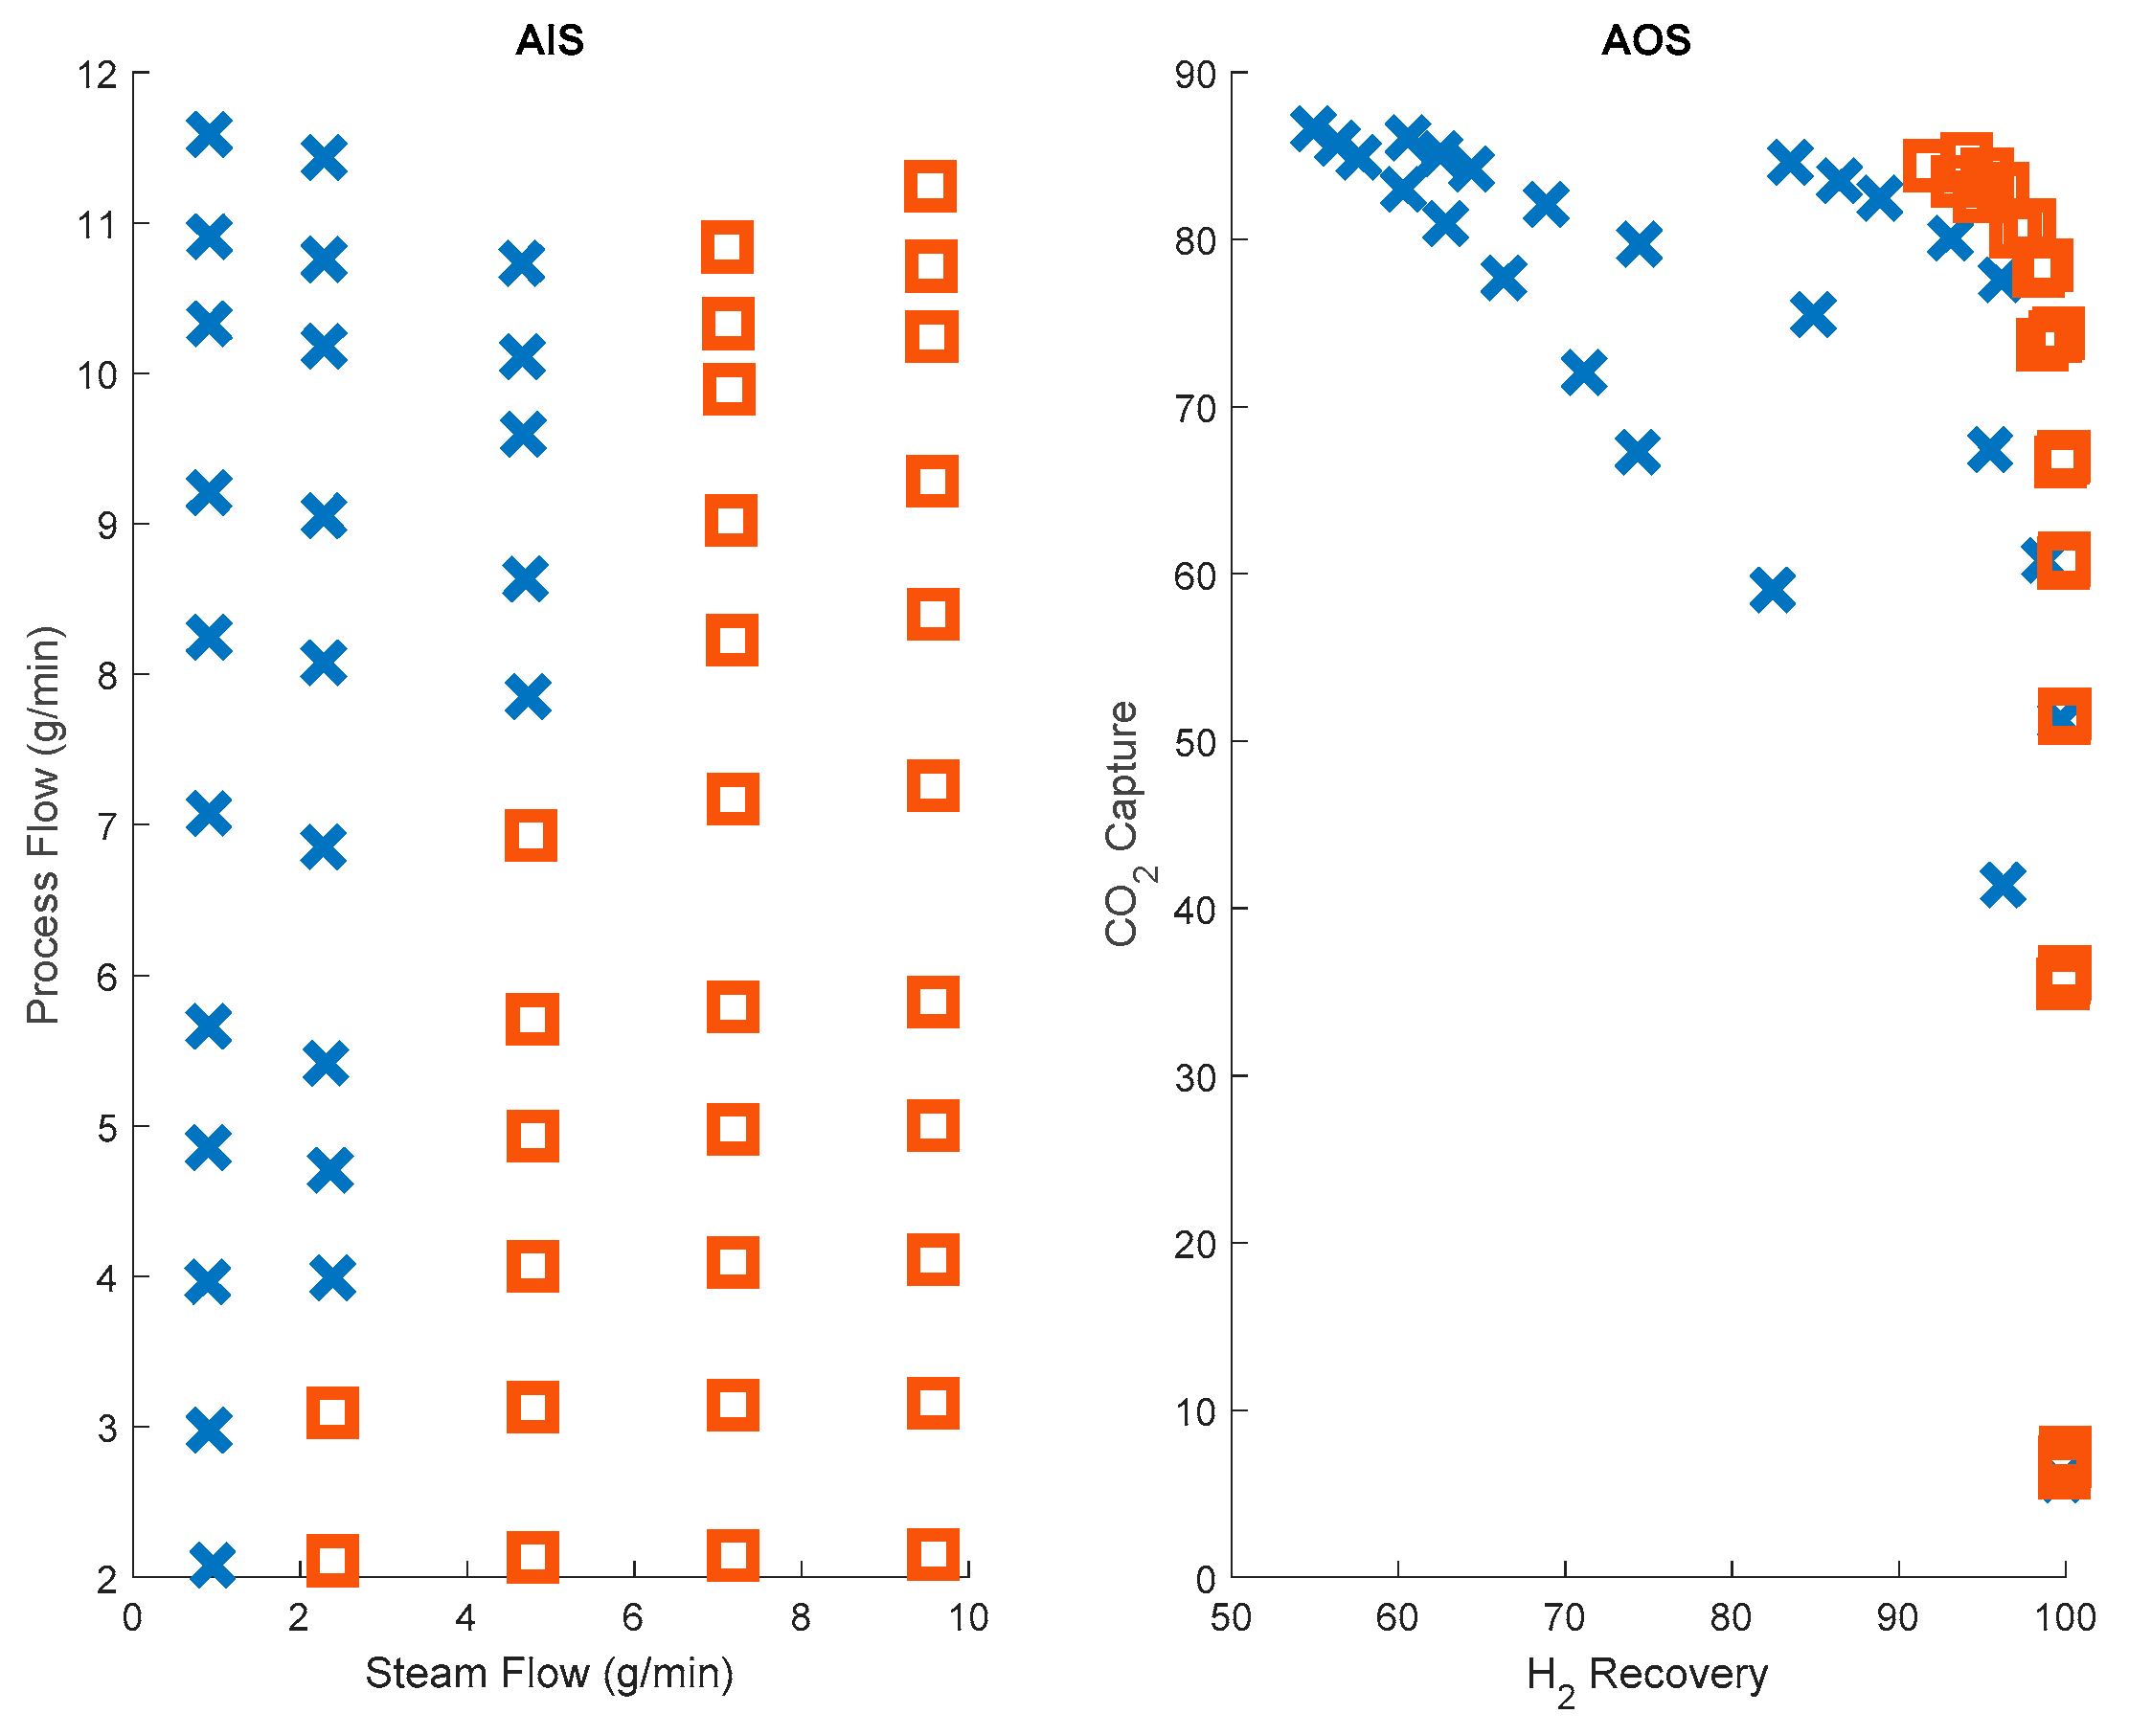
Once a reliable modeling approach is established, an operability analysis is conducted using the process model to see the behavior of the polymer membrane at various operating conditions. The results of this operability mapping can be found in
Figure 8.
This operability mapping in
Figure 8 provides a good representation of the challenges caused by the nonlinearity of the system. It appears that if the flowrate of sweep gas increases to much more than that of the syngas (process flow), then the output becomes very constrained in terms of achievability (indicated by the square markers in
Figure 8). This contrasts with the opposite mode of operation (sweep gas flow rate is much less than the syngas flowrate), where the two-dimensional input space is still mapped to another two-dimensional output space.
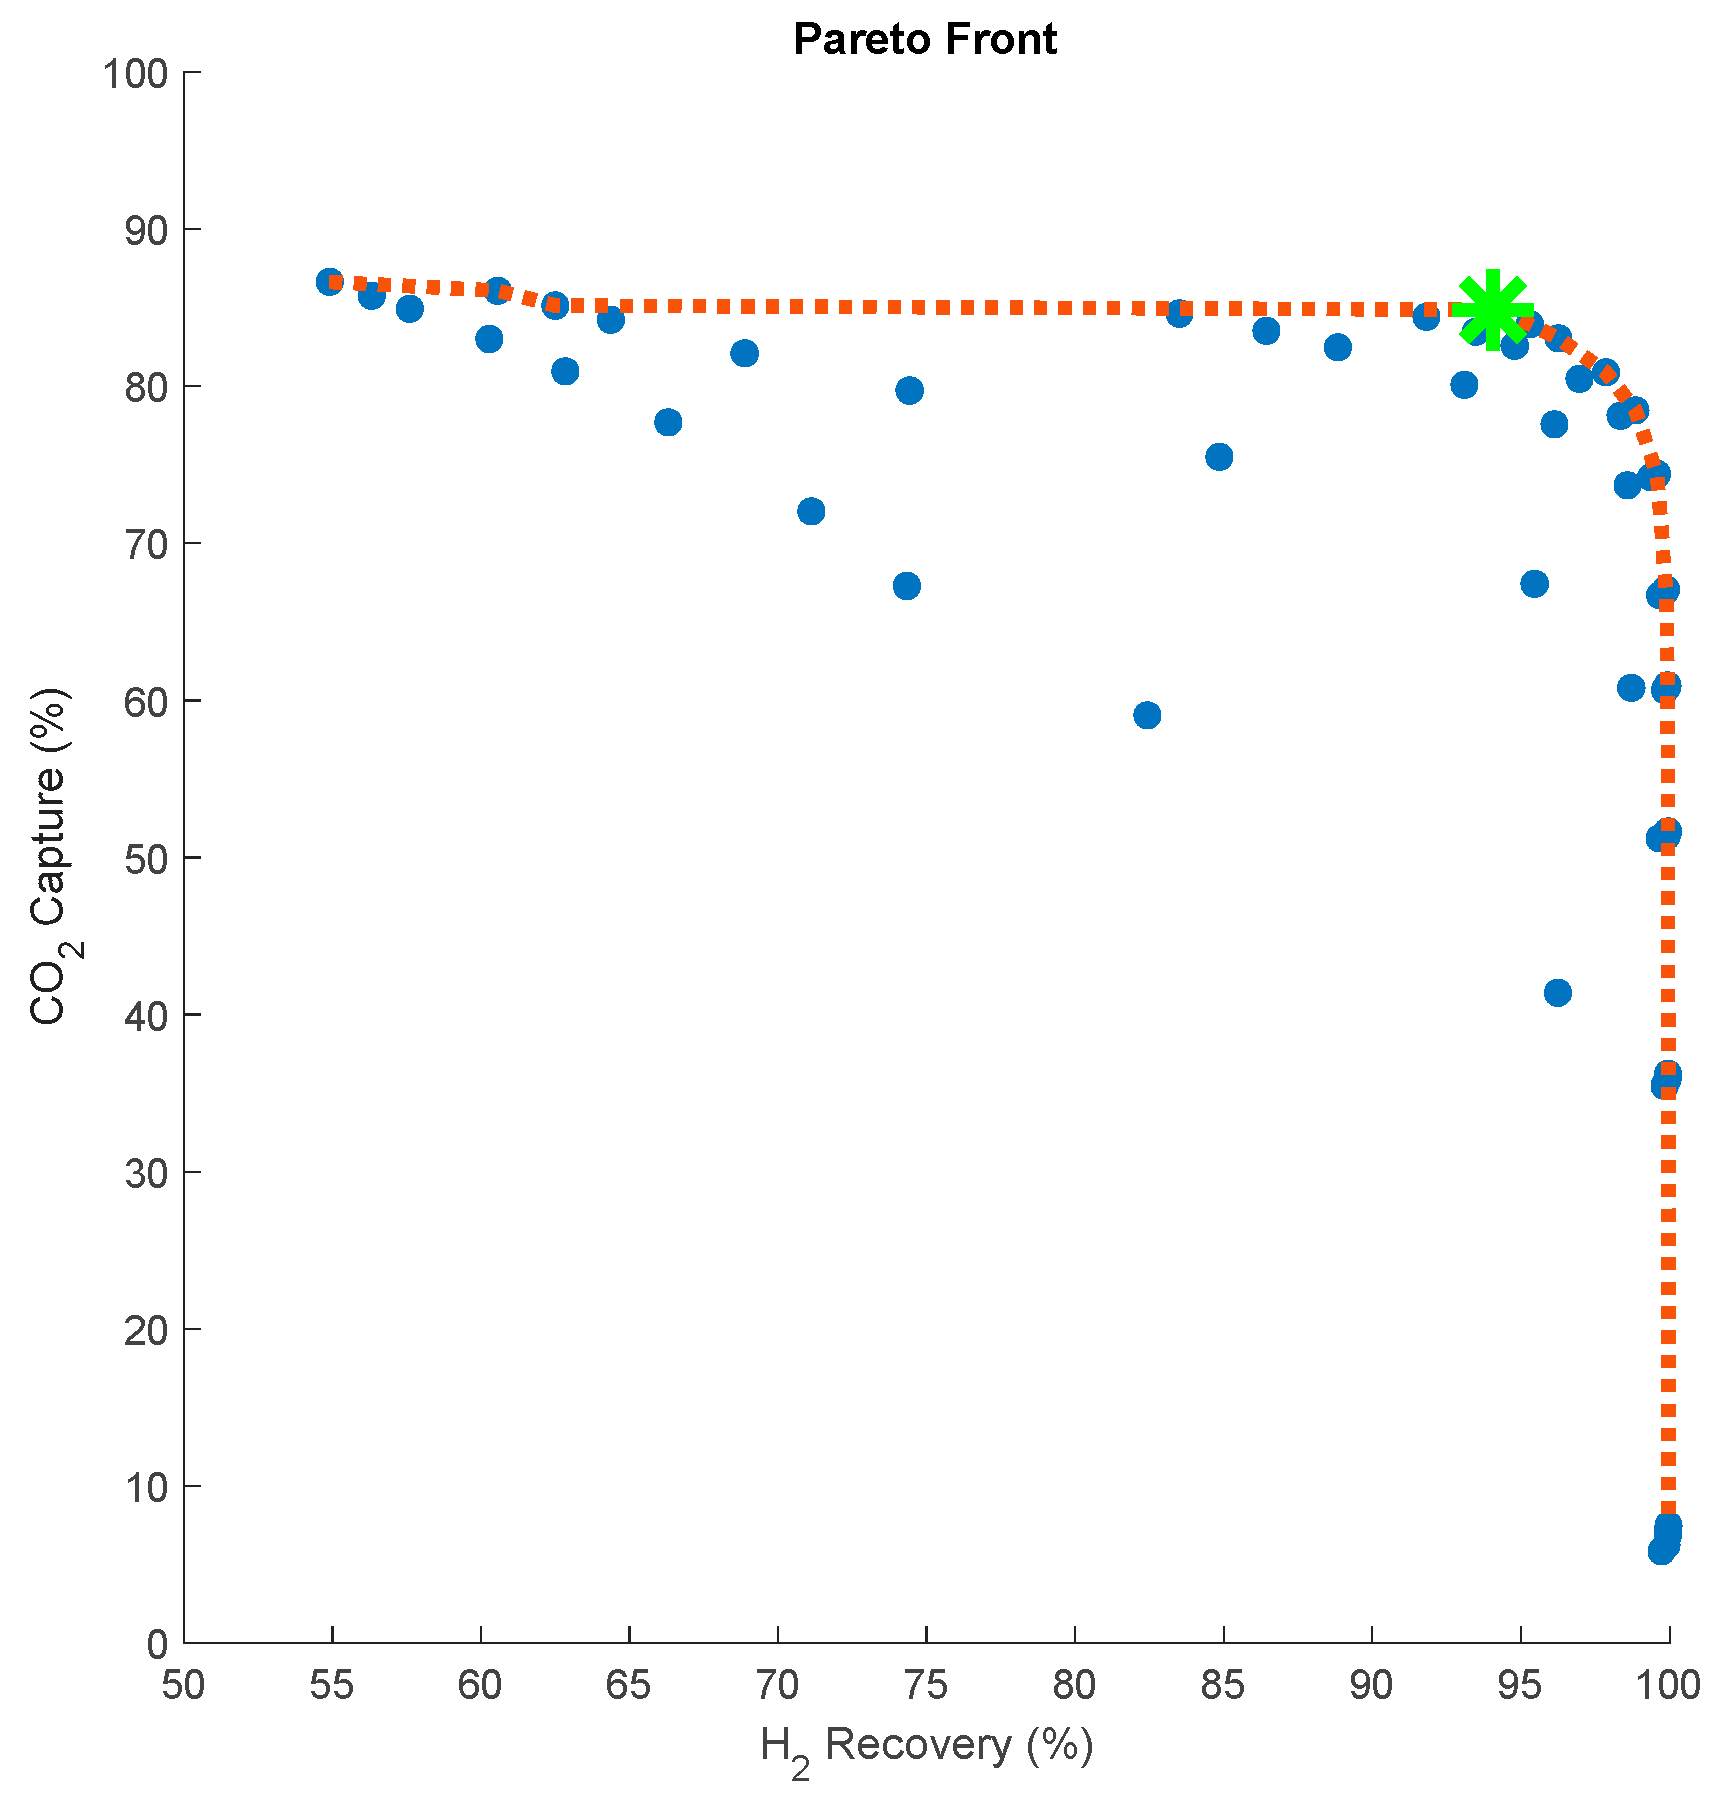
The achievable output set (AOS) also appears to form a Pareto front. The use of input-output mapping was also demonstrated by Messac and Mattson for generating Pareto points through physical programming [
17]. Employing this concept in an operability framework proves to be a useful tool in identifying both operational shortcomings and potential design solutions for the polymer membrane reactor. To show this, an analysis is conducted to identify which points in the output space fit the definition of a Pareto optimal point. A point is considered to be Pareto optimal if one objective cannot be improved without degrading another objective. This analysis is performed using a MATLAB script that checks each point in the output set for Pareto optimality. Since the ideal membrane output would be 100% CO
2 capture with 100% H
2 recovery, a “best compromise” point is defined here as the Pareto optimal point with the shortest Euclidean distance between itself, and the ideal output point. This analysis is performed in MATLAB using the pdist function with the ‘Euclidean’ norm option. The result of this analysis is shown in
Figure 9.
This Pareto frontier in
Figure 9, by definition, characterizes the best performance this polymer membrane reactor design can achieve, given the available inputs. To see how this operability analysis can help drive future design decisions, three operating points are selected from the Pareto front for further analysis based on where they are located in the output space; (i) high CO
2 capture, low H
2 recovery; (ii) low CO
2 capture, high H
2 recovery; (iii) a “best compromise” point (shown as a green star in
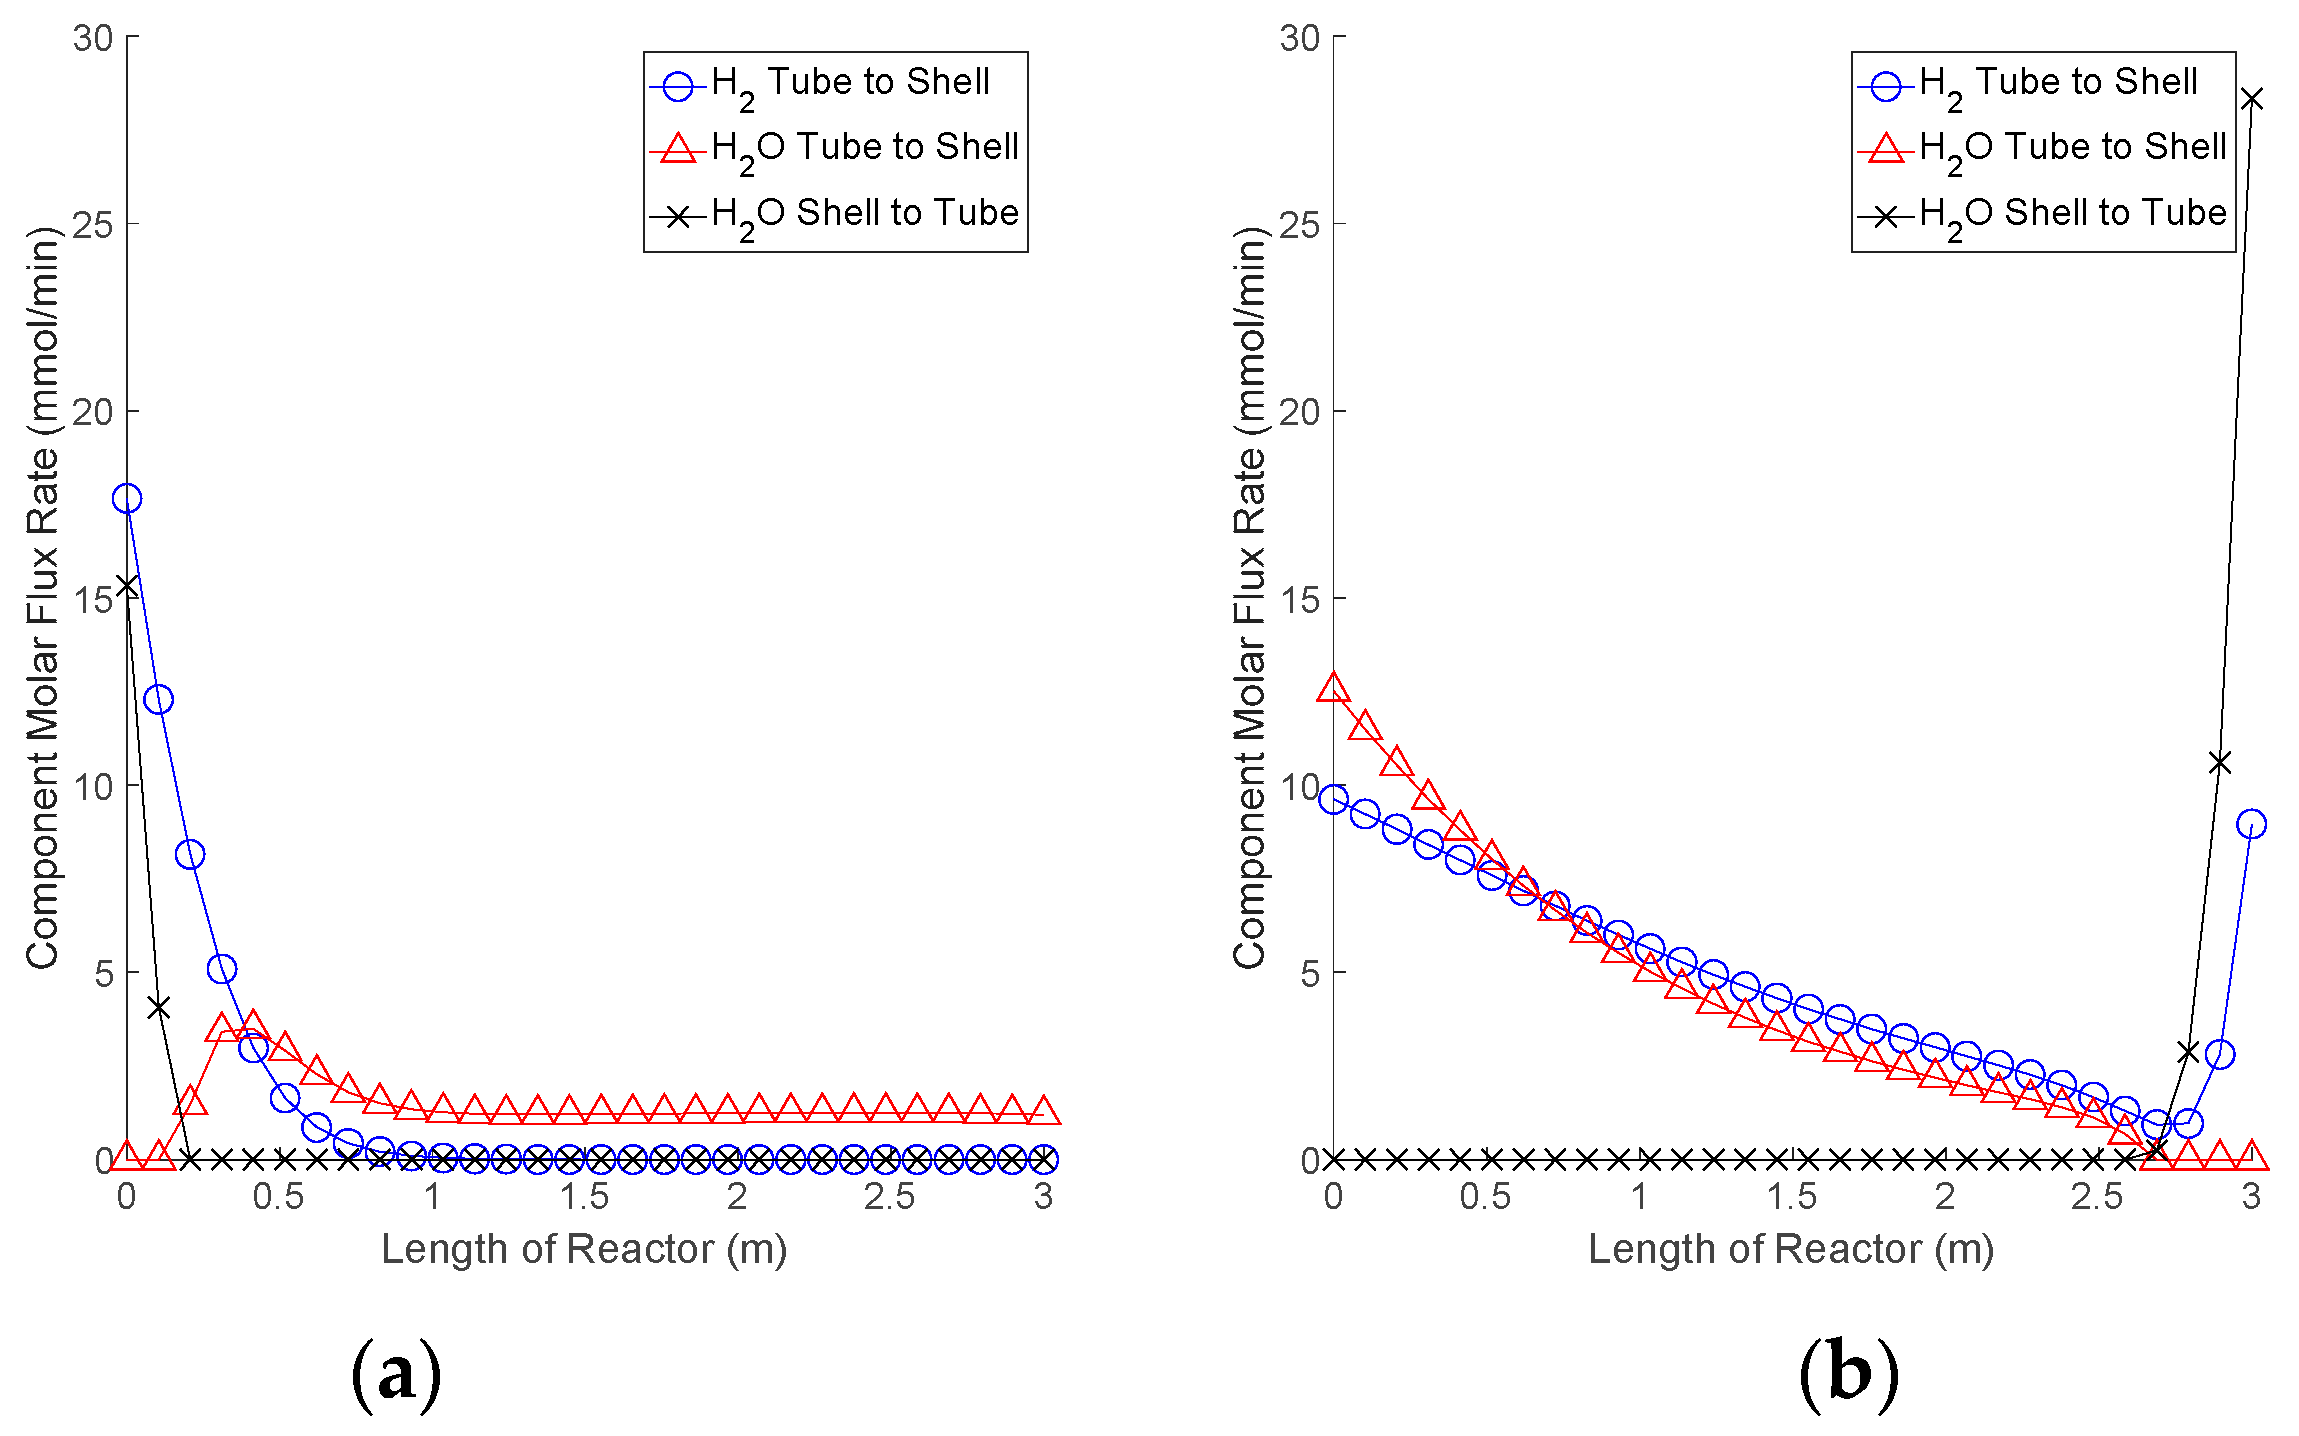
Figure 9). The points at each end of the Pareto front were selected and for the purpose of easier comparison, the H
2 and H
2O fluxes associated with these points were calculated, shown in
Figure 10.
The profiles in
Figure 10 explain how the high CO
2 capture or high H
2 recovery is achieved. In
Figure 10a, the process reaches an equilibrium within the first third of the reactor due to a relatively high flowrate of sweep gas. Slightly manipulating the sweep gas flowrate at this condition would reduce the permeation, but the membrane reactor would still reach this equilibrium. This results in very good H
2 recovery, but poor CO
2 capture as CO
2 continues to permeate out of the tube side despite the H
2 recovery process already being finished. Conversely,
Figure 10b shows that steam injection is occurring at the end of the membrane reactor, leaving little room left in the reactor for the sweep gas to capture the newly produced H
2 product. This low sweep gas flowrate means that very little CO
2 will escape from the reactor, leading to optimum CO
2 capture, but at the cost of reducing H
2 recovery.
The operating points selected for the simulations in
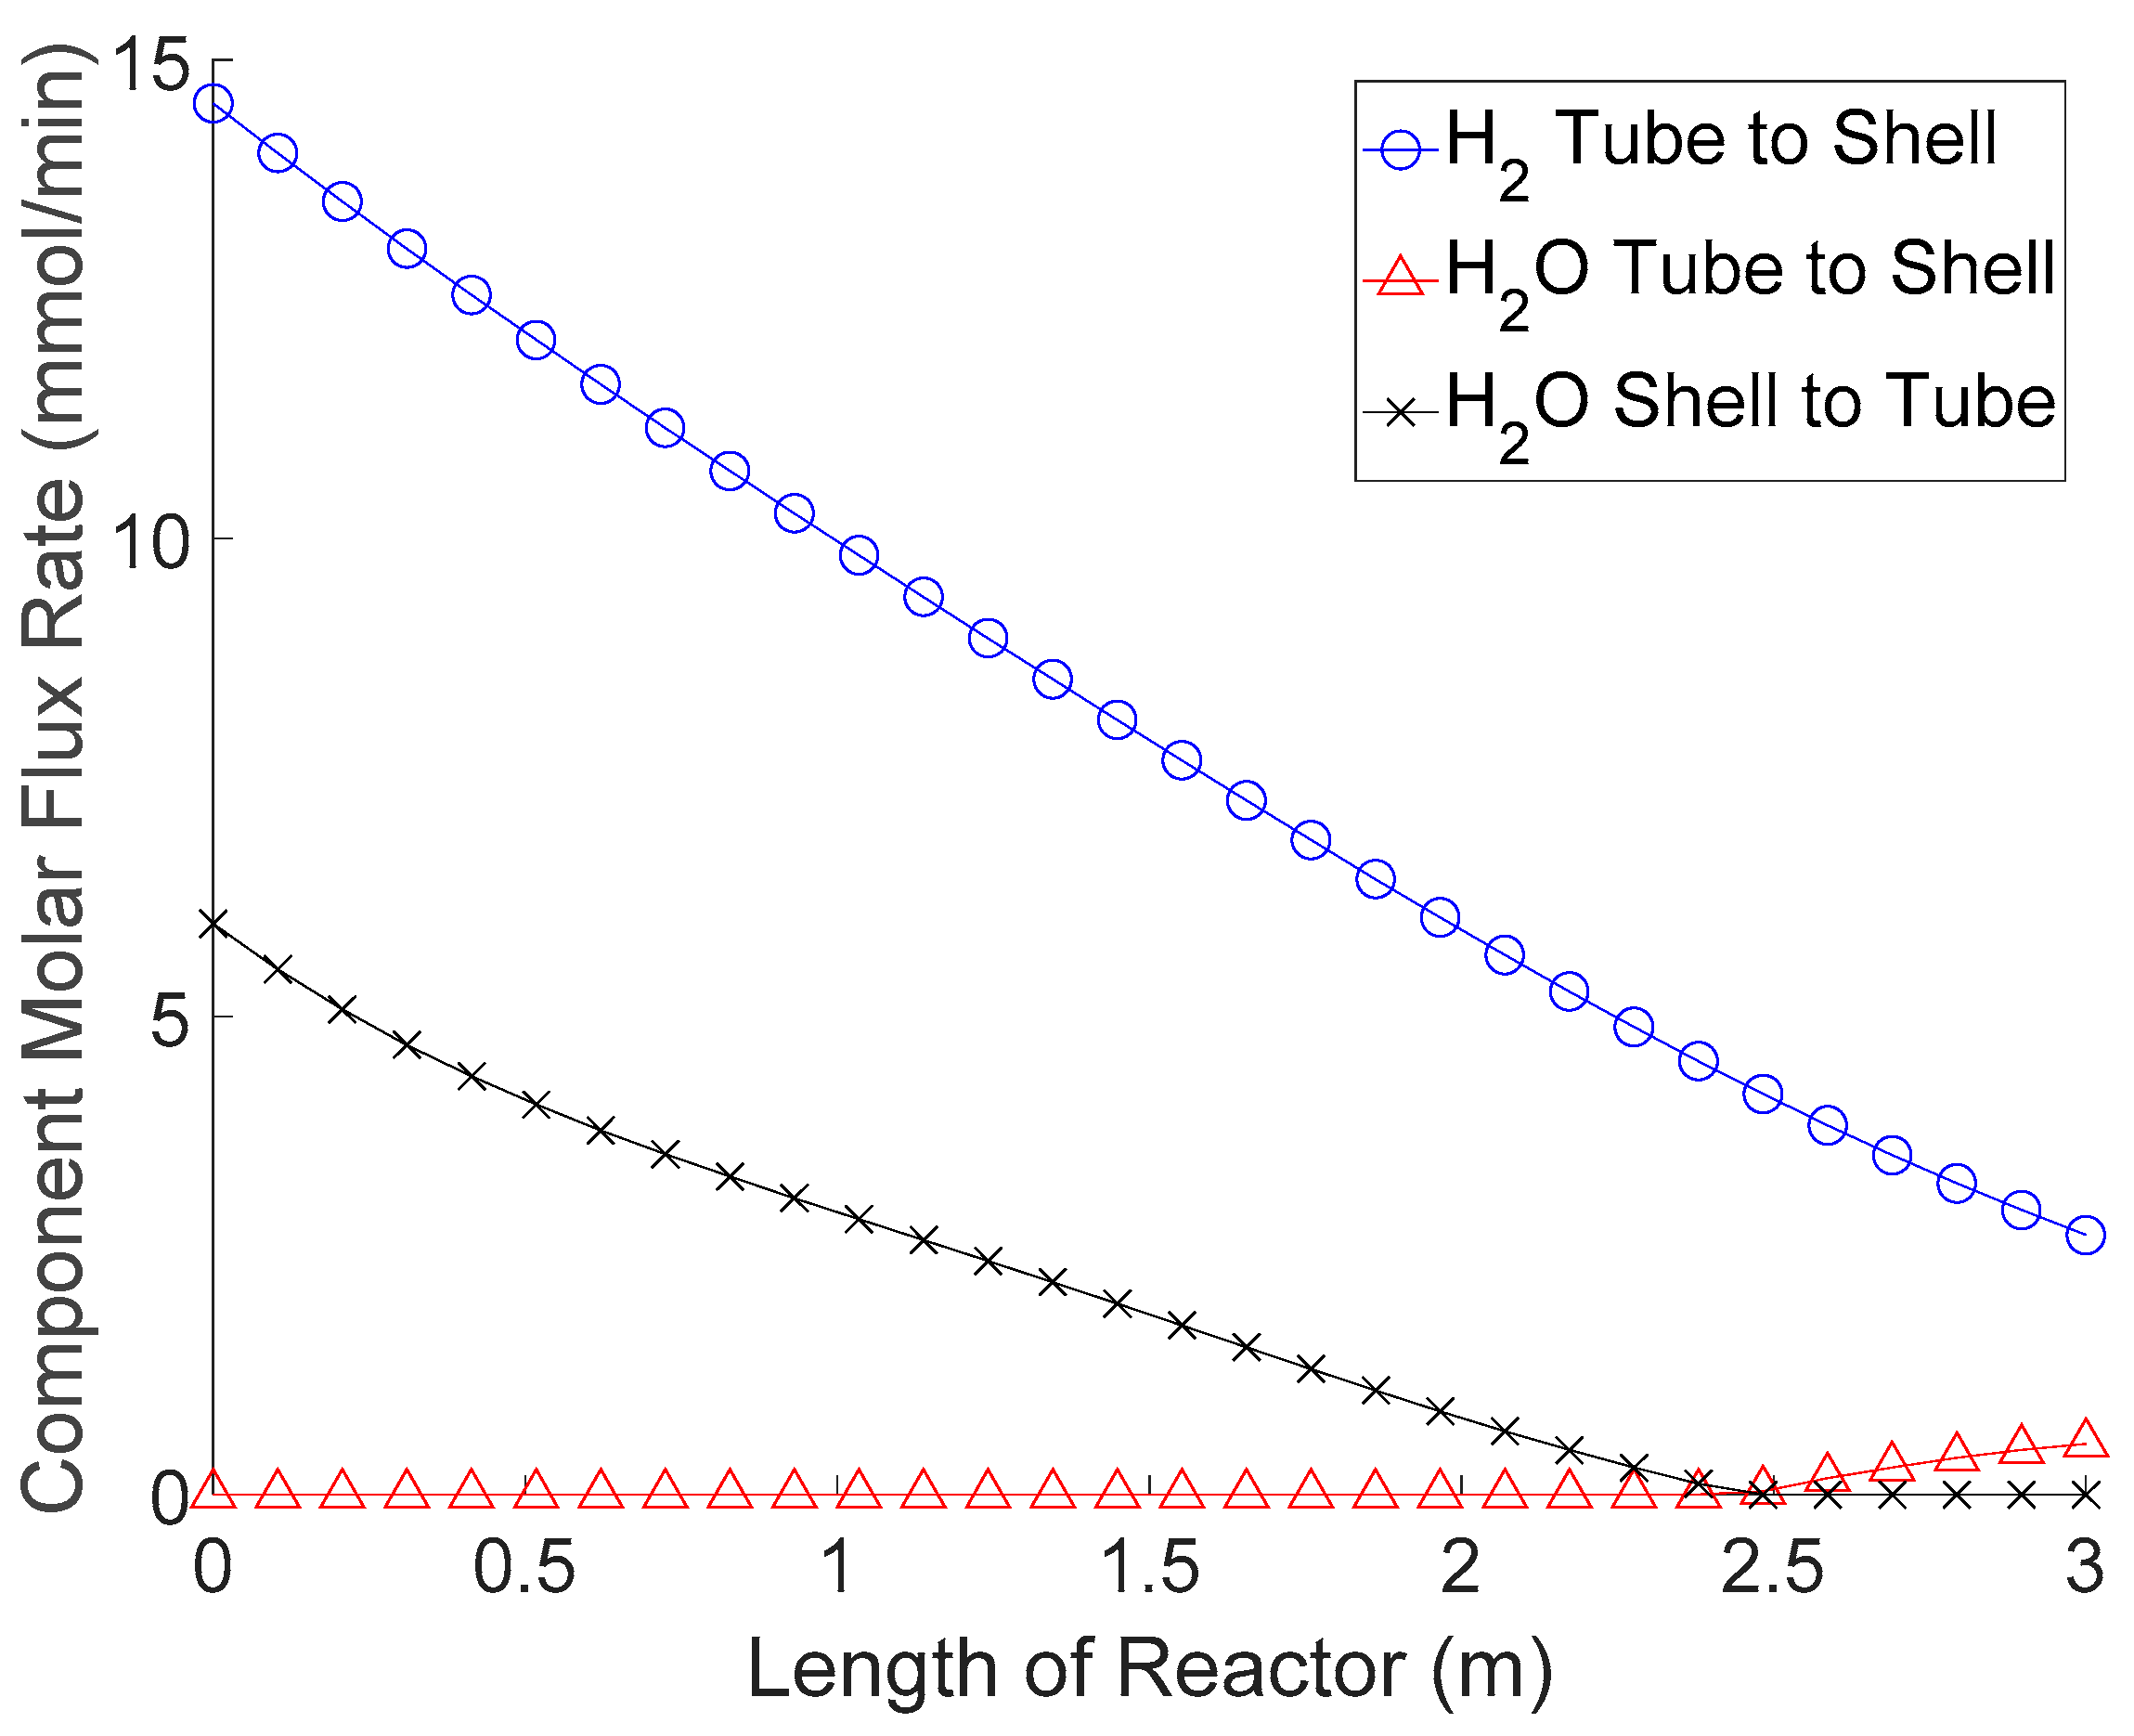
Figure 10 show what is happening at the extreme ends of the Pareto frontier. For the next simulation, the best compromise point is selected from the elbow of the Pareto front to see how the polymer membrane reactor can achieve both high H
2 recovery and CO
2 capture. The results of this simulation are shown in
Figure 11.
Unlike the simulation in
Figure 10a, the process did not hit an equilibrium point where all potential H
2 recovery is completed. This means that although CO
2 is still being lost to the shell side, H
2 is also being recovered. Another improvement is that the steam injection process is completed before reaching the end of the membrane reactor. Taking what was learned from
Figure 10b, this avoids hydrogen being formed at the end of the membrane reactor and not having space remaining to be captured. There are three lessons to be learned from this analysis; (i) steam injection appears to be beneficial at the beginning of the reactor; (ii) the end of the reactor should be primarily used for H
2 recovery; (iii) CO
2 continues to permeate out of the tube side at all points of the reactor (an undesired feature).
By further analyzing the Pareto frontier in
Figure 9, the polymer membrane reactor does not struggle to recover H
2 but seems to be limited in its ability to capture CO
2. Therefore, the goal should be to push the Pareto front upward by improving the CO
2 capture of the unit. However, as previously mentioned, there is no operational change that can achieve this improvement. Therefore, a design change must be proposed to improve the process in this direction.
3.3. Redesign of the Polymer Membrane Reactor
The first two points learned from the operability analysis above focus on improving H
2 recovery and should remain features of any new design decision. The third point deals with CO
2 permeating out of the tube side, reducing the CO
2 capture of the unit and should be the focus of the design change. CO
2 permeation is increased by an increase in sweep gas flow in the presence of the membrane. Because sweep gas flow is needed for the H
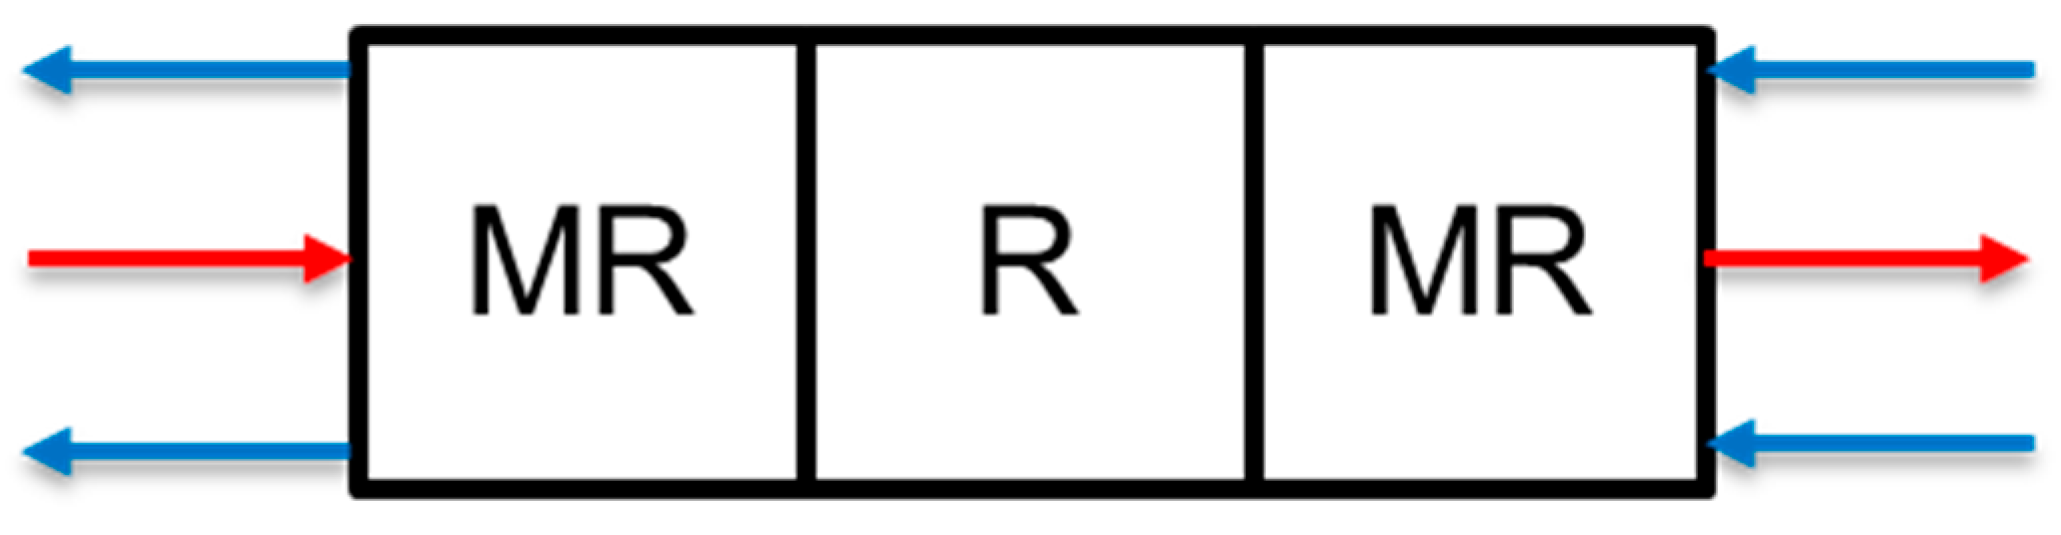
2 recovery to occur, one obvious choice is to strategically remove the polymer membrane from certain areas of the reactor. Because membrane is needed at the beginning of the membrane reactor for the steam injection and at the end for H
2 recovery, the only place left is to remove it from the center of the reactor. The proposed redesign to avoid the issue of unnecessary CO
2 permeation is shown in
Figure 12.
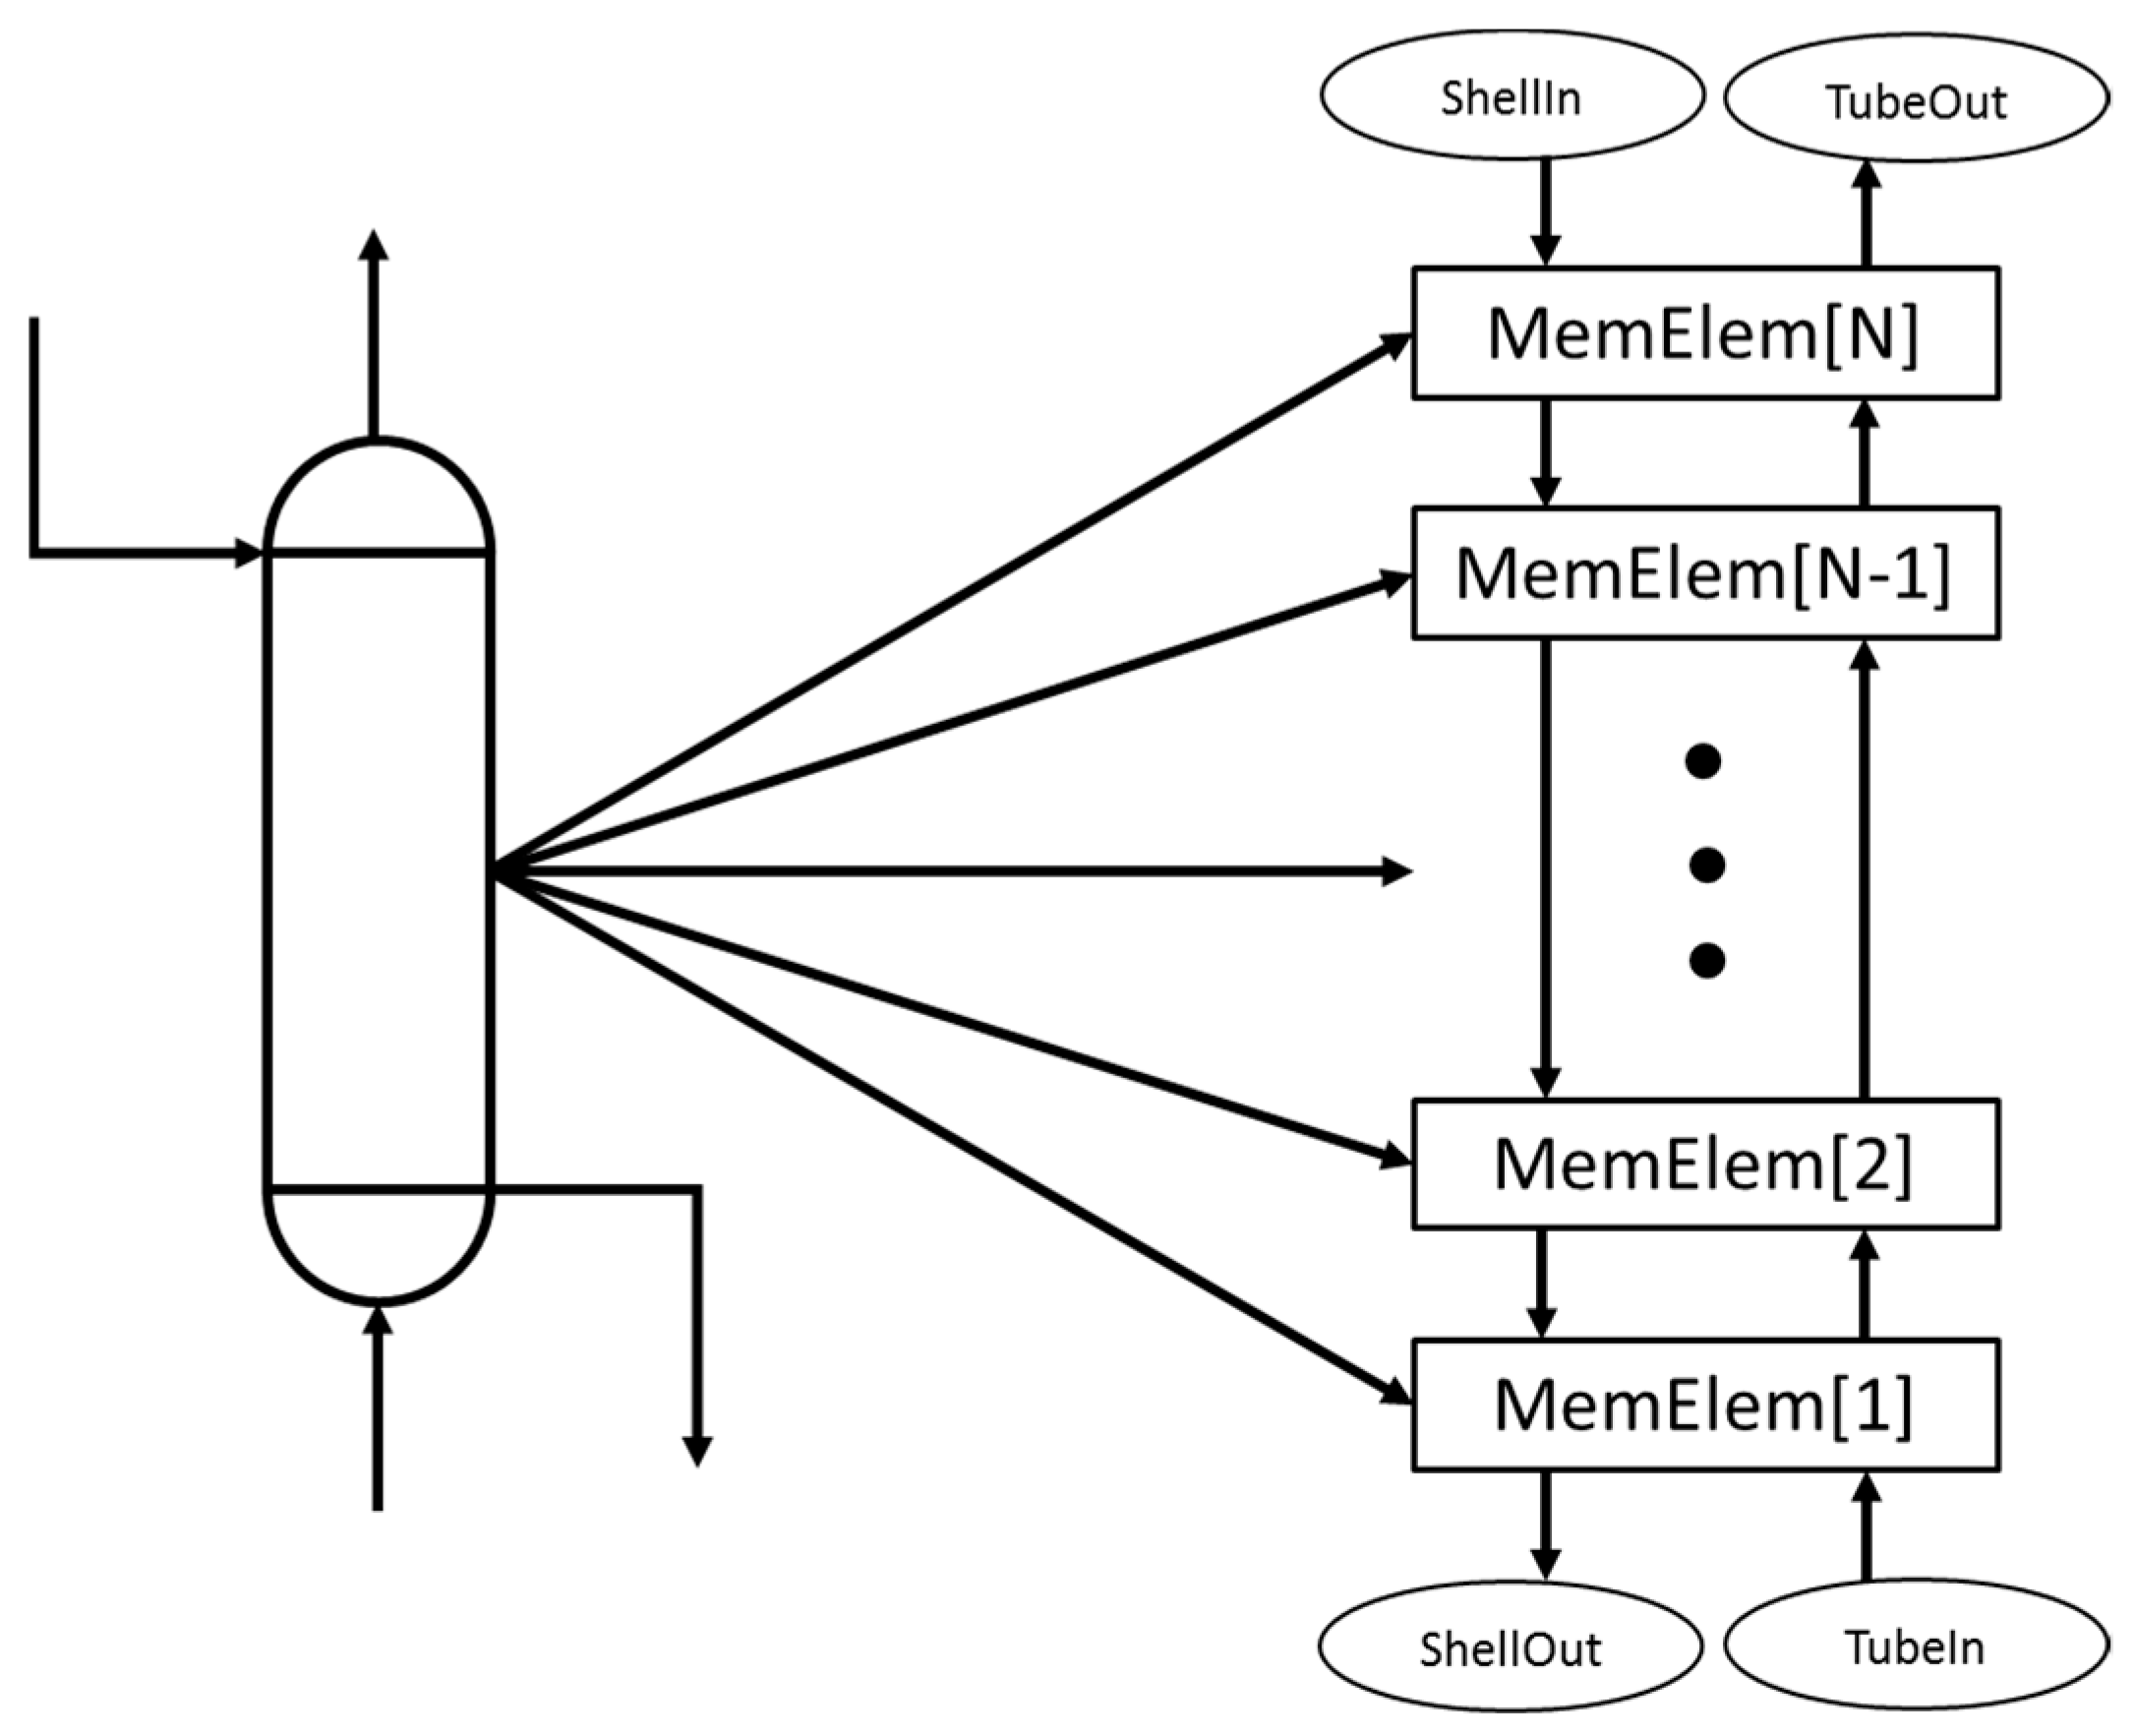
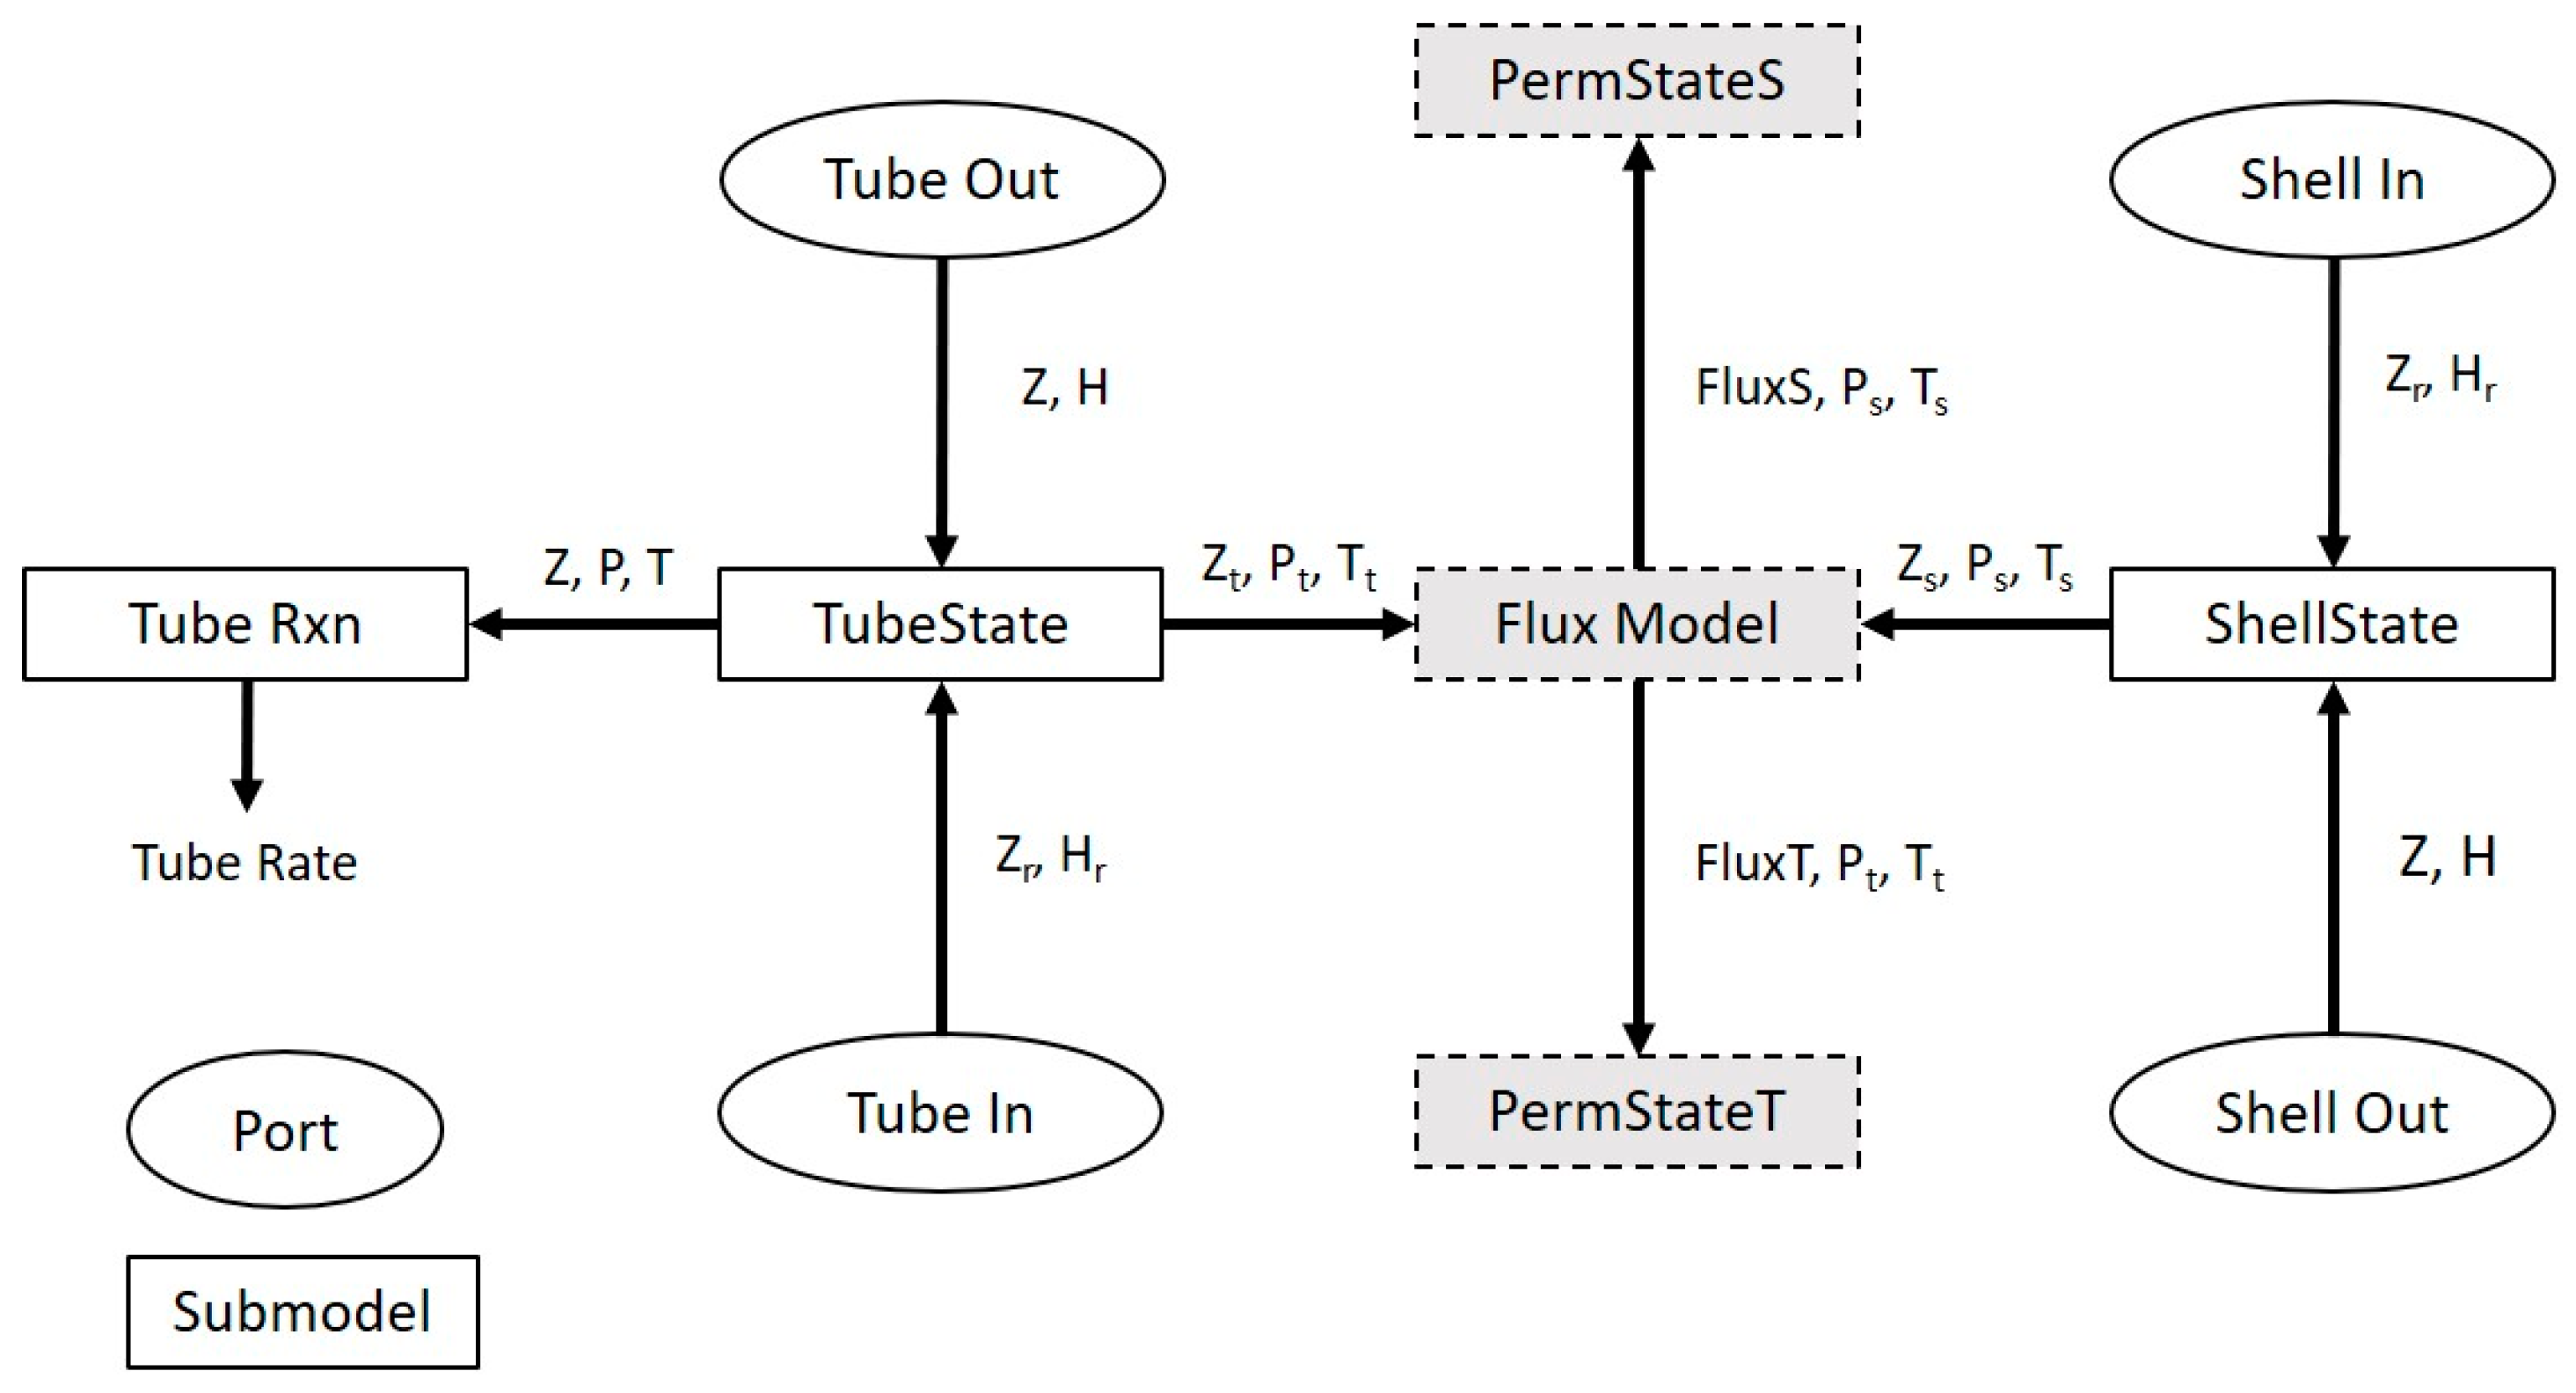
To simulate this redesign, the contact variables along with the block-based modeling approach described above can be used to allow for the removal of membrane without the need to reinitialize the model.
Figure 13 shows the block-diagram representation for the packed-bed reactor section of the unit.
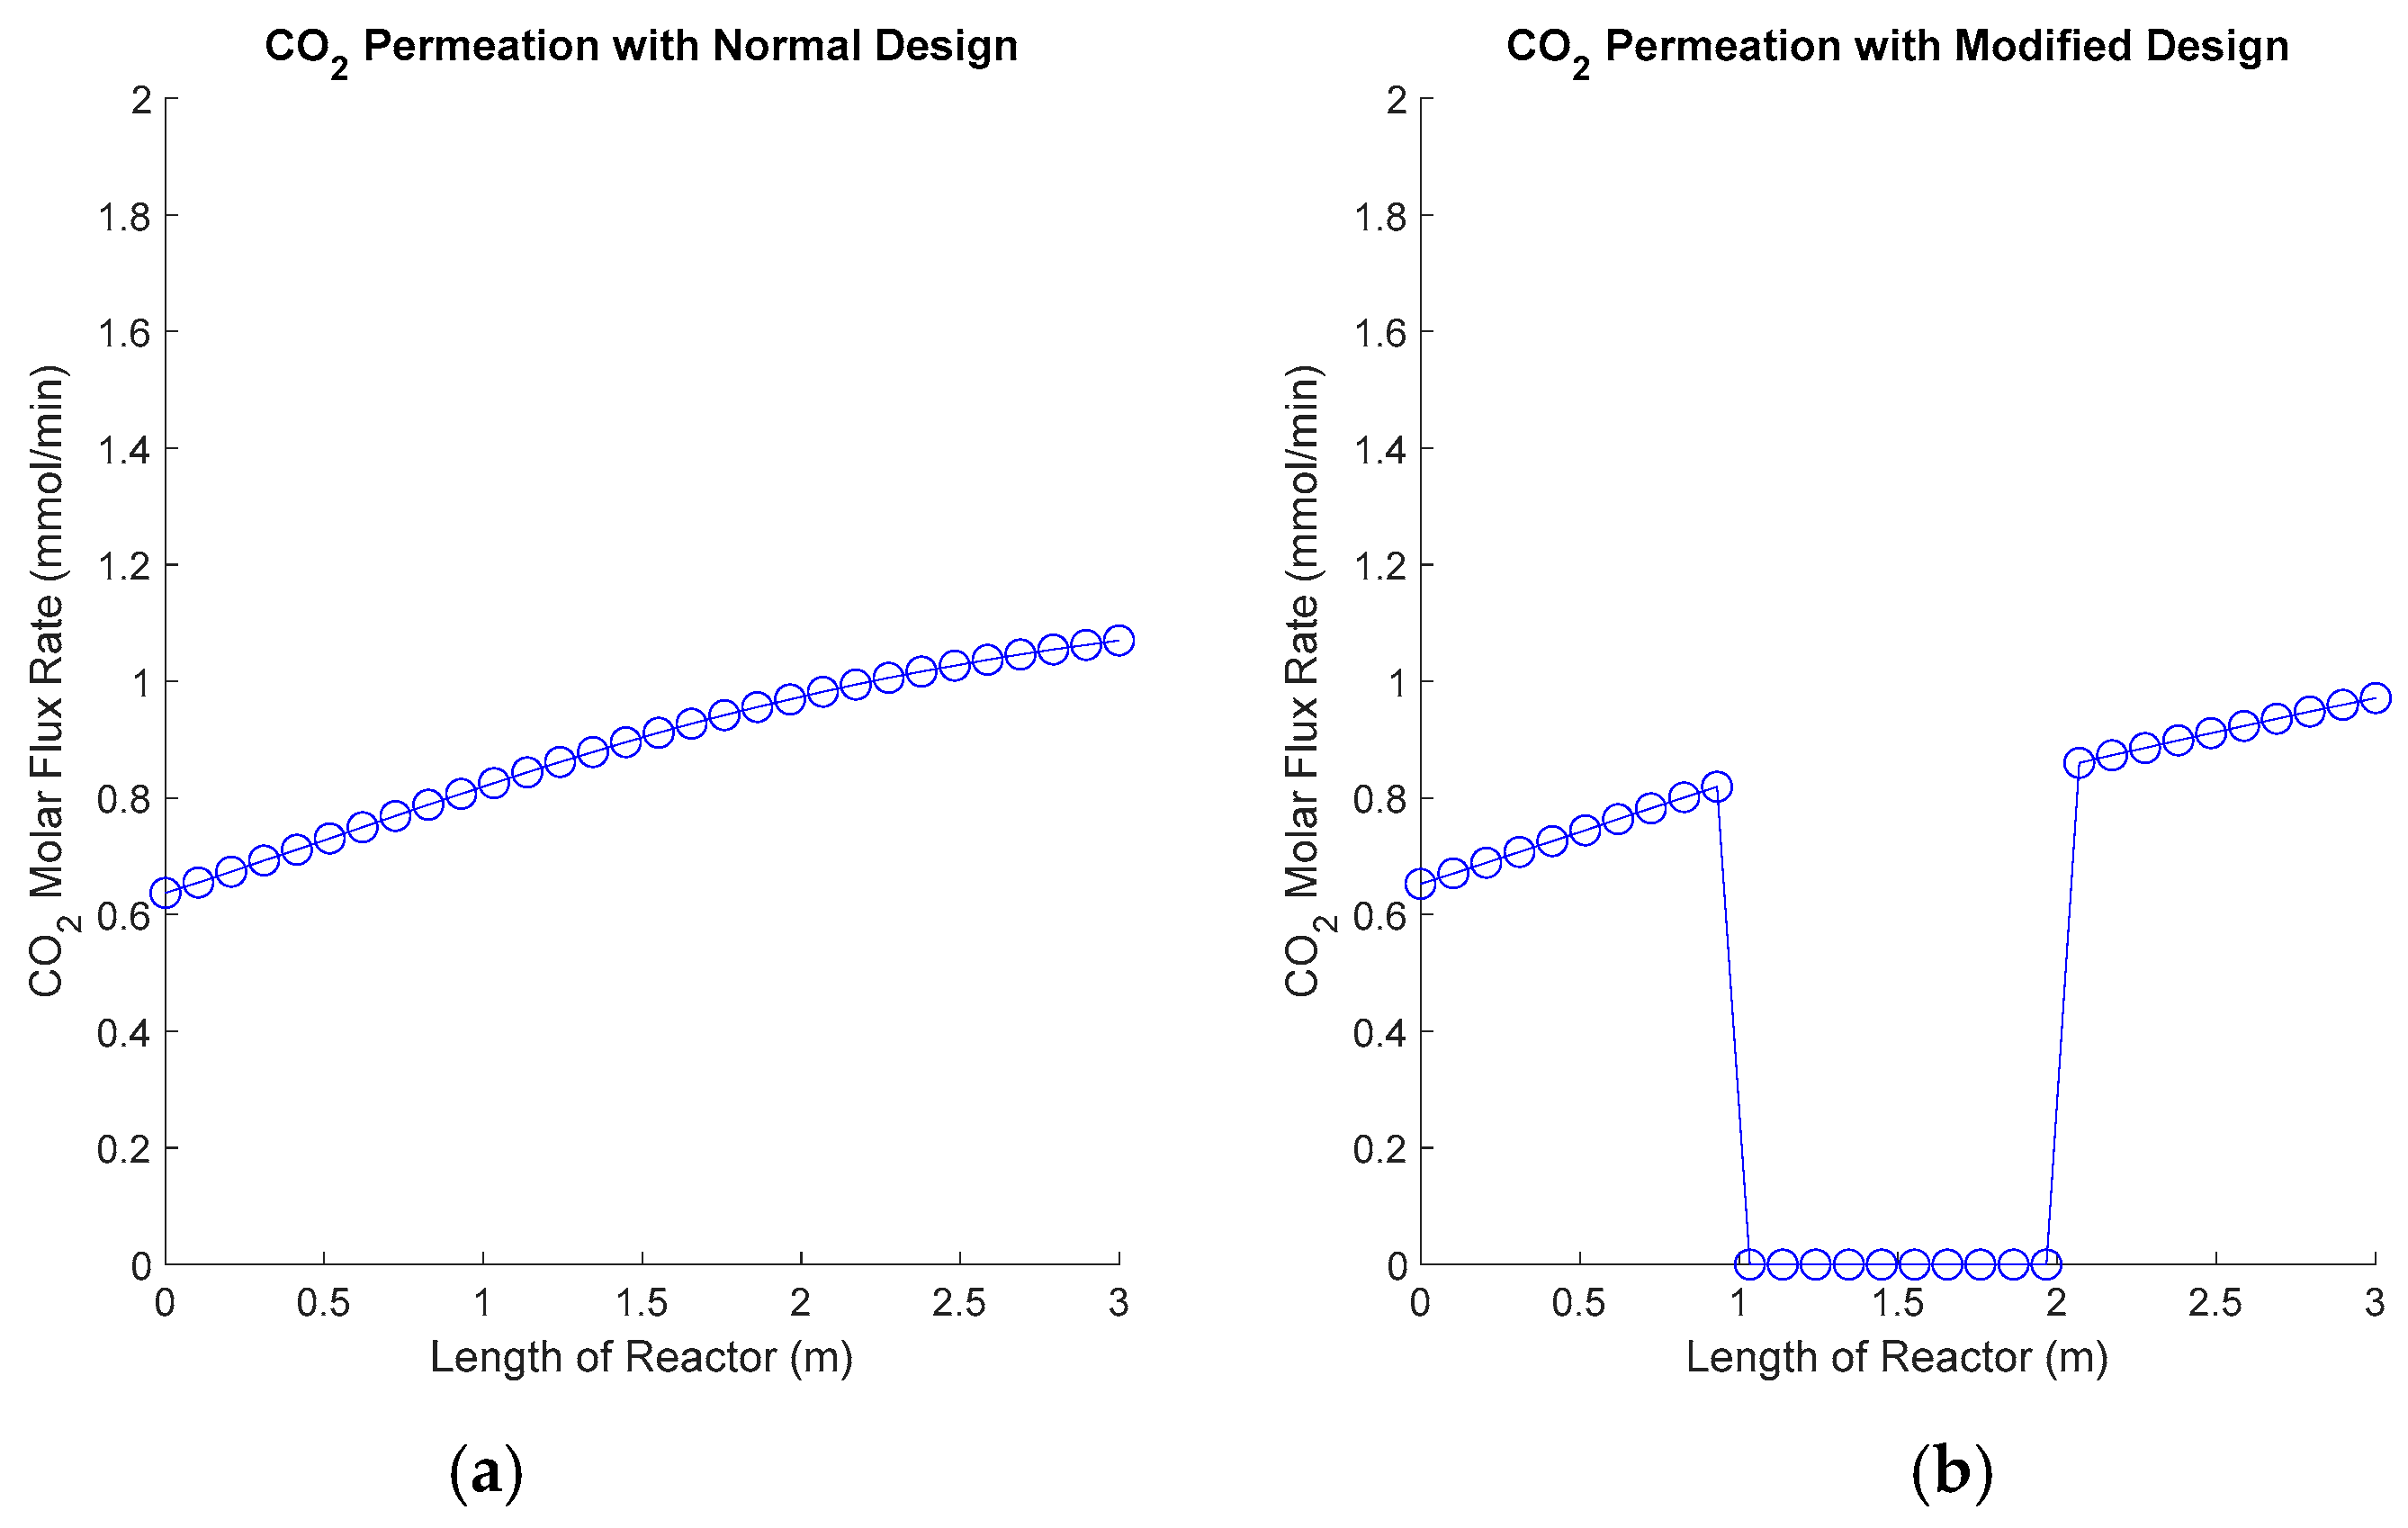
The input space from the original operability analysis is applied to this new design modeled and simulated in the AVEVA SimCentral Simulation Platform. An example, using the best compromise operating point along with the new design, produces the flux profiles found in
Figure 14.
For this new design, in
Figure 14, steam injection is still taking place in the beginning of the membrane reactor and is almost complete by the end of the reactor while H
2 is being recovered at the end of the membrane reactor as desired. Additionally, it is important to compare the flux of CO
2 in both designs (in
Figure 11 versus
Figure 14) with the desire for reducing the CO
2 lost to the shell side. This comparison is shown in
Figure 15.
By removing the polymer membrane from the center of the reactor, less CO
2 can permeate to the sweep gas, thus improving the capture percentage while maintaining a similar H
2 recovery. The Pareto analysis was conducted again on this new design and compared to the original design as shown in
Figure 16.
Note that not only this new design change pushes the maximum CO2 capture closer to 100%, it also increased the minimum possible CO2 capture from 5.8% to 38.1%. Moreover, this design potentially brings economic benefits, as the amount of membrane material required to achieve the outputs is reduced. This study shows that operability analyses can provide insights for improving the design of membrane reactors in terms of performance targets and/or cost.


