Next Issue
Volume 11, September
Previous Issue
Volume 11, July


ISPRS Int. J. Geo-Inf., Volume 11, Issue 8 (August 2022) – 43 articles

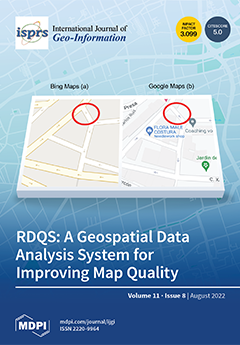
Cover Story (view full-size image): Digital maps are used daily by millions of users. Verifying the quality and consistency of route data is becoming more and more important. In this paper, we introduce a novel geospatial data analysis system that is based on road directionality. We investigate our Road Directionality Quality System (RDQS) using multiple map providers. Results from the experiments conducted show that our detection neural network can detect an arrow's position and direction in map images with >90% F1-Score. We then utilized this model to analyze map images in six different regions. Our findings show that our approach can reliably assess map quality and discover discrepancies in road directionality across different map providers. We report the percentage of discrepancies found between map providers using this approach in a proposed study area. View this paper
  • Issues are regarded as officially published after their release is announced to the table of contents alert mailing list.
  • You may sign up for e-mail alerts to receive table of contents of newly released issues.
  • PDF is the official format for papers published in both, html and pdf forms. To view the papers in pdf format, click on the "PDF Full-text" link, and use the free Adobe Reader to open them.
Order results
Result details
Select all
Export citation of selected articles as:
19 pages, 7063 KiB  
Article
Make It Simple: Effective Road Selection for Small-Scale Map Design Using Decision-Tree-Based Models
by Izabela Karsznia, Karolina Wereszczyńska and Robert Weibel
ISPRS Int. J. Geo-Inf. 2022, 11(8), 457; https://doi.org/10.3390/ijgi11080457 - 22 Aug 2022
Cited by 6 | Viewed by 2347
Abstract
The complexity of a road network must be reduced after a scale change, so that the legibility of the map can be maintained. However, deciding whether to show a particular road section on the map is a very complex process. This process, called [...] Read more.
The complexity of a road network must be reduced after a scale change, so that the legibility of the map can be maintained. However, deciding whether to show a particular road section on the map is a very complex process. This process, called selection, constitutes the first step in a sequence of further generalization operations and it is a prerequisite to effective road network generalization. So far, not many comprehensive solutions have been developed for effective road selection specifically at small scales as the studies have mainly dealt with large-scale maps. The paper presents an experiment using machine learning (ML), specifically decision-tree-based (DT) models, to optimize the selection of the roads from 1:250,000 to 1:500,000 and 1:1,000,000 scales. The scope of this research covers designing and verifying road selection models on the example of three selected districts in Poland. The aim is to consider the problem of road generalization holistically, including numerous semantic, geometric, topological, and statistical road characteristics. The research resulted in a list of measurable road attributes that comprehensively describe the rank of a particular road section. The outcome also includes attribute weights, attribute correlation calculated for roads, and machine learning models designed for automatic road network selection. The performance of the machine learning models is very high and ranges from 80.94% to 91.23% for the 1:500,000 target scale and 98.21% to 99.86% for the 1:1,000,000 scale. Full article
Show Figures

Figure 1

19 pages, 5761 KiB  
Article
Identification of Urban Agglomeration Spatial Range Based on Social and Remote-Sensing Data—For Evaluating Development Level of Urban Agglomeration
by Shuai Zhang and Hua Wei
ISPRS Int. J. Geo-Inf. 2022, 11(8), 456; https://doi.org/10.3390/ijgi11080456 - 21 Aug 2022
Cited by 6 | Viewed by 2790
Abstract
The accurate identification of urban agglomeration spatial area is helpful in understanding the internal spatial relationship under urban expansion and in evaluating the development level of urban agglomeration. Previous studies on the identification of spatial areas often ignore the functional distribution and development [...] Read more.
The accurate identification of urban agglomeration spatial area is helpful in understanding the internal spatial relationship under urban expansion and in evaluating the development level of urban agglomeration. Previous studies on the identification of spatial areas often ignore the functional distribution and development of urban agglomerations by only using nighttime light data (NTL). In this study, a new method is firstly proposed to identify the accurate spatial area of urban agglomerations by fusing night light data (NTL) and point of interest data (POI); then an object-oriented method is used by this study to identify the spatial area, finally the identification results obtained by different data are verified. The results show that the accuracy identified by NTL data is 82.90% with the Kappa coefficient of 0.6563, the accuracy identified by POI data is 81.90% with the Kappa coefficient of 0.6441, and the accuracy after data fusion is 90.70%, with the Kappa coefficient of 0.8123. The fusion of these two kinds of data has higher accuracy in identifying the spatial area of urban agglomeration, which can play a more important role in evaluating the development level of urban agglomeration; this study proposes a feasible method and path for urban agglomeration spatial area identification, which is not only helpful to optimize the spatial structure of urban agglomeration, but also to formulate the spatial development policy of urban agglomeration. Full article
(This article belongs to the Special Issue Urban Geospatial Analytics Based on Crowdsourced Data)
Show Figures

Figure 1

25 pages, 5702 KiB  
Article
Spatial Pattern and Formation Mechanism of Rural Tourism Resources in China: Evidence from 1470 National Leisure Villages
by Yuchen Xie, Xiangzhuang Meng, Jeremy Cenci and Jiazhen Zhang
ISPRS Int. J. Geo-Inf. 2022, 11(8), 455; https://doi.org/10.3390/ijgi11080455 - 20 Aug 2022
Cited by 32 | Viewed by 4392
Abstract
Rural tourism development has been an essential driving force behind China’s promotion of integrated urban–rural development, sustainable rural development and rural revitalization in the new era. This study included 1470 villages on the national list of beautiful leisure villages in China (BLVCs) from [...] Read more.
Rural tourism development has been an essential driving force behind China’s promotion of integrated urban–rural development, sustainable rural development and rural revitalization in the new era. This study included 1470 villages on the national list of beautiful leisure villages in China (BLVCs) from 2010 to 2021. We explored the distribution characteristics and influencing factors based on mathematical statistics and spatial analysis in ArcGIS to provide a theoretical reference for promoting the development of leisure village agriculture and rural tourism. The results show that the distribution of BLVC presents a clustered state, showing a distribution pattern of a dual core, seven centers and multiple scattered points. BLVCs are mainly distributed in areas with flat terrain and sufficient water resources, which are conducive to agricultural production and life. Having convenient transportation and rich tourism resources aids the promotion of rural tourism development. The resulting gap in regional development is balanced to some extent by government support. The research results provide a reference value for future rural spatial optimization and sustainable development. This paper summarizes the law of rural development and clarifies the factors influencing the development of rural tourism, and it provides the Chinese experience as a model for a rural renaissance empowered by rural tourism. Full article
Show Figures

Figure 1

19 pages, 4178 KiB  
Article
Discovering Spatio-Temporal Co-Occurrence Patterns of Crimes with Uncertain Occurrence Time
by Yuanfang Chen, Jiannan Cai and Min Deng
ISPRS Int. J. Geo-Inf. 2022, 11(8), 454; https://doi.org/10.3390/ijgi11080454 - 20 Aug 2022
Cited by 3 | Viewed by 1985
Abstract
The discovery of spatio-temporal co-occurrence patterns (STCPs) among multiple types of crimes whose events frequently co-occur in neighboring space and time is crucial to the joint prevention of crimes. However, the crime event occurrence time is often uncertain due to a lack of [...] Read more.
The discovery of spatio-temporal co-occurrence patterns (STCPs) among multiple types of crimes whose events frequently co-occur in neighboring space and time is crucial to the joint prevention of crimes. However, the crime event occurrence time is often uncertain due to a lack of witnesses. This occurrence time uncertainty further results in the uncertainty of the spatio-temporal neighborhood relationships and STCPs. Existing methods have mostly modeled the uncertainty of events under the independent and identically distributed assumption and utilized one-sided distance information to measure the distance between uncertain events. As a result, STCPs detected from a dataset with occurrence time uncertainty (USTCPs) are likely to be erroneously assessed. Therefore, this paper proposes a probabilistic-distance-based USTCP discovery method. First, the temporal probability density functions of crime events with uncertain occurrence times are estimated by considering the temporal dependence. Second, the spatio-temporal neighborhood relationships are constructed based on the spatial Euclidean distance and the proposed temporal probabilistic distance. Finally, the prevalent USTCPs are identified. Experimental comparisons performed on twelve types of crimes from X City Public Security Bureau in China demonstrate that the proposed method can more objectively express the occurrence time of crimes and more reliably identify USTCPs. Full article
Show Figures

Figure 1

19 pages, 4650 KiB  
Article
Modelling the Mobility Changes Caused by Perceived Risk and Policy Efficiency
by Sijin Wu, Susan Grant-Muller and Lili Yang
ISPRS Int. J. Geo-Inf. 2022, 11(8), 453; https://doi.org/10.3390/ijgi11080453 - 20 Aug 2022
Cited by 3 | Viewed by 2128
Abstract
In many countries, governments have implemented non-pharmaceutical techniques to limit COVID-19 transmission. Restricting human mobility is one of the most common interventions, including lockdown, travel restrictions, working from home, etc. However, due to the strong transmission ability of the virus variants, further rounds [...] Read more.
In many countries, governments have implemented non-pharmaceutical techniques to limit COVID-19 transmission. Restricting human mobility is one of the most common interventions, including lockdown, travel restrictions, working from home, etc. However, due to the strong transmission ability of the virus variants, further rounds of interventions, including a strict lockdown, are not considered as effective as expected. The paper aims to understand how the lockdown policy and pandemics changed human mobility in the real scenario. Here we focus on understanding the mobility changes caused by compliance with restrictions and risk perceptions, using a mobility index from the Google report during three strict lockdown periods in Leeds, the largest city in the county of West Yorkshire, England, from March 2020 to March 2021. The research uses time-varying z-scores and Principal Component Analysis (PCA) to simulate how local people dynamically process and perceive health risks based on multi-dimensional daily COVID-19 reports first. Further modelling highlights exponentially increasing policy non-compliance through the duration of lockdown, probably attributable to factors such as mental anxiety and economic pressures. Finally, the proposed nonlinear regression model examines the mobility changes caused by the population’s dynamic risk perceptions and lockdown duration. The case study model in Leeds shows a good fit to the empirical mobility data and indicates that the third lockdown policy took effect much slower than the first. At the same time, the negative impact of the epidemic on population mobility decayed by 40% in the third lockdown period in contrast with the first lockdown. The risk perception estimation methods could reflect that the local population became increasingly accustomed to the COVID-19 situation, and local people rationally evaluated the risks of COVID in the third lockdown period. The results demonstrate that simulated risk perceptions and policy decay could explain urban mobility behaviour during lockdown periods, which could be a reference for future decision-making processes. Full article
Show Figures

Figure 1

17 pages, 9691 KiB  
Article
Coupling a Physical Replica with a Digital Twin: A Comparison of Participatory Decision-Making Methods in an Urban Park Environment
by Junjie Luo, Pengyuan Liu and Lei Cao
ISPRS Int. J. Geo-Inf. 2022, 11(8), 452; https://doi.org/10.3390/ijgi11080452 - 19 Aug 2022
Cited by 18 | Viewed by 3702
Abstract
Public participation is crucial in promoting built environment quality. By using Nancuiping park in China as a case study, this research brings attention to the digital twin park compared to the physical replica in a participatory workshop. Using UAV oblique photography, we created [...] Read more.
Public participation is crucial in promoting built environment quality. By using Nancuiping park in China as a case study, this research brings attention to the digital twin park compared to the physical replica in a participatory workshop. Using UAV oblique photography, we created a digital twin model of this park and divided it into six layers to better manage and analyze the environment. Bracing the ‘bottom-up’ design philosophy, in the workshop, we analyzed existing issues in the park and simulated built environment changes, taking suggestions and comments from participants into account to support the decision-making of the park’s optimization. Our digital twin model and physical replica were assessed through a questionnaire in which 59 participants used 3 defined indicators: usability, interactivity, and scenario simulation and visualization quality. The results suggest that the physical replica is easier to use in the participatory design. However, the digital twin model can provide better interactivity and efficient scene simulation and visualization quality. The statistical analysis of the relationship between participants’ feedback on the two models and their sociodemographics (age, gender, and education background) shows that age is a barrier to promoting digital twins for older participants. Meanwhile, the digital twin’s highly interactive features and high-resolution visualization capability were attractive to the younger and well-educated participants. Our study indicates future directions to improve the urban digital twin by incorporating human feedback into the urban model, thus establishing a two-way interaction between the digital system, the physical environment, and human perceptions. Full article
Show Figures

Figure 1

24 pages, 5005 KiB  
Article
Assessing Multi-Temporal Global Urban Land-Cover Products Using Spatio-Temporal Stratified Sampling
by Yali Gong, Huan Xie, Yanmin Jin and Xiaohua Tong
ISPRS Int. J. Geo-Inf. 2022, 11(8), 451; https://doi.org/10.3390/ijgi11080451 - 19 Aug 2022
Viewed by 1818
Abstract
In recent years, the availability of multi-temporal global land-cover datasets has meant that they have become a key data source for evaluating land cover in many applications. Due to the high data volume of the multi-temporal land-cover datasets, probability sampling is an efficient [...] Read more.
In recent years, the availability of multi-temporal global land-cover datasets has meant that they have become a key data source for evaluating land cover in many applications. Due to the high data volume of the multi-temporal land-cover datasets, probability sampling is an efficient method for validating multi-temporal global urban land-cover maps. However, the current accuracy assessment methods often work for a single-epoch dataset, and they are not suitable for multi-temporal data products. Limitations such as repeated sampling and inappropriate sample allocation can lead to inaccurate evaluation results. In this study, we propose the use of spatio-temporal stratified sampling to assess thematic mappings with respect to the temporal changes and spatial clustering. The total number of samples in the two stages, i.e., map and pixel, was obtained by using a probability sampling model. Since the proportion of the area labeled as no change is large while that of the area labeled as change is small, an optimization algorithm for determining the sample sizes of the different strata is proposed by minimizing the sum of variance of the user’s accuracy, producer’s accuracy, and proportion of area for all strata. The experimental results show that the allocation of sample size by the proposed method results in the smallest bias in the estimated accuracy, compared with the conventional sample allocation, i.e., equal allocation and proportional allocation. The proposed method was applied to multi-temporal global urban land-cover maps from 2000 to 2010, with a time interval of 5 years. Due to the spatial aggregation characteristics, the local pivotal method (LPM) is adopted to realize spatially balanced sampling, leading to more representative samples for each stratum in the spatial domain. The main contribution of our research is the proposed spatio-temporal sampling approach and the accuracy assessment conducted for the multi-temporal global urban land-cover product. Full article
Show Figures

Figure 1

25 pages, 7298 KiB  
Article
House Price Valuation Model Based on Geographically Neural Network Weighted Regression: The Case Study of Shenzhen, China
by Zimo Wang, Yicheng Wang, Sensen Wu and Zhenhong Du
ISPRS Int. J. Geo-Inf. 2022, 11(8), 450; https://doi.org/10.3390/ijgi11080450 - 18 Aug 2022
Cited by 9 | Viewed by 3741
Abstract
Confronted with the spatial heterogeneity of the real estate market, some traditional research has utilized geographically weighted regression (GWR) to estimate house prices. However, its predictive power still has some room to improve, and its kernel function is limited in some simple forms. [...] Read more.
Confronted with the spatial heterogeneity of the real estate market, some traditional research has utilized geographically weighted regression (GWR) to estimate house prices. However, its predictive power still has some room to improve, and its kernel function is limited in some simple forms. Therefore, we propose a novel house price valuation model, which is combined with geographically neural network weighted regression (GNNWR) to improve the accuracy of real estate appraisal with the help of neural networks. Based on the Shenzhen house price dataset, this work conspicuously captures the variable spatial regression relationships at different regions of different variables, which GWR has difficulty realizing. Moreover, we focus on the performance of GNNWR, verify its robustness and superiority, and refine the experiment process with 10-fold cross-validation. In contrast with the ordinary least squares (OLS) model, our model achieves an improvement of about 50% on most of the metrics. Compared with the best GWR model, our thorough experiments reveal that our model improves the mean absolute error (MAE) by 13.5% and attains a decrease of the mean absolute percentage error (MAPE) by 13.0% in the evaluation on the validation dataset. It is a practical and powerful way to assess house prices, and we believe our model could be applied to other valuation problems concerning geographical data to promote the prediction accuracy of socioeconomic phenomena. Full article
Show Figures

Figure 1

23 pages, 3479 KiB  
Article
Measuring COVID-19 Vulnerability for Northeast Brazilian Municipalities: Social, Economic, and Demographic Factors Based on Multiple Criteria and Spatial Analysis
by Ciro José Jardim de Figueiredo, Caroline Maria de Miranda Mota, Kaliane Gabriele Dias de Araújo, Amanda Gadelha Ferreira Rosa and Arthur Pimentel Gomes de Souza
ISPRS Int. J. Geo-Inf. 2022, 11(8), 449; https://doi.org/10.3390/ijgi11080449 - 16 Aug 2022
Cited by 6 | Viewed by 2156
Abstract
COVID-19 has brought several harmful consequences to the world from many perspectives, including social, economic, and well-being in addition to health issues. However, these harmful consequences vary in intensity in different regions. Identifying which cities are most vulnerable to COVID-19 and understanding which [...] Read more.
COVID-19 has brought several harmful consequences to the world from many perspectives, including social, economic, and well-being in addition to health issues. However, these harmful consequences vary in intensity in different regions. Identifying which cities are most vulnerable to COVID-19 and understanding which variables could be associated with the advance of registered cases is a challenge. Therefore, this study explores and builds a spatial decision model to identify the characteristics of the cities that are most vulnerable to COVID-19, taking into account social, economic, demographic, and territorial aspects. Hence, 18 features were separated into the four groups mentioned. We employed a model joining the dominance-based rough set approach to aggregate the features (multiple criteria) and spatial analysis (Moran index, and Getis and Ord) to obtain final results. The results show that the most vulnerable places have characteristics with high population density and poor economic conditions. In addition, we conducted subsequent analysis to validate the results. The case was developed in the northeast region of Brazil. Full article
(This article belongs to the Collection Spatial Components of COVID-19 Pandemic)
Show Figures

Figure 1

20 pages, 2583 KiB  
Article
RDQS: A Geospatial Data Analysis System for Improving Roads Directionality Quality
by Abdulrahman Salama, Cordel Hampshire, Josh Lee, Adel Sabour, Jiawei Yao, Eyhab Al-Masri, Mohamed Ali, Harsh Govind, Ming Tan, Vashutosh Agrawal, Egor Maresov and Ravi Prakash
ISPRS Int. J. Geo-Inf. 2022, 11(8), 448; https://doi.org/10.3390/ijgi11080448 - 14 Aug 2022
Viewed by 2594
Abstract
With the increasing availability of smart devices, billions of users are currently relying on map services for many fundamental daily tasks such as obtaining directions and getting routes. It is becoming more and more important to verify the quality and consistency of route [...] Read more.
With the increasing availability of smart devices, billions of users are currently relying on map services for many fundamental daily tasks such as obtaining directions and getting routes. It is becoming more and more important to verify the quality and consistency of route data presented by different map providers. However, verifying this consistency manually is a very time-consuming task. To address this problem, in this paper we introduce a novel geospatial data analysis system that is based on road directionality. We investigate our Road Directionality Quality System (RDQS) using multiple map providers, including: Bing Maps, Google Maps, and OpenStreetMap. Results from the experiments conducted show that our detection neural network is able to detect an arrow’s position and direction in map images with >90% F1-Score across each of the different providers. We then utilize this model to analyze map images in six different regions. Our findings show that our approach can reliably assess map quality and discover discrepancies in road directionality across the different providers. We report the percentage of discrepancies found between map providers using this approach in a proposed study area. These results can help determine areas needs to be revised and prioritized to improve the overall quality of the data within maps. Full article
Show Figures

Figure 1

22 pages, 6050 KiB  
Article
Characterizing Production–Living–Ecological Space Evolution and Its Driving Factors: A Case Study of the Chaohu Lake Basin in China from 2000 to 2020
by Ruyi Zhang, Songnian Li, Baojing Wei and Xu Zhou
ISPRS Int. J. Geo-Inf. 2022, 11(8), 447; https://doi.org/10.3390/ijgi11080447 - 11 Aug 2022
Cited by 24 | Viewed by 2603
Abstract
The division of the territorial space functional area is the primary method to study the rational exploitation and use of land space. The research on the Production–Living–Ecological Space (PLES) change and its motivating factors has major implications for managing and optimizing spatial planning [...] Read more.
The division of the territorial space functional area is the primary method to study the rational exploitation and use of land space. The research on the Production–Living–Ecological Space (PLES) change and its motivating factors has major implications for managing and optimizing spatial planning and may open up a new research direction for inquiries into environmental change on a global scale. In this study, the transfer matrix and landscape pattern index methods were used to analyze the temporal changes as well as the evolution features of the landscape pattern of the PLES in the Chaohu Lake Basin from 2000 to 2020. Using principal component analysis and grey correlation analysis, the primary driving indicators of the spatial changes of the PLES in the Chaohu Lake Basin and the degree of the influence of various driving factors on various spatial types were determined. The study concluded with a few findings. First, from the standpoint of landscape structure, the Chaohu Lake Basin’s agricultural production space (APS) makes up more than 60% of the total area, and it and urban living space (ULS) are the two most visible spatial categories. Second, the pattern of the landscape demonstrates that the area used for agricultural production holds a significant advantage within the overall structure of the landscape. Although there is less connectedness between different landscape types, less landscape dominance, and more landscape fragmentation, the structure of different landscape types tends to be more varied. Third, the findings of the driving analysis demonstrate that the natural climate, population structure of agricultural development, and industrial structure of economic development are the three driving indicators of the change of the PLES. Finally, in order to promote the formation of a territorial space development pattern with intensive and efficient production space, appropriate living space, and beautiful ecological space, it is proposed to carry out land regulation according to natural factors, economic development, national policies, and other actual conditions. Full article
Show Figures

Figure 1

18 pages, 2349 KiB  
Article
Factors That Affect Spatial Data Sharing in Malaysia
by Qasim Hamakhurshid Hamamurad, Normal Mat Jusoh and Uznir Ujang
ISPRS Int. J. Geo-Inf. 2022, 11(8), 446; https://doi.org/10.3390/ijgi11080446 - 11 Aug 2022
Cited by 3 | Viewed by 3592
Abstract
This paper examines the phenomena of the local government’s inadequate reaction to the national programme of geographical infrastructure for the effective sharing of spatial data in Malaysia. We investigate the determinants of sharing data for Malaysia’s spatial data infrastructure (SDI) and aim to [...] Read more.
This paper examines the phenomena of the local government’s inadequate reaction to the national programme of geographical infrastructure for the effective sharing of spatial data in Malaysia. We investigate the determinants of sharing data for Malaysia’s spatial data infrastructure (SDI) and aim to define the model for spatial data-sharing of Malaysia’s local SDI. The main contribution of this paper is an explanation of the novel methodology to study factors that affect spatial data sharing including a new qualitative analysis method through an interview with people concerned in this field, including engineers, technicians and academics, which was undertaken in Kuala Lumpur, and a new methodology to identify the necessary approach that affects spatial data sharing. An interview and a questionnaire were used in this study as part of a sequential exploratory approach. Among land use, Plan Malaysia, and Telekom Malaysia Berhad TMOne, 15 participants were interviewed in-depth to obtain their responses, and 83 individuals took part in the survey questionnaires. Interview data were measured by content analysis, while questionnaire data were measured by partial least squares analysis. In the structural model analysis, Smart PLS was used to choose the fit items based on validity and reliability measurements. According to the hypothesis measurement, technology and organisation both significantly affect the practice of spatial data sharing, but human resources and spatial data do not significantly affect it. All R-Squared values represent a value above 56 per cent for the human resource aspect, technology aspect and spatial data aspect. However, the R-Square value for spatial data sharing is 47%. Spatial data and human resources have a less substantial impact on spatial data sharing; hence, this study proposes a national awareness programme and mentoring to improve local SDI support for spatial data sharing. Full article
Show Figures

Figure 1

25 pages, 6371 KiB  
Article
VHRShips: An Extensive Benchmark Dataset for Scalable Deep Learning-Based Ship Detection Applications
by Serdar Kızılkaya, Ugur Alganci and Elif Sertel
ISPRS Int. J. Geo-Inf. 2022, 11(8), 445; https://doi.org/10.3390/ijgi11080445 - 10 Aug 2022
Cited by 7 | Viewed by 5030
Abstract
The classification of maritime boats and ship targets using optical satellite imagery is a challenging subject. This research introduces a unique and rich ship dataset named Very High-Resolution Ships (VHRShips) from Google Earth images, which includes diverse ship types, different ship sizes, several [...] Read more.
The classification of maritime boats and ship targets using optical satellite imagery is a challenging subject. This research introduces a unique and rich ship dataset named Very High-Resolution Ships (VHRShips) from Google Earth images, which includes diverse ship types, different ship sizes, several inshore locations, and different data acquisition conditions to improve the scalability of ship detection and mapping applications. In addition, we proposed a deep learning-based multi-stage approach for ship type classification from very high resolution satellite images to evaluate the performance of the VHRShips dataset. Our “Hierarchical Design (HieD)” approach is an end-to-end structure that allows the optimization of the Detection, Localization, Recognition, and Identification (DLRI) stages, independently. We focused on sixteen parent ship classes for the DLR stages, and specifically considered eight child classes of the navy parent class at the identification stage. We used the Xception network in the DRI stages and implemented YOLOv4 for the localization stage. Individual optimization of each stage resulted in F1 scores of 99.17%, 94.20%, 84.08%, and 82.13% for detection, recognition, localization, and identification, respectively. The end-to-end implementation of our proposed approach resulted in F1 scores of 99.17%, 93.43%, 74.00%, and 57.05% for the same order. In comparison, end-to-end YOLOv4 yielded F1-scores of 99.17%, 86.59%, 68.87%, and 56.28% for DLRI, respectively. We achieved higher performance with HieD than YOLOv4 for localization, recognition, and identification stages, indicating the usability of the VHRShips dataset in different detection and classification models. In addition, the proposed method and dataset can be used as a benchmark for further studies to apply deep learning on large-scale geodata to boost GeoAI applications in the maritime domain. Full article
(This article belongs to the Special Issue Upscaling AI Solutions for Large Scale Mapping Applications)
Show Figures

Figure 1

2 pages, 1974 KiB  
Correction
Correction: Shi et al. Spatio-Temporal Variation Analysis of the Biological Boundary Temperature Index Based on Accumulated Temperature: A Case Study of the Yangtze River Basin. ISPRS Int. J. Geo-Inf. 2021, 10, 675
by Guangxun Shi, Peng Ye and Xianwu Yang
ISPRS Int. J. Geo-Inf. 2022, 11(8), 444; https://doi.org/10.3390/ijgi11080444 - 10 Aug 2022
Viewed by 1192
Abstract
The authors wish to make the following corrections to their paper [...] Full article
Show Figures

Figure 1

18 pages, 3478 KiB  
Article
Exploring the Impact of Floating Population with Different Household Registration on Theft
by Chong Xu, Xi Chen, Jianguo Chen and Debao Chen
ISPRS Int. J. Geo-Inf. 2022, 11(8), 443; https://doi.org/10.3390/ijgi11080443 - 7 Aug 2022
Cited by 4 | Viewed by 2981
Abstract
The floating population is frequently treated as a homogeneous whole to explore its impact on crime in numerous crime studies in China. However, there are different compositions within the floating population and significant differences in the effects on crime. In this study, the [...] Read more.
The floating population is frequently treated as a homogeneous whole to explore its impact on crime in numerous crime studies in China. However, there are different compositions within the floating population and significant differences in the effects on crime. In this study, the floating population was divided into three types based on household registration (i.e., Hukou): the floating population from other districts in the same city (FPFOD), the floating population from other cities in the same province (FPFOC) and the floating population from other provinces (FPFOP). The Moran index was used to analyze their spatial distribution patterns and aggregation, respectively, and several negative binomial regression models were constructed to explore the influence of different types of floating populations on theft. The results show that the three types of floating populations are mainly distributed in different urban areas, implying differences in their impact on theft. Among them, the proportion of the FPFOD shows insignificant negative correlation on theft, while the proportion of the FPFOC and the FPFOP present a significant positive correlation. Meanwhile, the proportion of the FPFOP creates a stronger effect on theft than the proportion of entire floating population. Overall, the model performs best when variables of the proportion of the FPFOC and the FPFOP are included. The research conclusions can provide a meaningful reference for precisely measuring the floating population in crime research. Full article
Show Figures

Figure 1

21 pages, 5691 KiB  
Article
Prediction of Urban Sprawl by Integrating Socioeconomic Factors in the Batticaloa Municipal Council, Sri Lanka
by Mathanraj Seevarethnam, Noradila Rusli and Gabriel Hoh Teck Ling
ISPRS Int. J. Geo-Inf. 2022, 11(8), 442; https://doi.org/10.3390/ijgi11080442 - 4 Aug 2022
Cited by 7 | Viewed by 3016
Abstract
Due to extensive population growth, urbanization increases urban development and sprawl in the world’s cities. Urban sprawl is a socioeconomic phenomenon that has not extensively incorporated socioeconomic factors in the prediction of most of the urban sprawl models. This study aimed to predict [...] Read more.
Due to extensive population growth, urbanization increases urban development and sprawl in the world’s cities. Urban sprawl is a socioeconomic phenomenon that has not extensively incorporated socioeconomic factors in the prediction of most of the urban sprawl models. This study aimed to predict the urban sprawl pattern in 2030 by integrating socioeconomic and biophysical factors. NDBI, Cramer’s V, logistic regression, and CA-Markov analyses were used to classify and predict built-up patterns. The built-up area is the dominant land use, which had a gradual growth from 1990 to 2020. A total of 20 socioeconomic and biophysical factors were identified as potentials in the municipality, affecting the urban sprawl. Policy regulation was the most attractive driver with a positive association, and land value had a high inverse association. Three prediction scenarios for urban sprawl were achieved for 2030. Higher sprawling growth is expected in scenario 3, compared with scenarios 1 and 2. Scenario 3 was simulated with biophysical and socioeconomic factors. This study aids in addressing urban sprawl at different spatial and temporal scales and helps urban planners and decision makers enhance the development strategies in the municipality. Predicted maps with different scenarios can support evaluating future sprawling growth and be used to develop sustainable planning for the city. Full article
Show Figures

Figure 1

18 pages, 3115 KiB  
Article
High-Precision Dynamic Traffic Noise Mapping Based on Road Surveillance Video
by Yanjie Sun, Mingguang Wu, Xiaoyan Liu and Liangchen Zhou
ISPRS Int. J. Geo-Inf. 2022, 11(8), 441; https://doi.org/10.3390/ijgi11080441 - 4 Aug 2022
Cited by 3 | Viewed by 2293
Abstract
High-precision dynamic traffic noise maps can describe the spatial and temporal distributions of noise and are necessary for actual noise prevention. Existing monitoring point-based methods suffer from limited spatial adaptability, and prediction model-based methods are limited by the requirements for traffic and environmental [...] Read more.
High-precision dynamic traffic noise maps can describe the spatial and temporal distributions of noise and are necessary for actual noise prevention. Existing monitoring point-based methods suffer from limited spatial adaptability, and prediction model-based methods are limited by the requirements for traffic and environmental parameter specifications. Road surveillance video data are effective for computing and analyzing dynamic traffic-related factors, such as traffic flow, vehicle speed and vehicle type, and environmental factors, such as road material, weather and vegetation. Here, we propose a road surveillance video-based method for high-precision dynamic traffic noise mapping. First, it identifies dynamic traffic elements and environmental elements from videos. Then, elements are converted from image coordinates to geographic coordinates by video calibration. Finally, we formalize a dynamic noise mapping model at the lane level. In an actual case analysis, the average error is 1.53 dBA. As surveillance video already has a high coverage rate in most cities, this method can be deployed to entire cities if needed. Full article
Show Figures

Figure 1

13 pages, 710 KiB  
Article
Using Attributes Explicitly Reflecting User Preference in a Self-Attention Network for Next POI Recommendation
by Ruijing Li, Jianzhong Guo, Chun Liu, Zheng Li and Shaoqing Zhang
ISPRS Int. J. Geo-Inf. 2022, 11(8), 440; https://doi.org/10.3390/ijgi11080440 - 4 Aug 2022
Cited by 1 | Viewed by 2246
Abstract
With the popularity of location-based social networks such as Weibo and Twitter, there are many records of points of interest (POIs) showing when and where people have visited certain locations. From these records, next POI recommendation suggests the next POI that a target [...] Read more.
With the popularity of location-based social networks such as Weibo and Twitter, there are many records of points of interest (POIs) showing when and where people have visited certain locations. From these records, next POI recommendation suggests the next POI that a target user might want to visit based on their check-in history and current spatio-temporal context. Current next POI recommendation methods mainly apply different deep learning models to capture user preferences by learning the nonlinear relations between POIs and user preference and pay little attention to mining or using the information that explicitly reflects user preference. In contrast, this paper proposes to utilize data that explicitly reflect user preference and include these data in a deep learning-based process to better capture user preference. Based on the self-attention network, this paper utilizes the attributes of the month of the check-ins and the categories of check-ins during this time, which indicate the periodicity of the user’s work and life and can reflect the habits of users. Moreover, considering that distance has a significant impact on a user’s decision of whether to visit a POI, we used a filter to remove candidate POIs that were more than a certain distance away when recommending the next POIs. We use check-in data from New York City (NYC) and Tokyo (TKY) as datasets, and experiments show that these improvements improve the recommended performance of the next POI. Compared with the state-of-the-art methods, the proposed method improved the recall rate by 7.32% on average. Full article
Show Figures

Figure 1

16 pages, 6414 KiB  
Article
Raster Map Line Element Extraction Method Based on Improved U-Net Network
by Wenjing Ran, Jiasheng Wang, Kun Yang, Ling Bai, Xun Rao, Zhe Zhao and Chunxiao Xu
ISPRS Int. J. Geo-Inf. 2022, 11(8), 439; https://doi.org/10.3390/ijgi11080439 - 3 Aug 2022
Viewed by 2251
Abstract
To address the problem of low accuracy in line element recognition of raster maps due to text and background interference, we propose a raster map line element recognition method based on an improved U-Net network model, combining the semantic segmentation algorithm of deep [...] Read more.
To address the problem of low accuracy in line element recognition of raster maps due to text and background interference, we propose a raster map line element recognition method based on an improved U-Net network model, combining the semantic segmentation algorithm of deep learning, the attention gates (AG) module, and the atrous spatial pyramid pooling (ASPP) module. In the proposed network model, the encoder extracts image features, the decoder restores the extracted features, the features of different scales are extracted in the dilated convolution module between the encoder and the decoder, and the attention mechanism module increases the weight of line elements. The comparison experiment was carried out through the constructed line element recognition dataset. The experimental results show that the improved U-Net network accuracy rate is 93.08%, the recall rate is 92.29%, the DSC accuracy is 93.03%, and the F1-score is 92.68%. In the network robustness test, under different signal-to-noise ratios (SNRs), comparing the improved network structure with the original network structure, the DSC improved by 13.18–17.05%. These results show that the network model proposed in this paper can effectively extract raster map line elements. Full article
Show Figures

Figure 1

15 pages, 735 KiB  
Review
Measure of Utilizing Space Database Information for Improvement of Efficient Disaster Management (Focusing on Nuclear Power Plant Accidents)
by Bomi Lee, Aetti Kang and Sungil Ham
ISPRS Int. J. Geo-Inf. 2022, 11(8), 438; https://doi.org/10.3390/ijgi11080438 - 2 Aug 2022
Cited by 1 | Viewed by 1839
Abstract
The damage caused by disasters is increasing worldwide, with hundreds of thousands of deaths due to the occurrence of complex large-scale disasters such as the 2010 Haiti earthquake and the 2004 Indian tsunami. South Korea has also experienced human casualties and damage to [...] Read more.
The damage caused by disasters is increasing worldwide, with hundreds of thousands of deaths due to the occurrence of complex large-scale disasters such as the 2010 Haiti earthquake and the 2004 Indian tsunami. South Korea has also experienced human casualties and damage to property caused by large-scale disasters in the past 10 years. Accordingly, a disaster-appropriate response measure is needed. Thus, we conducted this study to present a measure of utilizing spatial database and image information to improve the efficiency of disaster management that is operated based on the country’s existing national disaster management system. We present an efficient disaster response measure that differs from the existing collection-, reporting-, and propagation-oriented operating methods of disaster information through the use of spatial database and image-based information that can be combined with mandatory information with regard to nuclear power plant accidents. Thus, this study contributes to deriving a system that could collect and provide information rapidly at the time of disaster by defining the attribute and spatial information required at the time of disaster during nuclear power plant accidents and by deriving available systems and providing institutions. Full article
Show Figures

Figure 1

25 pages, 8402 KiB  
Article
Integrating Post-Processing Kinematic (PPK)–Structure-from-Motion (SfM) with Unmanned Aerial Vehicle (UAV) Photogrammetry and Digital Field Mapping for Structural Geological Analysis
by Daniele Cirillo, Francesca Cerritelli, Silvano Agostini, Simone Bello, Giusy Lavecchia and Francesco Brozzetti
ISPRS Int. J. Geo-Inf. 2022, 11(8), 437; https://doi.org/10.3390/ijgi11080437 - 2 Aug 2022
Cited by 24 | Viewed by 4185
Abstract
We studied some exposures of the Roccacaramanico Conglomerate (RCC), a calcareous-clastic mega-bed intercalated within the Late Messinian–Early Pliocene pelitic succession of the La Queglia and Maiella tectonic units (central Apennines). The outcrops, localized in the overturned limb of a kilometric-scale syncline, show a [...] Read more.
We studied some exposures of the Roccacaramanico Conglomerate (RCC), a calcareous-clastic mega-bed intercalated within the Late Messinian–Early Pliocene pelitic succession of the La Queglia and Maiella tectonic units (central Apennines). The outcrops, localized in the overturned limb of a kilometric-scale syncline, show a complex array of fractures, including multiple systems of closely spaced cleavages, joints, and mesoscopic faults, which record the progressive deformation associated with the Late Pliocene thrusting. Due to the extent of the investigated sites and a large amount of data to collect, we applied a multi-methodology survey technique integrating unmanned aerial vehicle (UAV) technologies and digital mapping in the field. We reconstructed the 3D digital outcrop model of the RCC in the type area and defined the 3D pattern of fractures and their time–space relationships. The field survey played a pivotal role in determining the various sets of structures, their kinematics, the associated displacements, and relative chronology. The results unveiled the investigated area’s tectonic evolution and provide a deformation model that could be generalized in similar tectonic contexts. Furthermore, the methodology allows for evaluating the reliability of the applied remote survey techniques (i.e., using UAV) compared to those based on the direct measurements of structures using classic devices. Our purpose was to demonstrate that our multi-methodology approach can describe the tectonic evolution of the study area, providing consistent 3D data and using a few ground control points. Finally, we propose two alternative working methods and discuss their different fields of application. Full article
Show Figures

Figure 1

15 pages, 3686 KiB  
Article
Improving the Spatial Accessibility of Community-Level Healthcare Service toward the ‘15-Minute City’ Goal in China
by Genxin Song, Xinxin He, Yunfeng Kong, Ke Li, Hongquan Song, Shiyan Zhai and Jingjing Luo
ISPRS Int. J. Geo-Inf. 2022, 11(8), 436; https://doi.org/10.3390/ijgi11080436 - 1 Aug 2022
Cited by 23 | Viewed by 3830
Abstract
Background: The recent global COVID-19 pandemic serves as another reminder that people in different urban neighborhoods need equal access to basic medical services. This study aims to improve the spatial accessibility of healthcare services toward the ‘15-minute city’ goal. Methods: We chose Zhengzhou, [...] Read more.
Background: The recent global COVID-19 pandemic serves as another reminder that people in different urban neighborhoods need equal access to basic medical services. This study aims to improve the spatial accessibility of healthcare services toward the ‘15-minute city’ goal. Methods: We chose Zhengzhou, China, as a case study. To improve spatial accessibility, two optimization models of optimal supply-demand allocation (OSD) and the capacitated p-medina problem (CPMP) were used. Spatial accessibility in this study is defined as the walking time from the communities to healthcare centers. Results: For the current status of healthcare services at the community level, the mean travel time is 18.3 min, and 39.6% of residents can access healthcare services within a 15-minute travel time. Population coverage within a 15-minute walking time is significantly lower than the national target of 80%. After redefining the service areas through OSD allocation, the mean travel time was reduced to 16.5 min, and 45.1% of the population could reach services. Furthermore, the 60 newly proposed healthcare centers selected by the CPMP model could potentially increase by 35.0% additional population coverage. The average travel time was reduced to 10 min. Conclusions: Both the redefinition of the service areas and the opening of new service centers are effective ways to improve the spatial accessibility of healthcare services. Two methods of this study have implications for urban planning practices towards the 15-minute city. Full article
Show Figures

Figure 1

20 pages, 6465 KiB  
Article
Identification of Urban Functional Zones Based on the Spatial Specificity of Online Car-Hailing Traffic Cycle
by Zhicheng Deng, Xiangting You, Zhaoyang Shi, Hong Gao, Xu Hu, Zhaoyuan Yu and Linwang Yuan
ISPRS Int. J. Geo-Inf. 2022, 11(8), 435; https://doi.org/10.3390/ijgi11080435 - 1 Aug 2022
Cited by 6 | Viewed by 2567
Abstract
The study of urban functional zoning is not only important for analyzing urban spatial structure but also for optimizing urban management and promoting scientific urban planning. Different areas undertaking different urban functions correspond to different traffic patterns and specific cycles. Here, a method [...] Read more.
The study of urban functional zoning is not only important for analyzing urban spatial structure but also for optimizing urban management and promoting scientific urban planning. Different areas undertaking different urban functions correspond to different traffic patterns and specific cycles. Here, a method named Urban Functional Zoning based on the Spatial Specificity (UFZ-SS) is proposed. The core of this method is to obtain urban spatial zoning through the specific cycles of traffic flows. First, UFZ-SS uses the Ensemble Empirical Modal Decomposition (EEMD) method to extract the specific periodic signal characteristics of traffic flows. Second, UFZ-SS calculates the contribution of online car-hailing traffic of different cycles in each zone. Then, the Gaussian Mixture Model (GMM) is utilized to classify all spatial zones into different spatial partitions based on the contribution of each periodic signal. Finally, this study validates UFZ-SS with the online car-hailing traffic volume in northeast Chengdu, China. The results show that the periodic characteristics of traffic can be effectively extracted and analyzed by the EEMD method, and highly distinct and accurate urban spatial partitioning results can be derived by spatial clustering based on the measures of specific cycles. Moreover, with the assistance of Point of Interest (POI) data, we verify the functional zones and structural patterns, which further demonstrates the validity and rationality of urban functional zones identified by UFZ-SS. This study provides a new potential perspective for the identification of urban functional zones, which may lead to a better understanding of the urban spatial structure and even urban planning. Full article
Show Figures

Figure 1

22 pages, 3740 KiB  
Article
Optimal Routing of Wide Multi-Modal Energy and Infrastructure Corridors
by Mehdi Salamati, Xin Wang, Jennifer Winter and Hamidreza Zareipour
ISPRS Int. J. Geo-Inf. 2022, 11(8), 434; https://doi.org/10.3390/ijgi11080434 - 1 Aug 2022
Viewed by 2143
Abstract
A multi-modal corridor accommodates multiple modes of energy and transportation infrastructure within the same right-of-way. The existing literature on corridor routing in raster space often focuses on one mode with no consideration of the width. This is not a realistic assumption, especially if [...] Read more.
A multi-modal corridor accommodates multiple modes of energy and transportation infrastructure within the same right-of-way. The existing literature on corridor routing in raster space often focuses on one mode with no consideration of the width. This is not a realistic assumption, especially if multiple modes are to co-exist within the same wide right-of-way. Moreover, newer routing methods that consider corridor width cannot take into account multi-modality and the arrangement of modes within a corridor. We developed two multi-modal wide-corridor routing methods using raster data. In the first method, the cost rasters of all modes are weighted and aggregated into a single composite on which a wide LCP is found. This wide LCP is then divided among the modes based on the desired arrangement. The second method uses a directed transformed graph in which the weight of each edge is calculated using different layers of cost data based on the edge direction, the desired widths and arrangement of the modes. Comparative analyses using synthetic datasets show the superior performance of the second proposed method in finding a muti-modal corridor in comparison with the first mode, and in finding a single-modal corridor when compared to the existing methods. Full article
Show Figures

Figure 1

22 pages, 10033 KiB  
Article
Effects of Climate Change on Corn Yields: Spatiotemporal Evidence from Geographically and Temporally Weighted Regression Model
by Bing Yang, Sensen Wu and Zhen Yan
ISPRS Int. J. Geo-Inf. 2022, 11(8), 433; https://doi.org/10.3390/ijgi11080433 - 1 Aug 2022
Cited by 4 | Viewed by 2723
Abstract
Food security has been one of the greatest global concerns facing the current complicated situation. Among these, the impact of climate change on agricultural production is dynamic over time and space, making it a major challenge to food security. Taking the U.S. Corn [...] Read more.
Food security has been one of the greatest global concerns facing the current complicated situation. Among these, the impact of climate change on agricultural production is dynamic over time and space, making it a major challenge to food security. Taking the U.S. Corn Belt as an example, we introduce a geographically and temporally weighted regression (GTWR) model that can handle both temporal and spatial non-stationarity in the relationship between corn yield and meteorological variables. With a high fitting performance (adjusted R2 at 0.79), the GTWR model generates spatiotemporally varying coefficients to effectively capture the spatiotemporal heterogeneity without requiring completion of the unbalanced data. This model makes it possible to retain original data to the maximum possible extent and to estimate the results more reliably and realistically. Our regression results showed that climate change had a positive effect on corn yield over the past 40 years, from 1981 to 2020, with temperature having a stronger effect than precipitation. Furthermore, a fuzzy c-means algorithm was used to cluster regions based on spatiotemporally changing trends. We found that the production potential of regions at high latitudes was higher than that of regions at low latitudes, suggesting that the center of productive regions may migrate northward in the future. Full article
Show Figures

Figure 1

18 pages, 4074 KiB  
Article
Visualization and Analysis of Transport Accessibility Changes Based on Time Cartograms
by Lina Wang, Xiang Li, Linfang Ding, Xinkai Yu and Tao Hu
ISPRS Int. J. Geo-Inf. 2022, 11(8), 432; https://doi.org/10.3390/ijgi11080432 - 1 Aug 2022
Cited by 1 | Viewed by 2119
Abstract
Visualization of the spatial distribution pattern of transport accessibility and its changes can be crucial for understanding and assessing the performance of transportation systems. Compared to traditional maps representing geographic space, time cartograms modify geographic locations and spatial relationships to suit travelling times [...] Read more.
Visualization of the spatial distribution pattern of transport accessibility and its changes can be crucial for understanding and assessing the performance of transportation systems. Compared to traditional maps representing geographic space, time cartograms modify geographic locations and spatial relationships to suit travelling times and thereby emphasize time–distance relationships in time-space. This study aims to facilitate a better understanding of the evolution of the spatial distribution pattern of accessibility by presenting a novel visualization and analysis methodology based on time cartograms. This is achieved by combining a visual qualitative display with a quantitative indicator analysis from multiple perspectives to show transport accessibility changes. Two indicators, namely, the shortest railway travel time (STRT) and spatiotemporal con-version parameter (STCP), are proposed to measure accessibility changes. Our work consists of the construction of time cartograms, the analysis of indicators, and the use of multiple views to show changes in transportation accessibility from multiple perspectives. The methodology is applied on the railway data of Beijing and selected 226 cities in China and to analyze changes in railway accessibility in 1996, 2003, 2009 and 2016. The results show that the development of transportation technology has continuously shortened the travel time, the time-space is gradually compressed, However, the difference in transport accessibility is getting bigger and bigger because of the uneven transportation development speeds between the regions. Full article
Show Figures

Figure 1

21 pages, 4268 KiB  
Article
Uncovering Factors Affecting Taxi Income from GPS Traces at the Directional Road Segment Level
by Shuxin Jin, Zhouhao Wu, Tong Shen, Di Wang and Ming Cai
ISPRS Int. J. Geo-Inf. 2022, 11(8), 431; https://doi.org/10.3390/ijgi11080431 - 31 Jul 2022
Viewed by 2862
Abstract
Nowadays, the market demand for taxis is still intense. However, there exist lots of issues affecting the healthy development of the taxi industry, such as an increasing difficulty in hailing taxis, detouring behavior etc., and especially, the low incomes of taxi drivers. This [...] Read more.
Nowadays, the market demand for taxis is still intense. However, there exist lots of issues affecting the healthy development of the taxi industry, such as an increasing difficulty in hailing taxis, detouring behavior etc., and especially, the low incomes of taxi drivers. This paper establishes a multi-layer road index (MRI) system of 7862 directional road segments (DRSs), and collects over 194 million occupied GPS points within a week, revealing the factors affecting taxi drivers’ incomes in Shenzhen, China. The income differences has been identified on different DRSs, which accordingly have been categorized into two levels. Four categories of DRS factors, i.e., road attributes, traffic dynamics, points of interest (POIs), and taxi operation strategies, are defined as the impact factors affecting income levels. The selected sample-based binomial logit (SBL) model has been proposed to reveal the significance of these influencing factors. The results indicate that the road segments with different features have different incomes over different time periods. The main factors in income analysis are the factors used to represent taxi operation strategies. Highly rewarding pick-up road segments can be identified, which could contribute to drivers’ income improvements, and can further contribute to the development of the taxi market. Full article
Show Figures

Figure 1

19 pages, 8613 KiB  
Article
Adaptive Geometric Interval Classifier
by Shuang Li and Jie Shan
ISPRS Int. J. Geo-Inf. 2022, 11(8), 430; https://doi.org/10.3390/ijgi11080430 - 31 Jul 2022
Cited by 4 | Viewed by 3110
Abstract
Quantile, equal interval, and natural breaks methods are widely used data classification methods in geospatial analysis and cartography. However, when applied to data with skewed distributions, they can only reveal the variations of either high frequent values or extremes, which often leads to [...] Read more.
Quantile, equal interval, and natural breaks methods are widely used data classification methods in geospatial analysis and cartography. However, when applied to data with skewed distributions, they can only reveal the variations of either high frequent values or extremes, which often leads to undesired and biased classification results. To handle this problem, Esri provided a compromise method, named geometric interval classification (GIC). Although GIC performs well for various classification tasks, its mathematics and solution process remain unclear. Moreover, GIC is theoretically only applicable to single-peak (single-modal), one-dimensional data. This paper first mathematically formulates GIC as a general optimization problem subject to equality constraint. We then further adapt such formulated GIC to handle multi-peak and multi-dimensional data. Both thematic data and remote sensing images are used in this study. The comparison with other classification methods demonstrates the advantage of GIC being able to highlight both middle and extreme values. As such, it can be regarded as a general data classification approach for thematic mapping and other geospatial applications. Full article
Show Figures

Figure 1

22 pages, 6389 KiB  
Article
Beyond Accessibility: A Multidimensional Evaluation of Urban Park Equity in Yangzhou, China
by Zhiming Li, Zhengyuan Liang, Linhui Feng and Zhengxi Fan
ISPRS Int. J. Geo-Inf. 2022, 11(8), 429; https://doi.org/10.3390/ijgi11080429 - 29 Jul 2022
Cited by 11 | Viewed by 3088
Abstract
Evaluating park equity can help guide the advancement of sustainable and equitable space policies. Previous studies have mainly considered accessibility when evaluating park equity while ignoring the selectivity and convenience of entering parks and residents’ recognition of parks. Measuring equity based mainly on [...] Read more.
Evaluating park equity can help guide the advancement of sustainable and equitable space policies. Previous studies have mainly considered accessibility when evaluating park equity while ignoring the selectivity and convenience of entering parks and residents’ recognition of parks. Measuring equity based mainly on spatial thinking has resulted in the social aspects of parks receiving insufficient attention. In this study, we therefore integrated the spatial and social equity of parks and developed a multidimensional framework to evaluate park equity in four dimensions: accessibility (Ai), diversity (Di), convenience (Ci), and satisfaction (Si). Empirical analysis from Yangzhou, China showed that: (1) in Yangzhou’s built-up districts, 23.43% of the communities received high- or relatively high-level park access but 17.72% received little or no park access. (2) The Gini coefficient indicated that all three dimensions showed a mismatch with population distribution, except for satisfaction (Si), which showed a relatively reasonable match. (3) Park access was generally better in communities with better locations, environments, and facilities. High-income groups enjoyed significantly better park access than low- and middle-income groups. These findings could help urban planners and policymakers develop effective policies to reduce inequality in park access. Full article
Show Figures

Figure 1

24 pages, 9681 KiB  
Article
Explore the Correlation between Environmental Factors and the Spatial Distribution of Property Crime
by Lijian Sun, Guozhuang Zhang, Dan Zhao, Ling Ji, Haiyan Gu, Li Sun and Xia Li
ISPRS Int. J. Geo-Inf. 2022, 11(8), 428; https://doi.org/10.3390/ijgi11080428 - 28 Jul 2022
Cited by 7 | Viewed by 4463
Abstract
Comprehensively understanding the factors influencing crime is a prerequisite for preventing and combating crime. Although some studies have investigated the relationship between environmental factors and property crime, the interaction between factors was not fully considered in these studies, and the explanation of complex [...] Read more.
Comprehensively understanding the factors influencing crime is a prerequisite for preventing and combating crime. Although some studies have investigated the relationship between environmental factors and property crime, the interaction between factors was not fully considered in these studies, and the explanation of complex factors may be insufficient. This paper explored the influence of environmental factors on property crime using factor regression and factor interaction based on data from the central city of Lanzhou, China. Our findings showed that: (1) The distribution of crime cases showed the pattern of a local multi-center. Shop density, hotel density, entertainment density and house price were the four dominant environmental drivers of property crime; (2) The relationship between the light intensity and property crime had different correlation explanations in temporal projection and spatial projection. There was a normal distribution curve between the number of property crimes and the Price-to-Earnings Ratio (PE Ratio) of the community house price; and (3) The results of the factor interaction indicated that the effect of all factors on crime showed a two-factor enhancement. As an important catalyst, shop density had the strongest interaction with other factors. Shop density gradient influenced the degree of interpretation of spatial heterogeneity of property crime. Full article
Show Figures

Figure 1

Previous Issue
Back to TopTop