Next Issue
Volume 6, June
Previous Issue
Volume 5, December


Hydrology, Volume 6, Issue 1 (March 2019) – 28 articles

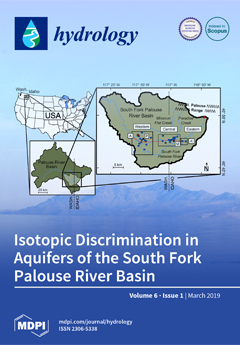
Cover Story (view full-size image): Since 1935, groundwater levels have declined in aquifers of the Palouse River Basin, particularly in the South Fork Palouse River Basin (Basin) in north-central Idaho and eastern Washington. Groundwater provides a primary source for industry and agriculture in the region and is the sole source of municipal water. Extrapolation of the current trend in declining groundwater levels indicates the possibility of insufficient groundwater resources to meet future community needs. Previous studies have suggested that recharge is entering the aquifer system through pathways beginning in sediments along the margin of the Basin. However, attempts to model the aquifers to predict the decline in groundwater levels have produced mixed results due to lack of resolution in recharge sources, subsystem connectivity, and identifiable flow patterns. View this paper.
  • Issues are regarded as officially published after their release is announced to the table of contents alert mailing list.
  • You may sign up for e-mail alerts to receive table of contents of newly released issues.
  • PDF is the official format for papers published in both, html and pdf forms. To view the papers in pdf format, click on the "PDF Full-text" link, and use the free Adobe Reader to open them.
Order results
Result details
Section
Select all
Export citation of selected articles as:
14 pages, 2298 KiB  
Case Report
Improving Urban Runoff in Multi-Basin Hydrological Simulation by the HYPE Model Using EEA Urban Atlas: A Case Study in the Sege River Basin, Sweden
by Hiroto Tanouchi, Jonas Olsson, Göran Lindström, Akira Kawamura and Hideo Amaguchi
Hydrology 2019, 6(1), 28; https://doi.org/10.3390/hydrology6010028 - 21 Mar 2019
Cited by 8 | Viewed by 5155
Abstract
In this study, the high-resolution polygonal land cover data of EEA Urban Atlas was applied for land-use characterization in the dynamic multi-basin hydrological model, HYPE. The objective of the study was to compare this dedicated urban land cover data in semi-distributed hydrological modelling [...] Read more.
In this study, the high-resolution polygonal land cover data of EEA Urban Atlas was applied for land-use characterization in the dynamic multi-basin hydrological model, HYPE. The objective of the study was to compare this dedicated urban land cover data in semi-distributed hydrological modelling with the widely used but less detailed EEA CORINE. The model was set up for a basin including a small town named Svedala in southern Sweden. In order to verify the ability of the HYPE model to reproduce the observed flow rate, the simulated flow rate was evaluated based on river flow time series, statistical indicators and flow duration curves. Flow rate simulated by the model based on Urban Atlas generally agreed better with observations of summer storm events than the CORINE-based model, especially when the daily rainfall amount was 10 mm/day or more, or the flow exceedance probability was 0.02 to 0.5. It suggests that the added value of the Urban Atlas model is higher for heavy-to-medium storm events dominated by direct runoff. To conclude, the effectiveness of the proposed approach, which aims at improving the accuracy of hydrological simulations in urbanized basins, was supported. Full article
Show Figures

Figure 1

13 pages, 3333 KiB  
Article
Real-Time Measurement of Flash-Flood in a Wadi Area by LSPIV and STIV
by Mahmood M. Al-mamari, Sameh A. Kantoush, Sohei Kobayashi, Tetsuya Sumi and Mohamed Saber
Hydrology 2019, 6(1), 27; https://doi.org/10.3390/hydrology6010027 - 20 Mar 2019
Cited by 25 | Viewed by 7013
Abstract
Flash floods in wadi systems discharge large volumes of water to either the sea or the desert areas after high-intensity rainfall events. Recently, wadi flash floods have frequently occurred in arid regions and caused damage to roads, houses, and properties. Therefore, monitoring and [...] Read more.
Flash floods in wadi systems discharge large volumes of water to either the sea or the desert areas after high-intensity rainfall events. Recently, wadi flash floods have frequently occurred in arid regions and caused damage to roads, houses, and properties. Therefore, monitoring and quantifying these events by accurately measuring wadi discharge has become important for the installation of mitigation structures and early warning systems. In this study, image-based methods were used to measure surface flow velocities during a wadi flash flood in 2018 to test the usefulness of large-scale particle image velocimetry (LSPIV) and space–time image velocimetry (STIV) techniques for the estimation of wadi discharge. The results, which indicated the positive performance of the image-based methods, strengthened our hypothesis that the application of LSPIV and STIV techniques is appropriate for the analysis of wadi flash flood velocities. STIV is suitable for unidirectional flow velocity and LSPIV is reliable and stable for two-dimensional measurement along the wadi channel, the direction of flow pattern which varies with time. Full article
Show Figures

Figure 1

16 pages, 6942 KiB  
Article
Identification of Source Water Mixing in the Fish Slough Spring Complex, Mono County, California, USA
by Andy Zdon, Keith Rainville, Nicholas Buckmaster, Steve Parmenter and Adam H. Love
Hydrology 2019, 6(1), 26; https://doi.org/10.3390/hydrology6010026 - 20 Mar 2019
Cited by 5 | Viewed by 4190
Abstract
While the desert ecosystem is highly dependent on the water resources that sustain it, the Fish Slough spring complex is an arid, spring-dependent wetland undergoing a multidecadal decline in spring outflow. This evaluation updates the source water forensics of the Fish Slough Spring [...] Read more.
While the desert ecosystem is highly dependent on the water resources that sustain it, the Fish Slough spring complex is an arid, spring-dependent wetland undergoing a multidecadal decline in spring outflow. This evaluation updates the source water forensics of the Fish Slough Spring complex, a substantial spring complex in the northern Owens Valley of the Basin and Range geomorphic provinces, in order to better understand the nature of the spring flow decline. The source of spring flow at Fish Slough was evaluated through an integration of the established geologic setting with measured groundwater elevations, and water quality and isotope chemistry compiled from both previously published sources and collection of new samples. While previous efforts to source the Fish Slough springs only considered potential source areas within the local geography, this evaluation considered a larger geographic extent for potential source areas to the spring water. The results infer that Fish Slough springs are sourced from multiple source water areas in hydraulic communication: a basin fill aquifer and warm, sodic spring systems with distinctive chemical signatures. Mixing from these sources occurs along two hypothesized flow paths, one from the northeast through the Tri-Valley area and one from the north and northwest through the Volcanic Tablelands. Northeast Spring has the strongest signature for Tri-Valley area waters, whereas the remaining Fish Slough Springs are comprised of a mixture of both flow paths. These conclusions have important implications for water management activities that have the potential to impact the desert ecosystem supported by these springs. Full article
Show Figures

Graphical abstract

18 pages, 3459 KiB  
Technical Note
Quantification of the Effect of Bridge Pier Encasement on Headwater Elevation Using HEC-RAS
by Abhijit Sharma Subedi, Suresh Sharma, Anwarul Islam and Niraj Lamichhane
Hydrology 2019, 6(1), 25; https://doi.org/10.3390/hydrology6010025 - 19 Mar 2019
Cited by 6 | Viewed by 4636
Abstract
The deterioration of bridge substructure is a serious concern across the United States. The pier encasement is one of the most common practices for repairing and strengthening the bridge substructure. It is a rehabilitation process of existing pile piers during the repair or [...] Read more.
The deterioration of bridge substructure is a serious concern across the United States. The pier encasement is one of the most common practices for repairing and strengthening the bridge substructure. It is a rehabilitation process of existing pile piers during the repair or replacement of the bridge superstructure, which involves enclosing part of an existing pile pier with a polyethylene or PVC pipe large enough to provide at least three inches of concrete cover over the existing pier when filled. However, this process of enclosing pile piers might elevate water level due to increase in pier width, which could be hazardous in high-risk flood zones. Furthermore, it may create an adverse impact on the stability of the bridge due to scouring around the pier foundation. In order to gain knowledge on the backwater effect due to pile encasement, Hydraulic Engineering Center-River Analysis System (HEC-RAS) was used in this research to perform hydraulic simulations near the bridge sites. These simulations were carried out for various channel configurations and pier sizes with a wide range of flows, which resulted into 224 HEC-RAS models in order to investigate the effects of pile pier encasement on the headwater elevation. This study demonstrated that the water elevation measured in the upstream of the bridge showed no-rise condition, especially for wider channel sections with flatter slopes. However, the water elevation at the immediate upstream of the bridge was slightly higher, and the increasing pattern was only noticeable for a smaller channel width (20 ft), and specifically, for increased flow rate. As the area of flow was decreased resulting in increased water surface elevation due to encasement, a generic power equation in the form of Y = aXb was suggested for various channel slopes for the increased water surface elevation (Y) for each percentage decrease in channel area (X). Full article
Show Figures

Figure 1

17 pages, 3166 KiB  
Article
Modeling Water Quality Parameters Using Data-Driven Models, a Case Study Abu-Ziriq Marsh in South of Iraq
by Mustafa Al-Mukhtar and Fuaad Al-Yaseen
Hydrology 2019, 6(1), 24; https://doi.org/10.3390/hydrology6010024 - 17 Mar 2019
Cited by 62 | Viewed by 6242
Abstract
Total dissolved solids (TDS) and electrical conductivity (EC) are important parameters in determining water quality for drinking and agricultural water, since they are directly associated to the concentration of salt in water and, hence, high values of these parameters cause low water quality [...] Read more.
Total dissolved solids (TDS) and electrical conductivity (EC) are important parameters in determining water quality for drinking and agricultural water, since they are directly associated to the concentration of salt in water and, hence, high values of these parameters cause low water quality indices. In addition, they play a significant role in hydrous life, effective water resources management and health studies. Thus, it is of critical importance to identify the optimum modeling method that would be capable to capture the behavior of these parameters. The aim of this study was to assess the ability of using three different models of artificial intelligence techniques: Adaptive neural based fuzzy inference system (ANFIS), artificial neural networks (ANNs) and Multiple Regression Model (MLR) to predict and estimate TDS and EC in Abu-Ziriq marsh south of Iraq. As so, eighty four monthly TDS and EC values collected from 2009 to 2018 were used in the evaluation. The collected data was randomly split into 75% for training and 25% for testing. The most effective input parameters to model TDS and EC were determined based on cross-correlation test. The three performance criteria: correlation coefficient (CC), root mean square error (RMSE) and Nash–Sutcliffe efficiency coefficient (NSE) were used to evaluate the performance of the developed models. It was found that nitrate (NO3), calcium (Ca+2), magnesium (Mg+2), total hardness (T.H), sulfate (SO4) and chloride (Cl−1) are the most influential inputs on TDS. While calcium (Ca+2), magnesium (Mg+2), total hardness (T.H), sulfate (SO4) and chloride (Cl−1) are the most effective on EC. The comparison of the results showed that the three models can satisfactorily estimate the total dissolved solids and electrical conductivity, but ANFIS model outperformed the ANN and MLR models in the three performance criteria: RMSE, CC and NSE during the calibration and validation periods in modeling the two water quality parameters. ANFIS is recommended to be used as a predictive model for TDS and EC in the Iraqi marshes. Full article
Show Figures

Figure 1

11 pages, 5146 KiB  
Article
Assessment of Groundwater Recharge, Evaporation, and Runoff in the Drava Basin in Hungary with the WetSpass Model
by Ali Salem, József Dezső and Mustafa El-Rawy
Hydrology 2019, 6(1), 23; https://doi.org/10.3390/hydrology6010023 - 16 Mar 2019
Cited by 33 | Viewed by 7691
Abstract
The assessment of spatial and temporal distribution of groundwater recharge is required as an input to develop the regional groundwater model in the Drava flood plain for more accurate simulations of different management scenarios. WetSpass-M, a GIS-based spatially-distributed water balance model, was implemented [...] Read more.
The assessment of spatial and temporal distribution of groundwater recharge is required as an input to develop the regional groundwater model in the Drava flood plain for more accurate simulations of different management scenarios. WetSpass-M, a GIS-based spatially-distributed water balance model, was implemented to assess monthly, seasonal, and the annual averages of groundwater recharge, surface runoff and actual evapotranspiration in the Drava basin, Hungary for the period between 2000–2018. The basic relevant input-data for the Wetspass-M model is prepared in grid-maps using the tool ARCGIS tool. It comprises monthly climatological recordings (e.g., rainfall, temperature, wind speed), distributed land cover, soil map, groundwater depth, topography, and slope. The long-term temporal and spatial average monthly precipitation (58 mm) is distributed as 29% (17 mm) surface runoff, 27% (16 mm) actual evapotranspiration, and 44% (25 mm) groundwater recharge. The mean annual groundwater recharge, actual evapotranspiration, and surface runoff were 307, 190, and 199 mm, respectively. The findings of the WetSpass-M model are intended to support integrated groundwater modeling. The analysis of simulation results shows that WetSpass-M model works properly to simulate hydrological water budget components in the Drava basin. Moreover, a better understanding of the simulated long-term average spatial distribution about water balance components is useful for managing and planning the available water resources in the Drava basin. Full article
Show Figures

Figure 1

12 pages, 1579 KiB  
Article
Long Term Historic Changes in the Flow of Lesser Zab River, Iraq
by Rawshan Ali, Arez Ismael, Arien Heryansyah and Nadeem Nawaz
Hydrology 2019, 6(1), 22; https://doi.org/10.3390/hydrology6010022 - 13 Mar 2019
Cited by 21 | Viewed by 4843
Abstract
The assessment of trends in river flows has become of interest to the scientific community in order to understand the changing characteristics of flow due to climate change. In this study, the trends in river flow of Dukan Dam located in the northern [...] Read more.
The assessment of trends in river flows has become of interest to the scientific community in order to understand the changing characteristics of flow due to climate change. In this study, the trends in river flow of Dukan Dam located in the northern part of Iraq were assessed. The assessment was carried out for the period 1964 to 2013 using Sen’s slope and the Mann–Kendall test. Sen’s slope was used to assess the magnitude of change while the Mann–Kendall trend test was used to confirm the significance of trends. The results of the study showed that there was a decreasing trend in river flow both annually and for all individual months. The highest decreasing trend of −5.08846 m3/month was noticed in April, while the lowest change of −1.06022 m3/month was noticed in November. The annual flow also showed a significant decrease at a rate of −1.912 m3/year at a 95% level of confidence. Additionally, the findings of the study also confirmed that a decrease in precipitation and the construction of hydraulic structures reduced the flow in the river. The findings of the study suggest that decreasing trends may cause a water-scarce situation in the future if proper adaptation measures are not taken. Full article
Show Figures

Figure 1

17 pages, 1443 KiB  
Article
Application of HEC-HMS Model for Flow Simulation in the Lake Tana Basin: The Case of Gilgel Abay Catchment, Upper Blue Nile Basin, Ethiopia
by Bitew G. Tassew, Mulugeta A. Belete and K. Miegel
Hydrology 2019, 6(1), 21; https://doi.org/10.3390/hydrology6010021 - 10 Mar 2019
Cited by 97 | Viewed by 15855
Abstract
Understanding the complex relationships between rainfall and runoff processes is necessary for the proper estimation of the quantity of runoff generated in a watershed. The surface runoff was simulated using the Hydrologic Modelling System (HEC-HMS) for the Gilgel Abay Catchment (1609 km2 [...] Read more.
Understanding the complex relationships between rainfall and runoff processes is necessary for the proper estimation of the quantity of runoff generated in a watershed. The surface runoff was simulated using the Hydrologic Modelling System (HEC-HMS) for the Gilgel Abay Catchment (1609 km2), Upper Blue Nile Basin, Ethiopia. The catchment was delineated and its properties were extracted from a 30 m × 30 m Digital Elevation Model (DEM) of the Lake Tana Basin. The meteorological model was developed within HEC-HMS from rainfall data and the control specifications defined the period and time step of the simulation run. To account for the loss, runoff estimation, and flow routing, Soil Conservation Service Curve Number (SCS-CN), Soil Conservation Service Unit Hydrograph (SCS-UH) and Muskingum methods were used respectively. The rainfall-runoff simulation was conducted using six extreme daily time series events. Initial results showed that there is a clear difference between the observed and simulated peak flows and the total volume. Thereafter, a model calibration with an optimization method and sensitivity analysis was carried out. The result of the sensitivity analysis showed that the curve number is the sensitive parameter. In addition, the model validation results showed a reasonable difference in peak flow (Relative Error in peak, REP = 1.49%) and total volume (Relative Error in volume, REV = 2.38%). The comparison of the observed and simulated hydrographs and the model performance (NSE = 0.884) and their correlation (R2 = 0.925) showed that the model is appropriate for hydrological simulations in the Gilgel Abay Catchment. Full article
Show Figures

Figure 1

24 pages, 23441 KiB  
Article
Hydrologic Trends in the Upper Nueces River Basin of Texas—Implications for Water Resource Management and Ecological Health
by E. Dave Thomas, Kartik Venkataraman, Victoria Chraibi and Narayanan Kannan
Hydrology 2019, 6(1), 20; https://doi.org/10.3390/hydrology6010020 - 8 Mar 2019
Cited by 20 | Viewed by 7340
Abstract
Reliable water sources are central to human and environmental health. In south Texas, USA, the Nueces River Basin (NRB) directly or indirectly plays that important role for many counties. Several NRB stream segments are designated as ecologically significant because they serve crucial hydrologic, [...] Read more.
Reliable water sources are central to human and environmental health. In south Texas, USA, the Nueces River Basin (NRB) directly or indirectly plays that important role for many counties. Several NRB stream segments are designated as ecologically significant because they serve crucial hydrologic, ecologic, and biologic functions. The hydrologically significant streams recharge the Edwards Aquifer, an essential water source for the region’s agricultural, industrial, and residential activities. Unfortunately, the semiarid to arid south Texas climate leads to large inter-annual precipitation variability which impacts streamflow, and as a consequence, the aquifer’s recharge. In this study, we used a suite of hydrologic metrics to evaluate the NRB’s hydroclimatic trends and assess their potential impacts on the watershed’s ecologically significant stream segments using precipitation and streamflow data from the National Climatic Data Center (NCDC) and Hydroclimatic Data Network (HCDN) respectively from 1970 to 2014. The results consistently showed statistically significant decreasing streamflow for certain low-flow indicators over various temporal scales, likely due to water rights diversions and minimal land use changes. This research could help decision-makers develop the necessary tools to manage water resources in south Texas, given the NRB’s significance as a source of water for domestic consumption and ecological health. Full article
Show Figures

Figure 1

19 pages, 4245 KiB  
Article
Modeling of GRACE-Derived Groundwater Information in the Colorado River Basin
by Md Mafuzur Rahaman, Balbhadra Thakur, Ajay Kalra and Sajjad Ahmad
Hydrology 2019, 6(1), 19; https://doi.org/10.3390/hydrology6010019 - 18 Feb 2019
Cited by 62 | Viewed by 6531
Abstract
Groundwater depletion has been one of the major challenges in recent years. Analysis of groundwater levels can be beneficial for groundwater management. The National Aeronautics and Space Administration’s twin satellite, Gravity Recovery and Climate Experiment (GRACE), serves in monitoring terrestrial water storage. Increasing [...] Read more.
Groundwater depletion has been one of the major challenges in recent years. Analysis of groundwater levels can be beneficial for groundwater management. The National Aeronautics and Space Administration’s twin satellite, Gravity Recovery and Climate Experiment (GRACE), serves in monitoring terrestrial water storage. Increasing freshwater demand amidst recent drought (2000–2014) posed a significant groundwater level decline within the Colorado River Basin (CRB). In the current study, a non-parametric technique was utilized to analyze historical groundwater variability. Additionally, a stochastic Autoregressive Integrated Moving Average (ARIMA) model was developed and tested to forecast the GRACE-derived groundwater anomalies within the CRB. The ARIMA model was trained with the GRACE data from January 2003 to December of 2013 and validated with GRACE data from January 2014 to December of 2016. Groundwater anomaly from January 2017 to December of 2019 was forecasted with the tested model. Autocorrelation and partial autocorrelation plots were drawn to identify and construct the seasonal ARIMA models. ARIMA order for each grid was evaluated based on Akaike’s and Bayesian information criterion. The error analysis showed the reasonable numerical accuracy of selected seasonal ARIMA models. The proposed models can be used to forecast groundwater variability for sustainable groundwater planning and management. Full article
(This article belongs to the Special Issue Remote Sensing in Hydrological Modelling)
Show Figures

Figure 1

27 pages, 19178 KiB  
Article
Assessment of Terrigenous Nutrient Loading to Coastal Ecosystems along a Human Land-Use Gradient, Tutuila, American Samoa
by Christopher K. Shuler, Daniel W. Amato, Veronica Gibson, Lydia Baker, Ashley N. Olguin, Henrietta Dulai, Celia M. Smith and Rosanna A. Alegado
Hydrology 2019, 6(1), 18; https://doi.org/10.3390/hydrology6010018 - 16 Feb 2019
Cited by 17 | Viewed by 6175
Abstract
Anthropogenic nutrient loading is well recognized as a stressor to coastal ecosystem health. However, resource managers are often focused on addressing point source or surface water discharge, whereas the impact of submarine groundwater discharge (SGD) as a nutrient vector is often unappreciated. This [...] Read more.
Anthropogenic nutrient loading is well recognized as a stressor to coastal ecosystem health. However, resource managers are often focused on addressing point source or surface water discharge, whereas the impact of submarine groundwater discharge (SGD) as a nutrient vector is often unappreciated. This study examines connections between land use and nutrient loading through comparison of four watersheds and embayments spanning a gradient of human use impact on Tutuila, a high tropical oceanic island in American Samoa. In each study location, coastal radon-222 measurements, dissolved nutrient concentrations, and nitrogen isotope values (δ15N) in water and in situ macroalgal tissue were used to explore SGD and baseflow derived nutrient impacts, and to determine probable nutrient sources. In addition to sampling in situ macroalgae, pre-treated macroalgal specimens were deployed throughout each embayment to uptake ambient nutrients and provide a standardized assessment of differences between locations. Results show SGD-derived nutrient flux was more significant than baseflow nutrient flux in all watersheds, and δ15N values in water and algae suggested wastewater or manure are likely sources of elevated nutrient levels. While nutrient loading correlated well with expected anthropogenic impact, other factors such as differences in hydrogeology, distribution of development, and wastewater infrastructure also likely play a role in the visibility of impacts in each watershed. Full article
(This article belongs to the Special Issue Submarine Groundwater Discharge and Its Effects)
Show Figures

Figure 1

23 pages, 2859 KiB  
Article
Some Challenges in Hydrologic Model Calibration for Large-Scale Studies: A Case Study of SWAT Model Application to Mississippi-Atchafalaya River Basin
by Narayanan Kannan, Chinnasamy Santhi, Michael J. White, Sushant Mehan, Jeffrey G. Arnold and Philip W. Gassman
Hydrology 2019, 6(1), 17; https://doi.org/10.3390/hydrology6010017 - 10 Feb 2019
Cited by 31 | Viewed by 7638
Abstract
This study is a part of the Conservation Effects Assessment Project (CEAP) aimed to quantify the environmental and economic benefits of conservation practices implemented in the cultivated cropland throughout the United States. The Soil and Water Assessment Tool (SWAT) model under the Hydrologic [...] Read more.
This study is a part of the Conservation Effects Assessment Project (CEAP) aimed to quantify the environmental and economic benefits of conservation practices implemented in the cultivated cropland throughout the United States. The Soil and Water Assessment Tool (SWAT) model under the Hydrologic United Modeling of the United States (HUMUS) framework was used in the study. An automated flow calibration procedure was developed and used to calibrate runoff for each 8-digit watershed (within 20% of calibration target) and the partitioning of runoff into surface and sub-surface flow components (within 10% of calibration target). Streamflow was validated at selected gauging stations along major rivers within the river basin with a target R2 of >0.6 and Nash and Sutcliffe Efficiency of >0.5. The study area covered the entire Mississippi and Atchafalaya River Basin (MARB). Based on the results obtained, our analysis pointed out multiple challenges to calibration such as: (1) availability of good quality data, (2) accounting for multiple reservoirs within a sub-watershed, (3) inadequate accounting of elevation and slopes in mountainous regions, (4) poor representation of carrying capacity of channels, (5) inadequate capturing of the irrigation return flows, (6) inadequate representation of vegetative cover, and (7) poor representation of water abstractions (both surface and groundwater). Additional outstanding challenges to large-scale hydrologic model calibration were the coarse spatial scale of soils, land cover, and topography. Full article
Show Figures

Figure 1

21 pages, 4733 KiB  
Article
Quantifying Thermal Characteristics of Stormwater through Low Impact Development Systems
by Charlene LeBleu, Mark Dougherty, Keith Rahn, Amy Wright, Ryan Bowen, Rui Wang, Jeisson Andrés Orjuela and Kaylee Britton
Hydrology 2019, 6(1), 16; https://doi.org/10.3390/hydrology6010016 - 5 Feb 2019
Cited by 9 | Viewed by 4895
Abstract
Urbanization causes alteration of the thermal regime (surface, air, and water) of the environment. Heated stormwater runoff flows into lakes, streams, bays, and estuaries, which potentially increases the base temperature of the surface water. The amount of heat transferred, and the degree of [...] Read more.
Urbanization causes alteration of the thermal regime (surface, air, and water) of the environment. Heated stormwater runoff flows into lakes, streams, bays, and estuaries, which potentially increases the base temperature of the surface water. The amount of heat transferred, and the degree of thermal pollution is of great importance to the ecological integrity of receiving waters. This research reports on a controlled laboratory scale test to assess low impact development (LID) stormwater control measure impacts on the thermal characteristics of stormwater runoff. We hypothesize that LID stormwater control measures (SCMs) such as pervious surfaces and rain gardens/bioretention can be used to mitigate the ground level thermal loads from stormwater runoff. Laboratory methods in this study captured and infiltrated simulated stormwater runoff from four infrared heated substrate microcosms (pervious concrete, impervious concrete, permeable concrete pavers, and turf grass), and routed the stormwater through rain garden microcosms. A data logging system with thermistors located on, within, and at exits of the microcosms, recorded resulting stormwater temperature flux. Researchers compared steady state temperatures of the laboratory to previously collected field data and achieved between 30% to 60% higher steady state surface temperatures with indoor than outdoor test sites. This research helps establish baseline data to study heat removal effectiveness of pervious materials when used alone or in combination as a treatment train with other stormwater control measures such as rain gardens/bioretention. Full article
Show Figures

Figure 1

17 pages, 3119 KiB  
Article
Isotopic Discrimination of Aquifer Recharge Sources, Subsystem Connectivity and Flow Patterns in the South Fork Palouse River Basin, Idaho and Washington, USA
by Kyle A. Duckett, Jeff B. Langman, John H. Bush, Erin S. Brooks, Pamela Dunlap and Jeffrey M. Welker
Hydrology 2019, 6(1), 15; https://doi.org/10.3390/hydrology6010015 - 3 Feb 2019
Cited by 7 | Viewed by 5846
Abstract
Groundwater studies in the South Fork Palouse River Basin have been unable to determine recharge sources, subsystem connectivity and flow patterns due to the discontinuity of pathways in the heterogeneous and anisotropic aquifers located in Columbia River flood basalts and interbedded sediments. Major [...] Read more.
Groundwater studies in the South Fork Palouse River Basin have been unable to determine recharge sources, subsystem connectivity and flow patterns due to the discontinuity of pathways in the heterogeneous and anisotropic aquifers located in Columbia River flood basalts and interbedded sediments. Major ion, δ18O, δ2H, δ13C, δ34S and temperature for groundwater collected from 28 wells of varying depths indicate a primary recharge source dominated by snowmelt along the eastern basin margin. This recharge can be separated into two distinct sources—a deeper and relatively less altered snowmelt signal (−17.3‰ to −16.8‰ δ18O, −131‰ to −127‰ δ2H, −12.9‰ to −10‰ δ13C, 18–23 °C) and a more altered signal likely derived from a shallower mixture of snowmelt, precipitation and surface water (−16.1‰ to −15.5‰ δ18O, −121‰ to −117‰ δ2H, −15.9‰ to −12.9‰ δ13C, 12–19 °C). A mixing of the shallow and deep source waters is observed within the upper aquifer of the Grande Ronde Formation near Moscow, Idaho, which results in a homogenization of isotope ratios and geochemistry for groundwater at nearly any depth to the west of this mixing zone. This homogenized signal is prevalent in a likely primary productive zone of an intermediate depth in the overall aquifer system. Full article
Show Figures

Figure 1

15 pages, 4336 KiB  
Article
A Conceptual Modeling Framework for Hydrologic Ecosystem Services
by Feng Pan and Woonsup Choi
Hydrology 2019, 6(1), 14; https://doi.org/10.3390/hydrology6010014 - 1 Feb 2019
Cited by 7 | Viewed by 4606
Abstract
Ecosystem services (ES) help people understand and deal with current environmental situations and problems, and ES-related research has been increasing recently. However, the quantitative evaluations of ES that can be easily understood by decision makers are still in development. Specifically, new methods are [...] Read more.
Ecosystem services (ES) help people understand and deal with current environmental situations and problems, and ES-related research has been increasing recently. However, the quantitative evaluations of ES that can be easily understood by decision makers are still in development. Specifically, new methods are needed for hydrologic ES with the requirements of spatially and temporally explicit specification of parameters related to climate, geology, land cover, soil, and topography. This paper presents a conceptual modeling framework that aims to convert hydrologic information to hydrologic ES in fine temporal resolutions by developing a conceptual connection of three modules: data development, hydrologic and ES modeling, and results analysis. Then, the framework was applied to a study basin to demonstrate the importance of hydrologic ES in fine temporal resolutions. Results of water provision ES, flood control ES, and sediment regulation ES were produced at fine temporal resolutions in the framework, which indicates that more timely and relevant policy suggestions can be provided to decision makers. The framework and the methodology are applicable for watersheds of varied sizes and can serve as a template for future coupling of different environmental models. Full article
Show Figures

Figure 1

22 pages, 5510 KiB  
Article
Uncertainty in Catchment Delineations as a Result of Digital Elevation Model Choice
by Laura Keys and Jussi Baade
Hydrology 2019, 6(1), 13; https://doi.org/10.3390/hydrology6010013 - 1 Feb 2019
Cited by 6 | Viewed by 387232
Abstract
Nine digital elevation model (DEM) datasets were used for separate delineations of the Nam Co, Tibet catchment and its subcatchments, and these delineated areas were compared using the highest resolution dataset, TanDEM-X 12 m, as a baseline. The mean delineated catchment area was [...] Read more.
Nine digital elevation model (DEM) datasets were used for separate delineations of the Nam Co, Tibet catchment and its subcatchments, and these delineated areas were compared using the highest resolution dataset, TanDEM-X 12 m, as a baseline. The mean delineated catchment area was within 0.1% percent of the baseline delineation, with a standard error of the mean (SEM) that was 0.13% of the baseline. In a comparison of 49 subcatchment areas, TanDEM-X and ALOS datasets delineated similar areas, followed closely by SRTM 30 m, then SRTM 90 m, ACE2, and ASTER GDEM1. ASTER GDEM2 was a noteworthy outlier, having the largest mean subcatchment area that was nearly three times that of the baseline mean. Correlation coefficients were calculated for subcatchment parameters, SEM, and each DEM’s subcatchment area error. SEM had a weak but significant negative correlation with the mean and median slope. ASTER GDEM1 and GDEM2 were the only datasets that showed any significant correlations with the subcatchment environment variables, though these correlations were also weak. The 30 m posting ASTER GDEMs performed worse against the baseline than the other 30 m and 90 m datasets, showing that posting alone does not determine how good a dataset is. Our results show general small errors for catchment delineations, though there is the possibility for large errors, particularly in the older ASTER and SRTM datasets. Full article
Show Figures

Figure 1

14 pages, 3927 KiB  
Case Report
Case Study: Comparative Analysis of Hydrologic Simulations with Areal-Averaging of Moving Rainfall
by Zheng N. Fang, Michael J. Shultz, Kevin J. Wienhold, Jiaqi Zhang and Shang Gao
Hydrology 2019, 6(1), 12; https://doi.org/10.3390/hydrology6010012 - 31 Jan 2019
Cited by 4 | Viewed by 5018
Abstract
The goal of this investigation is to compare the hydrologic simulations caused by the areal-averaging of dynamic moving rainfall. Two types of synthetic rainfall are developed: spatially varied rainfall (SVR) is the typical input to a distributed model while temporally varied rainfall (TVR) [...] Read more.
The goal of this investigation is to compare the hydrologic simulations caused by the areal-averaging of dynamic moving rainfall. Two types of synthetic rainfall are developed: spatially varied rainfall (SVR) is the typical input to a distributed model while temporally varied rainfall (TVR) emulates SVR but is spread uniformly over the entire watershed as in the case of a lumped model. This study demonstrates a direct comparison of peak discharge and peak timing generated by synthetic moving storms over idealized rectangular basins and a real watershed. It is found that the difference between the hydrologic responses from SVR and TVR reflects the impact from the areal-averaging of rainfall; the areal-averaging of rainfall for the movement from upstream to downstream over a lumped model can result in underestimated and delayed peak values in comparison to those from a distributed model; the flood peaks from SVR and TVR are found similar when the storm moves from downstream to upstream. The findings of the study suggest that extra cautions are needed for practitioners when evaluating simulated results from distributed and lumped modeling approaches even using the same rainfall information. Full article
Show Figures

Figure 1

14 pages, 3506 KiB  
Article
A Correlation–Scale–Threshold Method for Spatial Variability of Rainfall
by Bellie Sivakumar, Fitsum M. Woldemeskel, Rajendran Vignesh and Vinayakam Jothiprakash
Hydrology 2019, 6(1), 11; https://doi.org/10.3390/hydrology6010011 - 23 Jan 2019
Cited by 5 | Viewed by 4003
Abstract
Rainfall data at fine spatial resolutions are often required for various studies in hydrology and water resources. However, such data are not widely available, as their collection is normally expensive and time-consuming. A common practice to obtain fine-spatial-resolution rainfall data is to employ [...] Read more.
Rainfall data at fine spatial resolutions are often required for various studies in hydrology and water resources. However, such data are not widely available, as their collection is normally expensive and time-consuming. A common practice to obtain fine-spatial-resolution rainfall data is to employ interpolation schemes to derive them based on data available at nearby locations. Such interpolation schemes are generally based on rainfall correlation or distance between stations. The present study proposes a combined rainfall correlation-spatial scale-correlation threshold method for representing spatial rainfall variability. The method is applied to monthly rainfall data at a resolution of 0.25° × 0.25° latitude/longitude across Australia, available from the Tropical Rainfall Measuring Mission (TRMM 3B43 version). The results indicate that rainfall dynamics in northern and northeastern Australia have far greater spatial correlations when compared to the other regions, especially in southern and southeastern Australia, suggesting that tropical climates generally have greater spatial rainfall correlations when compared to temperate, oceanic, and continental climates, subject to other influencing factors. The implications of the outcomes for rainfall data interpolation and the rain gauge monitoring network are also discussed, especially based on results obtained for ten major cities in Australia. Full article
Show Figures

Figure 1

13 pages, 1922 KiB  
Article
Estimation of Peak Discharge in a Poorly Gauged Catchment Based on a Specified Hyetograph Model and Geomorphological Parameters: Case Study for the 23–24 October 2008 Flood, KALAYA Basin, Tangier, Morocco
by Iliasse Khaddor, Mohammed Achab, Abdelkader Ben jbara and Adil Hafidi Alaoui
Hydrology 2019, 6(1), 10; https://doi.org/10.3390/hydrology6010010 - 21 Jan 2019
Cited by 5 | Viewed by 3804
Abstract
The determination of discharge from stage measurement is an essential procedure in surface hydrology. Due to limited data availability in terms of discharges and rainfalls, a number of non-flood water levels have been used for deriving a rating curve based on an indirect [...] Read more.
The determination of discharge from stage measurement is an essential procedure in surface hydrology. Due to limited data availability in terms of discharges and rainfalls, a number of non-flood water levels have been used for deriving a rating curve based on an indirect method with specific cross-sections, longitudinal slope of the river, and bed roughness at the KALAYA gage station. In addition, instantaneous rainfall recordings across the Meloussa gage station are available from 23 October 2008 storm event that have been collected in order to develop temporal distribution (hyetograph). Thereby, it provides the necessary input to generate a continuous rainfall-runoff time series, with the derived instantaneous discharge allowed us to calibrate the simulated stage-discharge hydrograph that covers the entire time of the storm event period from 23 to 24 October. An empirical equation was derived in order to provide the peak flow as a function of the given rainfall quantities, its standard deviation, and its standard deviation error. As a result, a very positive correlation between Runoff and Rainfall was observed with values of 0.999. Additional tests were performed to generate a peak discharge of approximately 486 m3/s, using the observed hyetograph and calibrating CN, Lagtime, and Initial abstraction. The results would improve the quality of the model since it allows for a more precise hyetograph to be simulated over a smaller area. Full article
Show Figures

Figure 1

13 pages, 2069 KiB  
Communication
On the Relationship between Experimental and Numerical Modelling of Gravel-Bed Channel Aggradation
by Barbara Zanchi, Matteo Zucchi and Alessio Radice
Hydrology 2019, 6(1), 9; https://doi.org/10.3390/hydrology6010009 - 15 Jan 2019
Cited by 6 | Viewed by 3228
Abstract
This communication explores the use of numerical modelling to simulate the hydro-morphologic response of a laboratory flume subject to sediment overloading. The numerical model calibration was performed by introducing a multiplicative factor in the Meyer–Peter and Müller transport formula, in order to achieve [...] Read more.
This communication explores the use of numerical modelling to simulate the hydro-morphologic response of a laboratory flume subject to sediment overloading. The numerical model calibration was performed by introducing a multiplicative factor in the Meyer–Peter and Müller transport formula, in order to achieve a correspondence with the bed and water profiles recorded during a test carried out under a subcritical flow regime. The model was validated using a second subcritical test, and then run to simulate an experiment during which morphological changes made the water regime switch from subcritical to supercritical. The “relationship” between physical and numerical modelling was explored in terms of how the boundary conditions for the two approaches had to be set. Results showed that, even though the first two experiments were reproduced well, the third one could not be modeled adequately. This was explained considering that, after the switch of the flow regime, some of the boundary conditions posed into the numerical model turned out to be misplaced, while others were lacking. The numerical modelling of hydro-morphologic processes where the flow regime is trans-critical in time requires particular care in the position of the boundary conditions, accounting for the instant at which the water regime changes. Full article
Show Figures

Figure 1

19 pages, 42498 KiB  
Article
Spatiotemporal Surface Moisture Variations on a Barred Beach and their Relationship with Groundwater Fluctuations
by Yvonne Smit, Jasper J. A. Donker and Gerben Ruessink
Hydrology 2019, 6(1), 8; https://doi.org/10.3390/hydrology6010008 - 15 Jan 2019
Cited by 18 | Viewed by 3951
Abstract
Understanding the spatiotemporal variability of surface moisture on a beach is a necessity to develop a quantitatively accurate predictive model for aeolian sand transport from the beach into the foredune. Here, we analyze laser-derived surface moisture maps with a 1 × 1 m [...] Read more.
Understanding the spatiotemporal variability of surface moisture on a beach is a necessity to develop a quantitatively accurate predictive model for aeolian sand transport from the beach into the foredune. Here, we analyze laser-derived surface moisture maps with a 1 × 1 m spatial and a 15-min temporal resolution and concurrent groundwater measurements collected during falling and rising tide at the barred Egmond beach, the Netherlands. Consistent with earlier studies, the maps show that the beach can be conceptualized into three surface moisture zones. First, the wet zone just above the low tide level: 18–25%; second, the intertidal zone: 5–25% with large fluctuations. In this zone, surface moisture can decrease with a rate varying between ∼2.5–4% per hour, and cumulatively with 16% during a single falling tide; and, third, the back beach zone: 3–7% (dry). The bar–trough system perturbs this overall zonation, with the moisture characteristics on the bar similar to the upper intertidal beach and the trough always remaining wet. Surface moisture fluctuations are strongly linked to the behavior of groundwater depth and can be described by a ’Van Genuchten-type’ retention curve without hysteresis effects. Applying the Van Genuchten relationship with measured groundwater data allows us to predict surface moisture maps. Results show that the predictions capture the overall surface moisture pattern reasonably well; however, alongshore variability in groundwater level should be improved to refine the predicted surface moisture maps, especially near the sandbar. Full article
Show Figures

Figure 1

4 pages, 132 KiB  
Editorial
Acknowledgement to Reviewers of Hydrology in 2018
by Hydrology Editorial Office
Hydrology 2019, 6(1), 7; https://doi.org/10.3390/hydrology6010007 - 10 Jan 2019
Viewed by 2096
Abstract
Rigorous peer-review is the corner-stone of high-quality academic publishing [...] Full article
14 pages, 2655 KiB  
Article
Eye in the Sky: Using UAV Imagery of Seasonal Riverine Canopy Growth to Model Water Temperature
by Ann Willis and Eric Holmes
Hydrology 2019, 6(1), 6; https://doi.org/10.3390/hydrology6010006 - 9 Jan 2019
Cited by 5 | Viewed by 3989
Abstract
Until recently, stream temperature processes controlled by aquatic macrophyte shading (i.e., the riverine canopy) was an unrecognized phenomenon. This study aims to address the question of the temporal and spatial scale of monitoring and modeling that is needed to accurately simulate canopy-controlled thermal [...] Read more.
Until recently, stream temperature processes controlled by aquatic macrophyte shading (i.e., the riverine canopy) was an unrecognized phenomenon. This study aims to address the question of the temporal and spatial scale of monitoring and modeling that is needed to accurately simulate canopy-controlled thermal processes. We do this by using unmanned aerial vehicle (UAV) imagery to quantify the temporal and spatial variability of the riverine canopy and subsequently develop a relationship between its growth and time. Then we apply an existing hydrodynamic and water temperature model to test various time steps of canopy growth interpolation and explore the balance between monitoring and computational efficiencies versus model performance and utility for management decisions. The results show that riverine canopies modeled at a monthly timescale are sufficient to represent water temperature processes at a resolution necessary for reach-scale water management decisions, but not local-scale. As growth patterns were more frequently updated, negligible changes were produced by the model. Spatial configurations of the riverine canopy vary interannually; new data may need to be gathered for each growth season. However, the risks of inclement field conditions during the early growth period are a challenge for monitoring via UAVs at sites with access constraints. Full article
Show Figures

Figure 1

16 pages, 3057 KiB  
Article
Optimization of Water-Supply and Hydropower Reservoir Operation Using the Charged System Search Algorithm
by Behzad Asadieh and Abbas Afshar
Hydrology 2019, 6(1), 5; https://doi.org/10.3390/hydrology6010005 - 8 Jan 2019
Cited by 35 | Viewed by 5526
Abstract
The Charged System Search (CSS) metaheuristic algorithm is introduced to the field of water resources management and applied to derive water-supply and hydro-power operating policies for a large-scale real-world reservoir system. The optimum algorithm parameters for each reservoir operation problems are also obtained [...] Read more.
The Charged System Search (CSS) metaheuristic algorithm is introduced to the field of water resources management and applied to derive water-supply and hydro-power operating policies for a large-scale real-world reservoir system. The optimum algorithm parameters for each reservoir operation problems are also obtained via a tuning procedure. The CSS algorithm is a metaheuristic optimization method inspired by the governing laws of electrostatics in physics and motion from the Newtonian mechanics. In this study, the CSS algorithm’s performance has been tested with benchmark problems, consisting of highly non-linear constrained and/or unconstrained real-valued mathematical models, such as the Ackley’s function and Fletcher–Powell function. The CSS algorithm is then used to optimally solve the water-supply and hydropower operation of “Dez” reservoir in southern Iran over three different operation periods of 60, 240, and 480 months, and the results are presented and compared with those obtained by other available optimization approaches including Genetic Algorithm (GA), Ant Colony Optimization (ACO), Particle Swarm Optimization (PSO) and Constrained Big Bang–Big Crunch (CBB–BC) algorithm, as well as those obtained by gradient-based Non-Linear Programming (NLP) approach. The results demonstrate the robustness and superiority of the CSS algorithm in solving long term reservoir operation problems, compared to alternative methods. The CSS algorithm is used for the first time in the field of water resources management, and proves to be a robust, accurate, and fast convergent method in handling complex problems in this filed. The application of this approach in other water management problems such as multi-reservoir operation and conjunctive surface/ground water resources management remains to be studied. Full article
Show Figures

Figure 1

11 pages, 3119 KiB  
Article
Geothermal Linkage between a Hydrothermal Pond and a Deep Lake: Kuttara Volcano, Japan
by Kazuhisa Chikita, Yasuhiro Ochiai, Hideo Oyagi and Yoshitaka Sakata
Hydrology 2019, 6(1), 4; https://doi.org/10.3390/hydrology6010004 - 6 Jan 2019
Cited by 6 | Viewed by 3634
Abstract
Kuttara Volcano, Hokkaido, Japan, consists of temperate Lake Kuttara and the western Noboribetsu geothermal area. In order to explore geothermal relations between Lake Kuttara and the geothermal area, the heat budget of a hydrothermal pond, Okunoyu, was evaluated, and the heat storage change [...] Read more.
Kuttara Volcano, Hokkaido, Japan, consists of temperate Lake Kuttara and the western Noboribetsu geothermal area. In order to explore geothermal relations between Lake Kuttara and the geothermal area, the heat budget of a hydrothermal pond, Okunoyu, was evaluated, and the heat storage change in the lower layer of Lake Kuttara was calculated by monitoring the water temperature at the deepest point. The lake water temperature consistently increased during the thermal stratification in June–November of 2013–2016. The heat flux QB at lake bottom was then calculated at a range of 4.1–10.9 W/m2, which is probably due to the leakage from a hydrothermal reservoir below the lake bottom. Meanwhile, the heat flux HGin by geothermal groundwater input in Okunoyu was evaluated at 3.5–8.5 kW/m2, which is rapidly supplied through faults from underlying hydrothermal reservoirs. With a time lag of 5 months to monthly mean QB values in Lake Kuttara, the correlation with monthly mean HGin in Okunoyu was significant (R2 = 0.586; p < 0.01). Applying Darcy’s law to the leakage from the hydrothermal reservoir at 260–310 m below the lake bottom, the time needed for groundwater’s passage through the media 260–310 m thick was evaluated at 148–149 days (ca. 5 months). These findings suggest that the hydrothermal reservoir below lake bottom and the underlying hydrothermal reservoirs in the western geothermal area are both connected to a unique geothermal source in the deeper zone as a geothermal flow system of Kuttara Volcano. Full article
Show Figures

Figure 1

15 pages, 2481 KiB  
Article
Development of a Potentially Hazardous Pro-Glacial Lake in Aksay Valley, Kyrgyz Range, Northern Tien Shan
by Vitalii Zaginaev, Kristyna Falatkova, Bohumir Jansky, Miroslav Sobr and Sergey Erokhin
Hydrology 2019, 6(1), 3; https://doi.org/10.3390/hydrology6010003 - 1 Jan 2019
Cited by 2 | Viewed by 3837
Abstract
Debris flows caused by glacial lake outburst floods (GLOFs) are common hazards in mountain environments. The risk posed by glacial lake outburst hazards is particularly evaluated where the lower reaches of catchments are populated. A potentially dangerous lake has been identified adjacent to [...] Read more.
Debris flows caused by glacial lake outburst floods (GLOFs) are common hazards in mountain environments. The risk posed by glacial lake outburst hazards is particularly evaluated where the lower reaches of catchments are populated. A potentially dangerous lake has been identified adjacent to the Uchitel Glacier in Northern Tien Shan. This lake formed between 1988 and 1994 on the site of a retreated glacier in the upper part of the Aksay Valley. In this study we consider the possibility of an outburst of this pro-glacial lake in the future. The study involved bathymetry mapping of the lake, detailed profile sections of the valley, flow rate measurements on the Aksay river, and monitoring of the lake development using satellite images. Modelling of secondary debris flow inundation heights and hazard footprints has been undertaken. The outburst of this lake could cause powerful debris flows posing a threat to permanent residents living downstream, in the Ala-Archa Valley. Monitoring of the lake over the past ten years suggests certain changes in the runoff to the subsurface, and an increase in lake depth is observed. Glacial lakes with subsurface drainage are considered to be the most hazardous type as the knowledge of drainage channels functioning is still very limited and, thus, the timing of an outburst is hard to predict. Development of monitoring approaches to support forecasting of these hazards is of paramount importance to safety in mountain territories globally. Full article
Show Figures

Figure 1

20 pages, 4349 KiB  
Article
Effect of Land Use Land Cover and Climate Change on River Flow and Soil Loss in Didessa River Basin, South West Blue Nile, Ethiopia
by Kinati Chimdessa, Shoeb Quraishi, Asfaw Kebede and Tena Alamirew
Hydrology 2019, 6(1), 2; https://doi.org/10.3390/hydrology6010002 - 26 Dec 2018
Cited by 39 | Viewed by 8635
Abstract
In the Didessa river basin, which is found in Ethiopia, the human population number is increasing at an alarming rate. The conversion of forests, shrub and grasslands into cropland has increased in parallel with the population increase. The land use/land cover change (LULCC) [...] Read more.
In the Didessa river basin, which is found in Ethiopia, the human population number is increasing at an alarming rate. The conversion of forests, shrub and grasslands into cropland has increased in parallel with the population increase. The land use/land cover change (LULCC) that has been undertaken in the river basin combined with climate change may have affected the Didessa river flow and soil loss. Therefore, this study was designed to assess the impact of LULCC on the Didessa river flow and soil loss under historical and future climates. Land use/land cover (LULC) of the years 1986, 2001 and 2015 were independently combined with the historical climate to assess their individual impacts on river flow and soil loss. Further, the impact of future climates under Representative Concentration Pathways (RCP2.6, RCP4.5 and RCP8.5) scenarios on river flow and soil loss was assessed by combining the pathways with the 2015 LULC. A physically based Soil and Water Assessment Tool (SWAT2012) model in the ArcGIS 10.4.1 interface was used to realize the purpose. Results of the study revealed that LULCC that occurred between 1986 and 2015 resulted in increased average sediment yield by 20.9 t ha−1 yr−1. Climate change under RCP2.6, RCP4.5 and RCP8.5 combined with 2015 LULC increased annual average soil losses by 31.3, 50.9 and 83.5 t ha−1 yr−1 compared with the 2015 LULC under historical climate data. It was also found that 13.4%, 47.1% and 87.0% of the total area may experience high soil loss under RCP2.6, RCP4.5 and RCP8.5, respectively. Annual soil losses of five top-priority sub catchments range from 62.8 to 57.7 per hectare. Nash Stuncliffe Simulation efficiency (NSE) and R2 values during model calibration and validation indicated good agreement between observed and simulated values both for flow and sediment yield. Full article
Show Figures

Figure 1

22 pages, 3572 KiB  
Article
Estimating the Sediment Flux and Budget for a Data Limited Rift Valley Lake in Ethiopia
by Alemu O. Aga, Assefa M. Melesse and Bayou Chane
Hydrology 2019, 6(1), 1; https://doi.org/10.3390/hydrology6010001 - 23 Dec 2018
Cited by 38 | Viewed by 6988 | Correction
Abstract
Information on sediment concentration in rivers is important for the design and management of reservoirs. In this paper, river sediment flux and siltation rate of a rift valley lake basin (Lake Ziway, Ethiopia) was modeled using suspended sediment concentration (SSC) samples from four [...] Read more.
Information on sediment concentration in rivers is important for the design and management of reservoirs. In this paper, river sediment flux and siltation rate of a rift valley lake basin (Lake Ziway, Ethiopia) was modeled using suspended sediment concentration (SSC) samples from four rivers and lake outlet stations. Both linear and non-linear least squares log–log regression methods were used to develop the model. The best-fit model was tested and evaluated qualitatively by time-series plots, quantitatively by using watershed model evaluation statistics, and validated by calculating the prediction error. Sediment yield (SY) of ungauged rivers were assessed by developing and using a model that includes catchment area, slope, and rainfall, whereas bedload was estimated. As a result, the gross annual SY transported into the lake was 2.081 Mton/year. Annually, 0.178 Mton/year of sediment is deposited in floodplains with a sediment trapping rate of 20.6%, and 41,340 ton/year of sediment leaves the lake through the Bulbula River. The annual sediment deposition in the lake is 2.039 Mton/year with a mean sediment trapping efficiency of 98%. Based on the established sediment budget with average rainfall, the lake will lose its volume by 0.106% annually and the lifetime of Lake Ziway will be 947 years. The results show that the approach used can be replicated at other similar ungauged watersheds. As one of the most important sources of water for irrigation in the country, the results can be used for planning and implementing a lake basin management program targeting upstream soil erosion control. Full article
Show Figures

Figure 1

Previous Issue
Next Issue
Back to TopTop